Embed Size (px)
Citation preview
Ground Water Resources & Ground Water Seepage Study
WONDER CEMENT. LTD., BHATKOTARI, NEMBAHERA, CHITTOR, RAJ
1
CHAPTER - 1
EXECUTIVE SUMMARY
Project : Groundwater Resources Evaluation & Groundwater seepage
Due to mining activity
Promoters : M/S WONDER CEMENT LTD.
BHATKOTRI, NIMBAHERA, CHITTORGARH,
RAJASTHAN.
Conducted by : ASSOCIATE ENGINEERS & CONSULTANTS
JAIPUR
Investigation
Methodology :
Surface Hydro geological studies for mining lease area (Core Zone)
Surface Hydro geological studies for Buffer zone (10 Km radius).
Estimation of ground water Recharge & Discharge factors for both core and Buffer zone.
Estimation of ground water seepage in the mining pit at different stage of mining
Coverage: (a) 740.93 Hectares of mining lease (Core Zone)
(b) Approx. 10 Km radius (Buffer Zone)
Findings:
The regional water level ranges between 50m. to 60m. below ground level during the pre
monsoon period. Post monsoon water levels are 25m to 35m below ground level.
The water level in mining lease area is 40-45m bgl (410 to 405 MRL) in pre monsoon period
and 29-32m bgl (421 to 418 MRL) in post monsoon period.
Water level results indicates that there may be two sets of aquifer system in the area upper
aquifer and lower aquifer. Upper is not so productive aquifer and hold the seepage and
rainwater only in the monsoon and winter seasons and even during these seasons does not
support the production and only fulfil the domestic water requirement.
The lower aquifer is productive and often controlled by deep-seated fractures, which
generally occurs between a depth range of 100 to 150m depth. Also occurrence of fractures
Ground Water Resources & Ground Water Seepage Study
WONDER CEMENT. LTD., BHATKOTARI, NEMBAHERA, CHITTOR, RAJ
2
does not show any homogeneity due to the fact that most the mines having depth upto 50m in
nearby area has dry bottom conditions in the summer and winter seasons.
Based on results of hydrogeological survey conducted in the area, it appears that ground
water occurs in water table condition in weak zones of medium hard & hard rock. In the
investigated area, thickness of top soil is very less generally not more than 1metre in mining
lease area.
During this mining plan period, mine working is in two pits namely Pit-1 and Pit-2 average
ground level RL is 452 MRL. After 10 years (2021-22) both the pits will be connected.
Present working depth is 420 MRL hence presently no groundwater seepage. Similarly at the
end of 2017-18 mining will attain a depth of 420 MRL in both the pits hence there will be no
ground water seepage even at the end of present mining plan.
As per the calculations based on Darcy law in year 2021-22 (After 10 Years) groundwater
seepage works out to be 34.2 cum/day. In the year 2026-27 (after 15 years) it will be
58.3cum/day, in 2031-32 (After 20 Years) it will be 86.7 cum/day and at conceptual stage it
will be 306.2 cum/day.
For buffer zone (10 km radius) total recharge due to rainfall & irrigation return flow at
normal rainfall works out to be 41.32 mcm/annum. Total discharge works out to be 56.22
mcm/annum & stage of development is 136%.
Total gross dynamic reserves in the core zone have been estimated of the order of 0.88
mcm/annum.
The ground water development is much more in buffer zone due to irrigation and industrial
purpose. It results in buffer zone as overexploited.
After initiating the mining the area of core zone will be under safe category and will have
surplus exploitable ground water potential, indicates that mining activity will not affect
ground water recharge and its ground water resources. No stream was encountered during the
mining activity hence no diversion is required. This hardly affects surface water resources.
Similarly, as no stored water will be released directly to water streams of nearby areas,
possibilities of any siltation in natural streams and reduction of percolation is very less.
Ground Water Resources & Ground Water Seepage Study
WONDER CEMENT. LTD., BHATKOTARI, NEMBAHERA, CHITTOR, RAJ
3
With the passage of time accumulated rainwater in the mine pit will be used for the plant and
mine purpose it will decrease groundwater extraction. In order to win the ore it is therefore
essential to provide dry bottom conditions. This task will be achieved by pumping of water
from one pit to another pit so that lower most benches can be worked out in phased manner.
Due to hard, crystalline and chemically resistant nature of limestone the water stored in the
mining pit remains unpolluted and free from any toxic constituents. The overburden, mostly
composed of very less alluvial material also does not contribute any pollutants from its waste.
The waste dumps are located in such a way that there are no hindrances to flow of water
bodies and streams.
There is no possibility of any land subsidence due to heavy pumping or mining as the rocks
are hard, compact, impervious and crystalline, which can be stand of its own. Beside that
there is no heavy pumpage for ground water extraction.
To augment groundwater storage, some measures have already been taken by the
management. Four number rain water harvesting structures in mines lease area and
seven numbers in adjoining cement plant premises have been constructed on existing
borewell/open wells. Firstly, storm water runoff is being collected in the lower most
bench of mining pit and is being used for the plantation, dust suppression, cement
processing work, etc.
Recharge to ground water through 2 check bunds in seasonal nalas flowing across the cement
plant adjoining the mine area will be 784000 Cum.
*****
Ground Water Resources & Ground Water Seepage Study
WONDER CEMENT. LTD., BHATKOTARI, NEMBAHERA, CHITTOR, RAJ
4
CHAPTER - 2
SURFACE HYDROGEOLOGICAL &
HYDROLOGICAL INVESTIGATION
INTRODUCTION
M/S WONDER CEMENTS LTD., BHATKOTARI, NIMBAHERA, CHITTORGARH,
RAJASTHAN a unit of R.K. Marbles PVT. LTD, Our Limestone Mine (Ml No. – 22/07) Is
Situated Near Villages Bhatkotari, Lasravan, Phalwa And Rasulpura Tehsil Nimbahera Distt. –
Chittorgarh, Rajasthan.
Now The Company Decided For Expansion Of Limestone Production From 3.75 Mtpa To 9.10
Mtpa. The Area Falls Under Toposheet No. 45 L/6, 45 L/9 & 45 L /10, The Nearest Railway
Station Is Gambhiri Road (~ 4.5 Kms. In Ne Direction), And Nearest Airport Is Dabok (Udaipur)
Airport (~75 Kms. In W Direction).
This chapter comprises of the main objectives & the investigation methodology.
OBJECTIVES
Hydrological & Hydrogeological studies of the core & buffer zone for mine.
To assess groundwater resources of mine area.
To assess ground water seepage due to mining activity at different stages.
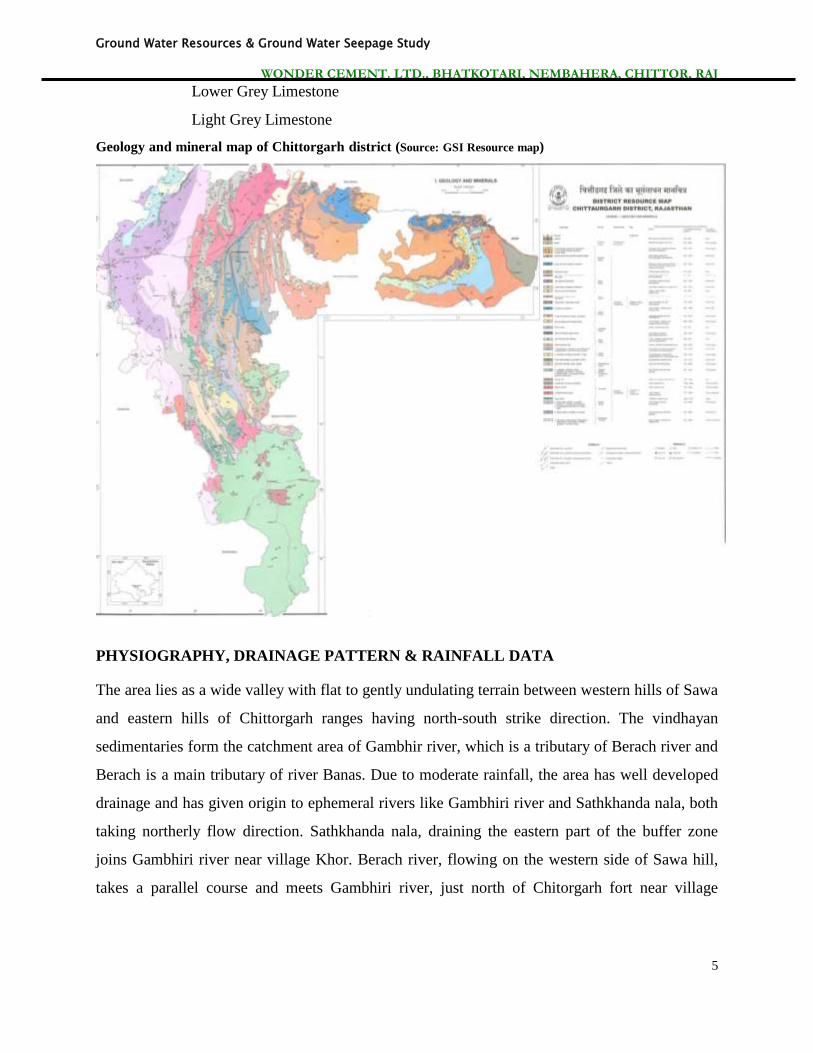
GEOLOGY OF THE AREA
In the mining lease area, rocks belonging to Nimbahera formation of Khorip group are exposed.
The deposit is moderately deformed showing folding & joints with following stratigraphic
sequence.
Overburden Soil Quaternary system
Weathered stone
Upper shale
Drak Grey Limestone.
Upper Grey Limestone
Pink Limestone Nimbahera formation, Khorip Group
Ground Water Resources & Ground Water Seepage Study
WONDER CEMENT. LTD., BHATKOTARI, NEMBAHERA, CHITTOR, RAJ
5
Lower Grey Limestone
Light Grey Limestone
Geology and mineral map of Chittorgarh district (Source: GSI Resource map)
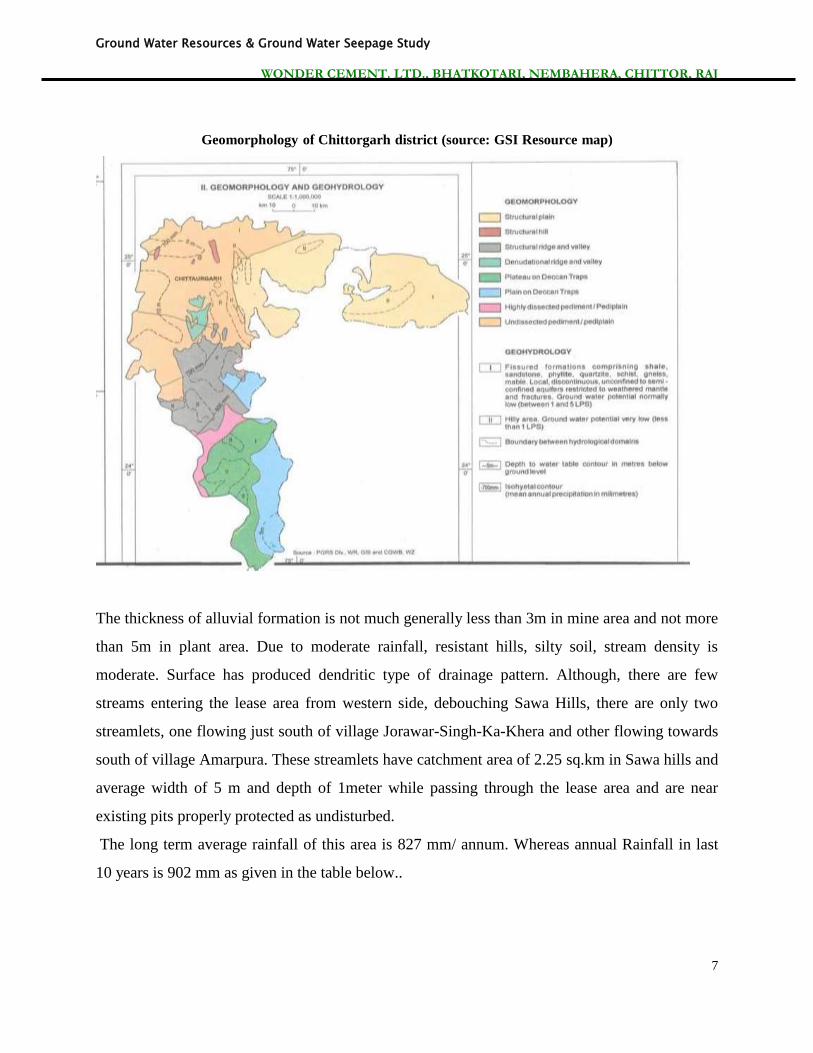
PHYSIOGRAPHY, DRAINAGE PATTERN & RAINFALL DATA
The area lies as a wide valley with flat to gently undulating terrain between western hills of Sawa
and eastern hills of Chittorgarh ranges having north-south strike direction. The vindhayan
sedimentaries form the catchment area of Gambhir river, which is a tributary of Berach river and
Berach is a main tributary of river Banas. Due to moderate rainfall, the area has well developed
drainage and has given origin to ephemeral rivers like Gambhiri river and Sathkhanda nala, both
taking northerly flow direction. Sathkhanda nala, draining the eastern part of the buffer zone
joins Gambhiri river near village Khor. Berach river, flowing on the western side of Sawa hill,
takes a parallel course and meets Gambhiri river, just north of Chitorgarh fort near village
Ground Water Resources & Ground Water Seepage Study
WONDER CEMENT. LTD., BHATKOTARI, NEMBAHERA, CHITTOR, RAJ
6
Bherda. Hills on the eastern side achieve heights upto 621m above sea level and have dense
reserved forest.
Two dams have been constructed on the wide flat valley. One dam on the Gambhiri river, just
outside the buffer zone, near village Arniya Joshi. It is a major irrigation project having a total
catchment area of 1036 Sq.km and live storage capacity of 65.1 mcm. Its command area is 11600
hactares, mostly in chittorgarh tehsil. There is another dam in the buffer zone constructed on the
Satkhanda nala, near village Murlia. It is a medium irrigation project having a catchment area of
111.4 Sq.. and live storage of 8.5 mcm and command area of 2412 hactares.
Gambhiri river Basin has a catchment area of 1225 sq.km mostly in Chittorgarh district. Its main
river Berach originates in the hills northeast of Udaipur city. It flows northeast for about 157 km
in Udaipur, Chittorgarh and Bhilwara district before joining the Banas near Bigod village in
Mandalgarh tehsil of Bhilwara district. Its main tributaries are Ayar, Wagli Wagon, Gambhiri
and Orai.
Out of total area of buffer zone, 245 sq.km happens to be part of the catchment area of river
Gambhiri. The river Gambhiri flows along the eastern boundary of the buffer zone and takes
northerly flow till it joins river Berach. It therefore flows over a length of 13 Km, just along the
eastern boundary in the buffer zone. Its another tributary Satkhanda nala taking a parallel course
on western side, having a flow length of 19km in the buffer zone and joins river Gambhiri near
village Khor. Satkhunda nala is about 5 km away from the mining & plant area and no where
making any contact with the excavations or influencing any present mining activity.
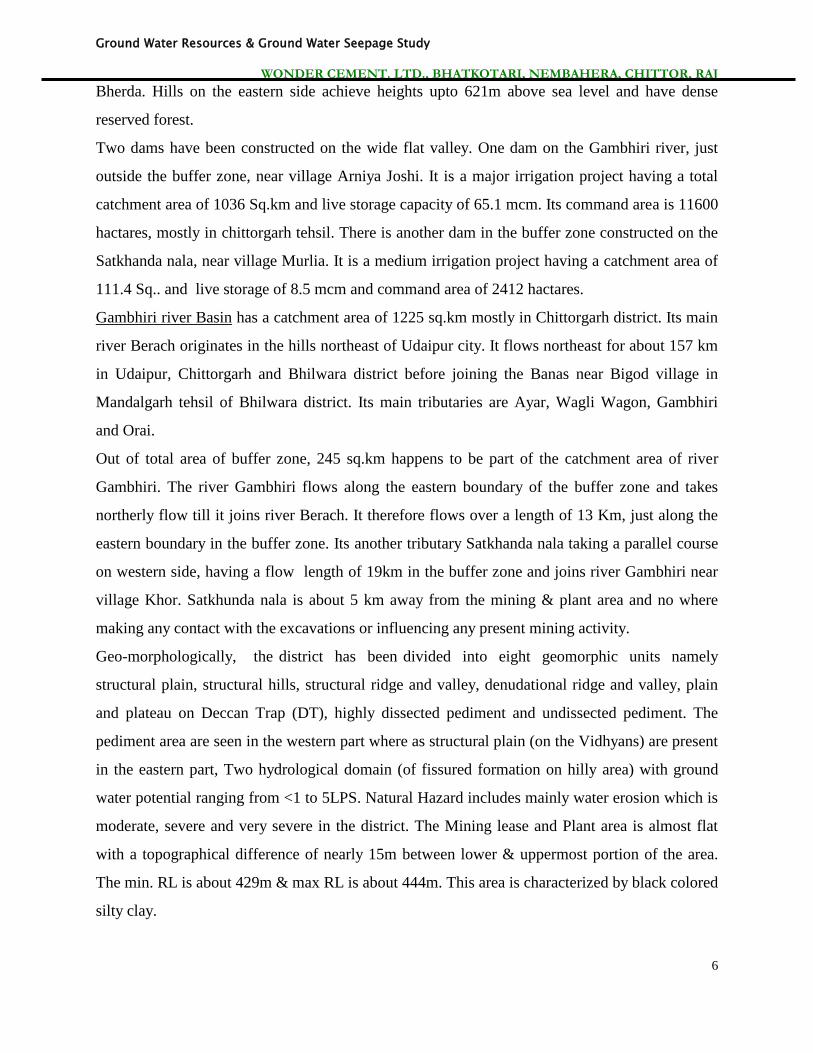
Geo-morphologically, the district has been divided into eight geomorphic units namely
structural plain, structural hills, structural ridge and valley, denudational ridge and valley, plain
and plateau on Deccan Trap (DT), highly dissected pediment and undissected pediment. The
pediment area are seen in the western part where as structural plain (on the Vidhyans) are present
in the eastern part, Two hydrological domain (of fissured formation on hilly area) with ground
water potential ranging from <1 to 5LPS. Natural Hazard includes mainly water erosion which is
moderate, severe and very severe in the district. The Mining lease and Plant area is almost flat
with a topographical difference of nearly 15m between lower & uppermost portion of the area.
The min. RL is about 429m & max RL is about 444m. This area is characterized by black colored
silty clay.
Ground Water Resources & Ground Water Seepage Study
WONDER CEMENT. LTD., BHATKOTARI, NEMBAHERA, CHITTOR, RAJ
7
Geomorphology of Chittorgarh district (source: GSI Resource map)
The thickness of alluvial formation is not much generally less than 3m in mine area and not more
than 5m in plant area. Due to moderate rainfall, resistant hills, silty soil, stream density is
moderate. Surface has produced dendritic type of drainage pattern. Although, there are few
streams entering the lease area from western side, debouching Sawa Hills, there are only two
streamlets, one flowing just south of village Jorawar-Singh-Ka-Khera and other flowing towards
south of village Amarpura. These streamlets have catchment area of 2.25 sq.km in Sawa hills and
average width of 5 m and depth of 1meter while passing through the lease area and are near
existing pits properly protected as undisturbed.
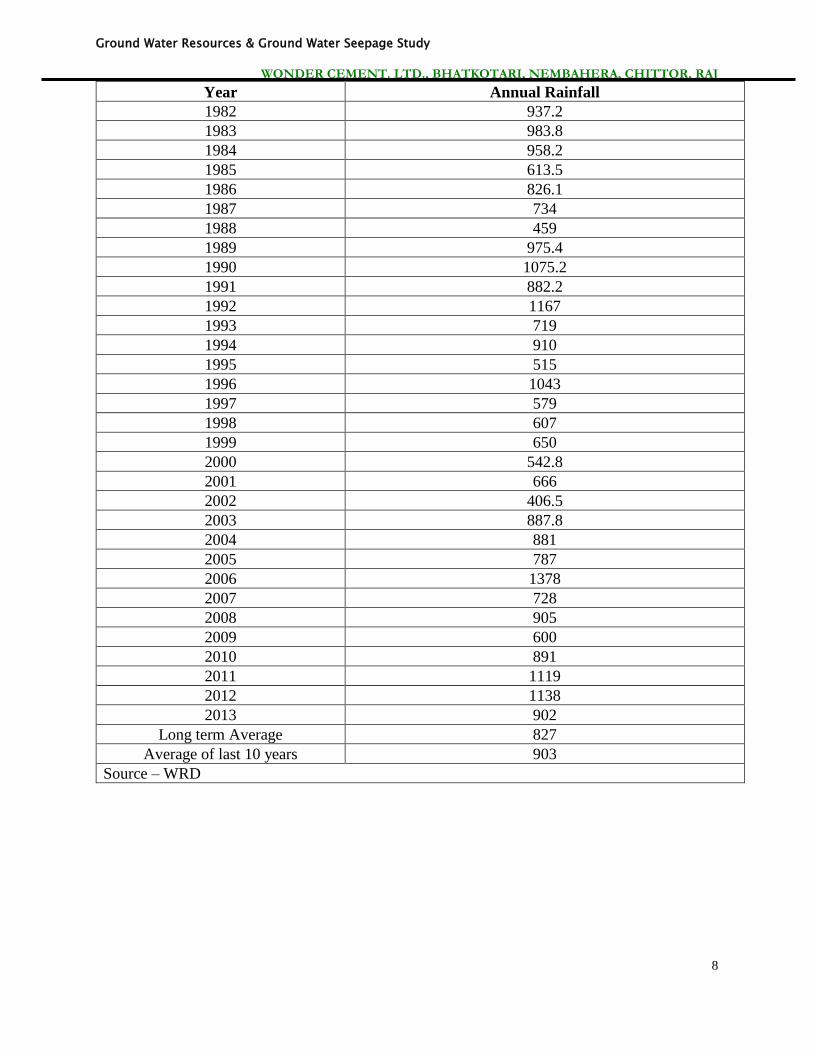
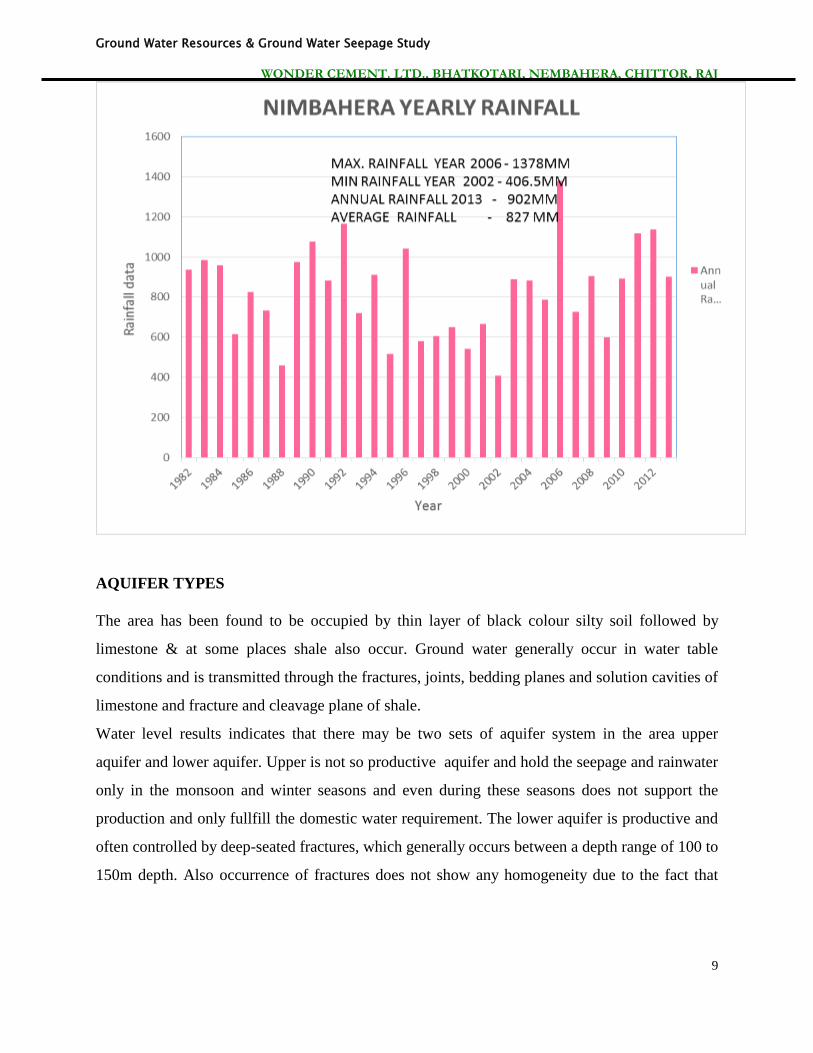
The long term average rainfall of this area is 827 mm/ annum. Whereas annual Rainfall in last
10 years is 902 mm as given in the table below..
Ground Water Resources & Ground Water Seepage Study
WONDER CEMENT. LTD., BHATKOTARI, NEMBAHERA, CHITTOR, RAJ
8
Year Annual Rainfall
1982 937.2
1983 983.8
1984 958.2
1985 613.5
1986 826.1
1987 734
1988 459
1989 975.4
1990 1075.2
1991 882.2
1992 1167
1993 719
1994 910
1995 515
1996 1043
1997 579
1998 607
1999 650
2000 542.8
2001 666
2002 406.5
2003 887.8
2004 881
2005 787
2006 1378
2007 728
2008 905
2009 600
2010 891
2011 1119
2012 1138
2013 902
Long term Average 827
Average of last 10 years 903
Source – WRD
Ground Water Resources & Ground Water Seepage Study
WONDER CEMENT. LTD., BHATKOTARI, NEMBAHERA, CHITTOR, RAJ
9
AQUIFER TYPES
The area has been found to be occupied by thin layer of black colour silty soil followed by
limestone & at some places shale also occur. Ground water generally occur in water table
conditions and is transmitted through the fractures, joints, bedding planes and solution cavities of
limestone and fracture and cleavage plane of shale.
Water level results indicates that there may be two sets of aquifer system in the area upper
aquifer and lower aquifer. Upper is not so productive aquifer and hold the seepage and rainwater
only in the monsoon and winter seasons and even during these seasons does not support the
production and only fullfill the domestic water requirement. The lower aquifer is productive and
often controlled by deep-seated fractures, which generally occurs between a depth range of 100 to
150m depth. Also occurrence of fractures does not show any homogeneity due to the fact that
Ground Water Resources & Ground Water Seepage Study
WONDER CEMENT. LTD., BHATKOTARI, NEMBAHERA, CHITTOR, RAJ
10
most the mines having depth upto 50m in nearby area has dry bottom conditions in the summer
and winter seasons.
YIELD POTENTIAL
There is one operating tube well exists in the mine lease area. They are normally 120 to 180m
depth having discharge between 300-500Cum/day. All of them are not operated simultaneously.
In the buffer zone the farmers having centrifugal pumps with 3 HP motors have operated wells
tapping limestone & shale. The yield of wells tapping limestone ranges from 100 to 150
cum/day. Yield of wells, tapping shales is low as compared to limestone due to its very low
hydraulic conductivity. Wells tapping shales have yield between 75 to 120Cum/day. Wells
located in limestone command area has more yields compared to wells in non command areas.
GROUND WATER MOVEMENT
In the investigated area the movement of ground water is governed mainly by secondary fractures
as limestone are impervious in nature and do not possess primary porosity. The alluvial thickness
is very low and remains unsaturated during major part of the year. The general land slope and
drainage in the area is towards north. The ground water flow follows the surface flow direction
and moves in the northern direction.
On the basis of hydrogeological data from open wells located in the valley area & water level
contour map it appears that ground water flow is in the north direction and general hydraulic
gradient is 2.58 m/km
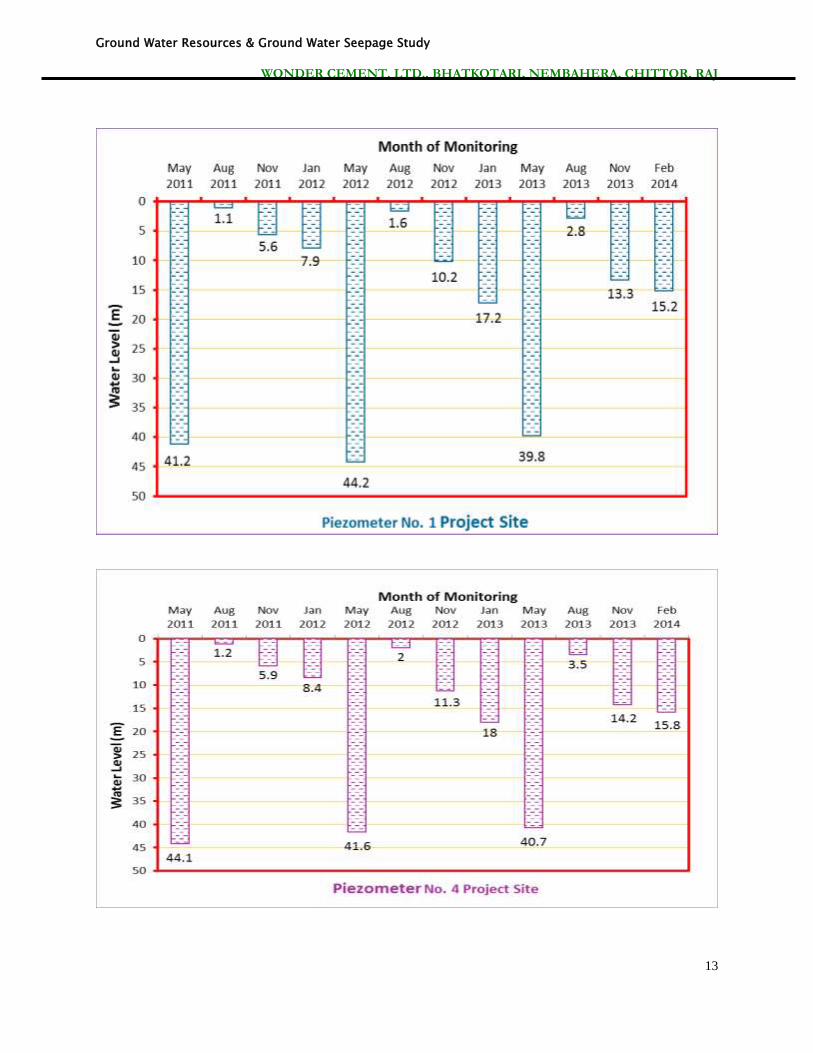
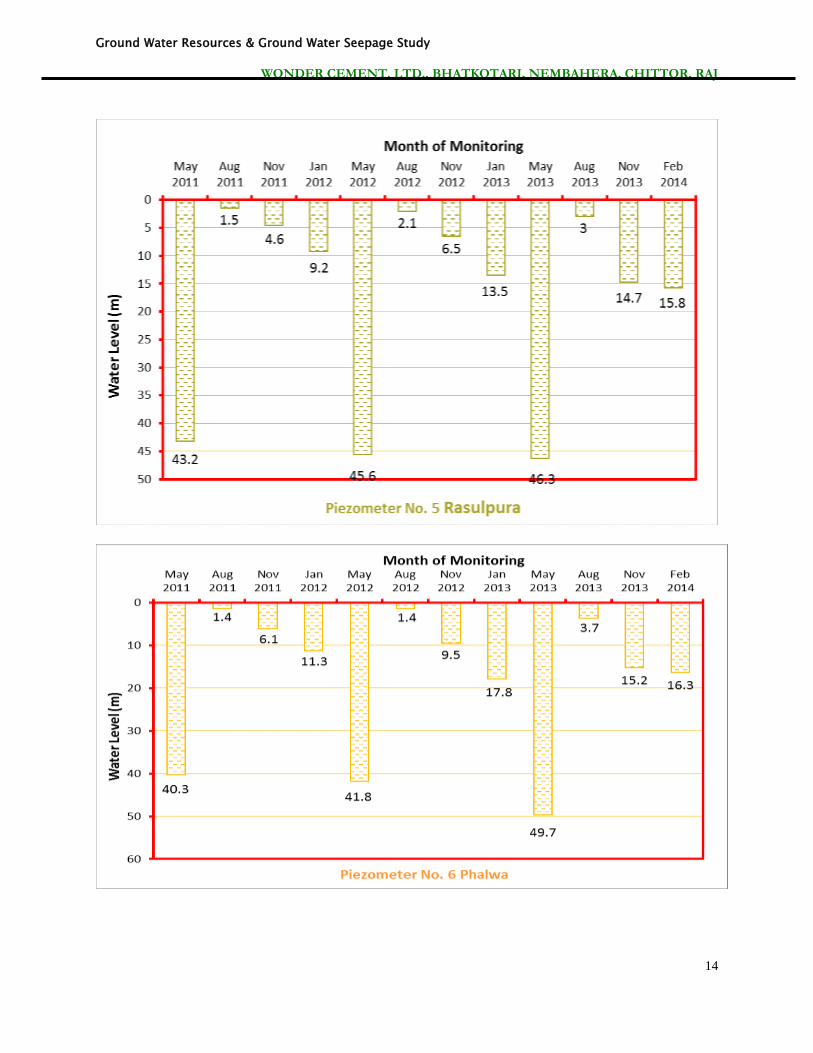
WATER LEVEL AND SEASONAL FLUCTUATION
The regional water level ranges between 50m. to 60m. Below ground level during the pre-
monsoon period. Post monsoon water levels are 30m to 35m below ground level. In mining lease
area is 40-45m bgl (410 to 405 MRL) in pre monsoon period and 29-32m bgl (421 to 418 MRL)
in post monsoon period.
STATIC GROUND WATER LEVEL MONITORING RESULTS (IN METERS)
Ground Water Resources & Ground Water Seepage Study
WONDER CEMENT. LTD., BHATKOTARI, NEMBAHERA, CHITTOR, RAJ
11
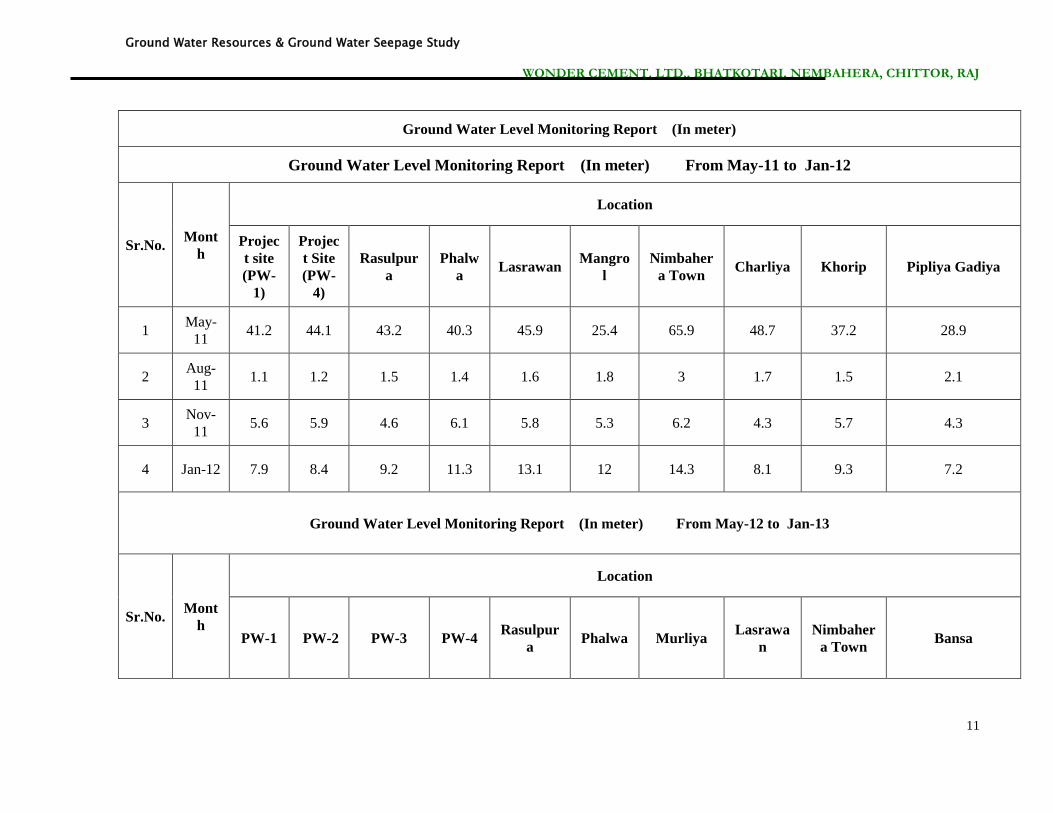
Ground Water Level Monitoring Report (In meter)
Ground Water Level Monitoring Report (In meter) From May-11 to Jan-12
Sr.No. Mont
h
Location
Projec
t site
(PW-
1)
Projec
t Site
(PW-
4)
Rasulpur
a
Phalw
a Lasrawan
Mangro
l
Nimbaher
a Town Charliya Khorip Pipliya Gadiya
1 May-
11 41.2 44.1 43.2 40.3 45.9 25.4 65.9 48.7 37.2 28.9
2 Aug-
11 1.1 1.2 1.5 1.4 1.6 1.8 3 1.7 1.5 2.1
3 Nov-
11 5.6 5.9 4.6 6.1 5.8 5.3 6.2 4.3 5.7 4.3
4 Jan-12 7.9 8.4 9.2 11.3 13.1 12 14.3 8.1 9.3 7.2
Ground Water Level Monitoring Report (In meter) From May-12 to Jan-13
Sr.No. Mont
h
Location
PW-1 PW-2 PW-3 PW-4 Rasulpur
a Phalwa Murliya
Lasrawa
n
Nimbaher
a Town Bansa
Ground Water Resources & Ground Water Seepage Study
WONDER CEMENT. LTD., BHATKOTARI, NEMBAHERA, CHITTOR, RAJ
12
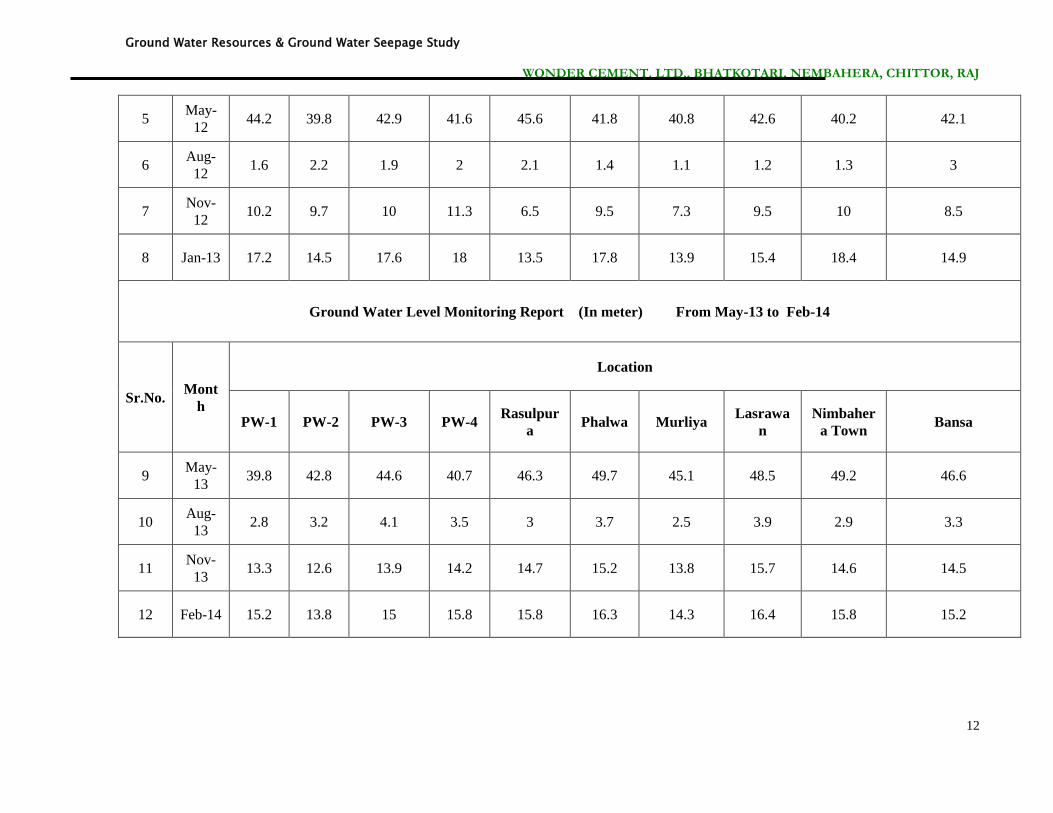
5 May-
12 44.2 39.8 42.9 41.6 45.6 41.8 40.8 42.6 40.2 42.1
6 Aug-
12 1.6 2.2 1.9 2 2.1 1.4 1.1 1.2 1.3 3
7 Nov-
12 10.2 9.7 10 11.3 6.5 9.5 7.3 9.5 10 8.5
8 Jan-13 17.2 14.5 17.6 18 13.5 17.8 13.9 15.4 18.4 14.9
Ground Water Level Monitoring Report (In meter) From May-13 to Feb-14
Sr.No. Mont
h
Location
PW-1 PW-2 PW-3 PW-4 Rasulpur
a Phalwa Murliya
Lasrawa
n
Nimbaher
a Town Bansa
9 May-
13 39.8 42.8 44.6 40.7 46.3 49.7 45.1 48.5 49.2 46.6
10 Aug-
13 2.8 3.2 4.1 3.5 3 3.7 2.5 3.9 2.9 3.3
11 Nov-
13 13.3 12.6 13.9 14.2 14.7 15.2 13.8 15.7 14.6 14.5
12 Feb-14 15.2 13.8 15 15.8 15.8 16.3 14.3 16.4 15.8 15.2
Ground Water Resources & Ground Water Seepage Study
WONDER CEMENT. LTD., BHATKOTARI, NEMBAHERA, CHITTOR, RAJ
13
Ground Water Resources & Ground Water Seepage Study
WONDER CEMENT. LTD., BHATKOTARI, NEMBAHERA, CHITTOR, RAJ
14

Ground Water Resources & Ground Water Seepage Study
WONDER CEMENT. LTD., BHATKOTARI, NEMBAHERA, CHITTOR, RAJ
15
Ground Water Resources & Ground Water Seepage Study
WONDER CEMENT. LTD., BHATKOTARI, NEMBAHERA, CHITTOR, RAJ
16
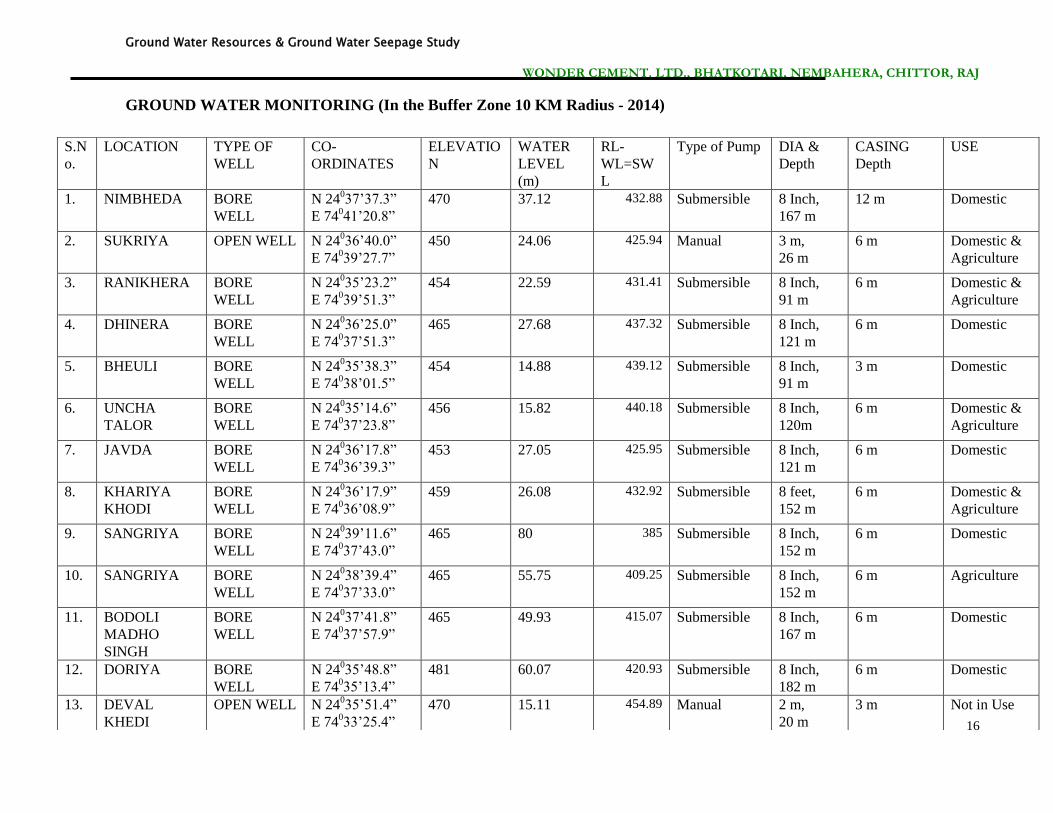
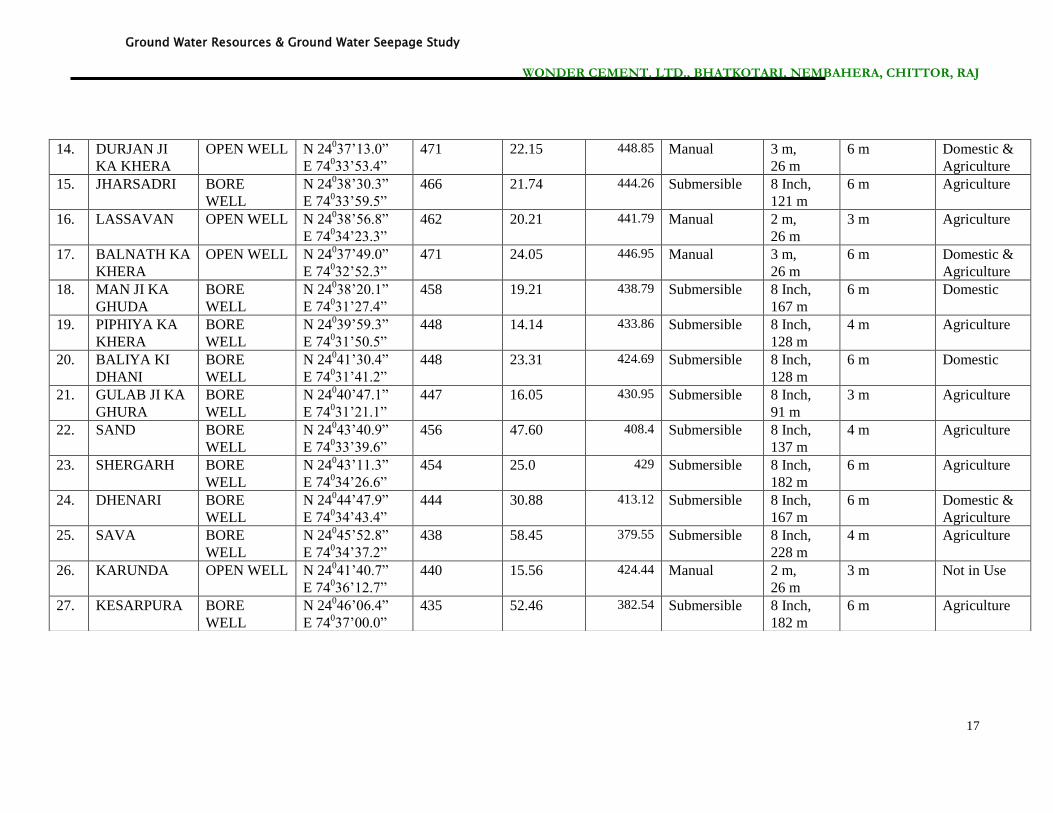
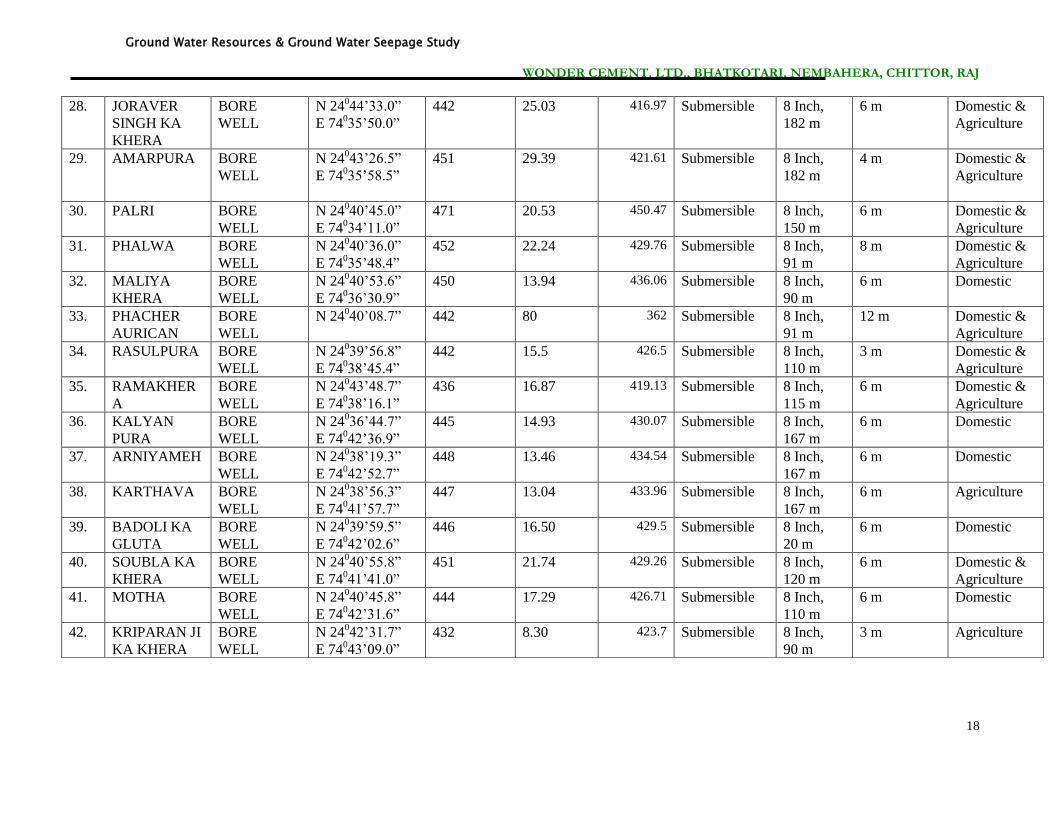
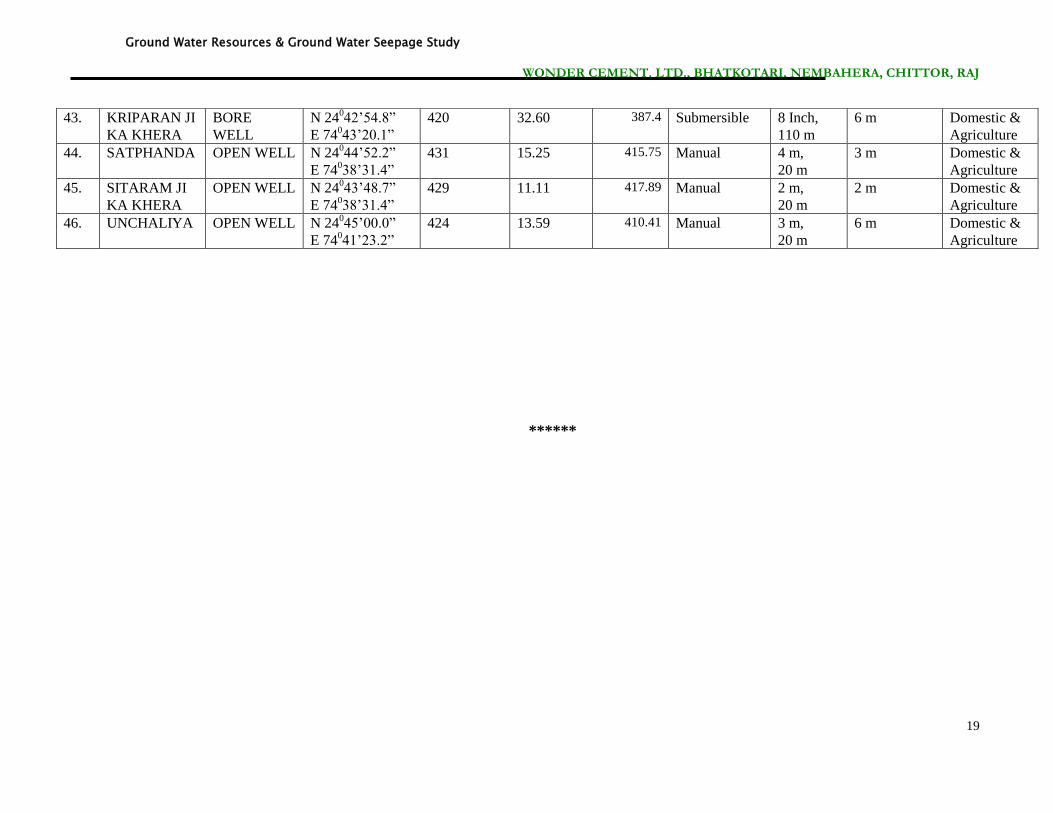
GROUND WATER MONITORING (In the Buffer Zone 10 KM Radius - 2014)
S.N
o.
LOCATION TYPE OF
WELL
CO-
ORDINATES
ELEVATIO
N
WATER
LEVEL
(m)
RL-
WL=SW
L
Type of Pump DIA &
Depth
CASING
Depth
USE
1. NIMBHEDA BORE
WELL
N 24037’37.3”
E 74041’20.8”
470 37.12 432.88 Submersible 8 Inch,
167 m
12 m Domestic
2. SUKRIYA OPEN WELL N 24036’40.0”
E 74039’27.7”
450 24.06 425.94 Manual 3 m,
26 m
6 m Domestic &
Agriculture
3. RANIKHERA BORE
WELL
N 24035’23.2”
E 74039’51.3”
454 22.59 431.41 Submersible 8 Inch,
91 m
6 m Domestic &
Agriculture
4. DHINERA BORE
WELL
N 24036’25.0”
E 74037’51.3”
465 27.68 437.32 Submersible 8 Inch,
121 m
6 m Domestic
5. BHEULI BORE
WELL
N 24035’38.3”
E 74038’01.5”
454 14.88 439.12 Submersible 8 Inch,
91 m
3 m Domestic
6. UNCHA
TALOR
BORE
WELL
N 24035’14.6”
E 74037’23.8”
456 15.82 440.18 Submersible 8 Inch,
120m
6 m Domestic &
Agriculture
7. JAVDA BORE
WELL
N 24036’17.8”
E 74036’39.3”
453 27.05 425.95 Submersible 8 Inch,
121 m
6 m Domestic
8. KHARIYA
KHODI
BORE
WELL
N 24036’17.9”
E 74036’08.9”
459 26.08 432.92 Submersible 8 feet,
152 m
6 m Domestic &
Agriculture
9. SANGRIYA BORE
WELL
N 24039’11.6”
E 74037’43.0”
465 80 385 Submersible 8 Inch,
152 m
6 m Domestic
10. SANGRIYA BORE
WELL
N 24038’39.4”
E 74037’33.0”
465 55.75 409.25 Submersible 8 Inch,
152 m
6 m Agriculture
11. BODOLI
MADHO
SINGH
BORE
WELL
N 24037’41.8”
E 74037’57.9”
465 49.93 415.07 Submersible 8 Inch,
167 m
6 m Domestic
12. DORIYA BORE
WELL
N 24035’48.8”
E 74035’13.4”
481 60.07 420.93 Submersible 8 Inch,
182 m
6 m Domestic
13. DEVAL
KHEDI
OPEN WELL N 24035’51.4”
E 74033’25.4”
470 15.11 454.89 Manual 2 m,
20 m
3 m Not in Use
Ground Water Resources & Ground Water Seepage Study
WONDER CEMENT. LTD., BHATKOTARI, NEMBAHERA, CHITTOR, RAJ
17
14. DURJAN JI
KA KHERA
OPEN WELL N 24037’13.0”
E 74033’53.4”
471 22.15 448.85 Manual 3 m,
26 m
6 m Domestic &
Agriculture
15. JHARSADRI BORE
WELL
N 24038’30.3”
E 74033’59.5”
466 21.74 444.26 Submersible 8 Inch,
121 m
6 m Agriculture
16. LASSAVAN OPEN WELL N 24038’56.8”
E 74034’23.3”
462 20.21 441.79 Manual 2 m,
26 m
3 m Agriculture
17. BALNATH KA
KHERA
OPEN WELL N 24037’49.0”
E 74032’52.3”
471 24.05 446.95 Manual 3 m,
26 m
6 m Domestic &
Agriculture
18. MAN JI KA
GHUDA
BORE
WELL
N 24038’20.1”
E 74031’27.4”
458 19.21 438.79 Submersible 8 Inch,
167 m
6 m Domestic
19. PIPHIYA KA
KHERA
BORE
WELL
N 24039’59.3”
E 74031’50.5”
448 14.14 433.86 Submersible 8 Inch,
128 m
4 m Agriculture
20. BALIYA KI
DHANI
BORE
WELL
N 24041’30.4”
E 74031’41.2”
448 23.31 424.69 Submersible 8 Inch,
128 m
6 m Domestic
21. GULAB JI KA
GHURA
BORE
WELL
N 24040’47.1”
E 74031’21.1”
447 16.05 430.95 Submersible 8 Inch,
91 m
3 m Agriculture
22. SAND BORE
WELL
N 24043’40.9”
E 74033’39.6”
456 47.60 408.4 Submersible 8 Inch,
137 m
4 m Agriculture
23. SHERGARH BORE
WELL
N 24043’11.3”
E 74034’26.6”
454 25.0 429 Submersible 8 Inch,
182 m
6 m Agriculture
24. DHENARI BORE
WELL
N 24044’47.9”
E 74034’43.4”
444 30.88 413.12 Submersible 8 Inch,
167 m
6 m Domestic &
Agriculture
25. SAVA BORE
WELL
N 24045’52.8”
E 74034’37.2”
438 58.45 379.55 Submersible 8 Inch,
228 m
4 m Agriculture
26. KARUNDA OPEN WELL N 24041’40.7”
E 74036’12.7”
440 15.56 424.44 Manual 2 m,
26 m
3 m Not in Use
27. KESARPURA BORE
WELL
N 24046’06.4”
E 74037’00.0”
435 52.46 382.54 Submersible 8 Inch,
182 m
6 m Agriculture
Ground Water Resources & Ground Water Seepage Study
WONDER CEMENT. LTD., BHATKOTARI, NEMBAHERA, CHITTOR, RAJ
18
28. JORAVER
SINGH KA
KHERA
BORE
WELL
N 24044’33.0”
E 74035’50.0”
442 25.03 416.97 Submersible 8 Inch,
182 m
6 m Domestic &
Agriculture
29. AMARPURA BORE
WELL
N 24043’26.5”
E 74035’58.5”
451 29.39 421.61 Submersible 8 Inch,
182 m
4 m Domestic &
Agriculture
30. PALRI BORE
WELL
N 24040’45.0”
E 74034’11.0”
471 20.53 450.47 Submersible 8 Inch,
150 m
6 m Domestic &
Agriculture
31. PHALWA BORE
WELL
N 24040’36.0”
E 74035’48.4”
452 22.24 429.76 Submersible 8 Inch,
91 m
8 m Domestic &
Agriculture
32. MALIYA
KHERA
BORE
WELL
N 24040’53.6”
E 74036’30.9”
450 13.94 436.06 Submersible 8 Inch,
90 m
6 m Domestic
33. PHACHER
AURICAN
BORE
WELL
N 24040’08.7”
442 80 362 Submersible 8 Inch,
91 m
12 m Domestic &
Agriculture
34. RASULPURA BORE
WELL
N 24039’56.8”
E 74038’45.4”
442 15.5 426.5 Submersible 8 Inch,
110 m
3 m Domestic &
Agriculture
35. RAMAKHER
A
BORE
WELL
N 24043’48.7”
E 74038’16.1”
436 16.87 419.13 Submersible 8 Inch,
115 m
6 m Domestic &
Agriculture
36. KALYAN
PURA
BORE
WELL
N 24036’44.7”
E 74042’36.9”
445 14.93 430.07 Submersible 8 Inch,
167 m
6 m Domestic
37. ARNIYAMEH BORE
WELL
N 24038’19.3”
E 74042’52.7”
448 13.46 434.54 Submersible 8 Inch,
167 m
6 m Domestic
38. KARTHAVA BORE
WELL
N 24038’56.3”
E 74041’57.7”
447 13.04 433.96 Submersible 8 Inch,
167 m
6 m Agriculture
39. BADOLI KA
GLUTA
BORE
WELL
N 24039’59.5”
E 74042’02.6”
446 16.50 429.5 Submersible 8 Inch,
20 m
6 m Domestic
40. SOUBLA KA
KHERA
BORE
WELL
N 24040’55.8”
E 74041’41.0”
451 21.74 429.26 Submersible 8 Inch,
120 m
6 m Domestic &
Agriculture
41. MOTHA BORE
WELL
N 24040’45.8”
E 74042’31.6”
444 17.29 426.71 Submersible 8 Inch,
110 m
6 m Domestic
42. KRIPARAN JI
KA KHERA
BORE
WELL
N 24042’31.7”
E 74043’09.0”
432 8.30 423.7 Submersible 8 Inch,
90 m
3 m Agriculture
Ground Water Resources & Ground Water Seepage Study
WONDER CEMENT. LTD., BHATKOTARI, NEMBAHERA, CHITTOR, RAJ
19
******
43. KRIPARAN JI
KA KHERA
BORE
WELL
N 24042’54.8”
E 74043’20.1”
420 32.60 387.4 Submersible 8 Inch,
110 m
6 m Domestic &
Agriculture
44. SATPHANDA OPEN WELL N 24044’52.2”
E 74038’31.4”
431 15.25 415.75 Manual 4 m,
20 m
3 m Domestic &
Agriculture
45. SITARAM JI
KA KHERA
OPEN WELL N 24043’48.7”
E 74038’31.4”
429 11.11 417.89 Manual 2 m,
20 m
2 m Domestic &
Agriculture
46. UNCHALIYA OPEN WELL N 24045’00.0”
E 74041’23.2”
424 13.59 410.41 Manual 3 m,
20 m
6 m Domestic &
Agriculture
Ground Water Resources & Ground Water Seepage Study
WONDER CEMENT. LTD., BHATKOTARI, NEMBAHERA, CHITTOR, RAJ
20
CHAPTER - 3
GROUND WATER RESOURCES
EVALUATION
AND
IMPACT OF MINING ON WATER REGIME
Ground water resources of an area can be distinguished under two categories:-
1. Dynamic ground water resources
2. Static ground water resources
DYNAMIC GROUND WATER RESOURCES
Dynamic ground water is that amount of water, which is found in the natural zone of fluctuation
in an aquifer due to ground water recharge. Total ground water recharge (RT ) of the area can be
estimated by assessing the various components of the following equation: -
RT = Rr+ Rs+ RI+ Sr+ Rc - - - - - - - - - - - - - - - (I)
Where,
Rr = Recharge from Rainfall.
Rs = Recharge from Irrigation due to surface water.
RI = Recharge from Irrigation due to ground water.
SI = Recharge through surface water bodies.
Rc = Recharge to confined aquifers.
GROUND WATER RESOURCES IN THE CORE ZONE
MINING LEASE AREA
The mining lease area covers 7.4093 Sq.km. and WCL has already acquired. The main source of
ground water recharge is recharge due to rainfall by direct percolation and due to return flow
from applied irrigation.
Ground Water Resources & Ground Water Seepage Study
WONDER CEMENT. LTD., BHATKOTARI, NEMBAHERA, CHITTOR, RAJ
21
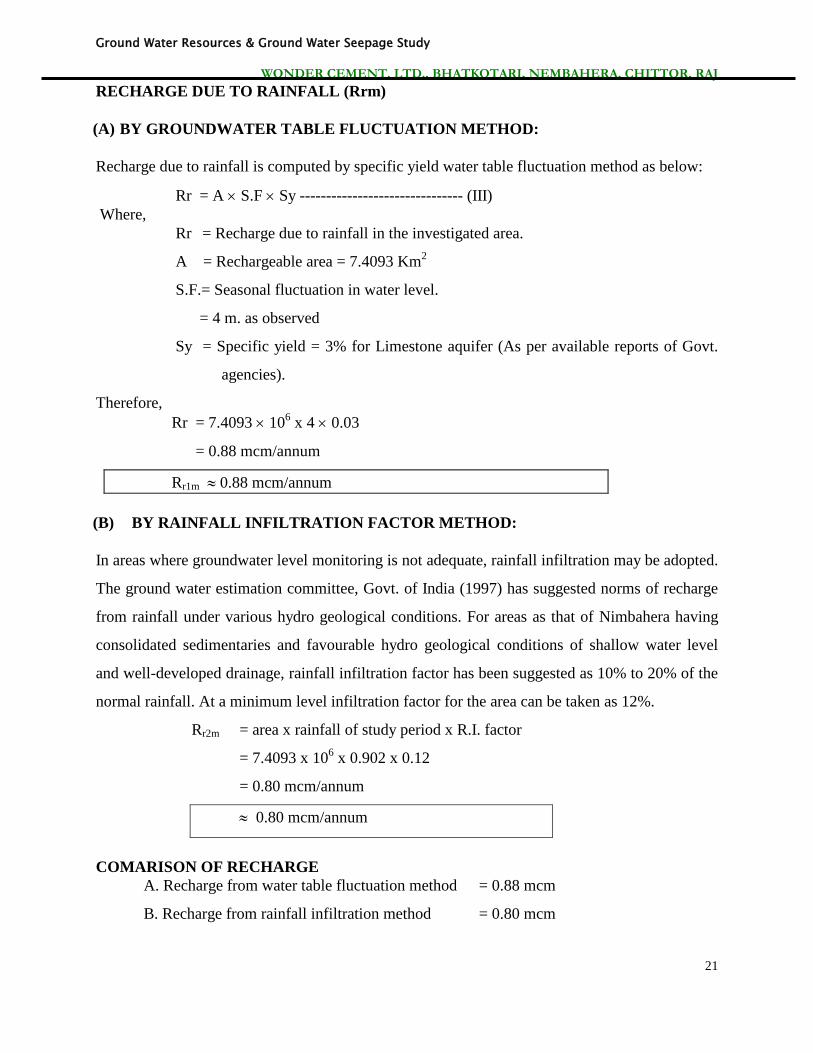
RECHARGE DUE TO RAINFALL (Rrm)
(A) BY GROUNDWATER TABLE FLUCTUATION METHOD:
Recharge due to rainfall is computed by specific yield water table fluctuation method as below:
Rr = A S.F Sy ------------------------------- (III)
Where,
Rr = Recharge due to rainfall in the investigated area.
A = Rechargeable area = 7.4093 Km2
S.F.= Seasonal fluctuation in water level.
= 4 m. as observed
Sy = Specific yield = 3% for Limestone aquifer (As per available reports of Govt.
agencies).
Therefore,
Rr = 7.4093 106 x 4 0.03
= 0.88 mcm/annum
Rr1m 0.88 mcm/annum
(B) BY RAINFALL INFILTRATION FACTOR METHOD:
In areas where groundwater level monitoring is not adequate, rainfall infiltration may be adopted.
The ground water estimation committee, Govt. of India (1997) has suggested norms of recharge
from rainfall under various hydro geological conditions. For areas as that of Nimbahera having
consolidated sedimentaries and favourable hydro geological conditions of shallow water level
and well-developed drainage, rainfall infiltration factor has been suggested as 10% to 20% of the
normal rainfall. At a minimum level infiltration factor for the area can be taken as 12%.
Rr2m = area x rainfall of study period x R.I. factor
= 7.4093 x 106 x 0.902 x 0.12
= 0.80 mcm/annum
0.80 mcm/annum
COMARISON OF RECHARGE
A. Recharge from water table fluctuation method = 0.88 mcm
B. Recharge from rainfall infiltration method = 0.80 mcm
Ground Water Resources & Ground Water Seepage Study
WONDER CEMENT. LTD., BHATKOTARI, NEMBAHERA, CHITTOR, RAJ
22
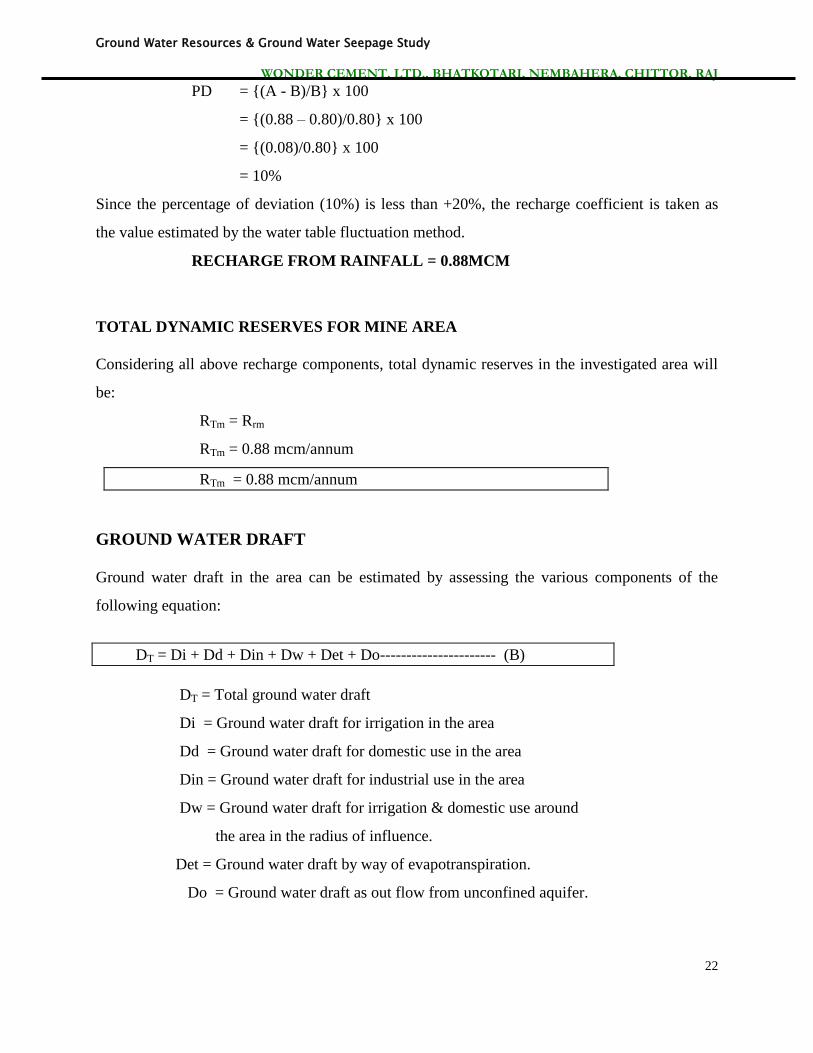
PD = {(A - B)/B} x 100
= {(0.88 – 0.80)/0.80} x 100
= {(0.08)/0.80} x 100
= 10%
Since the percentage of deviation (10%) is less than +20%, the recharge coefficient is taken as
the value estimated by the water table fluctuation method.
RECHARGE FROM RAINFALL = 0.88MCM
TOTAL DYNAMIC RESERVES FOR MINE AREA
Considering all above recharge components, total dynamic reserves in the investigated area will
be:
RTm = Rrm
RTm = 0.88 mcm/annum
RTm = 0.88 mcm/annum
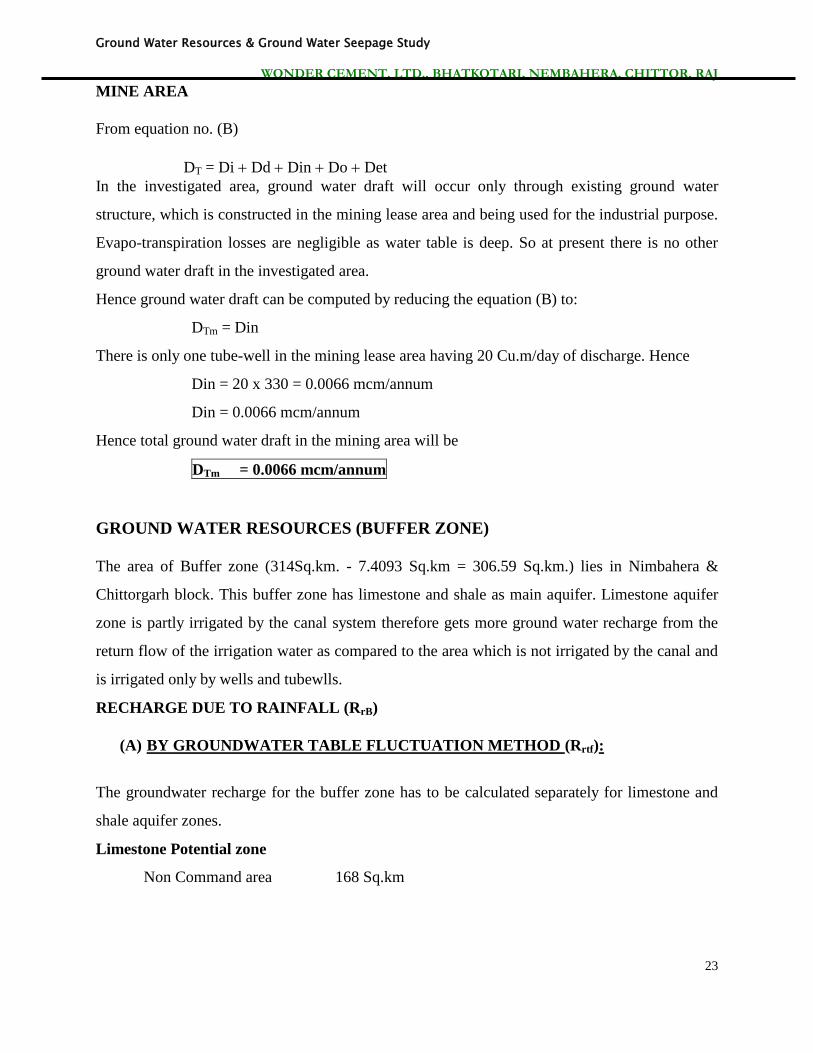
GROUND WATER DRAFT
Ground water draft in the area can be estimated by assessing the various components of the
following equation:
DT = Di + Dd + Din + Dw + Det + Do---------------------- (B)
DT = Total ground water draft
Di = Ground water draft for irrigation in the area
Dd = Ground water draft for domestic use in the area
Din = Ground water draft for industrial use in the area
Dw = Ground water draft for irrigation & domestic use around
the area in the radius of influence.
Det = Ground water draft by way of evapotranspiration.
Do = Ground water draft as out flow from unconfined aquifer.
Ground Water Resources & Ground Water Seepage Study
WONDER CEMENT. LTD., BHATKOTARI, NEMBAHERA, CHITTOR, RAJ
23
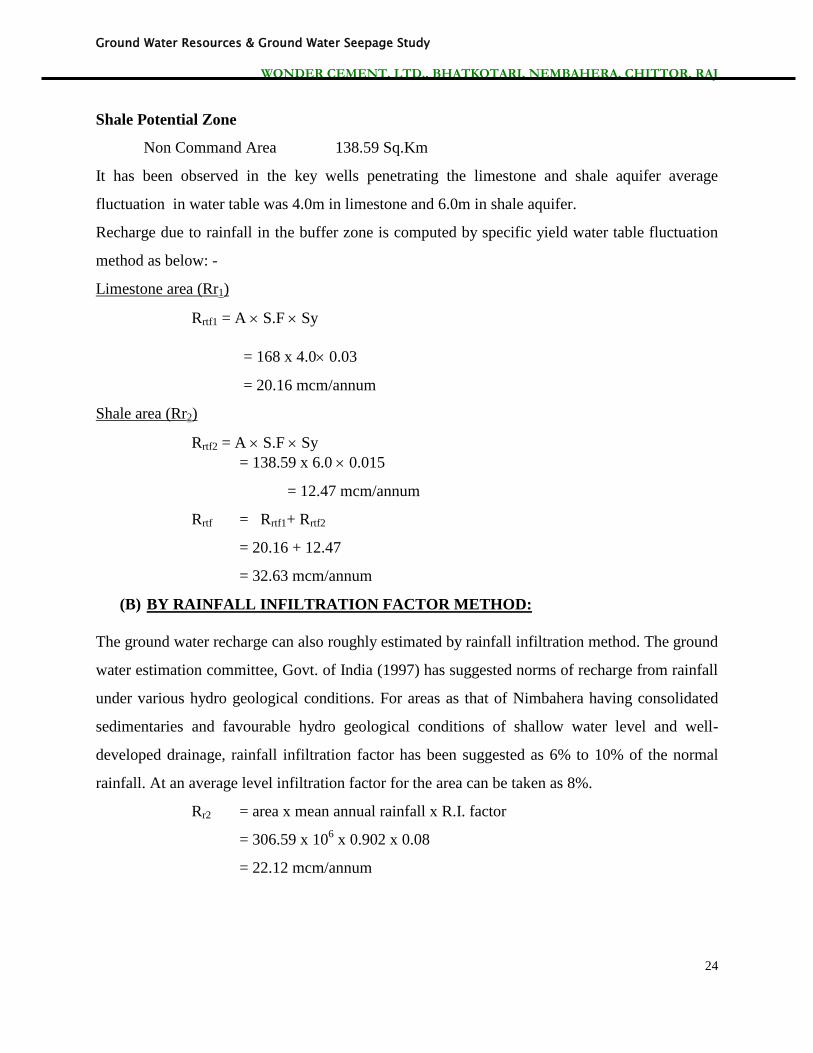
MINE AREA
From equation no. (B)
DT = Di Dd Din Do Det
In the investigated area, ground water draft will occur only through existing ground water
structure, which is constructed in the mining lease area and being used for the industrial purpose.
Evapo-transpiration losses are negligible as water table is deep. So at present there is no other
ground water draft in the investigated area.
Hence ground water draft can be computed by reducing the equation (B) to:
DTm = Din
There is only one tube-well in the mining lease area having 20 Cu.m/day of discharge. Hence
Din = 20 x 330 = 0.0066 mcm/annum
Din = 0.0066 mcm/annum
Hence total ground water draft in the mining area will be
DTm = 0.0066 mcm/annum
GROUND WATER RESOURCES (BUFFER ZONE)
The area of Buffer zone (314Sq.km. - 7.4093 Sq.km = 306.59 Sq.km.) lies in Nimbahera &
Chittorgarh block. This buffer zone has limestone and shale as main aquifer. Limestone aquifer
zone is partly irrigated by the canal system therefore gets more ground water recharge from the
return flow of the irrigation water as compared to the area which is not irrigated by the canal and
is irrigated only by wells and tubewlls.
RECHARGE DUE TO RAINFALL (RrB)
(A) BY GROUNDWATER TABLE FLUCTUATION METHOD (Rrtf):
The groundwater recharge for the buffer zone has to be calculated separately for limestone and
shale aquifer zones.
Limestone Potential zone
Non Command area 168 Sq.km
Ground Water Resources & Ground Water Seepage Study
WONDER CEMENT. LTD., BHATKOTARI, NEMBAHERA, CHITTOR, RAJ
24
Shale Potential Zone
Non Command Area 138.59 Sq.Km
It has been observed in the key wells penetrating the limestone and shale aquifer average
fluctuation in water table was 4.0m in limestone and 6.0m in shale aquifer.
Recharge due to rainfall in the buffer zone is computed by specific yield water table fluctuation
method as below: -
Limestone area (Rr1)
Rrtf1 = A S.F Sy
= 168 x 4.0 0.03
= 20.16 mcm/annum
Shale area (Rr2)
Rrtf2 = A S.F Sy
= 138.59 x 6.0 0.015
= 12.47 mcm/annum
Rrtf = Rrtf1+ Rrtf2
= 20.16 + 12.47
= 32.63 mcm/annum
(B) BY RAINFALL INFILTRATION FACTOR METHOD:
The ground water recharge can also roughly estimated by rainfall infiltration method. The ground
water estimation committee, Govt. of India (1997) has suggested norms of recharge from rainfall
under various hydro geological conditions. For areas as that of Nimbahera having consolidated
sedimentaries and favourable hydro geological conditions of shallow water level and well-
developed drainage, rainfall infiltration factor has been suggested as 6% to 10% of the normal
rainfall. At an average level infiltration factor for the area can be taken as 8%.
Rr2 = area x mean annual rainfall x R.I. factor
= 306.59 x 106 x 0.902 x 0.08
= 22.12 mcm/annum
Ground Water Resources & Ground Water Seepage Study
WONDER CEMENT. LTD., BHATKOTARI, NEMBAHERA, CHITTOR, RAJ
25
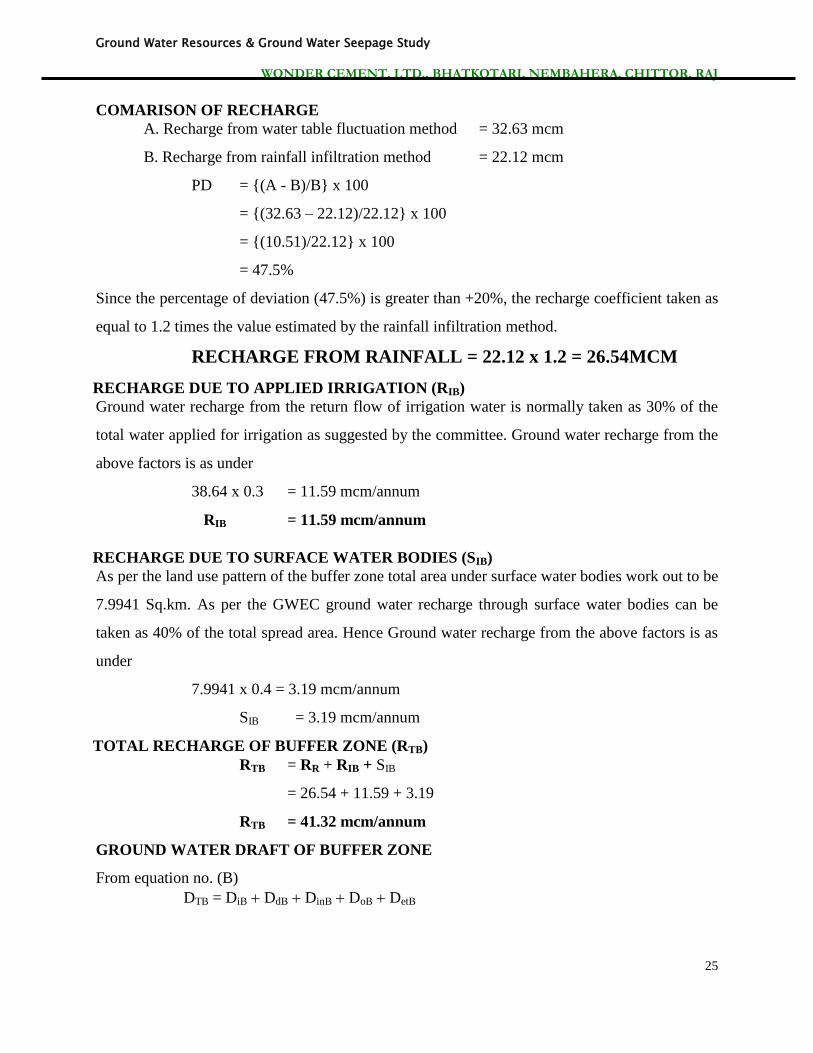
COMARISON OF RECHARGE
A. Recharge from water table fluctuation method = 32.63 mcm
B. Recharge from rainfall infiltration method = 22.12 mcm
PD = {(A - B)/B} x 100
= {(32.63 – 22.12)/22.12} x 100
= {(10.51)/22.12} x 100
= 47.5%
Since the percentage of deviation (47.5%) is greater than +20%, the recharge coefficient taken as
equal to 1.2 times the value estimated by the rainfall infiltration method.
RECHARGE FROM RAINFALL = 22.12 x 1.2 = 26.54MCM
RECHARGE DUE TO APPLIED IRRIGATION (RIB)
Ground water recharge from the return flow of irrigation water is normally taken as 30% of the
total water applied for irrigation as suggested by the committee. Ground water recharge from the
above factors is as under
38.64 x 0.3 = 11.59 mcm/annum
RIB = 11.59 mcm/annum
RECHARGE DUE TO SURFACE WATER BODIES (SIB)
As per the land use pattern of the buffer zone total area under surface water bodies work out to be
7.9941 Sq.km. As per the GWEC ground water recharge through surface water bodies can be
taken as 40% of the total spread area. Hence Ground water recharge from the above factors is as
under
7.9941 x 0.4 = 3.19 mcm/annum
SIB = 3.19 mcm/annum
TOTAL RECHARGE OF BUFFER ZONE (RTB)
RTB = RR + RIB + SIB
= 26.54 + 11.59 + 3.19
RTB = 41.32 mcm/annum
GROUND WATER DRAFT OF BUFFER ZONE
From equation no. (B)
DTB = DiB DdB DinB DoB DetB
Ground Water Resources & Ground Water Seepage Study
WONDER CEMENT. LTD., BHATKOTARI, NEMBAHERA, CHITTOR, RAJ
26
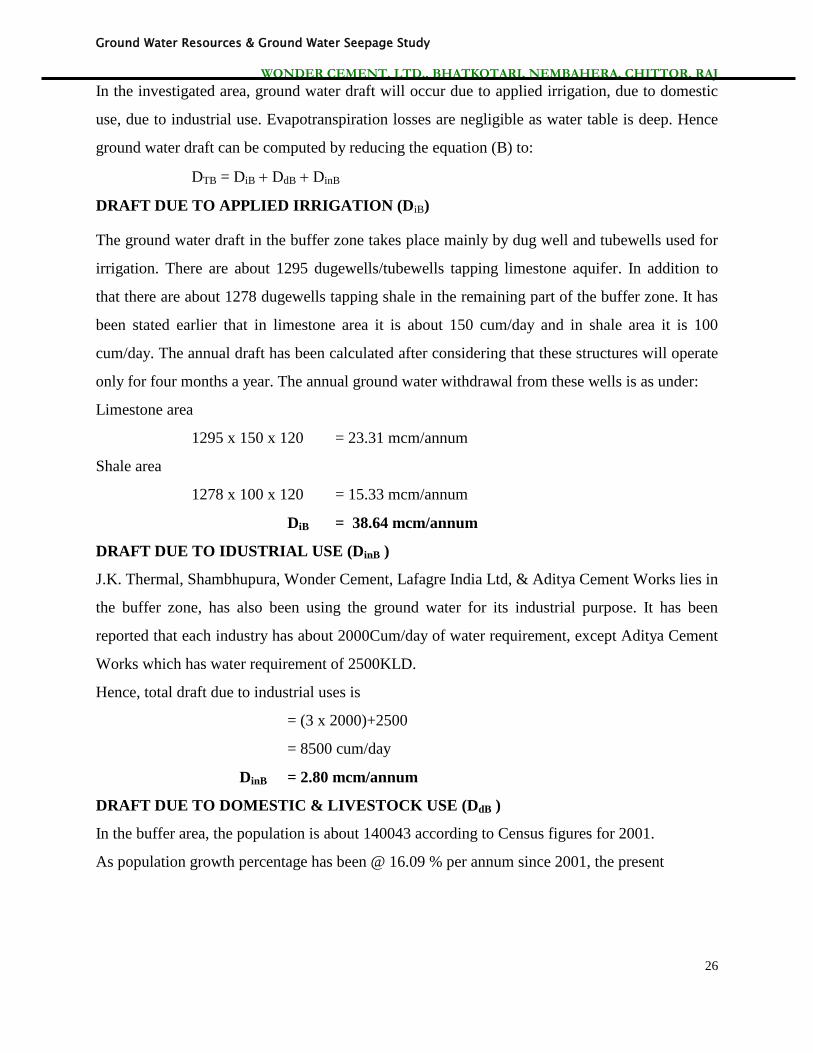
In the investigated area, ground water draft will occur due to applied irrigation, due to domestic
use, due to industrial use. Evapotranspiration losses are negligible as water table is deep. Hence
ground water draft can be computed by reducing the equation (B) to:
DTB = DiB DdB DinB
DRAFT DUE TO APPLIED IRRIGATION (DiB)
The ground water draft in the buffer zone takes place mainly by dug well and tubewells used for
irrigation. There are about 1295 dugewells/tubewells tapping limestone aquifer. In addition to
that there are about 1278 dugewells tapping shale in the remaining part of the buffer zone. It has
been stated earlier that in limestone area it is about 150 cum/day and in shale area it is 100
cum/day. The annual draft has been calculated after considering that these structures will operate
only for four months a year. The annual ground water withdrawal from these wells is as under:
Limestone area
1295 x 150 x 120 = 23.31 mcm/annum
Shale area
1278 x 100 x 120 = 15.33 mcm/annum
DiB = 38.64 mcm/annum
DRAFT DUE TO IDUSTRIAL USE (DinB )
J.K. Thermal, Shambhupura, Wonder Cement, Lafagre India Ltd, & Aditya Cement Works lies in
the buffer zone, has also been using the ground water for its industrial purpose. It has been
reported that each industry has about 2000Cum/day of water requirement, except Aditya Cement
Works which has water requirement of 2500KLD.
Hence, total draft due to industrial uses is
= (3 x 2000)+2500
= 8500 cum/day
DinB = 2.80 mcm/annum
DRAFT DUE TO DOMESTIC & LIVESTOCK USE (DdB )
In the buffer area, the population is about 140043 according to Census figures for 2001.
As population growth percentage has been @ 16.09 % per annum since 2001, the present
Ground Water Resources & Ground Water Seepage Study
WONDER CEMENT. LTD., BHATKOTARI, NEMBAHERA, CHITTOR, RAJ
27
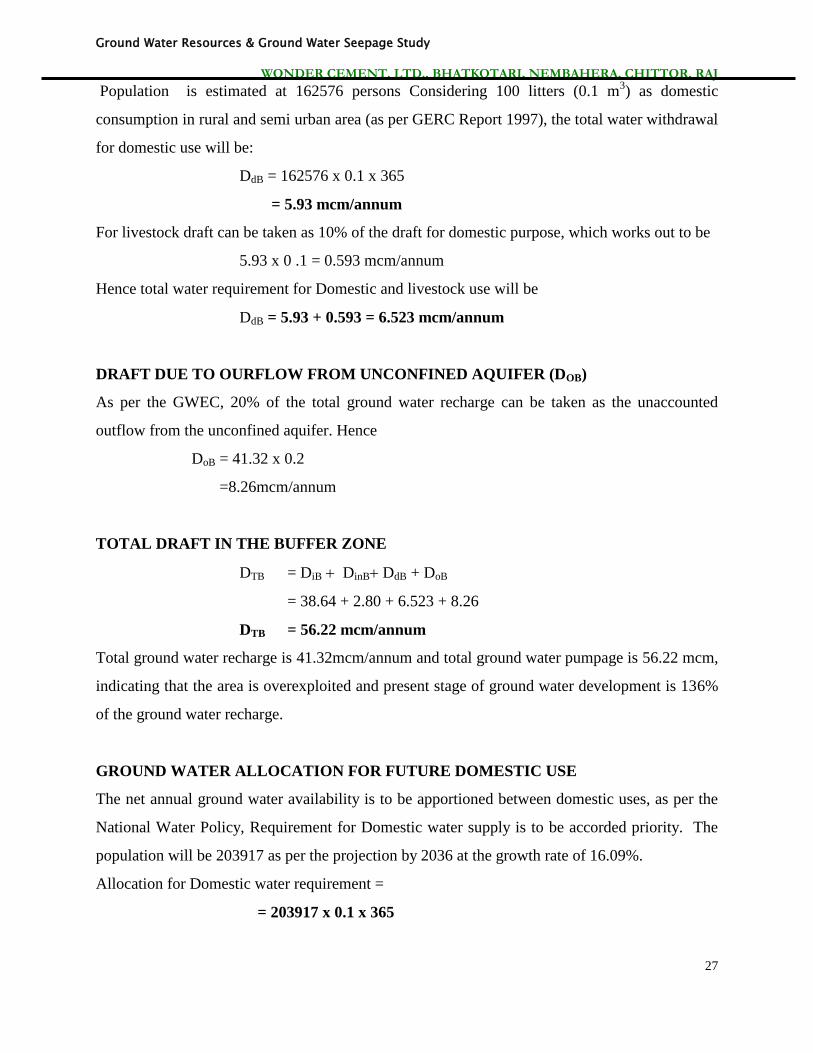
Population is estimated at 162576 persons Considering 100 litters (0.1 m3) as domestic
consumption in rural and semi urban area (as per GERC Report 1997), the total water withdrawal
for domestic use will be:
DdB = 162576 x 0.1 x 365
= 5.93 mcm/annum
For livestock draft can be taken as 10% of the draft for domestic purpose, which works out to be
5.93 x 0 .1 = 0.593 mcm/annum
Hence total water requirement for Domestic and livestock use will be
DdB = 5.93 + 0.593 = 6.523 mcm/annum
DRAFT DUE TO OURFLOW FROM UNCONFINED AQUIFER (DOB)
As per the GWEC, 20% of the total ground water recharge can be taken as the unaccounted
outflow from the unconfined aquifer. Hence
DoB = 41.32 x 0.2
=8.26mcm/annum
TOTAL DRAFT IN THE BUFFER ZONE
DTB = DiB DinB DdB + DoB
= 38.64 + 2.80 + 6.523 + 8.26
DTB = 56.22 mcm/annum
Total ground water recharge is 41.32mcm/annum and total ground water pumpage is 56.22 mcm,
indicating that the area is overexploited and present stage of ground water development is 136%
of the ground water recharge.
GROUND WATER ALLOCATION FOR FUTURE DOMESTIC USE
The net annual ground water availability is to be apportioned between domestic uses, as per the
National Water Policy, Requirement for Domestic water supply is to be accorded priority. The
population will be 203917 as per the projection by 2036 at the growth rate of 16.09%.
Allocation for Domestic water requirement =
= 203917 x 0.1 x 365
Ground Water Resources & Ground Water Seepage Study
WONDER CEMENT. LTD., BHATKOTARI, NEMBAHERA, CHITTOR, RAJ
28
= 7.44 mcm/annum
Hence the Future Ground water allocation will be:
= 7.44 – 5.93
= 1.51 mcm/annum
AQUIFER PERFORMANCE TEST
Ground water is a replenishable resource, the quantification of which is of great importance for
drawing up plans for utilization and forms an important aspect in judging the potentiality of an
area in the line of total water requirement. A judicious exploitation of ground water resources can
not be planned without the basic knowledge of ground water hydraulics which is used in
evaluating aquifer parameters for predicating total water resources.
Hydraulic parameters of aquifer system are determined by conducting aquifer performance test at
optimum extraction rate on representative set of exploratory & observation tubewells.
Observation during aquifer performance test includes measurement of water levels and discharge
rate. Water levels were measured with the help of water level indicator and the yield was
measured with the help of water meter installed at the outlet delivery pipe. The effect of pumping
was measured in both pumping well at standard interval for 1050min. data collected during the
test were subject to analysis by Jacob’s method to calculate hydraulic parameters of aquifer. In
the present area, aquifer performance test were conducted on one set of exploratory &
observation tube wells.
The details of aquifer performance test data are given in the following pages:
Step draw down test:
A step draw down test is one in which the discharge rate is changed in controlled stages. The
discharge rate is maintained at a constant value within the stage. The test is generally carried out
in three steps. Drawdown measurements are taken throughout the test with each step and
maximum drawdown of the well is recorded. The data obtained from the test are utilized in
working out long duration pumping rate based on the characteristics determined as a result of
test.
The pumping well was subjected to step drawdown test in 3 stages of 100 min. each with the
help of multistage 10hp submersible pump and control valve.
Ground Water Resources & Ground Water Seepage Study
WONDER CEMENT. LTD., BHATKOTARI, NEMBAHERA, CHITTOR, RAJ
29
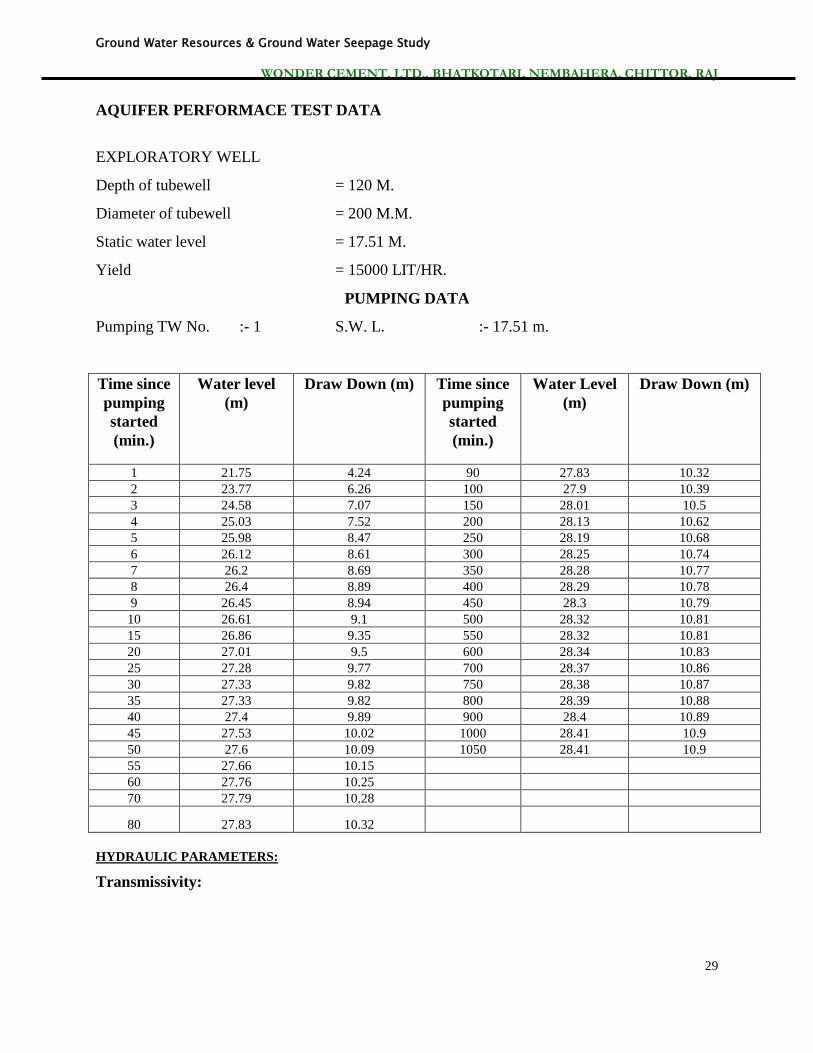
AQUIFER PERFORMACE TEST DATA
EXPLORATORY WELL
Depth of tubewell = 120 M.
Diameter of tubewell = 200 M.M.
Static water level = 17.51 M.
Yield = 15000 LIT/HR.
PUMPING DATA
Pumping TW No. :- 1 S.W. L. :- 17.51 m.
Time since
pumping
started
(min.)
Water level
(m)
Draw Down (m) Time since
pumping
started
(min.)
Water Level
(m)
Draw Down (m)
1 21.75 4.24 90 27.83 10.32
2 23.77 6.26 100 27.9 10.39
3 24.58 7.07 150 28.01 10.5
4 25.03 7.52 200 28.13 10.62
5 25.98 8.47 250 28.19 10.68
6 26.12 8.61 300 28.25 10.74
7 26.2 8.69 350 28.28 10.77
8 26.4 8.89 400 28.29 10.78
9 26.45 8.94 450 28.3 10.79
10 26.61 9.1 500 28.32 10.81
15 26.86 9.35 550 28.32 10.81
20 27.01 9.5 600 28.34 10.83
25 27.28 9.77 700 28.37 10.86
30 27.33 9.82 750 28.38 10.87
35 27.33 9.82 800 28.39 10.88
40 27.4 9.89 900 28.4 10.89
45 27.53 10.02 1000 28.41 10.9
50 27.6 10.09 1050 28.41 10.9
55 27.66 10.15
60 27.76 10.25
70 27.79 10.28
80 27.83 10.32
HYDRAULIC PARAMETERS:
Transmissivity:
Ground Water Resources & Ground Water Seepage Study
WONDER CEMENT. LTD., BHATKOTARI, NEMBAHERA, CHITTOR, RAJ
30
Transmissivity of the aquifer is determined based on Jacob’s straight line method, which present
good empirical technique to arrive at most useful hydraulic parameter for the aquifer using
second segment of time residual drawdown curve spread over one log cycle.
First Segment
T = 2.3 Q/ 4π Δs
Where,
T = Transmissivity of aquifer in m2/day
Q= optimum yield at which test was carried out = 360 m3/day
S= drawdown intercept for one log cycle = 9.4 m (Fig.1)
T = (2.3 x 360)/ (4 x3.14 x 9.4)
= 7.0131 m2/day
Second Segment
T = 2.3 Q/ 4π Δs
Where,
T = Transmissivity of aquifer in m2/day
Q= optimum yield at which test was carried out = 360 m3/day
S= Drawdown intercept for one log cycle = 1.4 m (Fig.1)
T = (2.3 x 360)/ (4 x3.14 x 1.6)
= 47.09 m2/day
Third Segment
T = 2.3 Q/ 4π Δs
Where,
T = Transmissivity of aquifer in m2/day
Q= optimum yield at which test was carried out = 360 m3/day
S= residual drawdown intercept for one log cycle = 0.4 m (Fig.1)
T = (2.3 x 360)/ (4 x 3.14 x 0.4)
= 164.80m2/day
Average Transmissivity
= 7.01 + 47.09 + 164.80/3
= 218.90/3
Ground Water Resources & Ground Water Seepage Study
WONDER CEMENT. LTD., BHATKOTARI, NEMBAHERA, CHITTOR, RAJ
31
= 72.96 m2/day
Hydraulic Conductivity:
This parameter is defined as rate of flow of water through one meter thickness of aquifer from
unit cross sectional area. It is determined by the formula:
K = T/b
Where,
T= Transmissivity of the aquifer = 72.28 m2/day
b= saturated thickness of the tested well = 110.49m (Depth of well – water level)
K = 72.96/110.49
= 0.66 m/day
K = 0.66 m/day
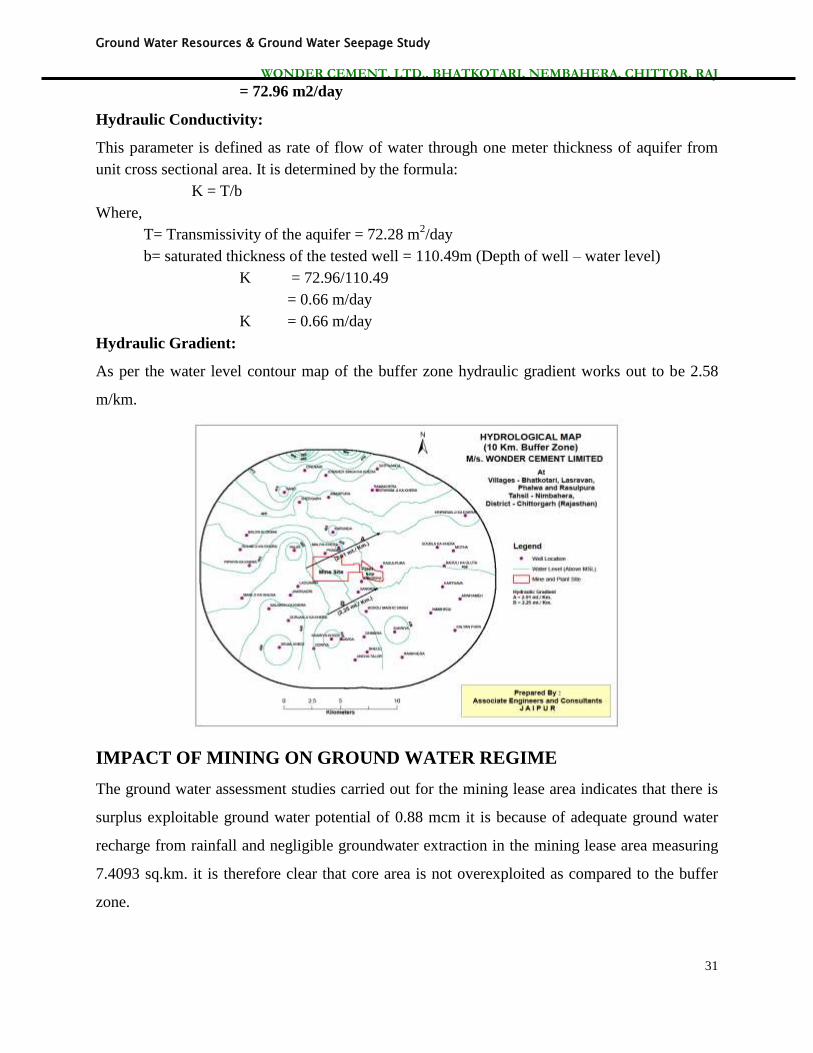
Hydraulic Gradient:
As per the water level contour map of the buffer zone hydraulic gradient works out to be 2.58
m/km.
IMPACT OF MINING ON GROUND WATER REGIME
The ground water assessment studies carried out for the mining lease area indicates that there is
surplus exploitable ground water potential of 0.88 mcm it is because of adequate ground water
recharge from rainfall and negligible groundwater extraction in the mining lease area measuring
7.4093 sq.km. it is therefore clear that core area is not overexploited as compared to the buffer
zone.
Ground Water Resources & Ground Water Seepage Study
WONDER CEMENT. LTD., BHATKOTARI, NEMBAHERA, CHITTOR, RAJ
32
It is therefore observed that mining of limestone has not affected the ground water recharge. On
the contrary, there is surplus ground water potential in the lease area as compared to its adjoining
buffer zone.
During The hydrogeological investigation it has also been observed that occurrence of ground
water is generally controlled by deep seated fractures found at a depth at different depths. It is
also observed that ground water also occurs in perch condition or in localised pockets at different
depth resulting in huge variation in water table throughout the area. In mining lease area most of
the tube wells having depth of 50 to 60m are dry. Even in post-monsoon season, during pumping
of tubewells, water level goes down upto 70 meter. As such the pumping level in the area in post-
monsoon season is about 70 meter. Hence even at the conceptual level, when mining will achieve
an average depth of 122m, possibilities of getting groundwater seepage is very remote.
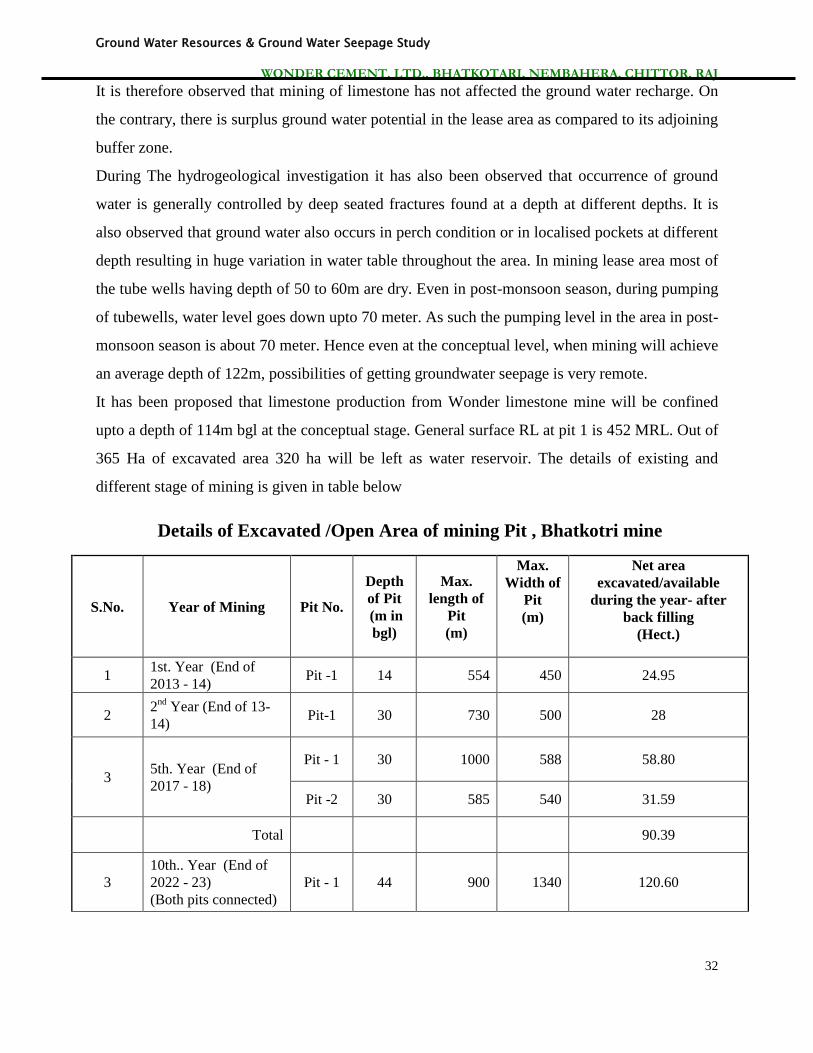
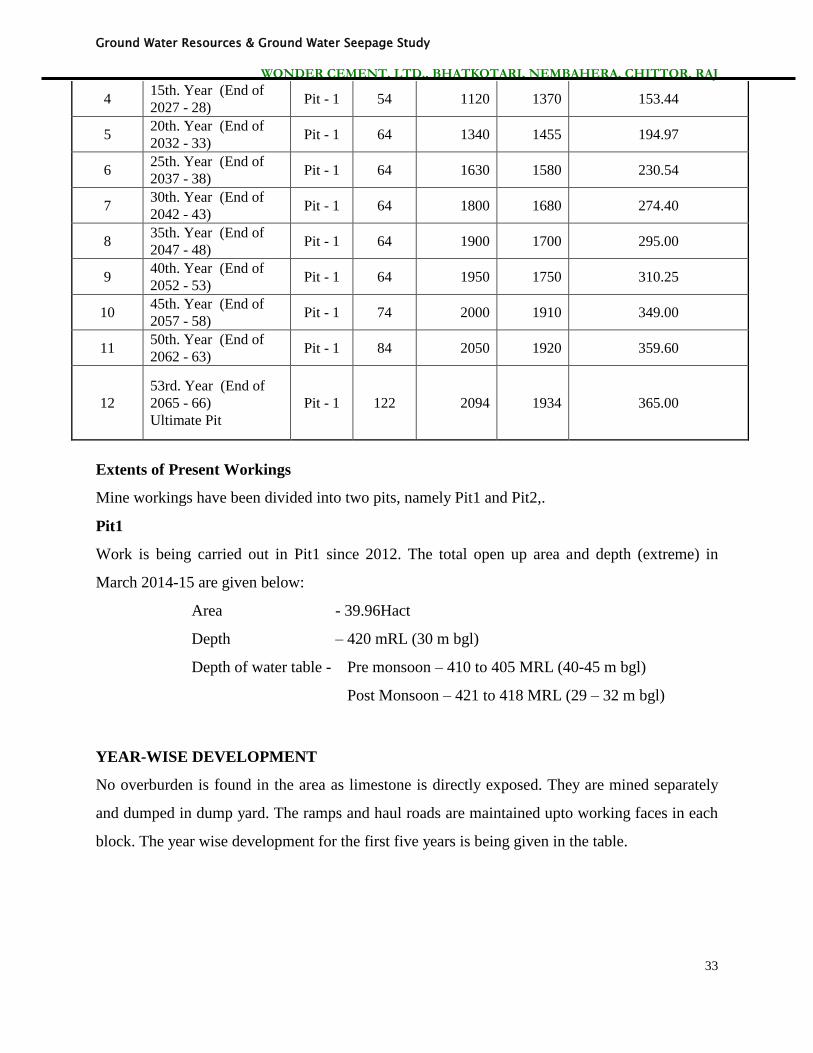
It has been proposed that limestone production from Wonder limestone mine will be confined
upto a depth of 114m bgl at the conceptual stage. General surface RL at pit 1 is 452 MRL. Out of
365 Ha of excavated area 320 ha will be left as water reservoir. The details of existing and
different stage of mining is given in table below
Details of Excavated /Open Area of mining Pit , Bhatkotri mine
S.No. Year of Mining Pit No.
Depth
of Pit
(m in
bgl)
Max.
length of
Pit
(m)
Max.
Width of
Pit
(m)
Net area
excavated/available
during the year- after
back filling
(Hect.)
1 1st. Year (End of
2013 - 14) Pit -1 14 554 450 24.95
2 2
nd Year (End of 13-
14) Pit-1 30 730 500 28
3 5th. Year (End of
2017 - 18)
Pit - 1 30 1000 588 58.80
Pit -2 30 585 540 31.59
Total 90.39
3
10th.. Year (End of
2022 - 23)
(Both pits connected)
Pit - 1 44 900 1340 120.60
Ground Water Resources & Ground Water Seepage Study
WONDER CEMENT. LTD., BHATKOTARI, NEMBAHERA, CHITTOR, RAJ
33
4 15th. Year (End of
2027 - 28) Pit - 1 54 1120 1370 153.44
5 20th. Year (End of
2032 - 33) Pit - 1 64 1340 1455 194.97
6 25th. Year (End of
2037 - 38) Pit - 1 64 1630 1580 230.54
7 30th. Year (End of
2042 - 43) Pit - 1 64 1800 1680 274.40
8 35th. Year (End of
2047 - 48) Pit - 1 64 1900 1700 295.00
9 40th. Year (End of
2052 - 53) Pit - 1 64 1950 1750 310.25
10 45th. Year (End of
2057 - 58) Pit - 1 74 2000 1910 349.00
11 50th. Year (End of
2062 - 63) Pit - 1 84 2050 1920 359.60
12
53rd. Year (End of
2065 - 66)
Ultimate Pit
Pit - 1 122 2094 1934 365.00
Extents of Present Workings
Mine workings have been divided into two pits, namely Pit1 and Pit2,.
Pit1
Work is being carried out in Pit1 since 2012. The total open up area and depth (extreme) in
March 2014-15 are given below:
Area - 39.96Hact
Depth – 420 mRL (30 m bgl)
Depth of water table - Pre monsoon – 410 to 405 MRL (40-45 m bgl)
Post Monsoon – 421 to 418 MRL (29 – 32 m bgl)
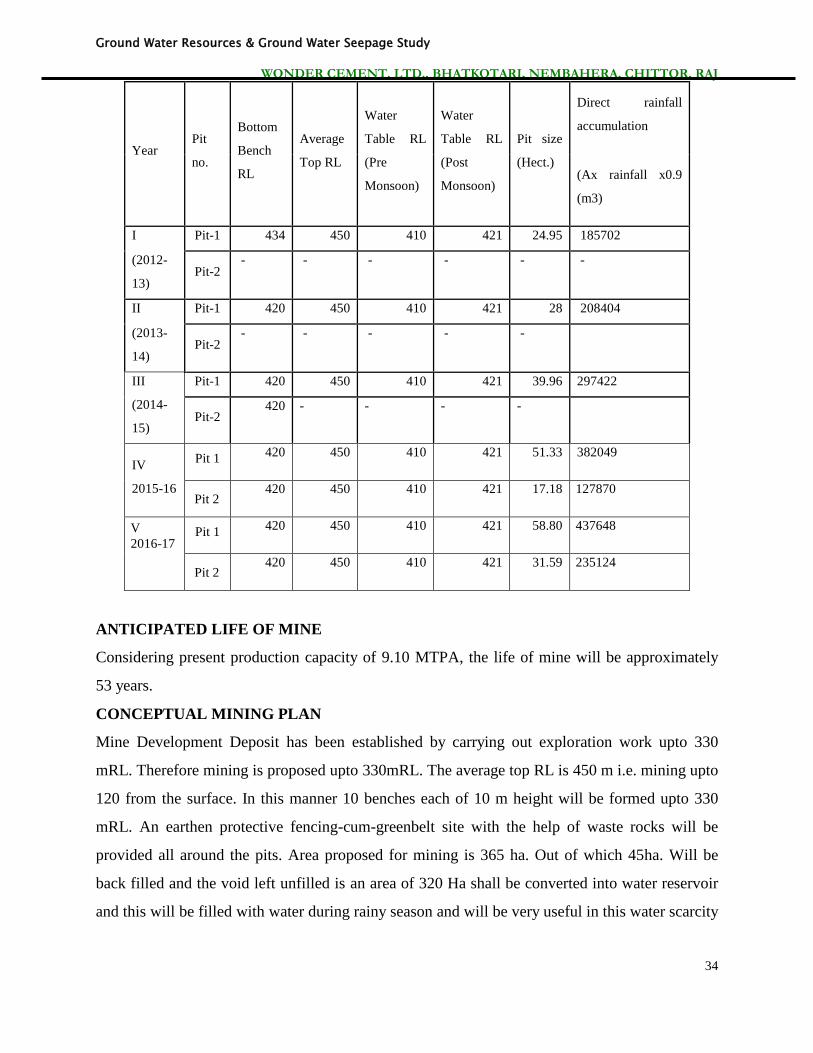
YEAR-WISE DEVELOPMENT
No overburden is found in the area as limestone is directly exposed. They are mined separately
and dumped in dump yard. The ramps and haul roads are maintained upto working faces in each
block. The year wise development for the first five years is being given in the table.
Ground Water Resources & Ground Water Seepage Study
WONDER CEMENT. LTD., BHATKOTARI, NEMBAHERA, CHITTOR, RAJ
34
Year Pit
no.
Bottom
Bench
RL
Average
Top RL
Water
Table RL
(Pre
Monsoon)
Water
Table RL
(Post
Monsoon)
Pit size
(Hect.)
Direct rainfall
accumulation
(Ax rainfall x0.9
(m3)
I Pit-1 434 450 410 421 24.95 185702
(2012-
13) Pit-2
- - - - - -
II Pit-1 420 450 410 421 28 208404
(2013-
14) Pit-2
- - - - -
III
(2014-
15)
Pit-1 420 450 410 421 39.96 297422
Pit-2 420 - - - -
IV
2015-16
Pit 1 420 450 410 421 51.33 382049
Pit 2 420 450 410 421 17.18 127870
V
2016-17 Pit 1
420 450 410 421 58.80 437648
Pit 2 420 450 410 421 31.59 235124
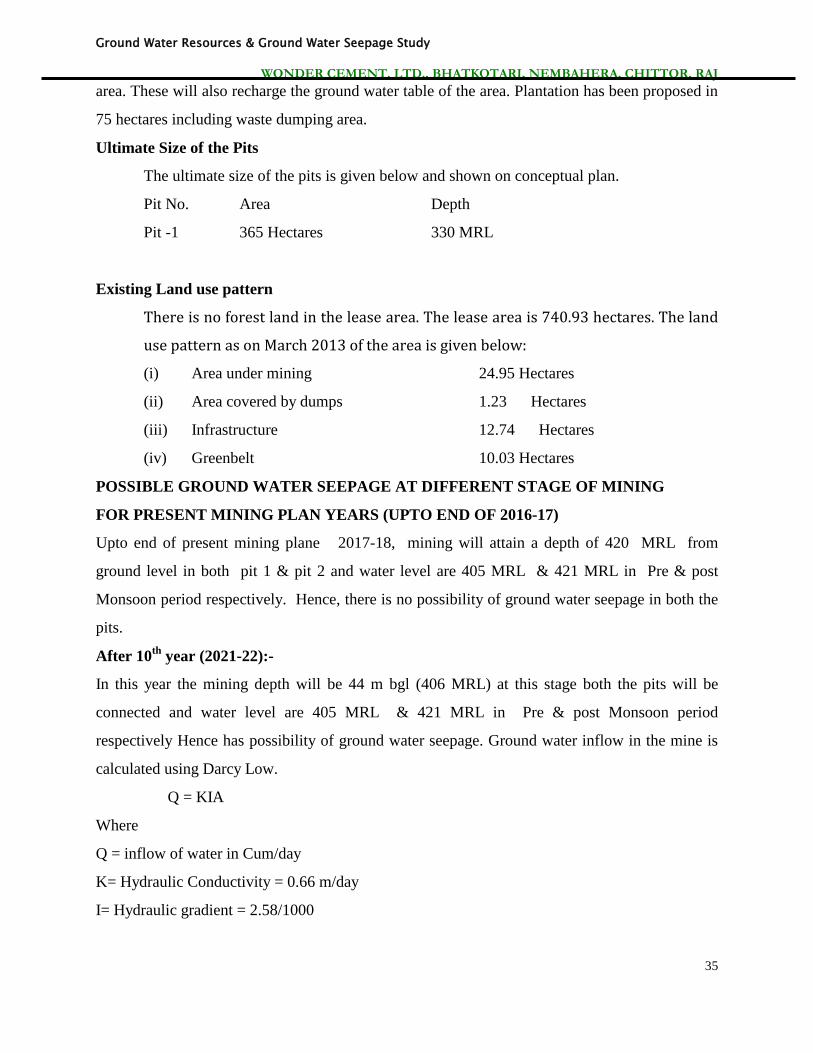
ANTICIPATED LIFE OF MINE
Considering present production capacity of 9.10 MTPA, the life of mine will be approximately
53 years.
CONCEPTUAL MINING PLAN
Mine Development Deposit has been established by carrying out exploration work upto 330
mRL. Therefore mining is proposed upto 330mRL. The average top RL is 450 m i.e. mining upto
120 from the surface. In this manner 10 benches each of 10 m height will be formed upto 330
mRL. An earthen protective fencing-cum-greenbelt site with the help of waste rocks will be
provided all around the pits. Area proposed for mining is 365 ha. Out of which 45ha. Will be
back filled and the void left unfilled is an area of 320 Ha shall be converted into water reservoir
and this will be filled with water during rainy season and will be very useful in this water scarcity
Ground Water Resources & Ground Water Seepage Study
WONDER CEMENT. LTD., BHATKOTARI, NEMBAHERA, CHITTOR, RAJ
35
area. These will also recharge the ground water table of the area. Plantation has been proposed in
75 hectares including waste dumping area.
Ultimate Size of the Pits
The ultimate size of the pits is given below and shown on conceptual plan.
Pit No. Area Depth
Pit -1 365 Hectares 330 MRL
Existing Land use pattern
There is no forest land in the lease area. The lease area is 740.93 hectares. The land
use pattern as on March 2013 of the area is given below:
(i) Area under mining 24.95 Hectares
(ii) Area covered by dumps 1.23 Hectares
(iii) Infrastructure 12.74 Hectares
(iv) Greenbelt 10.03 Hectares
POSSIBLE GROUND WATER SEEPAGE AT DIFFERENT STAGE OF MINING
FOR PRESENT MINING PLAN YEARS (UPTO END OF 2016-17)
Upto end of present mining plane 2017-18, mining will attain a depth of 420 MRL from
ground level in both pit 1 & pit 2 and water level are 405 MRL & 421 MRL in Pre & post
Monsoon period respectively. Hence, there is no possibility of ground water seepage in both the
pits.
After 10th
year (2021-22):-
In this year the mining depth will be 44 m bgl (406 MRL) at this stage both the pits will be
connected and water level are 405 MRL & 421 MRL in Pre & post Monsoon period
respectively Hence has possibility of ground water seepage. Ground water inflow in the mine is
calculated using Darcy Low.
Q = KIA
Where
Q = inflow of water in Cum/day
K= Hydraulic Conductivity = 0.66 m/day
I= Hydraulic gradient = 2.58/1000
Ground Water Resources & Ground Water Seepage Study
WONDER CEMENT. LTD., BHATKOTARI, NEMBAHERA, CHITTOR, RAJ
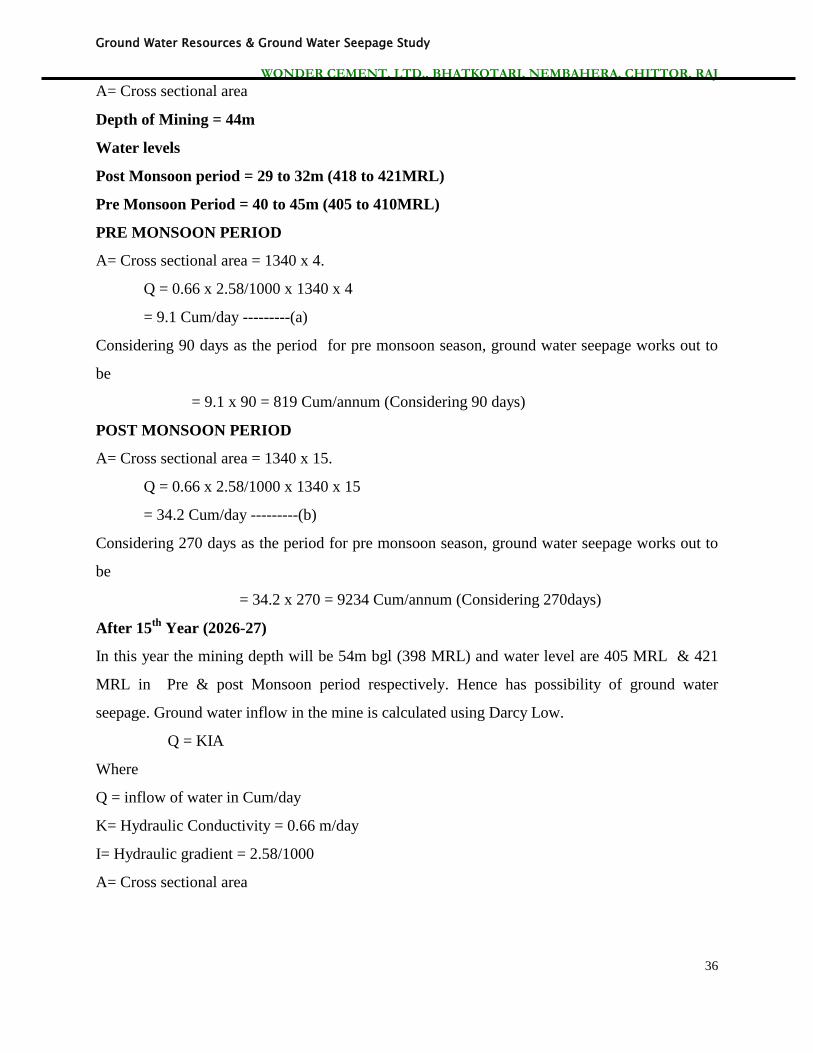
36
A= Cross sectional area
Depth of Mining = 44m
Water levels
Post Monsoon period = 29 to 32m (418 to 421MRL)
Pre Monsoon Period = 40 to 45m (405 to 410MRL)
PRE MONSOON PERIOD
A= Cross sectional area = 1340 x 4.
Q = 0.66 x 2.58/1000 x 1340 x 4
= 9.1 Cum/day ---------(a)
Considering 90 days as the period for pre monsoon season, ground water seepage works out to
be
= 9.1 x 90 = 819 Cum/annum (Considering 90 days)
POST MONSOON PERIOD
A= Cross sectional area = 1340 x 15.
Q = 0.66 x 2.58/1000 x 1340 x 15
= 34.2 Cum/day ---------(b)
Considering 270 days as the period for pre monsoon season, ground water seepage works out to
be
= 34.2 x 270 = 9234 Cum/annum (Considering 270days)
After 15th
Year (2026-27)
In this year the mining depth will be 54m bgl (398 MRL) and water level are 405 MRL & 421
MRL in Pre & post Monsoon period respectively. Hence has possibility of ground water
seepage. Ground water inflow in the mine is calculated using Darcy Low.
Q = KIA
Where
Q = inflow of water in Cum/day
K= Hydraulic Conductivity = 0.66 m/day
I= Hydraulic gradient = 2.58/1000
A= Cross sectional area
Ground Water Resources & Ground Water Seepage Study
WONDER CEMENT. LTD., BHATKOTARI, NEMBAHERA, CHITTOR, RAJ
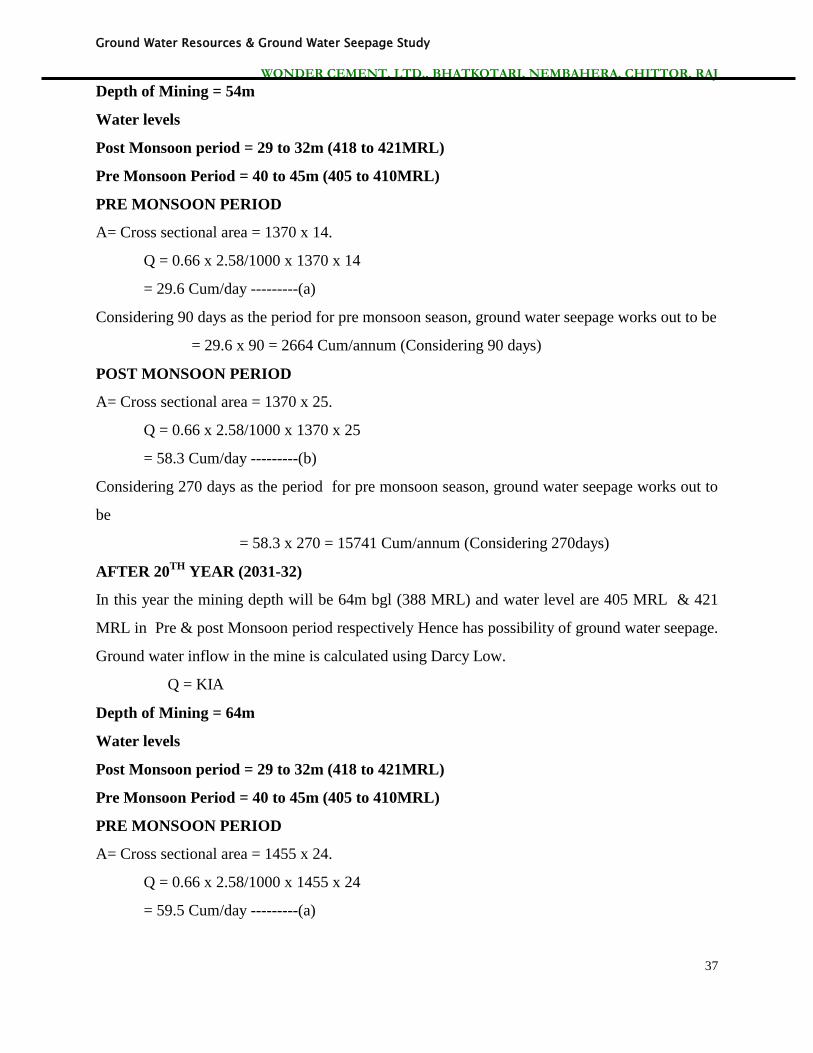
37
Depth of Mining = 54m
Water levels
Post Monsoon period = 29 to 32m (418 to 421MRL)
Pre Monsoon Period = 40 to 45m (405 to 410MRL)
PRE MONSOON PERIOD
A= Cross sectional area = 1370 x 14.
Q = 0.66 x 2.58/1000 x 1370 x 14
= 29.6 Cum/day ---------(a)
Considering 90 days as the period for pre monsoon season, ground water seepage works out to be
= 29.6 x 90 = 2664 Cum/annum (Considering 90 days)
POST MONSOON PERIOD
A= Cross sectional area = 1370 x 25.
Q = 0.66 x 2.58/1000 x 1370 x 25
= 58.3 Cum/day ---------(b)
Considering 270 days as the period for pre monsoon season, ground water seepage works out to
be
= 58.3 x 270 = 15741 Cum/annum (Considering 270days)
AFTER 20TH
YEAR (2031-32)
In this year the mining depth will be 64m bgl (388 MRL) and water level are 405 MRL & 421
MRL in Pre & post Monsoon period respectively Hence has possibility of ground water seepage.
Ground water inflow in the mine is calculated using Darcy Low.
Q = KIA
Depth of Mining = 64m
Water levels
Post Monsoon period = 29 to 32m (418 to 421MRL)
Pre Monsoon Period = 40 to 45m (405 to 410MRL)
PRE MONSOON PERIOD
A= Cross sectional area = 1455 x 24.
Q = 0.66 x 2.58/1000 x 1455 x 24
= 59.5 Cum/day ---------(a)
Ground Water Resources & Ground Water Seepage Study
WONDER CEMENT. LTD., BHATKOTARI, NEMBAHERA, CHITTOR, RAJ
38
Considering 90 days as the period for pre monsoon season, ground water seepage works out to be
= 59.5 x 90 = 5355 Cum/annum (Considering 90 days)
POST MONSOON PERIOD
A= Cross sectional area = 1455 x 35.
Q = 0.66 x 2.58/1000 x 1455 x 35
= 86.7 Cum/day ---------(b)
Considering 270 days as the period for pre monsoon season, ground water seepage works out to
be
= 86.7 x 270 = 23409 Cum/annum (Considering 270days)
AFTER 30TH
YEAR (2041-42)
In this year the mining depth will be 64m bgl (388 MRL) and water level are 405 MRL & 421
MRL in Pre & post Monsoon period respectively.Hence has possibility of ground water seepage.
Ground water inflow in the mine is calculated using Darcy Low.
Q = KIA
Depth of Mining = 64m
Water levels
Post Monsoon period = 29 to 32m (418 to 421MRL)
Pre Monsoon Period = 40 to 45m (405 to 410MRL)
PRE MONSOON PERIOD
A= Cross sectional area = 1680 x 24.
Q = 0.66 x 2.58/1000 x 1680 x 24
= 68.6 Cum/day ---------(a)
Considering 90 days as the period for pre monsoon season, ground water seepage works out to be
= 68.6 x 90 = 6174 Cum/annum (Considering 90 days)
POST MONSOON PERIOD
A= Cross sectional area = 1680 x 35.
Q = 0.66 x 2.58/1000 x 1680 x 35
Ground Water Resources & Ground Water Seepage Study
WONDER CEMENT. LTD., BHATKOTARI, NEMBAHERA, CHITTOR, RAJ
39
= 100.1 Cum/day ---------(b)
Considering 270 days as the period for pre monsoon season, ground water seepage works out to
be
= 100.1 x 270 = 27027 Cum/annum (Considering 270days)
AFTER 45TH
YEAR (2056-57)
In this year the mining depth will be 74m bgl (378 MRL) water level are 405 MRL & 421 MRL
in Pre & post Monsoon period respectively. Hence has possibility of ground water seepage.
Ground water inflow in the mine is calculated using Darcy Low.
Q = KIA
Depth of Mining = 74m
Water levels
Post Monsoon period = 29 to 32m (418 to 421MRL)
Pre Monsoon Period = 40 to 45m (405 to 410MRL)
PRE MONSOON PERIOD
A= Cross sectional area = 1910 x 34.
Q = 0.66 x 2.58/1000 x 1910 x 34
= 110.5 Cum/day ---------(a)
Considering 90 days as the period for pre monsoon season, ground water seepage works out to be
= 110.5 x 90 = 9945 Cum/annum (Considering 90 days)
POST MONSOON PERIOD
A= Cross sectional area = 1910 x 45.
Q = 0.66 x 2.58/1000 x 1910 x 35
= 146.3 Cum/day ---------(b)
Considering 270 days as the period for pre monsoon season, ground water seepage works out to
be
= 146.3 x 270 = 39501 Cum/annum (Considering 270days)
Ground Water Resources & Ground Water Seepage Study
WONDER CEMENT. LTD., BHATKOTARI, NEMBAHERA, CHITTOR, RAJ
40
AT CONCEPTUAL STAGE
AFTER 53TH
YEAR (2064-65)
In this year the mining depth will be 122m bgl (342 MRL) and water level are 405 MRL & 421
MRL in Pre & post Monsoon period respectively. Hence has possibility of ground water
seepage. Ground water inflow in the mine is calculated using Darcy Low.
Q = KIA
Depth of Mining = 122 m
Water levels
Post Monsoon period = 29 to 32m (418 to 421MRL)
Pre Monsoon Period = 40 to 45m (405 to 410MRL)
PRE MONSOON PERIOD
A= Cross sectional area = 1934 x 82.
Q = 0.66 x 2.58/1000 x 1934 x 82
= 270 Cum/day ---------(a)
Considering 90 days as the period for pre monsoon season, ground water seepage works out to be
= 270 x 90 = 24300 Cum/annum (Considering 90 days)
POST MONSOON PERIOD
A= Cross sectional area = 1934 x 93.
Q = 0.66 x 2.58/1000 x 1934 x 93
= 306.26 Cum/day ---------(b)
Considering 270 days as the period for pre monsoon season, ground water seepage works out to
be
= 306.26 x 270 = 82690 Cum/annum (Considering 270days)
This seepage calculation at conceptual stage has been done considering the post monsoon
water levels and also considering that even at the conceptual stage water level will remain
same.
From Above calculation it is apparent during the present mining period i.e. upto 2016-17 mining
will be above water table. In year 2021-22 possibility of getting ground water seepage is there
and it works out to be 34.2 cum/day and at the conceptual stage when mine development will be
at maximum level works out to be 306.1 cum/day. This calculation is based on the assumption
Ground Water Resources & Ground Water Seepage Study
WONDER CEMENT. LTD., BHATKOTARI, NEMBAHERA, CHITTOR, RAJ
41
that water level will remain same even at the conceptual stage. Beside that total open up area of
365 Hect will have 2.29 mcm of rainwater as direct accumulated water in the mine pit. With the
passage of time and development of pit the accumulated seepage & rain water will be utilized for
Industrial, community use or supply to the nearby villagers for agriculture purpose.
IMPLEMENTED RAINWATER HARVESTING MEASURES
NEED FOR ARTIFICAL GROUND RECHARGE
Based on the assessment of long term ground water recharge and total requirement & proposal of
meeting this requirement from ground water but by doing this status of ground water become
overexploited. To minimize the effect on ground water status, it is necessary that ground water
storage of the area must be augmented by rainwater harvesting so that the existence of industry
does not adversely effects the ultimate ground water status.
NATURE OF PROBLEM
Rainfall is only source of water in the area; rainfall & evapo-transpiration are two major factors
controlling the quantum of rainwater available for recharge. The investigated area receives
rainfall for just 26 to 30 days a year. Thus not only the total rainfall but also its availability is
confined to few days during which entire water resources planning has to be done.
The other important factors controlling the natural recharge to ground water are rainfall intensity,
hydrogeology & depth of water level. It is observed that majority of rainfall occurs in 3-5 major
storms lasting only a few hours. Natural recharge to ground water is further restricted due to
impervious hard strata. Some of water, which infiltrates during rainy period, is entrapped in the
soil and it never reaches the water level. This water is ultimately lost due to potential evapo-
transpiration. The rates of potential evapo - tranpiration (PET) is very high in the area. On an
average, Annual PET is higher than the rainfall in the area. Thus any artificial recharge by
indirect techniques should be such that most of the water stored on surface is put to ground water
within the shortest possible time to avoid losses.
As indicated earlier, hydro geologically the area is composed of hard rock and for artificial
ground water recharge Injection wells & open wells will be most feasible recharge techniques.
This will help in augmenting the groundwater storage around the tube wells and open wells so
that they can sustain in long term.
Ground Water Resources & Ground Water Seepage Study
WONDER CEMENT. LTD., BHATKOTARI, NEMBAHERA, CHITTOR, RAJ
42
METHODS OF RAINWATER HARVESTING SYSTEM
Following methods shall carry out the rainwater harvesting……
1. Surface rainwater runoff available from paved area, green area and open land shall be used
for recharging through injection wells.
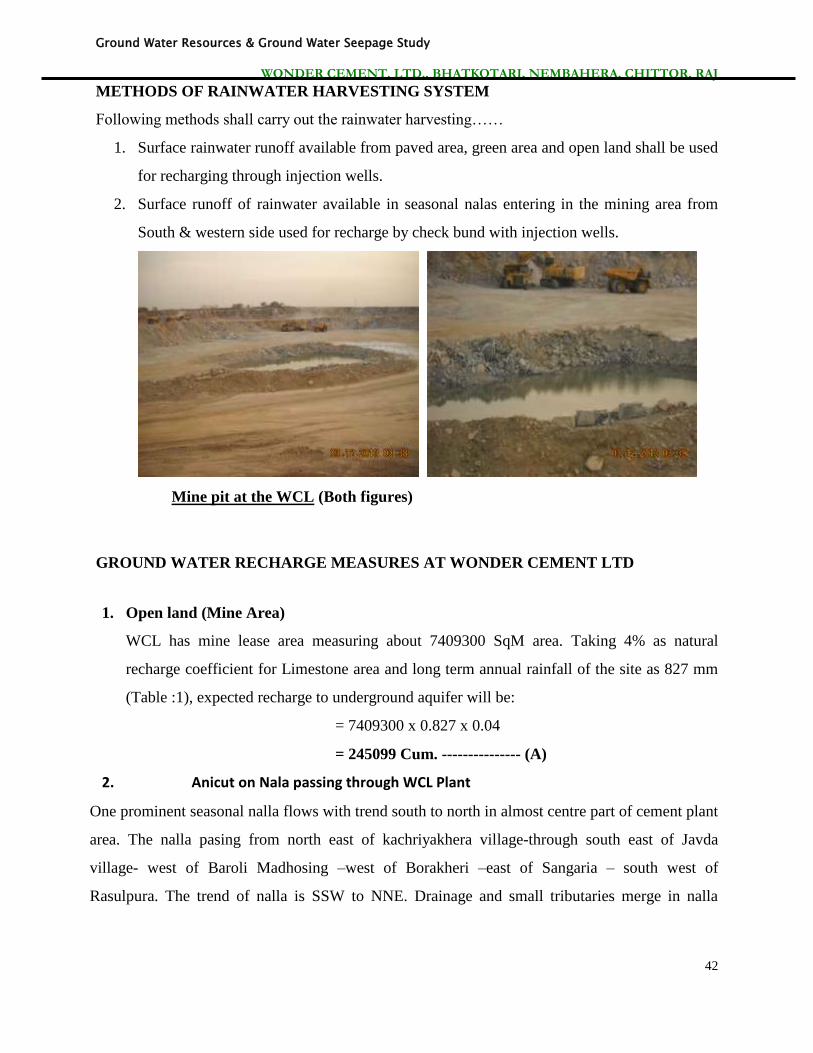
2. Surface runoff of rainwater available in seasonal nalas entering in the mining area from
South & western side used for recharge by check bund with injection wells.
Mine pit at the WCL (Both figures)
GROUND WATER RECHARGE MEASURES AT WONDER CEMENT LTD
1. Open land (Mine Area)
WCL has mine lease area measuring about 7409300 SqM area. Taking 4% as natural
recharge coefficient for Limestone area and long term annual rainfall of the site as 827 mm
(Table :1), expected recharge to underground aquifer will be:
= 7409300 x 0.827 x 0.04
= 245099 Cum. --------------- (A)
2. Anicut on Nala passing through WCL Plant
One prominent seasonal nalla flows with trend south to north in almost centre part of cement plant
area. The nalla pasing from north east of kachriyakhera village-through south east of Javda
village- west of Baroli Madhosing –west of Borakheri –east of Sangaria – south west of
Rasulpura. The trend of nalla is SSW to NNE. Drainage and small tributaries merge in nalla
Ground Water Resources & Ground Water Seepage Study
WONDER CEMENT. LTD., BHATKOTARI, NEMBAHERA, CHITTOR, RAJ
43
which then meets in the Murliya reservoir in Bansa village and ultimately approaches in the
Gambhiri river.
Total catchment area of these nalas from its originating point to the entrance point of plant area
has been calculated. It works out to be 4000000 Sq.m. Taking 35% as the runoff coefficient for
gently sloping barren land average runoff available has been calculated as under:
Catchment area = 4000000 Sq.m.
Runoff coefficient = 35%
= 4000000 x 0.827 x 0.35
Available Runoff = 1157800 Cum/ annum
Expected recharge = 1157800 x 0.8
= 926240 cum/annum --------------- (B)
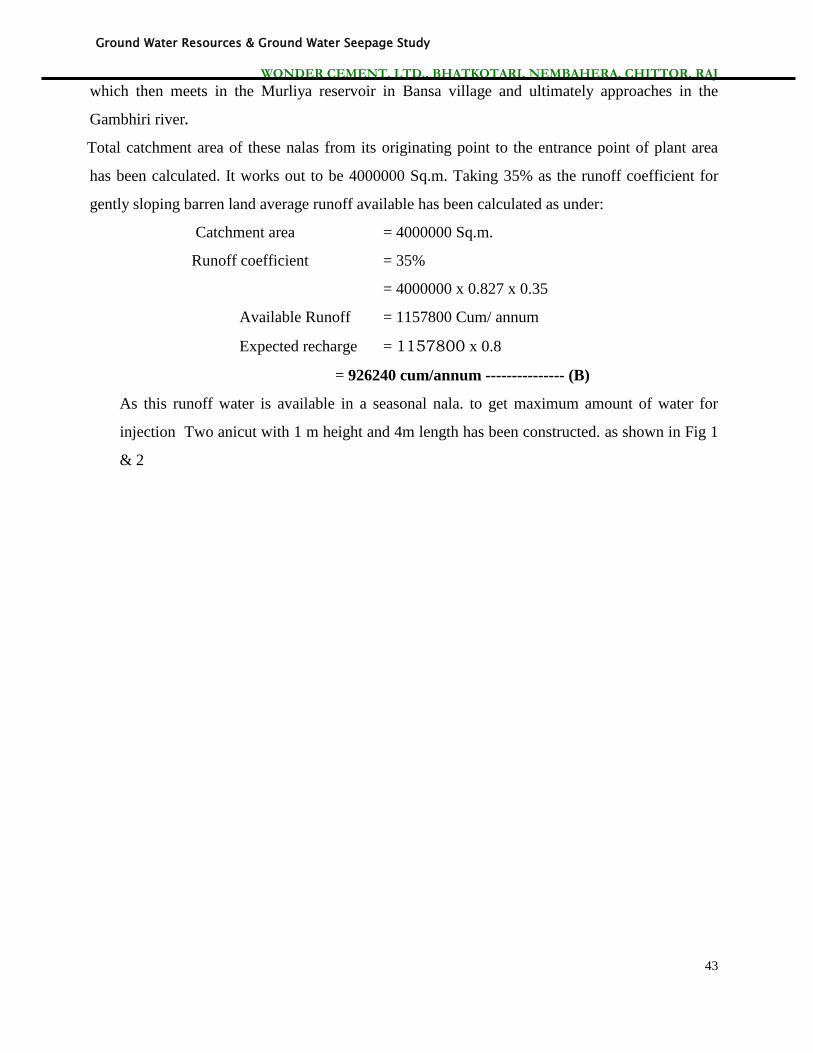
As this runoff water is available in a seasonal nala. to get maximum amount of water for
injection Two anicut with 1 m height and 4m length has been constructed. as shown in Fig 1
& 2
Ground Water Resources & Ground Water Seepage Study
WONDER CEMENT. LTD., BHATKOTARI, NEMBAHERA, CHITTOR, RAJ
44
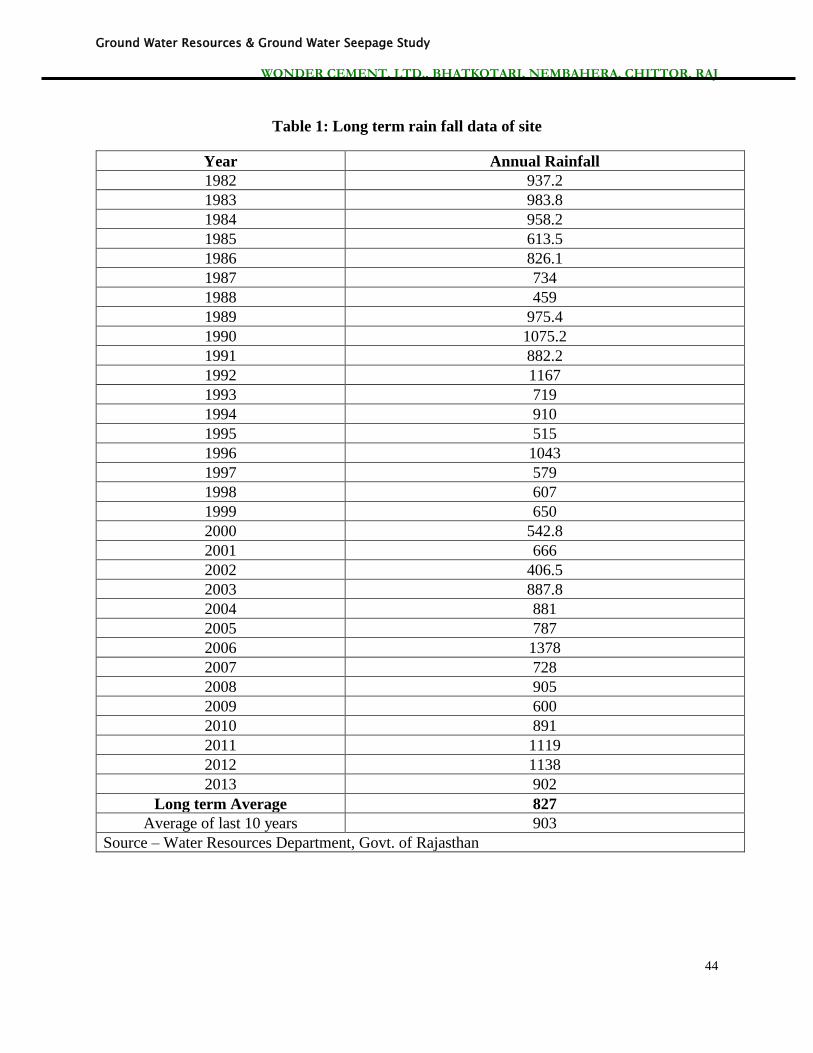
Table 1: Long term rain fall data of site
Year Annual Rainfall
1982 937.2
1983 983.8
1984 958.2
1985 613.5
1986 826.1
1987 734
1988 459
1989 975.4
1990 1075.2
1991 882.2
1992 1167
1993 719
1994 910
1995 515
1996 1043
1997 579
1998 607
1999 650
2000 542.8
2001 666
2002 406.5
2003 887.8
2004 881
2005 787
2006 1378
2007 728
2008 905
2009 600
2010 891
2011 1119
2012 1138
2013 902
Long term Average 827
Average of last 10 years 903
Source – Water Resources Department, Govt. of Rajasthan
Ground Water Resources & Ground Water Seepage Study
WONDER CEMENT. LTD., BHATKOTARI, NEMBAHERA, CHITTOR, RAJ
45
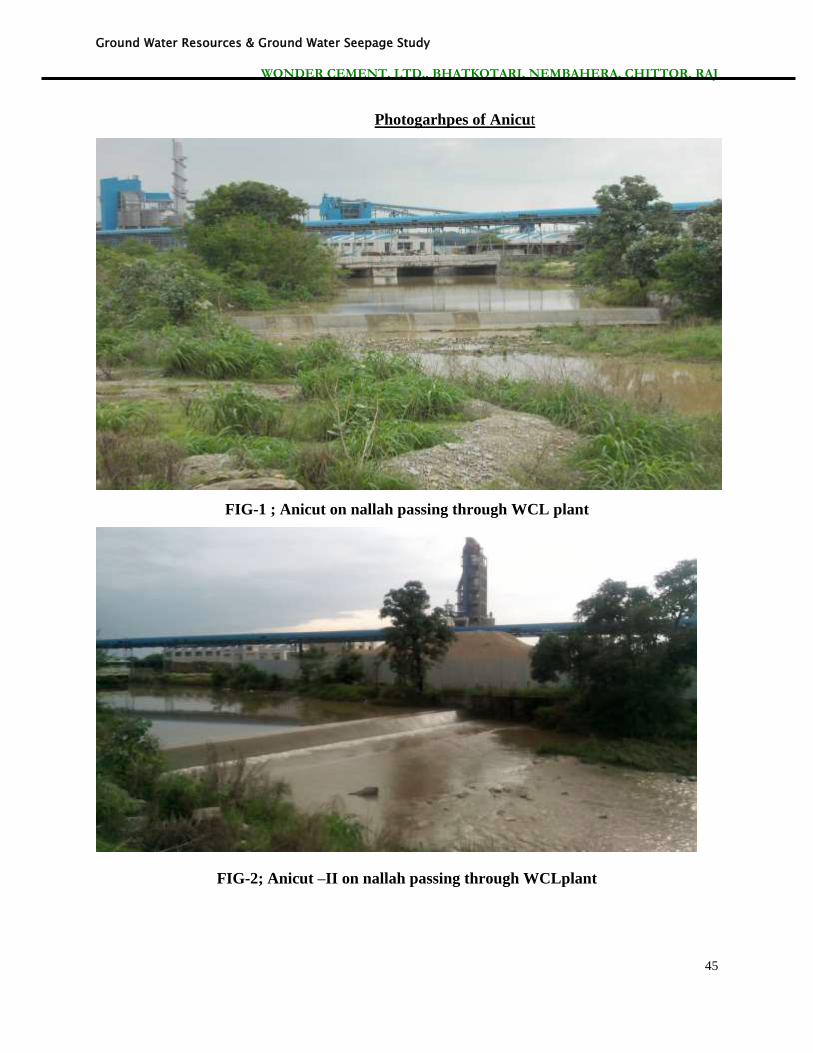
Photogarhpes of Anicut
FIG-1 ; Anicut on nallah passing through WCL plant
FIG-2; Anicut –II on nallah passing through WCLplant
Ground Water Resources & Ground Water Seepage Study
WONDER CEMENT. LTD., BHATKOTARI, NEMBAHERA, CHITTOR, RAJ
46
3. Recharge due to mining pit
Rain water is stored in mining sump pit which has current storage capacity of 340000
mcm. For area having limestone/clayey formation the infiltration factor can be considered as
8 % (as per ground water estimation resources estimation committee report.
Recharge volume = 340000 x 0.08
= 27200 cum /annum
4. Recharge due to stone quarry
There are two stone quarries adjoin the mine lease area. These stone quarries have average
depth of 6 m. Rain water is collected in these quarries in monsoon season and remain in the
pit for 5-6 months. Average water level in quarries can be considered as 3 m. Water seepage
from unlined water body can be 8 % as per ground water estimation resources estimation
committee report. Recharge from stone quarries will be:
Area x average depth of water column x percentage of seepage
= (25875+12000) x 3 x 0.08
= 9090 cum/annum
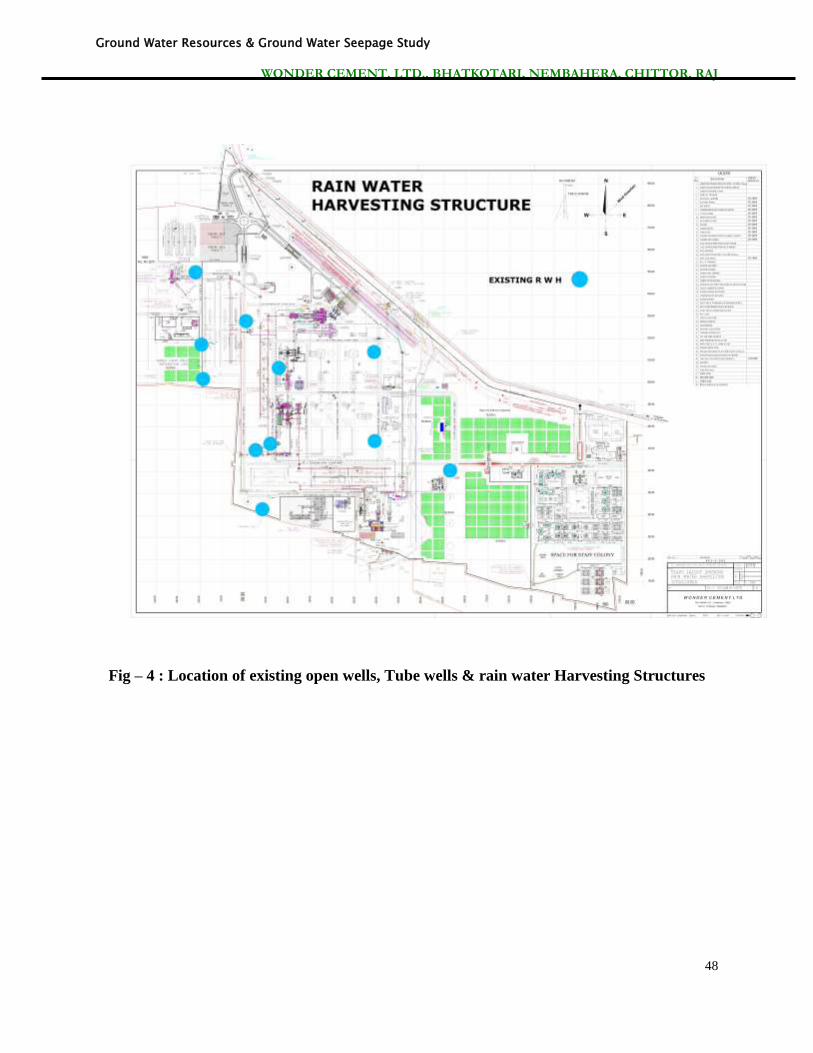
5. Rain water harvesting in Cement Plant & Mines
There are tube wells/ open wells located at different places approximately at equal distance
along the path of storm water drainage inside the cement plant and limestone mines. Existing
tube wells/ open wells are being used for rain water harvesting (Fig - 4). Rain water from
plant buildings, plant floors and unpaved land are being /will be collected in storm water
drains and is discharged in the well located in each zone.
Silt and rubbish in the storm water are being removed to prevent its entry into the wells.
Deposition of silt and trash will reduce capacity of bore well and open wells. Silt and trash is
also removed in the silting chamber and sand-gravel filter. Silt chamber & filter of existing
Ground Water Resources & Ground Water Seepage Study
WONDER CEMENT. LTD., BHATKOTARI, NEMBAHERA, CHITTOR, RAJ
47
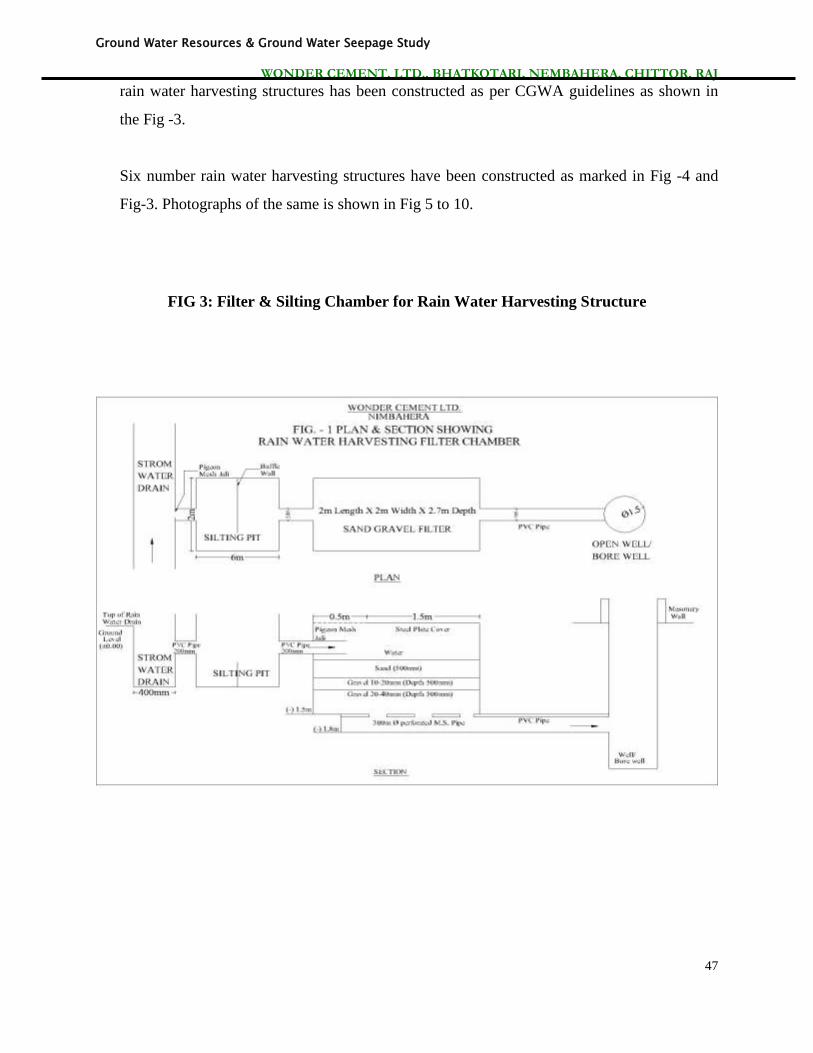
rain water harvesting structures has been constructed as per CGWA guidelines as shown in
the Fig -3.
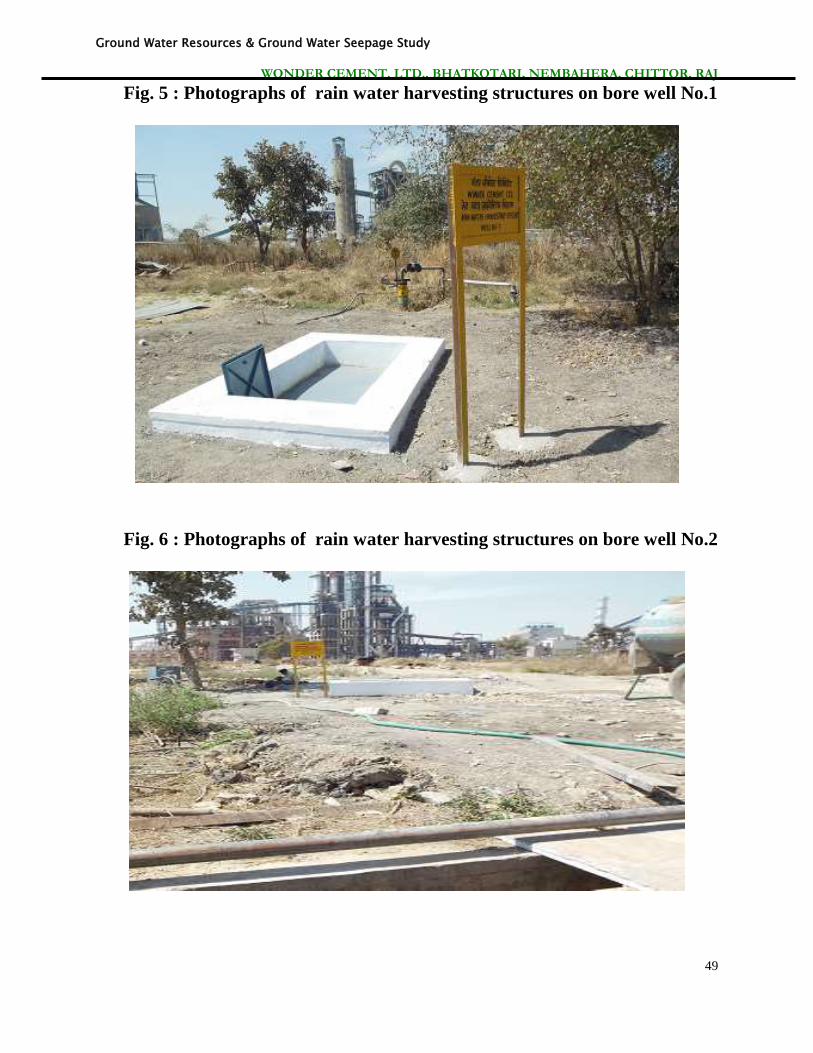
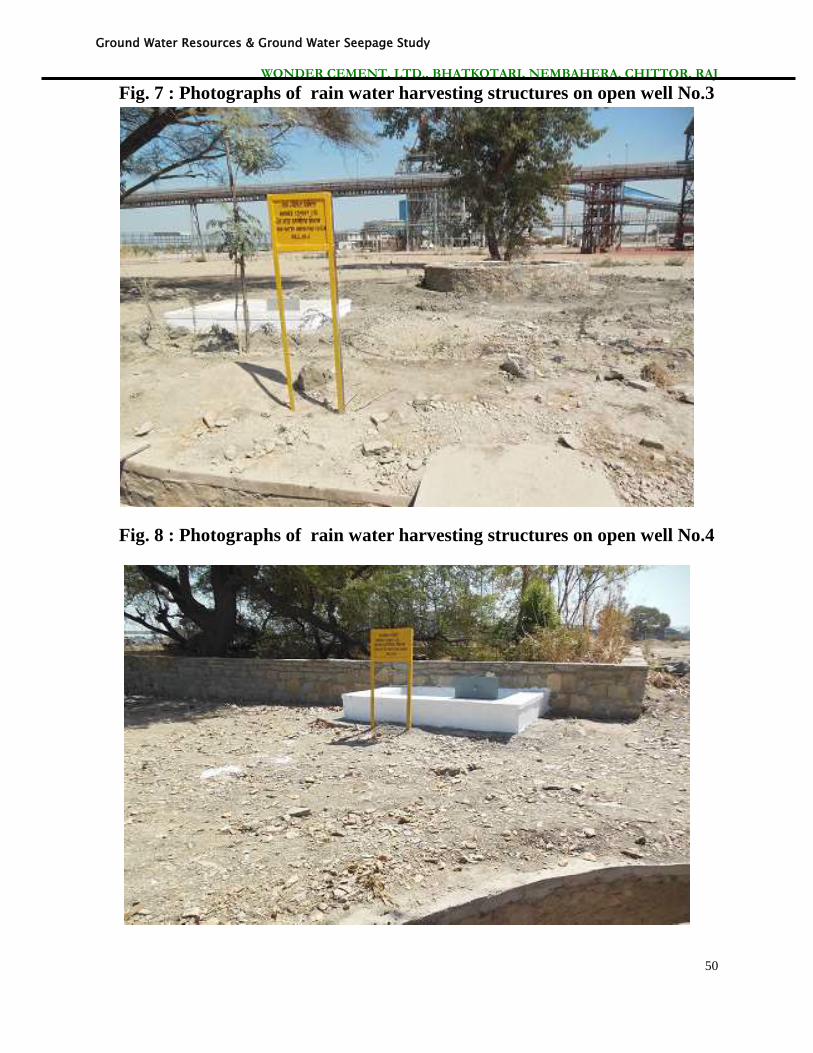
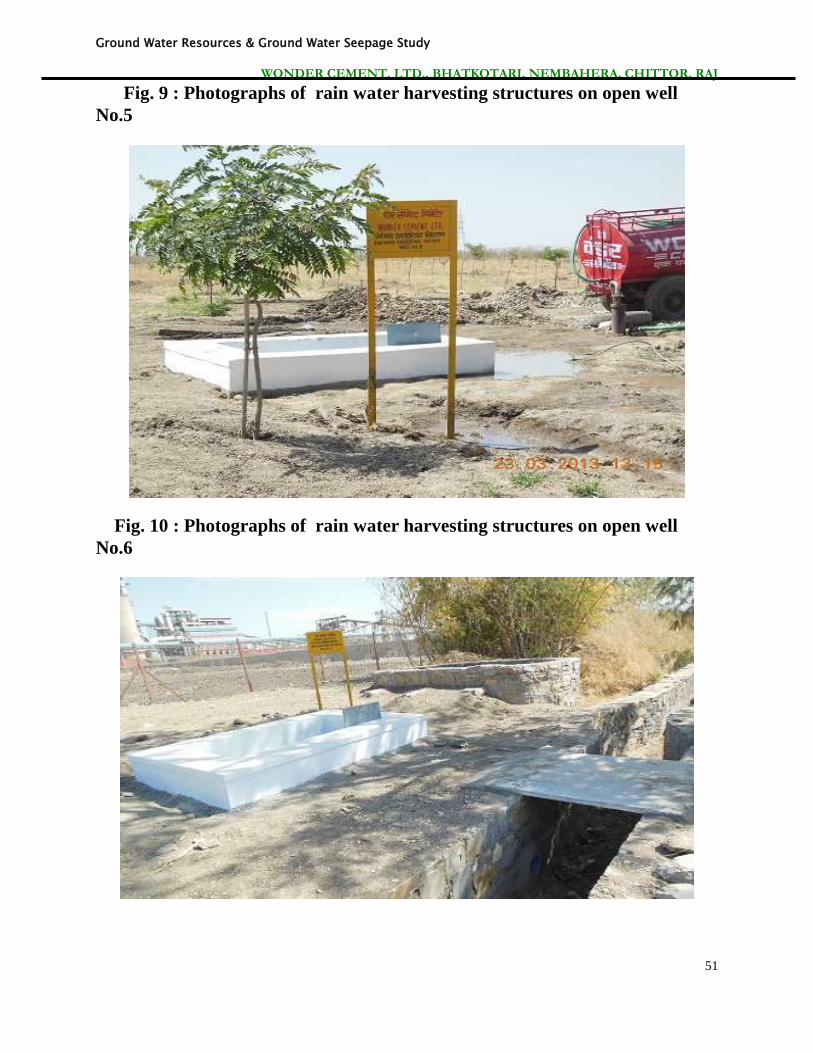
Six number rain water harvesting structures have been constructed as marked in Fig -4 and
Fig-3. Photographs of the same is shown in Fig 5 to 10.
FIG 3: Filter & Silting Chamber for Rain Water Harvesting Structure
Ground Water Resources & Ground Water Seepage Study
WONDER CEMENT. LTD., BHATKOTARI, NEMBAHERA, CHITTOR, RAJ
48
Fig – 4 : Location of existing open wells, Tube wells & rain water Harvesting Structures
Ground Water Resources & Ground Water Seepage Study
WONDER CEMENT. LTD., BHATKOTARI, NEMBAHERA, CHITTOR, RAJ
49
Fig. 5 : Photographs of rain water harvesting structures on bore well No.1
Fig. 6 : Photographs of rain water harvesting structures on bore well No.2
Ground Water Resources & Ground Water Seepage Study
WONDER CEMENT. LTD., BHATKOTARI, NEMBAHERA, CHITTOR, RAJ
50
Fig. 7 : Photographs of rain water harvesting structures on open well No.3
Fig. 8 : Photographs of rain water harvesting structures on open well No.4
Ground Water Resources & Ground Water Seepage Study
WONDER CEMENT. LTD., BHATKOTARI, NEMBAHERA, CHITTOR, RAJ
51
Fig. 9 : Photographs of rain water harvesting structures on open well
No.5
Fig. 10 : Photographs of rain water harvesting structures on open well
No.6
Ground Water Resources & Ground Water Seepage Study
WONDER CEMENT. LTD., BHATKOTARI, NEMBAHERA, CHITTOR, RAJ
52
Rainfall Recharge inside the Industrial Unit
5.1 Roof Top Rainwater Runoff
The Industry has setup a cement plant and residential area for the staff. These areas have
different buildings with RCC and V shaped roof. To collect water from flat RCC roof drainpipes
have been installed in the buildings. These drain pipes are connected to main rainwater
collection pipes, provided with collection chambers. In case of V shaped roof rainwater is
collected through gutters attached at the end of the roof and these gutters are connected to
rainwater pipes.
Average Rooftop Rainwater Runoff Available:
= A x Rf x AvRc
Where,
A = Roof top area = 159600 Sq.m
Rf = Rainfall = 827 m.m. (Average)
Average rainwater runoff available
= 159600 x 0.827 x 0.85
= 112190 Cum. ----------------- (A)
5.2 Black Topped Roads and Cemented Area
The project area has approach roads from entry gate to different buildings. These roads are
6m wide. The project area also has parking and other cemented portion. Slop of these
cemented area and roads are maintained in such a way that the available runoff should move
towards the open drains and this water shall be taken to the recharge tube wells/ open wells.
Total road and cemented area is about 176200sq.m. Taking 70% as runoff coefficient for
paved area, the availability of water has been worked out as under
Average Rainwater Runoff Available From Paved Area:
= A x Rf x AvRc
Where,
A = Total Paved area = 176200 Sq.m.
Rf = Rainfall = 827 m.m. (Average)
Average rainwater runoff available
= 176200 x 0.827 x 0.7

Ground Water Resources & Ground Water Seepage Study
WONDER CEMENT. LTD., BHATKOTARI, NEMBAHERA, CHITTOR, RAJ
53
= 102002 Cum. --------------- (B)
Total rainwater thus available from rooftop area and paved area is diverted to recharge
existing tube wells or existing open wells through rainwater drains and injected into the
aquifer after passing through the filter pit
5.3 Open land & Green belt area (Plant & Residential Area)
The total plant & residential area is 191064 Sq.m., out of which rooftop area is 159600 Sqm,
road and cemented area is 176200 Sqm,. Balance open land/green belt area is 1574800 Sqm.
Taking 15% as natural recharge coefficient for Limestone area expected recharge to
underground aquifer will be:
= 1574800 x 0.827 x 0.15
= 195353 Cum. --------------- (C)
Expected Rainwater Recharge from all the above structures
= (i) + (ii) + (iii)
= 112190 +102002+195353
= 409545 Cum
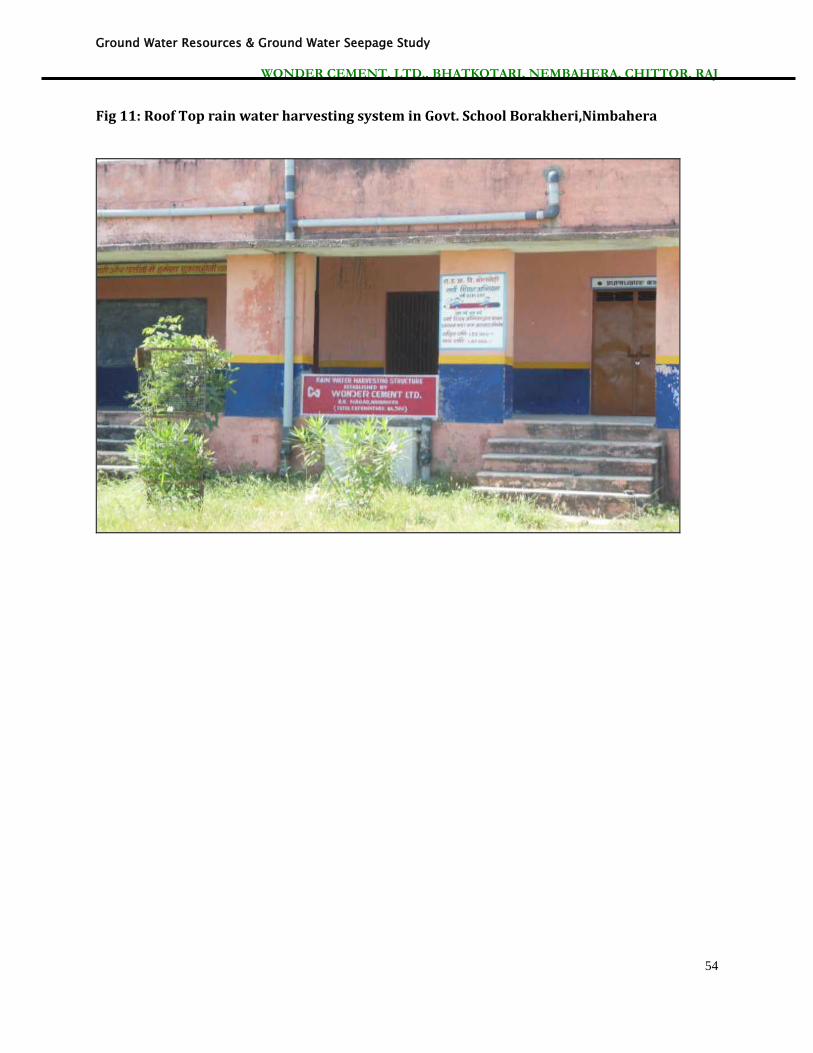
6. Rainwater harvesting in Govt. School-Village Borakheri
Rainwater harvesting structure has been constructed by WCL in Government School,
Borakheri near the cement plant as shown in Fig 11. Roof top water from school building is
collected in PVC pipes and after de-silting in sand filter, water is discharged in to school
borewell. Approximately 210 m3 water is recharged through the system.
Ground Water Resources & Ground Water Seepage Study
WONDER CEMENT. LTD., BHATKOTARI, NEMBAHERA, CHITTOR, RAJ
54
Fig 11: Roof Top rain water harvesting system in Govt. School Borakheri,Nimbahera
Ground Water Resources & Ground Water Seepage Study
WONDER CEMENT. LTD., BHATKOTARI, NEMBAHERA, CHITTOR, RAJ
55
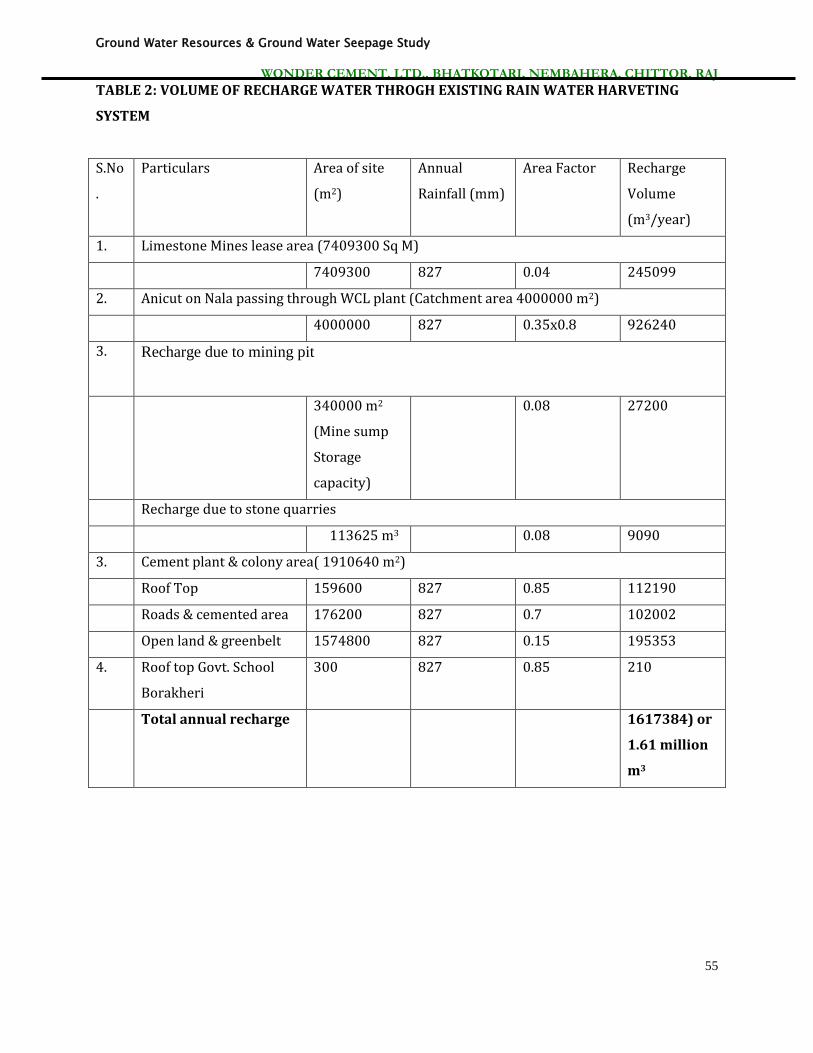
TABLE 2: VOLUME OF RECHARGE WATER THROGH EXISTING RAIN WATER HARVETING
SYSTEM
S.No
.
Particulars Area of site
(m2)
Annual
Rainfall (mm)
Area Factor Recharge
Volume
(m3/year)
1. Limestone Mines lease area (7409300 Sq M)
7409300 827 0.04 245099
2. Anicut on Nala passing through WCL plant (Catchment area 4000000 m2)
4000000 827 0.35x0.8 926240
3. Recharge due to mining pit
340000 m2
(Mine sump
Storage
capacity)
0.08 27200
Recharge due to stone quarries
113625 m3 0.08 9090
3. Cement plant & colony area( 1910640 m2)
Roof Top 159600 827 0.85 112190
Roads & cemented area 176200 827 0.7 102002
Open land & greenbelt 1574800 827 0.15 195353
4. Roof top Govt. School
Borakheri
300 827 0.85 210
Total annual recharge 1617384) or
1.61 million
m3
Ground Water Resources & Ground Water Seepage Study
WONDER CEMENT. LTD., BHATKOTARI, NEMBAHERA, CHITTOR, RAJ
56
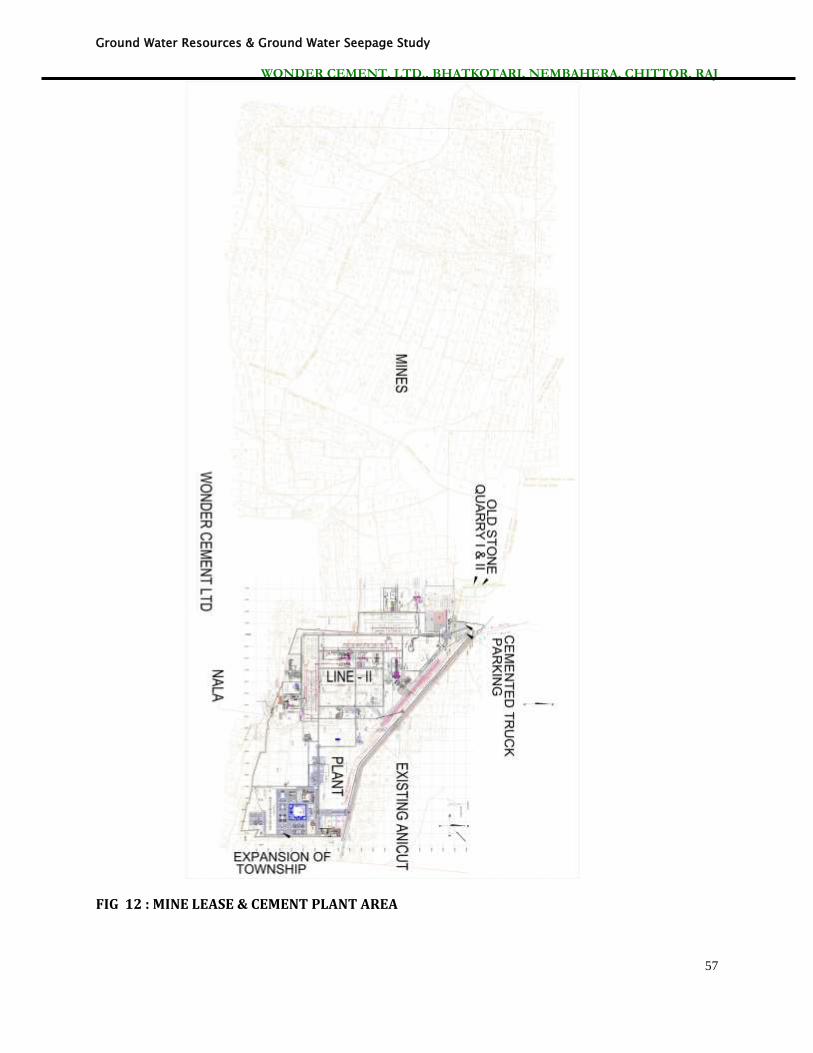
7. Proposed additional Rainwater Harvesting Measures
Plant expansion work for Cement Plant Line II is in progress.. Open area equal to 84375 m2 will be
converted into covered industrial shed as shown in Fig 12. Rain water from the industrial covered
shed from this area will be diverted to nearest two number tube wells through storm water drains
and rain water filter system. Open area equal to 44375 m2 as shown in Fig 12 will be converted
into cemented yard for truck parking. Rain water from the yard will be collected in drains and will
be diverted to one number tube wells through filter chambers for recharge of wells. Due to
construction of additional quarters in the township, additional 70000 m2 roof top area will be
available for rain water harvesting. One number Rain water harvesting structure in nearest well be
constructed to recharge additional rain water volume of township expansion area. Total new 4
number rain water harvesting structure will be constructed.
Ground Water Resources & Ground Water Seepage Study
WONDER CEMENT. LTD., BHATKOTARI, NEMBAHERA, CHITTOR, RAJ
57
FIG 12 : MINE LEASE & CEMENT PLANT AREA
Ground Water Resources & Ground Water Seepage Study
WONDER CEMENT. LTD., BHATKOTARI, NEMBAHERA, CHITTOR, RAJ
58
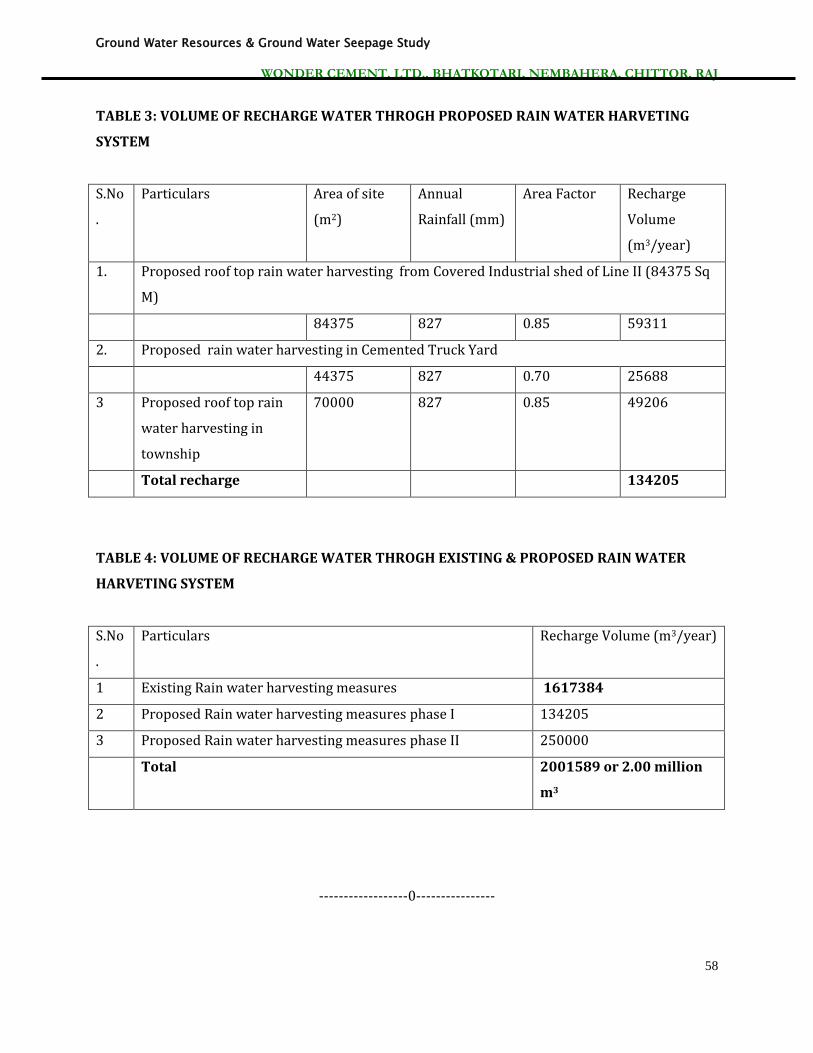
TABLE 3: VOLUME OF RECHARGE WATER THROGH PROPOSED RAIN WATER HARVETING
SYSTEM
S.No
.
Particulars Area of site
(m2)
Annual
Rainfall (mm)
Area Factor Recharge
Volume
(m3/year)
1. Proposed roof top rain water harvesting from Covered Industrial shed of Line II (84375 Sq
M)
84375 827 0.85 59311
2. Proposed rain water harvesting in Cemented Truck Yard
44375 827 0.70 25688
3 Proposed roof top rain
water harvesting in
township
70000 827 0.85 49206
Total recharge 134205
TABLE 4: VOLUME OF RECHARGE WATER THROGH EXISTING & PROPOSED RAIN WATER
HARVETING SYSTEM
S.No
.
Particulars Recharge Volume (m3/year)
1 Existing Rain water harvesting measures 1617384
2 Proposed Rain water harvesting measures phase I 134205
3 Proposed Rain water harvesting measures phase II 250000
Total 2001589 or 2.00 million
m3
------------------0----------------