Embed Size (px)
Citation preview

1
Women in Agriculture: An evaluation of theCentral scheme in Palakkad district (Kerala)
B. Sreekumar
Discussion Paper No. 302001
Kerala Research Programme on Local Level DevelopmentCentre for Development Studies
Thiruvananthapuram
2
Women in Agriculture: An evaluation of theCentral scheme in Palakkad district (Kerala)
B. Sreekumar
EnglishDiscussion Paper
Rights reservedFirst published 2001Editorial Board: Prof. P. R. Gopinathan Nair, H. ShajiPrinted at:Kerala Research Programme on Local Level DevelopmentPublished by:Dr K. N. Nair, Programme Co-ordinator,Kerala Research Programme on Local Level Development,Centre for Development Studies,Prasanth Nagar, Ulloor,Thiruvananthapuram 695 011Tel: 0471-550 465, 550 491Fax: 0471-550 465E-mail: [email protected]: http://www.krpcds.org/Cover Design: Defacto Creations
ISBN No: 81-87621-32-X
Price: Rs 40US$ 5
KRPLLD 2001 0750 ENG

3
Contents
Introduction 5
The scheme 8
Women studies: An overview 15
Scope and Method 19
Analysis and Findings 21
Conclusions and Suggestions 36
Appendix I Organisational Set-up 44
References 46

4
5
Women in Agriculture: An evaluation of the Central scheme inPalakkad district (Kerala)
B. Sreekumar*
1. Introduction
The Human Development Report for 1995 published by United Nations Development Pro-gramme (UNDP) made a striking revelation that there was not a single country where womenenjoyed equality with men. The estimates showed that women performed $ 11 trillion worthof unpaid or invisible economic activity worldwide. According to the findings of the 31-country study, women work longer hours than men do. On an average, women put in moretime on work than men: 13 per cent more in developing countries and six per cent more indeveloped countries. Women bear 53 per cent and men 47 per cent of the burden of work indeveloping countries; the corresponding figures are 51 per cent and 49 per cent in developedeconomies. Women, in fact, contribute more than half the wealth of a nation; yet, they aredenied economic, social, and even legal rights and privileges that are granted to men.
The position of women has always been an ambivalent one in our culture. On the one hand,she is raised to the status of divinity and on the other, treated as one having a status lower thanof man in every walk of life. In India, even after half a century of independence, womenfolkare being subjected to repression, marginalisation, and exploitation notwithstanding the passageof a plethora of laws to protect their rights.
Since Independence, a number of innovative schemes have been launched for the uplift andempowerment of women in our country. India is the first country to give womenenfranchisement. A perceptible shift has come about in the approach to women - from viewingthem as a target of welfare politics to treating them as a critical agent for development.Development had, largely, bypassed women and remained inaccessible to them. Now, theemphasis has shifted again from development to empowerment. Our planning process hasunderscored the need for women’s empowerment if the country were to progress. TheConstitution (73rd Amendment) Act, 1992 that reserved one-third of the seats for women inPanchayati Raj institutions is a major landmark in the path of political empowerment ofwomen. A unique experiment in the world, this measure will go a long way in the uplift ofwomen who constitute half the population of the country. A wholehearted approach and aplanning process conducive to improving the economic status of women should address thereal issue and constraints that have kept them behind.
ACKNOWLEDGEMENT: We acknowledge the able guidance, meticulous care and constructive criticismsof Dr K. Narayanan Nair, Programme Co-ordinator, KRPLLD apart from the financial assistance. Wealso thank the anonymous referees who gave their useful comments, which were extremely helpful during therevisions. We are indebted to the joint Director of Agriculture, Palakkad district for his kind co-operationand support during the work. The study would have been incomplete without the help of the facilitators of thescheme. We express our gratitude to them for the active support on the invaluable co-operation during thestudy. We thank the women members and the farmwomen of the study area, who whole-heartedly co-operated to make their lives and livelihood the subject of our study.
* B. Sreekumar is working with Agricultural and Rural Development through Rapid Action (ARDRA).

6
In order to ensure that women contribute to the process of development, it is essential thatwomen’s own development be taken care of. However, there exist a host of inhibitingfactors – social, economic and political – that prevent women from becoming activeparticipants in the development process.
The traditional notion of confining women to home and hearth has deprived them of adequatehealth and educational facilities. Women are, in general, undernourished and malnourishedand have only low expectancy of life. In the field of education, stereotypes of gender roleshave kept large numbers of girls out of school. Education of girls is affected by their domesticchores including the looking after of young children.
Though women work for long hours, especially in the rural areas, they often go unrecognisedas participants in economic activities. The work a woman puts in has two components (i)work as housekeeper and mother and (ii) work in gainful economic activity. In the case ofrural women, both the components are mixed up. Her services as housekeeper and mother gounrecognised, since they do not get into GDP calculations. In India, employment opportunitiesfor women are shrinking due to modernization and mechanisation. Since most rural womenare illiterate, they seek employment in agriculture as casual labourers in transporting, harvesting,and threshing activities. Rural women cannot aspire to seek jobs outside home because oftraditional prejudices, male domination, and conservative attitudes. Even for the educatedrural women, very few employment opportunities exist. Wage differences exist betweenmen and women for the same work, and there is concentration of women in low-paid jobsand sectors.
Women workers constitute about 33 per cent of the total rural workers in India. Nearly 20per cent of the cultivators, 39 per cent of the agricultural labourers, 32 per cent of thehousehold industrial workers and 15 per cent of other rural workers are women. While only63 per cent of the economically active men are engaged in agriculture, 78 per cent of womenare so engaged. Almost 50 per cent of rural female workers are classified as agriculturallabourers and 37 per cent cultivators. The corresponding proportions of male workers are 24and 55 per cent.
According to the 1991 Census of India, there are about 407 million (48.15 per cent of totalpopulation) females in the country, of which 75 per cent are rural. Of the total population,31.19 per cent are main workers and 3.45 per cent marginal workers. The percentage offemale main workers is 16.48 and marginal workers 6.26. Among the female main workers,55 per cent are cultivators, 43.50 per cent agricultural labourers, and 4.63 per cent engagedin livestock, forestry, fisheries, etc. The distribution of female marginal workers is: 47.91per cent cultivators, 41.43 per cent agricultural labourers, and only 1.64 per cent engagedin livestock, fisheries, etc. The remaining 17.32 per cent of the female main workers and9.02 per cent of the female marginal workers are in the non-agricultural sector. Nearly 63per cent of all economically active men are engaged in agriculture compared to 78 per cent ofwomen.
India being a predominantly agricultural economy, all the developmental activities are centredon farming. However, it is not the farmer alone that needs to be changed to attain the fullest

7
development of rural India. Women also need to be brought into all development activities.The World Conference of the FAO on Agrarian Reforms and Rural Development in Rome in1978 recognised women’s role not only as farmers and members of the rural community atlarge but also emphasised the importance of consulting and involving women in the decision-making process. In India, since the International Conference on Appropriate AgriculturalTechnologies for Farmwomen in 1988 (by ICAR and IARI) in New Delhi, a general awarenessof the concerns for farmwomen has come about. Moreover, it is reported that gender planninghas become an important consideration for any socio-economic developmental approach ofnational and international agencies, especially when it is acknowledged that work potential ofwomen is under-utilised and that women can significantly contribute to the success ofdevelopmental projects.
It is reported that one of the main reasons for failure of development programmes meant forrural women is that the real needs of women have seldom been actively taken into accountwhen projects are planned and implemented. The reason for such neglect is largely the non-inclusion of women and their work in the data for project planning.
The goals of poverty reduction and empowerment of women can be achieved if poor womenare organised into groups for community participation as well as assertion of their rights. InIndia, various forms of the participatory development process have come in for experimentationby various voluntary organisations. The process has given women a considerable sense ofdignity, confidence, and economic independence. That poor women’s creativity, groupdynamics, and self-management are major elements in their march to economic developmenthas already been demonstrated; they have to be given increasing importance in all efforts ataddressing gender issues.

8
2. The Scheme
Background
Though the departmental agencies of the Government are expected to include devel-opment of women as a critical issue on their agenda, the schemes implemented in theagricultural sector have seldom addressed this question; nor have they made provi-sion in their schemes to training and extension services to women farmers. The sys-tem has usually showed bias towards male farmers and their development needs. Norwere techniques generated and transferred to the farm level gender-sensitive.
The experience with some of the projects, externally assisted by Danish and Dutch agencies,in the States of Karnataka, Tamil Nadu, Orissa, and Gujarat has shown that when women aregiven opportunity to undergo training in agriculture and provided with credit and otherfarming inputs, their agricultural performance improves considerably. Therefore, correctiveactions are being taken up in recent years to ensure that agricultural department programmesbecome responsive to the needs of women farmers.
Women farmers need training and assistance to improve farming practices, to purchaseproductive inputs, to decrease their workload and improve efficiency of their performance inprocessing, storage and marketing activities. It was found that training and assistance givento women farmers helps them to surmount cultural barriers that often impede them fromcontacts with agricultural development functionaries.
The Central Government launched the scheme ‘Women in Agriculture’ under the EighthFive-Year plan to make women farmers self-reliant by providing them opportunities to availthemselves of the benefits and opportunities of the existing agricultural system. The projectwas implemented on a pilot basis covering only one district each from selected States viz.,Rajasthan, Haryana, Himachal Pradesh, Punjab, Kerala, Maharashtra, and Uttar Pradesh. Inthe pilot phase seven districts were covered. In Kerala, the project was implemented inPalakkad district.
Objective
The scheme was formulated with a view to motivating and mobilising women farmers througha group approach. Groups formed under the scheme constituted an effective network forchannelling agricultural development programmes and other support systems such as input,technological and extension. The specific objectives of the scheme are listed below:
(i) Organisation / identification of women groups which would act as network for chan-nelling all the agricultural support.
(ii) Need assessment of women farmers in terms of the agricultural support such as input,technological and extension support.
(iii) Prioritising the activities of the individual women’s group to make them “self-help thrift groups”.

9
(iv) Training in management, organisation, entrepreneurship, and decision-making.(v) Enabling them to develop into viable units so that they are able to organise their
own activities, resources, and group interactions.
Target Group
Practising women farmers, decision-makers and operators of farm level activities, preferablyfrom small and marginal farm families and whole families having the capacity to adopt newtechnologies and improved farm practices constituted the target group.
Project Area
The project area in Palakkad district of Kerala included 30 villages from the following sixselected blocks:
Block Village(i) Palakkad Parli I
Parli IIsPirayariAkathetharaKongad
(ii) Ottappalam Ottappalam IOttappalam IILakkidi ILakkidi II Mannur
(iii) Kollengode PolppullyKodembuElappully IElappully II
(iv) Chittoor ChittoorNalleppiliKuttippalamValiyavallampattyPazheniyarpalayamKunnumkattupathi
(v) Alathur Erimayur IErimayur IIAlathurKavasseri
(vi) Kuzhalmannam Kuzhalmannam IKuzhalmannam IIMathur IMathur IIKottayi IKottayi II
10
The State Department of Agriculture was entrusted with the responsibility of formulatingplans and working with the women groups in implementing them in the selected blocks.Graduates in Agriculture / Home science and related areas were appointed as facilitators forthe scheme. These facilitators were given induction training in agriculture and alliedaspects.
Thirty groups, each consisting of 20 women, were formed by the facilitators in the 30 villagesafter collecting baseline information through Participatory Rural Appraisal. Thus, the schemecovered 600 farmwomen in 30 villages in six blocks of Palakkad district. The facilitatorswere responsible to prioritise the activities of each group and to conduct technical trainingprogrammes at the village-level for the groups. After each training session, the trainedfarmwomen were encouraged and supported to practise skills they acquired.
Each group selected a link worker who was an active and progressive member in thegroup to act as convenor of the group. The link workers were also given training inleadership skills as well as production techniques twice a year. Further, they weregiven monetary incentives for organising group meetings.
Demonstrations of results were held in each cropping season. Study tours were organised forthe farmwomen beneficiaries by taking them in groups to various research stations and StateGovernment farms. For the facilitators, refresher courses of two-week duration were organisedevery year. At least once in a month, the facilitators were expected to address the membersof the women groups for follow-up and feedback activities. Linkages were established withthe existing extension system by facilitators attending the training courses, workshops andother meetings. Regular extension support was provided to the beneficiaries through the massmedia.
Under the scheme, Mahila Goshti was organised every year. All the women farmers tookpart in the Goshti and were encouraged to display their activities.
The organisational set-up of the scheme and the duties and responsibilities of facilitators andlink workers are shown in Appendix I.
Implementation of the scheme
The scheme was implemented on the basis of the findings of a survey of women in farmhouseholds. Out of 900 farmwomen surveyed, 600 interested in agriculture and allied subjectswere selected as beneficiaries of the projects under the scheme. Thirty groups, each consist-ing of 20 farmwomen, were formed in 30 villages by documenting the baseline informationthrough participatory rural appraisal technique.
Most of the women were relatively young; only 30 per cent were above 45 years of age.Moreover, nearly four per cent were below 18 years. Except about one per cent, all thewomen surveyed were literate: among them 31 per cent had secondary education and about10 per cent were college-educated. Only 16 per cent of them were unmarried. Even the

11
proportions of the widowed (six per cent) and the separated (two per cent) among the marriedwere relatively low. It was found that the practice of living in extended families was wide-spread among the sample; it was found that 71 per cent of the women surveyed belonged tothis type. The extent of land held by the households of these women was, in general, verylow. A large majority of them belonged to the category of marginal farmers (73 per cent) orsmall farmers (19 per cent). All the women were engaged in household chores and farmingactivities. Only about 55 per cent undertook some activities categorised under poultry farm-ing, dairy or animal husbandry. The proportion of agricultural labourers was only about one-eighth. In this area, families belonging to the forward communities accounted for only aboutone-fifth. The others were either of Scheduled Castes (5%) or other backward communities(75%).
The crops cultivated by the farmwomen include paddy, coconut, banana, ginger, turmeric,vegetables, and tubers like sweet potato and tapioca.
All the women surveyed expressed desire for the required training in agriculture and alliedsubjects. Through training programmes and by improving the technical know-how, it waspossible to improve productivity and economic viability to a considerable extent.
Input support was planned in terms of supplying them with mini kits of seeds, fertilisers,small agricultural implements, and seedlings of fruit plants, spices, and plantation crops.
Extension support was to be given through linkage with the Agricultural Department andmaking them aware of the schemes and other activities implemented through Krishi Bhavan,Dairy Department, and Animal Husbandry Department.
In the light of the baseline survey, the following were the needs appraised for designingfuture training programmes based on critical farming practices.
(i) Package of cultivation practices of major crops in the area such as coconut, arecanut,rice, vegetables, ginger, turmeric, and rubber;
(ii) Cultivation of medicinal plants, mushrooms, fruit trees and plants, flower plants (suchas bush jasmine), and ornamental plants; kitchen gardening; sericulture;
(iii) Plant propagation, agro-forestry;
(iv) Water management, moisture conservation (eg: through burial of seeds in the beds ofcoconut trees); seed treatment in rice, ginger, etc;
(v) Use of bio-fertilisers; preparation of pesticides such as bourdeaux mixture; rodentcontrol;
(vi) Soil sample collection and testing;
(vii) Rearing of cattle, poultry, rabbit, etc., and rearing technology;
(viii) Extension education and communication skills;
(ix) Human nutrition and balanced diet;
(x) Banking.

12
According to the needs assessed through baseline survey, the following activities wereprioritised for conducting training programmes.
(i) Cultivation of rice; coconut; bush jasmine; medicinal plants; mushroom; banana,pineapple and mango; ginger and turmeric; sericulture, kitchen-gardening;
(ii) Processing of fruits and vegetables;(iii) Plant propagation;(iv) Preparation of home-made pesticides and use of bio-fertilisers;(v) Soil sample collection and testing;(vi) Rearing of cattle, poultry, and rabbit; bee-keeping; pisciculture;(vii) Preparation of milk products.
Activities in 1994-‘95
Village-based training
To begin with, village-based training camps of three-day duration were organised for thegroups by facilitators. Specialists from the Agricultural University and the AgricultureDepartment and officials from banks were the guest speakers. The farmwomen were giventraining in various agricultural and allied activities and were encouraged to practise the skillsthat they have acquired.
Link-workers training
The training for link-workers was organised for the first time at RATT Centre, Malampuzha,for three days. The focus was on cattle-rearing, kitchen-gardening, bush-jasmine cultivation,bio-fertilisers, and plant propagation. Specialists from the Agriculture University and theState Agriculture Department imparted the training.
Result demonstration
Result demonstration on application of bio-fertilisers and their impact on yield of vegetablesgrown in summer paddy fallows were also conducted.
National-level sharing workshop
National-level sharing workshop was conducted on 1 and 2 February 1995 at Palakkad. TheJoint Director of Women’s Programme and the Regional Home Economist from Delhi, theAdditional Director of Agriculture, the Joint Director of Agriculture Department and othersenior officials from Thiruvananthapuram attended the workshop and conducted groupdiscussion for women farmers.
Study tour
Two study tours were organised - each trip consisting of 25 and 20 farmwomen - to the StateAgriculture Fair, Thiruvananthapuram, and to an International fair, Agriculture Expo 1995.

13
Mahila Goshti
A mahila goshti was organised on 31 March 1995 at Palakkad Town Hall. All womenfarmers were invited to participate. Nearly 500 women farmers took part in this mahilagoshti. Participants were given a chance to display and conduct sale of their various agriculturalproducts. Consultants from several specialised areas addressed the women farmers anddiscussed their issues and problems.
Activity in 1995-‘96
Second village-based training
The second village-level training was conducted for 24 groups. Classes on subjects likecultivation of coconut and rice, rearing of poultry and cattle and banking were conducted.Farmers were allowed to practise the skills imparted after the classes.
Link-workers’ training
Three link-workers’ training courses were conducted in 1995-‘96. Importance was givento activities such as processing of vegetables and fruits, medical and health care ofanimals, vegetable cultivation, use of vegetables as protective food and preparation of milkproducts.
Result demonstration
For result demonstration, 180 plots, each 50 cents in extent, were used for demonstration forthe 30 groups. A new variety of blackgram, T-9, was cultivated. Soyabean, medicinal plants(kacholam), and grams were also cultivated in these plots.
Mahila Goshti
The second mahila goshti was organised on February 22, 1996, at Palakkad Municipal TownHall. About 580 women farmers attended the seminar. The participants were given opportunityto exhibit their agricultural products. A workshop was also conducted in which experts andfarmers interacted.
Registration of groups
All the 30 groups were registered in December and 26 groups opened joint bank accounts inthe name of facilitators and link-workers.
One-day follow-up programme
Facilitators conducted monthly group meetings. These meetings were conducted for follow-up and feedback activities.
14
Linkage with Agricultural Department
The facilitators attended monthly meeting and fortnightly workshop to keep themselves abreastof the technical developments in the field of agriculture.
Study tour
Two study tours each of seven-day duration were conducted. As many as 30 farmwomenwere taken to College of Agriculture, Vellayani, and Indo-Swiss project on livestock atMattupetty. In the second tour programme, 13 farmers were taken to the State AgriculturalFair in Thiruvananthapuram. Facilities to sell their products were also arranged at the fair.
Activity in Report 1996-‘97
Two refresher courses/training programmes were arranged. Two study tours were conductedfor the farmwomen to Regional Agricultural Research Station, Ambalavayal, NRCS,Peruvannamuzhi, CWRDM, Kunnamangalam, and Tropical Botanical Garden and Researchinstitute, Palode.
Mahila goshtis were arranged at Palakkad district. Participants were given opportunities todisplay and market their agricultural products. Result demonstration on application of bio-fertilisers and training for link workers were also conducted.
Other schemes realised by the groups as part of the programme were the following:
(i) Cultivation and processing of tomato in Kozhinjampara area of Palakkad district;
(ii) Distribution of fruit plants and setting up a processing unit in Muthalamada area ofKollengode block;
(iii) Cultivation of vegetables in Kuzhalmannam and Alathur blocks;
(iv) Setting up of a unit by women farmers for making chips, murukku, kondattam, andother products;
(v) Cultivation of medicinal plants, Bush Jasmine and Mushroom;
(vi) Setting up of broiler poultry unit, poultry (layer) units, and rabbit-rearingunits.

15
3. Women Studies: An Overview
Need for gender planning
Several studies on women’s status and problems conducted in recent times have pointed outthat gender discrimination exists throughout the world, but that its intensity is felt in the dailylives of women and children in developing countries. Reference is made in the followingsections to some selected studies made in Africa, Sri Lanka, Thailand, and India to indicatethe ‘plight of women’ in these countries. Tagwireyi (1997) notes that despite providingabout 60 to 80 per cent labour in food production, women in Africa receive little from theagricultural extension services in that country due to the traditional prejudiced attitude to-wards women, lack of time on their part to attend meetings, and their limited decision-making powers. It is observed that women use their wage income more on food purchasethan men do; and children of women with some independent source of income are unlikely tobe malnourished. She suggested that development of policies that addressed the needs ofrural women should be encouraged, including the promotion of technology to reduce theworkload, the pre-school programme for children and education and literacy programmes.
Pankhurst (1988) observes that women in Zimbabwe used increasingly secretive and illegitimatemeans to ensure the well-being of their children and, to a lesser extent, to protect their ownlivelihood. As women provide most of the agricultural labour, their action often has a directbearing on the ways in which agriculture was practised.
Burra (1989) points out that in many parts of India, male and female working children aretreated differently, whether in the household, in agriculture or in unorganised industry. It isassumed that the destination of a girl is marriage; she is therefore deprived of every right inlife – education, health care, property, and gainful employment. Boys are, on the otherhand, given education; their health taken better care of; they have to be equipped for takingup work since they are expected to provide support to their parents in old age.
In the unorganised sector, girls work at home as helpers to their mothers and in low-paidsubcontracted jobs. Their work does not lead to skill formation; nor is it perceived to be ofany economic value. The present legislation and policy in India on child labour, whichoverlooks the problems of the vast majority of working girls, needs to be reformed.
Though women are considered marginal workers, their participation as agricultural labourersand unpaid family workers is crucial to achieve optimum use of available resources. Ruralwomen take part in most aspects of rice farming. A survey conducted in 1983 in the Mahaweliarea of Sri Lanka revealed that 15 per cent of women apply fertiliser and only five per centapply pesticides. These activities are primarily male-dominated. The lack of easy access toinformation has led to unnecessary fear among rural women towards the use of pesticidesand fertilisers. Women’s participation in highland cultivation in Mahaweli was 65 percent compared with 38 per cent in rice. Assisting women to use fertilisers and other inputs onthe homestead can lead to the realisation among women that they could achieve a betterquality of life by improving crop production without working as hired labourers (Alahakone,1989).

16
Since policy makers in the Government do not view them as productive workers, women areleft out of sectoral economic planning. Donor agencies can help bring women into themainstream of the planning process and the economy by commissioning studies of women’swork by sectors and by supporting sector-based pilot projects that involve women. In India,this has been done successfully in at least two fields: dairy farming and silk production. Non-governmental agencies working with donor agencies have influenced the Government policyeffectively. This has not, however, taken place in agriculture, where most women work(Chen, 1989).
The exclusion of women farmers from agricultural development programmes has detrimentaleffects. Paper by Thomson and Sarikahputi (1989) argues that most agencies mandated tostrengthen women farmers in Thailand have regarded women as mere housewives responsibleonly for home management activities. A commitment on the part of the Government isessential if women are to be integrated into mainstream agriculture and rural development.They have recommended an organised effort to sensitise concerned officials on the issues anda training programme in gender analysis to the government officials.
Rural women in Gambia are increasingly being drawn into the development process throughinvolvement in various income-generating projects, such as vegetable cultivation. Thegovernment agencies and non-governmental organisations through spontaneous self-helpschemes sponsor these schemes. The consequence of involvement in such projects is thattime becomes a scare resource for rural Gambian women: Women not only participate inhorticultural projects but are also responsible for household activities. All these tasks areperformed without any modern equipment. It is suggested that the rural development processin Africa will be frustrated if women’s time is not released from traditional, laborious, andenergy-consuming domestic and agricultural duties (Barrett and Browne, 1989).
Malima (1988) who studied the problems of women in Tanzania suggested that the impact ofwomen’s activities on the farming system should be fully appreciated for agricultural researchto be successful. Their needs and concerns should be understood, their traditional roles andneeds taken account of and their potential for actively contributing to a nation’s economicand social development fully explored in all aspects of project planning, project design,implementation, and evaluation.According to Heyzer (1989), women working in plantationsin South East Asia are particularly hard hit by fluctuations in international markets and bynew technologies. Although commercialisation of agriculture has meant more paid farmjobs for women, they work under more miserable conditions, for longer hours and for lowerwages than those for men. To escape poverty, thousands of women have migrated from theirown countries to seek employment, often as domestic workers to countries in the Middle Eastwhere, despite better wages, they face social and psychological isolation and abuse. To breakout of this situation, the realities faced by low-income women must be given priority inmainstream development planning and implementation.
Functioning of self-help groups
NABARD (1997) defined Self-Help Group (SHG) as a homogenous group of rural poor,voluntarily formed to save whatever amount they can conveniently save out of their earnings

17
and who mutually agree to contribute to a common fund of the groups to be lent to themembers for meeting their productive and emergent credit needs.
Rao and Zeller (1998) note that the quality of functioning of self-help groups can be judgedfrom the regularity of its meeting, savings, and loan repayments. Involvement of leaders,participation of all members, and well-maintained records also speak about the quality ofSHG functioning.
Meeting of the self-help groups at regular intervals is necessary (Panda and Mishra, 1996)since it ensures, besides helping in creation of group bondage, participation of members anddemocratic functioning of the group. It helps in-group planning, proper management offunds, enabling members to resolve conflicts, exchanging ideas, and ensuring participationin decision-making process.
Participation and decision-making
A study conducted by Charyulu and Seetaram (1988) in Uttar Pradesh, quantified the impactof new technology on the level of employment of women and the role of women in decision-making on the farms. They noted that women’s role in decision-making did not correspondto their contribution to agricultural production. Removing decision-making power from themost involved workers is considered inefficient. They recommended technological innova-tion and easing of women’s workload.
Veena (1990) reveals that participation of farmwomen decreases with increase in thesize of farm and that division of work is done based on nature of work and culturalvalues.
Krishna and Thankamani (1993) reported that women participated actively and dominantlyin the case of household decisions like the source of fuel and investment on household goods.In more than 90 per cent of the decision, the participation of women is only supportive innature. Illiteracy and lack of knowledge and awareness are the major reasons for low partici-pation.
Women members are found to be more sincere in their regularity and discipline. Most of theSHGs formed are women-dominated mainly emphasising on women’s uplift and empower-ment [Dwaraki, et al. (1996)].
Qualitative and quantitative changes
The goals of poverty reduction and empowerment of women could be effectively achieved ifpoor women are organised into groups for community participation as well as for assertion oftheir rights. In India, several models of participation development were tried out by variousvoluntary organisations successfully. The process has given women a new sense of dignity,confidence, and economic independence to a certain extent. It has been demonstrated thatcreativity, group dynamics, and self-management are major elements in tackling genderissues.

18
Acharya and Basu (1996) observed that the individual and collective consciousness that de-veloped in the process of formation of SHGs had not only empowered women economicallybut had enhanced their self-esteem as well. According to them, empowerment of poor womenin rural areas has enabled them to meet their credit needs for consumption and productiveactivities, which has, in turn, ensured them economic independence. In consequence, theireconomic status and bargaining positions within the households have been strengthened.
According to Ahmed (1999), empowerment also enables women’s groups to shape themselvesas social activists by trying to check malpractices and discrimination in implementation ofdifferent schemes in the system.
Acceptance of job and extent of monetary gain
Mundra and Kothari (1992) found that a marked difference existed between the number ofwomen trained and the number of women accepting the trade as a means of self-employment.Of the women trainees under TRYSEM programme, as many as 70.3 per cent do not acceptthe trade as a source of self-employment. Lack of confidence, skill and money, non-availabilityof raw materials and marketing facilities, and pre-occupation with household work are reportedas reasons for non-acceptance of job by TRYSEM-trained women. They showed thatTRYSEM-training could help women beneficiaries to utilise six hours on gainful employmenton a daily basis by way of engagement in the job in which they got training. The womenbeneficiaries were able to earn Rs 50 to Rs 325 per month through engaging themselves in thetrade in which they were trained.
Group interaction
Norman et al. (1998) stated that groups could be effective in increasing and improving thepattern of farmer participation. Groups keep farmers in the foreground, provide a means ofusing social dynamic constructively, and create multiplier effects that assist farmer-to-farmerspread of relevant technology.
Studies by NABARD (1997) revealed that as people spent more time together on a regularbasis, they became friendly. These interactions typically lead to discovery of common interestand great involvement in common issues.
The preceding discussion thus shows that while gender discrimination is a severe problemthat afflicts most developing countries, group activity and enlightened government policieshave begun to show some positive results in countries such as India. The problems that self-help groups encounter are numerous; but the forces of change unleashed by them have enormouspotential for change and progress.
19
4. Scope and Method
The scheme ‘Women in Agriculture’ is being implemented in Palakkad district of Keralasince 1994 as a Centrally-sponsored programme of Department of Agriculture. Attempts toempower women are being made by various other agencies also such as NABARD. Non-governmental organisations are involved in similar endeavours. Women in Agricultureprogramme was designed specifically for the uplift of women engaged in agriculture andthe other primary sector activities. Further, this scheme is the first attempt of a governmentset-up in this direction. Since the inception of the scheme, no systematic and scientific studyhas been conducted to evaluate its efficacy in terms of its objectives and performances inPalakkad district. The present study is aimed at making a modest contribution on thisaspect.
Objectives
The specific objectives of the study are the following:
(i) To study the functioning of the self-help groups under the scheme ‘Women in Agri-culture’;
(ii) To assess the extent of women’s participation in various components of the scheme;
(iii) To study the impact of the scheme in terms of qualitative and quantitative changesamong the beneficiaries;
(iv) To identify the constraints in scheme implementation and to evolve suitablestrategies to overcome them.
Study area
The study was carried out in Palakkad district of Kerala, where the scheme ‘Women inAgriculture’ is being implemented. Palakkad district consists of 13 blocks; out of these thescheme is being implemented in 30 villages of six blocks. The blocks are Palakkad,Ottappalam, Kollengode, Chittoor, Alathur, and Kuzhalmannam.
Palakkad district is predominantly an agricultural area and an important rice-growing trackof Kerala. The other important crops cultivated in the area are coconut, banana, tapioca,rubber, and spices. The population depends mainly on agriculture and allied activities forlivelihood. In the district, 42.4 per cent of the total work force is agricultural labourers; 11.7per cent cultivators; and three per cent engaged in other allied activities (1991 Census).Nearly 70 per cent of the women work force is involved in agriculture, either in the wetlandsor in their homesteads (Government of Kerala, 1993).
Research design
The study was carried out in ex post facto research design with matching pairs involvingmembers of the self-help group of the scheme and non-beneficiaries of the area with comparablesocio-economic characteristics.

20
Sampling procedure
The scheme is being implemented in 30 villages, 5 each from 6 blocks of Palakkad district.For primary data collection, six villages were randomly selected from the 30, one from eachblock. From these selected villages, all the beneficiaries of the scheme were covered. Thusthe samples of beneficiaries consist 120 farmwomen (6 x 20) who participated in the scheme.Data from 60 non-beneficiaries, having the same socio-economic status, from the samplearea were also collected.
The sample respondents were the group members of the scheme who carried out any of theagriculture-related activities. They were considered entrepreneurs who earned an income orreceived an economic return in cash or kind from the enterprises concerned.
Period of study
The field survey was conducted during the month of May-August 1999.
Selection of variables of the study
Based on the pilot study conducted in the non-sample area, specific objectives of the study,reviews of past studies in consultation with experts, the following variables were selected forthe study.
(i) Respondent: education, marital status and occupation;
(ii) Family: size, income, income contributed by the respondent;
(iii) Size of land holding;
(iv) Extent of participation of the respondent in the various components of the scheme;
(v) Respondent’s social participation and contact with extension agencies;
(vi) Attitude of the respondent towards farming, economic motivation, adoption oftechniques;
(vii) View of the respondent about women empowerment, performance of the scheme,constraints of the scheme and functioning of self-help group.
Data were collected through personal interview using pre-tested and structured interviewschedules for beneficiaries.
The performance of different groups was closely observed to understand their functioningand their group dynamics. Participatory techniques such as group meetings, panel discussions,and group exercises were also used to elicit information about group dynamics.
21
5. Analysis and Findings
Socio-economic characteristics
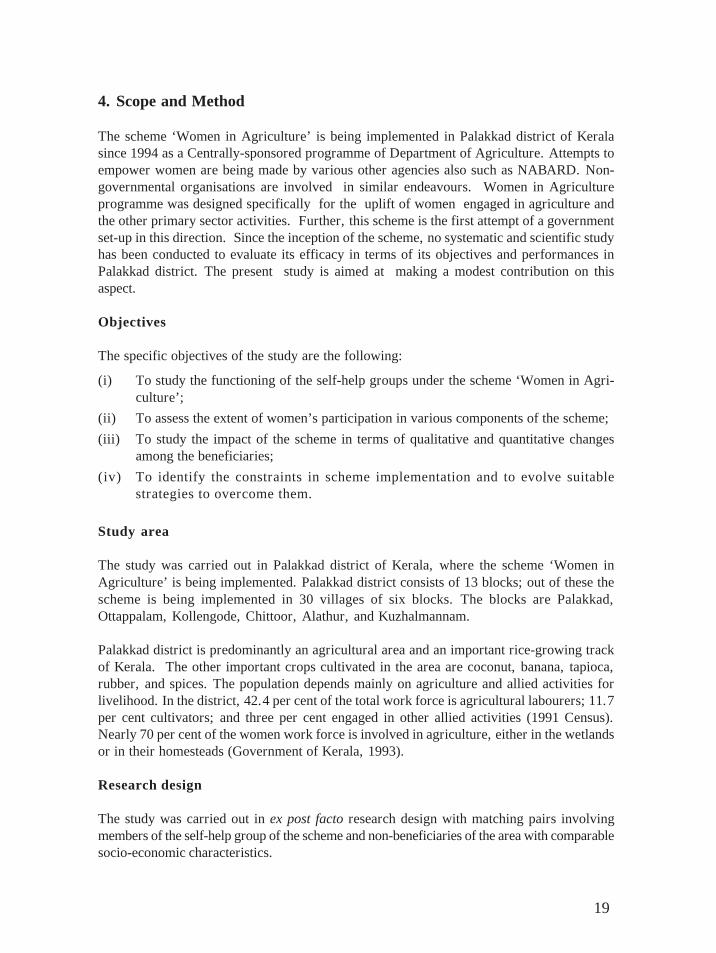
The respondents were classified into four age groups (Table 5.1). The largestproportion was found in the age of 31-45 years, 47.5 per cent. Thirty per cent of themembers belonged to the age group of 18-30 years. Thus, more than three-fourths ofthe members were under the age of 45 years.
Table 5.1 Age-wise classification of members
Educational status
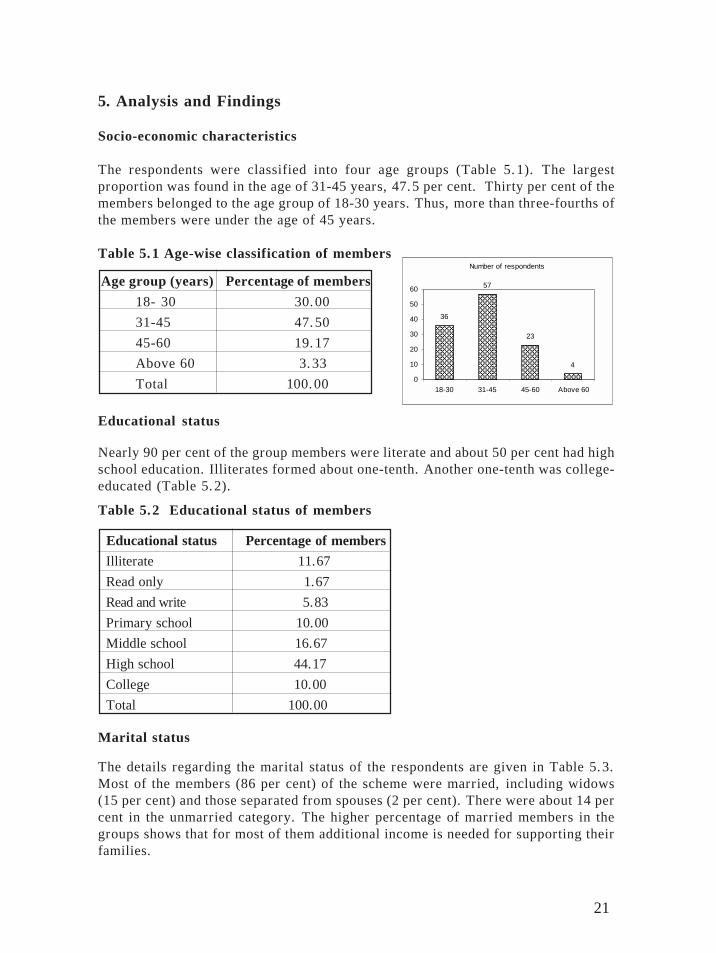
Nearly 90 per cent of the group members were literate and about 50 per cent had highschool education. Illiterates formed about one-tenth. Another one-tenth was college-educated (Table 5.2).
Table 5.2 Educational status of members
Marital status
The details regarding the marital status of the respondents are given in Table 5.3.Most of the members (86 per cent) of the scheme were married, including widows(15 per cent) and those separated from spouses (2 per cent). There were about 14 percent in the unmarried category. The higher percentage of married members in thegroups shows that for most of them additional income is needed for supporting theirfamilies.
����������������������������������������
��������������������������������������������������������
������������������������
��������������
Number of respondents
36
57
23
4
0
10
20
30
40
50
60
18-30 31-45 45-60 Above 60
Age group (years) Percentage of members18- 30 30.00
31-45 47.50
45-60 19.17
Above 60 3.33
Total 100.00
Educational status Percentage of members Illiterate 11.67
Read only 1.67
Read and write 5.83
Primary school 10.00
Middle school 16.67
High school 44.17
College 10.00
Total 100.00

22
Table 5.3 Marital status of women members
Family size
About 75 per cent of the respondents belonged to households having four membersor more. There were 30 respondents (25 per cent) whose family size was three orless. Fifteen per cent of the respondent family had five or more members. The aver-age family size of the group members was 4.03.
Table 5.4 Family size of group members
Land holding pattern
The majority of the respondents (90 per cent) belonged to households with landholdings of less than one hectare; in other words, they were only marginal farmers.Among the marginal farmers, more than one-third had land holdings of more than100 cents; the highest extent of land under this group was 247 cents. About one-fourth of the members had land holdings of less than 50 cents. There were 10 percent of respondents belonging to the category of small farmers, i.e. holding morethan one hectare of land (2.4 acres). The predominance of marginal farmers indi-cates the poor economic status of the majority of the group members (Table 5.5).
Occupation
Nearly two-thirds of the members were engaged in agriculture together with house-hold work. This category also included members who undertook cattle rearing alongwith farm activities, though their prime concern was agriculture. A significant pro-portion (28.33 per cent) was engaged in animal husbandry and household activities.The members who were wageworkers in agriculture came to about five per cent.
Marital status Percentage of members Currently Married 69.17
Widow 15. 00
Separated 1.67
Unmarried 14.17
Total 100. 00
Family size Percentage of member households
3 and below 25.00
4-5 60.00
5 and above 15.00
Total 100.00
Average family size 4.03

23
Table 5.5 Distribution of holdings by category and area
Only a few members (0.83 per cent) were engaged in service sector activities inaddition to household duties.
Table 5.6 Occupational status of group members
Family income
As part of the assessment of the economic characteristics of the members, the detailsof annual income of the members and information on family were collected. Thedistribution of the respondents in different income groups is shown in Table 5.7.The members were distributed across a wide range of income groups: 29.17 per centbelonged to the income group of Rs. 25,000-Rs 50,000. About 23 per cent cameunder the income group of Rs 50,000-Rs 1,00,000. Only 9.17 per cent belonged tothe higher group of above Rs 1,00,000 per year. Sixteen per cent of the membersbelonged to the lowest economic class of less than Rs 12,000.
������������������������������������������������
���������������������������������������������������������������������������������
���������������������������������������������
������������������
Number of respondents
36
57
23
4
0
10
20
30
40
50
60
18-30 31-45 45-60 Above 60
Size of holding Percentage of holdingLarge farmers 0
Small farmers 10.00
Marginal farmers 90.00
a) 0.25 cents 11.67
b) 26-50 cents 13.33
c) 51-75 cents 17.50
d) 76-100 cents 10.83
e) 101-247 cents 36.67
Total 100.00
Average holding size 0.48 ha (119.49 cents)
Status Percentage ofmembers
Household and agriculture 63.33
Household and Animal husbandry 28.33
Household and Labourer 5.00
Household and service 0.83
Others 2.50
Total 100.00

24
Table 5.7 Annual family income of the respondents
Comparison of group members with non-beneficiaries
A comparison between members and non-members in terms of the proportion of theirrespective contributions of income to the total family income, occupational status,social participation, and attitude towards farming showed that there existed significantdifferences between the two groups (Table 5.8).
Table 5.8 Comparison of members and non-members of the scheme
** significant at 1 % level
Contribution to family income
Table 5.9 shows the contribution of the group members towards family income. Itwas observed that 55 per cent of the members contributed only less than 25 percent of their respective family income; another 35 per cent contributed 25-50 percent. A small section of the members (2.5 per cent) was found, however, to make amuch larger contribution, of say 50 to 75 per cent. Moreover, in about 7.5 per centof the households, their contribution was more than 75 per cent. This shows that atleast for 7.5 per cent of the members the enterprises they started through the schemeserved as the main means of livelihood.
Income class (in Rs) Percentage of espondents0-12,000 16.6712,000-25,000 21.6725,000-50,000 29.1750,000-1,00,000 23.33Above 1,00,000 9.17Total 100.00
Characteristics Beneficiaries Non-beneficiaries t valueContribution of income tothe total family income 29.4 13.4 7.01**
Occupational status 2.82 2.7 0.14
Social participation 4.7 2.6 7.36**
Contact with extension agencies 4.22 2.3 7.92**
Information source utilisation 7.5 5.3 5.78**
Economic motivation 18.1 14 8.67**
Attitude towards farming 15.3 12.4 5.44**

25
Table 5.9 Contribution of members to family income
Social participation
Participation of the members in the various social and cultural organisations wasrelatively high. It was observed that nearly 70 per cent had more than average levelsof participation. A comparison of the level of social participation of beneficiarieswith that of non-beneficiaries indicated significant difference. The level ofparticipation of the members was clearly higher.
Table 5.10 Extent of social participation of members
Contact with extension agencies
The study also attempted to assess the contact of the members to the extension agen-cies or the extension personnel. The contact was assessed in terms of the frequencyof contact with Agriculture Officer, Village Extension Officer, Block DevelopmentOfficer, and Facilitator of the scheme Women in Agriculture, scientists and otheragents like Veterinary Surgeon and facilitators of NGOs (Table 5.11).
It was seen that the members maintained contact with all these agencies, but at vary-ing intervals. About 22 per cent contacted the Agriculture Officer once in threemonths. Forty-two per cent visited him only once in a year; and the rest took morethan a year to make a contract.
Among the members of the scheme, the facilitator of the scheme was the person whowas most frequently contacted. About 45 per cent of the respondents maintainedcontact with this official once in three months.
None of the members was seen to be making contacts with the scientist once in threemonths. However, 48 per cent of them did contact him at least once a year.
Extent of participation Percentage of membersLow 30.83Medium 58.34High 10.83Total 100.00
Contribution to household Percentage of membersincome (per cent)0-25 55.00
25-50 35.00
50-75 2.50
75 and above 7.50
Total 100.00

26
Table 5.11 Frequency of contact with extension agencies
Attitude towards farming
It was observed that among the members (and non-members), the proportion of thosewho had positive attitude to farming was low. A majority of non-members held anegative attitude towards farming when compared with the members of the scheme.The percentage of the members with negative attitude was 21.67, while that for non-beneficiary was 46.66. As many as 59.16 per cent of the members expressed a neutralattitude. However, the proportion with a negative attitude was much lower amongthe members than among the non-members (Table 5.12). It appears that membershipin the scheme has brought about a considerable shift of attitude from negative toneutral and from neutral to positive in the case of members.
Table 5.12 Attitude towards farming
Economic motivation
Table 5.13 shows an assessment of the economic motivation of the members and thenon-members. It was observed that there was an apparent difference in the responseas between the two categories. Members showed higher degree of economic motiva-tion than the others did. It could be due to the influence of the scheme, at least tosome extent. There were only 29 per cent of the members with a negative attitudetowards economic motivation, while the corresponding proportion among non-mem-bers was as high as 57 per cent. In addition, there was a higher percentage of mem-bers (39 per cent) with positive attitude towards economic motivation than amongnon-beneficiaries (20 per cent). The percentage of members and non-beneficiarieswith neutral response about economic motivation was 32 and 23 per cent respec-tively.
Extension Agencies Frequency of contact Less than 3 3-12 months More than 12 Total
months Agriculture officer 22.22 42.22 35.66 100.00
V.E.O 12.22 46.67 41.11 100.00
B.D.O 3.33 24.44 72.22 100.00
WIA facilitator 45.56 50.00 4.44 100.00
Scientist 0.00 47.78 52.22 100.00
Others 13.33 23.33 63.33 100.00
Attitude Overall score Percentage of members Percentage of non-membersNegative Below 1.75 21.67 46.66
Neutral 1.75-2.25 59.16 40.00
Positive 2.25-3.00 19.17 13.34

27
Table 5.13 Economic motivation of members and non-members
Adoption
It was observed that the extent of adoption of enterprises by members of the schemehad been, in general, low. Among two-thirds of the respondents, the rate of adop-tion was as low as less than 25 per cent (Table 5.14)..There were 36 per cent of the respondents whose adoption level was between 25-50per cent. None of the members had an adoption level of more than 50 per cent. Thelow adoption levels could be due to training in a wide range of activities given to themembers. They were given training in all the identified fields irrespective of theirindividual interests and without proper input support. Further, there was no roomfor the members for choosing the area of training.
Table 5.14 Adoption of enterprises by members
Extent of participation in various components of the scheme
Exactly half the number of members had a medium level of participation. A lowlevel of participation was reported by 29 per cent of the members. Members withhigh and very high levels of participation came to 14 and seven per cent respec-tively.
Table 5.15 Participation of members in group activities
������������
������������������������
��������77
������
���������������������
��������42
��������00
20
40
60
80
0-25 25-50 50 andabove
Number of respondents
Attitude Overall score Percentage of members Percentage of non-membersNegative 2-2.75 29.16 56.70
Neutral 2.76-3.25 31.67 23.30
Positive 3.26-4.00 39.17 20.00
Total 100.00 100.00
Percentage of adoption Percentage of respondents 0-25 64.00 25-50 36.00 50 and above 0.00 Total 100.00
Extent of participation Percentage of respondents Low 29.17 Medium 50.00 High 14.17 Very high 6.66 Total 100.00

28
Empowerment
The extent of empowerment of the members through participation in the scheme wasalso assessed (Table 5.16). The extent of authority exercised by the members in thevarious activities of the concerned groups was considered for assessing empowerment.Four levels of functions - planning, decision-making, implementation, and evaluation- were identified for assessing the build-up of capability of the members.
Table 5.16 Empowerment and authority of members in group activity
There were about two-thirds of the members who claimed to have exercised moder-ate authority in the planning activity. Twenty-five per cent claimed to have had fullauthority in planning the activities; only about one-tenth of them reported that theywere able to exercise little authority on planning the activities. In general, we shalltherefore conclude that the scheme has succeeded to empower a considerable segmentof the members for planning.
A similar pattern was observed in the case of decision-making also. More than halfthe members (58 per cent) enjoyed moderate authority in decision-making, while 24per cent of them wielded full authority. However, the proportion of the memberswith little authority in decision-making was also significant (about 18 per cent). Indecision-making, the members have yet to gain complete control.
There were 38 and 30 per cent of the members respectively who enjoyed full author-ity in implementation and in evaluation of the programme.
The empowered lotSignificant difference was observed between the members and the non-members invarious aspects. The major difference was the confidence gained by members to interactwithin a group or with a stranger. The non-members were very sluggish and werereluctant to talk in a group or even in a personal conservation. Most of the memberswere able, however, to express whatever ideas they had in mind. The members werebold enough to talk about their needs, constraints, and their enterprises. They attributedtheir confidence to the group experience that they had from the weekly and monthlymeetings and the exposure to unfamiliar situations during study tours and exhibi-tions.
Activity Full authority Moderate authority Little authority Total
Planning 25.00 64.17 10.83 100.00
Decision-making 24.17 57.50 18.33 100.00
Implementation 37.50 46.67 15.83 100.00
Evaluation 30.00 55.00 15.00 100.00
Overall activity 24.16 56.67 19.17 100.00

29
The level of empowerment of the women members of the scheme may be indicatedby the authority exerted by them in various group activities. The analysis of theoverall activity of the scheme showed that 57 per cent of the members had moderateauthority over the various functions of the scheme. Nearly one-fourth enjoyed a highdegree of authority in the group process. Self-perception, perception of the role ofwomen in society, economic independence, decision-making, innovativeness, andattitude towards group action, communication behaviour and desire to improve liv-ing conditions were the various facets of empowerment.
Note: All figures are in percentage
Correlation analysis
Correlation coefficients were worked out to find the degree of association of thequalitative characters such as age, education, family size, farming experience, andoccupational status with the extent of participation of the beneficiaries in variouscomponents of the scheme.
Table 5.17 Correlation analysis of different characteristics of group members
Significant positive correlation was not observed, except for education, with theextent of participation (0.309). Education was observed to have played a key rolein the level of participation of the members in the various components of thescheme.
������������������
��������������������
������������������������������
������������������������������
������������������������������������
����������������������������������������
������������������������������
������������������������������
������������������
��������������������
��������������������
��������������������
Number of respondents
020406080
100120140
Planning Decision
making
Im plementation Evaluation
����Full authority
����Moderate authority����
Little authority
������������������������������������������������������������������
�������������������������������������������� ������������������������
������������������������
�����������������������������������������������������������������������������������������������
����������������������������������������������������������������������������������������������
����������������������������������������������������������������������������������������������
Overall activity
29
68
23
��� Full authority��� Moderate authority��� Little authority
Characteristics Age Education Family Professional Farming size status experience
Education -0.535
Family size 0.075 -0.106
Occupational status 0.079 0.220 -0.048
Farming experience 0.899 -0.485 -0.020 0.041
Extent of participation -0.137 0.309 0.101 0.072 -0.070

30
Contact with other members
An inquiry into the extent of contact of the members among themselves showed thecohesiveness of the group. About 43 per cent of the members maintained regularcontacts with co-members. Nearly one-third had contacts as part of their group ac-tivities. Another one-fourth maintained contacts with other members of the grouponly occasionally.
Though a good number of the members had regular mutual contact, the majority ofthem met with one other at the weekly / monthly meetings or during other pro-grammes conducted as part of the scheme. Most of the members had close contactonly with a few members of the sub-groups or those in their immediate neighbour-hood. This fact revealed that the size of the group as a whole was larger than whatthe members would have liked it to be for maintaining regular inter-member con-tacts.
Table 5.18 Extent of contact of members with other members
Involvement in decision-making
Nearly 48 per cent of the members were involved in the decision-making processof their groups (Table 5.19). About two-fifths of them were involved but only occa-sionally. Thus, about 80 per cent of the members were involved in decision-mak-ing of their groups. Only less than one-eighth reported that they were involvedrarely.
About two-fifths of the members were actively involved in group activities and tookup leadership roles in the process.
Table 5.19 Involvement of group members in decision-making
���������������������
������������������������������������������
��������������������������������������������������������
N u m b e r o f r e s p o n d e n t s
0
1 4
4 9
5 7
0
1 0
2 0
3 0
4 0
5 0
6 0
N e v e rin v o lv e d
R a r e lyin v o lv e d
S o m e t im e sin v o lv e d
A lw a y sin v o lv e d
Extent of contact Percentage of members Normal 0
Occasional 24.17
Often 33.33
Regular 42.50
Total 100.00
Involvement Percentage of members Never involved 0 Rarely involved 11.67 Sometimes involved 40.83Always involved 47.50 Total 100.00

31
Performance-rating
The perception of the members about each component of the scheme was recordedand weightage was applied on the average score of each component. Rating wasdetermined with value 1 as the least effective, 2 as effective, and 3 as highly effec-tive. The overall performance of the scheme came to 2.031, i.e. between effectiveand very effective, but marginally towards effective.
Table 5.20 Performance-rating of the scheme
1- least effective 2 - effective 3- highly effective
Daily time span of members
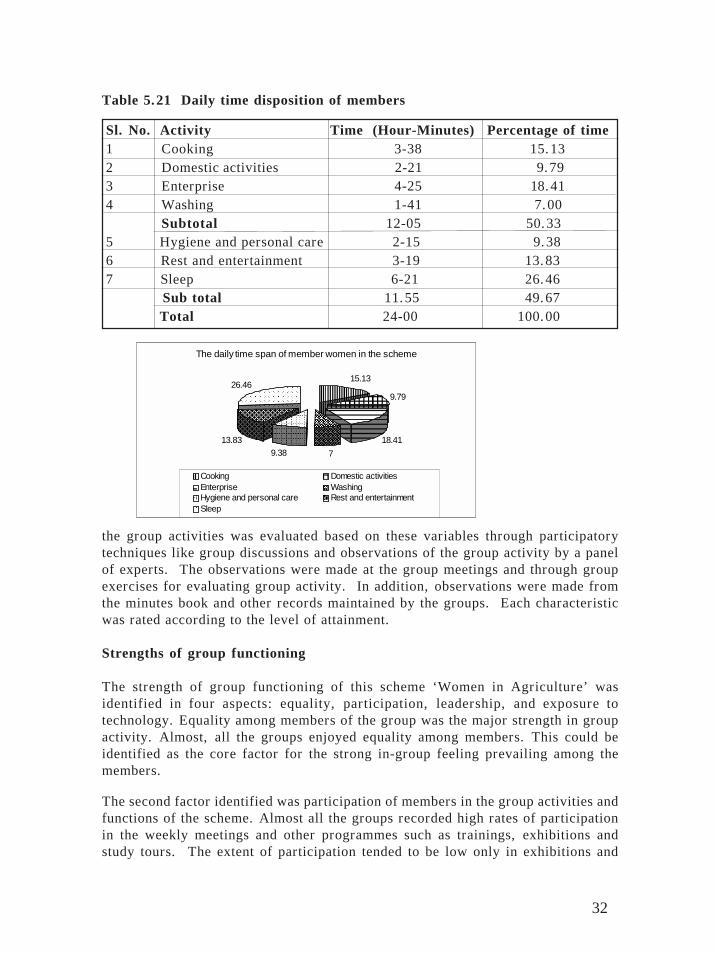
An analysis of the time disposition in the various activities by the women partakingof in the enterprises yielded interesting results. A woman member spent more than12 hours for work, relating either to the household or to the enterprise. She spent18.41 per cent of the time on activities related to the enterprises she was engaged in.She spent about three-and-a-half hours a day for cooking. The time spent for domes-tic activities like childcare and cleaning came to more than two hours. On an aver-age, she spent about seven per cent of the time for washing (Table 5.21).
She had only two hours and fifteen minutes for personal care and hygiene, in themidst of all her other activities. About 14 per cent of the time was spent on rest andentertainment. This included the time spent on visiting friends and relatives, wor-ship, reading, and entertainment. She got a sleeping time of less than six-and-a-halfhours.
Determinants of group dynamism
The following were identified as the determinants of group action. Performance of
Statement Average score Weightage Rating Programme for economic development 2.24 0.15 0.34
Effective transfer of technology 2.14 0.13 0.28
Programme for employment generation 1.82 0.13 0.24
Address the felt needs of participants 1.88 0.12 0.23
Exposure to new practices 2.12 0.11 0.23
Improve skill 2.20 0.1 0.22
Motivation for further adoption 2.08 0.08 0.17
Feedback mechanism 1.72 0.05 0.09
Guidance and expertise 1.88 0.06 0.11
Scientific outlook 1.94 0.07 0.14
Total 1.00 2.031
32
Table 5.21 Daily time disposition of members
the group activities was evaluated based on these variables through participatorytechniques like group discussions and observations of the group activity by a panelof experts. The observations were made at the group meetings and through groupexercises for evaluating group activity. In addition, observations were made fromthe minutes book and other records maintained by the groups. Each characteristicwas rated according to the level of attainment.
Strengths of group functioning
The strength of group functioning of this scheme ‘Women in Agriculture’ wasidentified in four aspects: equality, participation, leadership, and exposure totechnology. Equality among members of the group was the major strength in groupactivity. Almost, all the groups enjoyed equality among members. This could beidentified as the core factor for the strong in-group feeling prevailing among themembers.
The second factor identified was participation of members in the group activities andfunctions of the scheme. Almost all the groups recorded high rates of participationin the weekly meetings and other programmes such as trainings, exhibitions andstudy tours. The extent of participation tended to be low only in exhibitions and
������������������������������������������������������������
�����������������������������������������������������������������
��������������������������������������������������
����������������������������
���������������������������������������������������������������������������
�����������������������������������������������������������������������������������
���������������������������������������������
��������������������������������������������������
���������������������������������������������
���������������������������������
�����������������������������������������������������������������
���������������
���
������������������������������ �����������
�����������
����������������������
The daily time span of member women in the scheme
15.13
9.79
18.4179.38
13.83
26.46
���Cooking
���Domestic activities���
Enterprise���
Washing������ Hygiene and personal care
������ Rest and entertainment���
Sleep
Sl. No. Activity Time (Hour-Minutes) Percentage of time 1 Cooking 3-38 15.13 2 Domestic activities 2-21 9.79 3 Enterprise 4-25 18.41 4 Washing 1-41 7.00
Subtotal 12-05 50.33 5 Hygiene and personal care 2-15 9.38 6 Rest and entertainment 3-19 13.83 7 Sleep 6-21 26.46 Sub total 11.55 49.67 Total 24-00 100.00

33
tours to far away centres, which would necessitate absence of members from theirhomes for more than two days.
It was notable that the members were provided with financial backup for participat-ing in the programme. Further, the members considered programmes like exhibi-tions and mahila ghoshtis as good opportunities for selling their products.
The next factor bolstering the strength of the programme was the quality of theidentified leadership for each group. Every group functioning under the scheme haddistinctive and dynamic leadership. The link-workers acting as the conveners of thegroups were identified to have good leadership capabilities. These link-workers hadother proven qualities of leadership as well like members and office-bearers of massorganisations and even elected members of local bodies. The irony was that the func-tioning of a centralised and strong leadership often led to the surrender of rights andresponsibilities by other members of the group to the link-workers.
The next factor that appeared to be of considerable importance was the exposure ofthe members to innovative technology. The members of the scheme reported highexposure to a number of innovative technologies through weekly and monthly meet-ings, tour programmes to research stations and participation in exhibitions. Suchexposure enabled the members to experiment with new enterprises; but the lack ofother support mechanisms such as market and credit facilities had hindered the achieve-ment of the expected results (Table 5.22).
Table 5.22 Factors determining group dynamism
Sl.No. Character Rate
1 Uniformity in social status of the members Medium
2 Common understanding of getting together Medium
3 Common interest of the members of the group Medium
4 Common goal and objectives of the members Medium
5 Equality of members in the group High
6 Participation of group members in group activities High
7 Collective action of members Low
8 Identified leadership High
9 Communication among members Medium
10 Feasibility of enterprises and activities of the group Low
11 Democratic decision making in group activities Medium
12 Sharing of responsibilities among members Medium
13 Exposure of members to new technologies High
14 Credit and market linkage Low
15 Common savings as self help thrift group Low
34
Besides these four important factors, there were seven others of group dynamicswhich were identified as having moderate / medium influence on the functioning ofthe scheme ‘Women in Agriculture’.The first factor that had moderate influence wasthe social status of the members. Even though members were selected from compa-rable socio-economic groups, variations were observed among them. A few mem-bers of the groups were seen belonging to socio-economic classes above or belowthat of the group in general and to be having needs and motives different from thoseof others.
The most important factor of group dynamism is getting together. It was observedthat among the members, the awareness of this factor of getting together and form-ing a group was not strong enough. In terms of having a single common interest forall the group members also, the group lacked strength. A large number of the mem-bers also failed to identify their goals and objectives that would conform to those ofthe majority of the members. A fraction of members was seen to be having orienta-tions and aspirations different from those of the majority in the groups. An osten-sible reason for the variations was the fact that women following divergent activi-ties, which did not have any bearing with the activities envisaged in the scheme,were included as members of the groups. Further, the programmes were so charted ina unitary and centralised manner that the choices of members remained minimal indeciding the day-to-day functions of the programme.
The next component that has a pivotal role in the dynamism of a group is the degreeof communication between the members. A perusal of the functioning of the groupsrevealed that their performance in the case of communications among them was notup to the desired level. A few members did have contacts with all the other mem-bers, but the majority maintained contacts with only some preferred sub-clusterswithin the group. A few others had contact with other members only at the time ofmonthly or weekly meetings.
Democratic decision-making and sharing of responsibilities were also developed, butonly to a medium level due to pre-emption, by strong and established leadership ofthe groups, of the responsibilities of decision-making and implementation. This delayedopportunities for active and dynamic leadership to emerge from among the othermembers of the groups. A few groups that had members of comparable social statusand with common objectives performed well in decision-making and sharing ofresponsibilities.
Factors for low performance
Four components were identified as the most debilitating factors in the performanceof the group process. Collective action is the key to good performance. None of thegroups was seen to have undertaken any collective programmes as part of the scheme.Individuals or splinter groups of five or six members in a group ran the enterprises.It was thus perceived that the present size of a group was slightly bigger than theoptimum for collective action.

35
Most of the programmes selected for training and most of the enterprises adopted forgroup activity were not at all feasible and economically viable. The non-sustainabilityof the enterprises was due mainly to the non-feasibility of the programme.
The third and the most important factor was the non-availability of credit and marketfacilities. No mechanism was in existence for providing financial support to themembers or the groups through the scheme for launching an enterprise for the run-ning of which they had acquired technical training. The women entrepreneurs alsofaced the problem of marketing of their products.
Absence of a self-help thrift programme was another major handicap. Most of thegroups had accounts but seldom had any substantial bank balance for functioning asan effective thrift group. Further, none of the groups operated any group creditprogrammes or savings fund schemes for the welfare of members. Nor did any effortscome from the facilitators or the Department of Agriculture as designers of the schemefor addressing the problem of credit.
The group triggers social awakening
The Erimayoor village of Alathur block had a unique story to tell. The womengroup constituted by the department consisted of 20 women of the neighbourhood.Improved farming techniques were transferred to the members of the scheme throughtraining and various other programmes of the scheme. The exemplary performanceof the group attracted other women of the locality to join the group informally invarious activities. The group members were traditionally vegetable cultivators andcattle rearers. Whatever knowledge the members got through the training was per-colated to the non-members and the process created a social awakening. Thesegroups in their informal gatherings during their activities discussed every socialissue that affected their lives and took the initiative in solving them. Their com-bined efforts had given them added strength to fight for their legitimate social rights.
36
6. Conclusions and Suggestions
The activities of the groups consisted mainly of the following:
Group meeting
Group meetings were conducted on a weekly basis. The link-worker convened themeetings, usually at the residence of one of the members, which was fixed on arotation basis. The financial accounts of the group and the programmes were discussedin these meetings. The convenor presented the accounts and the financial statementsfor perusal and approval of the members. The facilitator also convened monthlymeetings of the groups. Technical aspects of running the enterprise were discussedin these meetings.
Attendance
Attendance records of the group meetings were maintained regularly. Averageparticipation of more than 80 per cent of the members was noted in every group.This is a clear indication of the enthusiasm of group members in group activities.
Savings
Each group had an account in the nearby bank and this was operated jointly by thelink-worker and facilitator. Savings with most of the groups were meagre sincecollection and saving activities on a group basis were rarely done. Receipts andexpenses were discussed only in group meetings. There were rarely any creditmobilisation or savings promotion activity in the groups despite the fact that suchactivity is a key component of a self-help thrift group.
Maintenance of records
The groups maintained records of all their activities on a regular basis. They in-
The women of substanceA few members of the women’s groups presented a most delightful and positive side ofthe scheme. They were the sole earners of their families. They earned their livelihoodthrough the enterprises they were engaged in. This was rendered possible through theenthusiasm and self-confidence they acquired through the scheme. Most of them hadgone through severe hardships of life before they came into the frame of this scheme.The scheme had motivated and supported them to take up an enterprise that could earnthem a livelihood of their own. They did various enterprises like food processing, soapmaking, and dairying and sold the products in the shops with which they had made aliaison and also did direct marketing at the houses. They spent more than five hours forthe enterprise-related activities besides other household responsibilities. These womenhad acclimatised with the strains and exertions of the enterprises, which they could carryon even while continuing to manage the household activities.
37
cluded minute books, attendance registers, bank passbooks, and purchase registers.Records of activities like training programmes and study tours were also maintained.
Transfer of technology
Technological interventions were done through group meetings and periodical trainingprogrammes conducted by the Department of Agriculture. Facilitators performedthe pivotal role of transmitting the technical know-how down to the group members.Services of experts from Kerala Agricultural University, Department of Agricultureand other research and extension institutions were utilised for dissemination oftechnology. One of the rosy pictures of the scheme is the effective transfer oftechnology to farmwomen. There are definite positive impacts on productivity andefficiency of farm operations because of the technology transfer. Besides training,other programmes like study tour, exhibitions, and mahila ghoshti, also brought thegroup members into contact with new technologies.
Inputs and production management
The farmers procured the inputs for the enterprises themselves. There was no attemptto procure the inputs essential for the groups on a collective basis. The productionprocess was decided and implemented by individuals or by subgroups. The questionof forward and backward linkages of an enterprise did not seem to have beenconsidered by the groups in the selection of enterprises and activities. Such an approachwould have ensured sustainability of the enterprises and maintained group dynamism.
Entrepreneurship of members
The enterprises undertaken by the group members were, in general, those drawnfrom the training schedule but which had also been the traditional occupations of themembers concerned. A few enterprises that were extensively adopted by the groupswere, however, the ones imposed on them (e.g., mushroom cultivation, rabbit rearing)for want of marketing facilities. It was certain that the enterprises the members havebeen following traditionally had proved to be the most advantageous ones, particularlywhen reinforced by new techniques of production. Though decisions on starting ofenterprises, etc., were made based on a group approach, the activities were doneindividually in their households or in subgroups of five or six members.
Sub-groups
The members did most of the enterprises on an individual ownership basis. Certainenterprises, which were amenable to group management, were executed through sub-groups of five to six interested members. Though not every activity was done collec-tively, in certain enterprises, some such as procurement of materials and marketingwere done jointly. The profits in such enterprises were pooled and shared equallyamong the participants. Since the sharing was done among subgroups, there waslittle scope for group savings.

38
Some typical units
Rice-processing unit (Kuzhalmannam)
Six members of the Kuzhalmannam unit were engaged in this processing unit. Thefollowing Table gives an idea of its monthly activities
Table 6.1 Monthly activities of the rice-processing unit, Kuzhalmannam
The main products prepared by the group were Pappadam, Arikondattam, andMurukku. Besides these products, the group made a variety of other products such aspickles, mushroom, and milk products. All these products enjoyed stable markets.The monthly balance sheet showed that they made a profit of Rs 1,433 per personengaged in the enterprise.
Soap powder unit (Erimayur I)
Five members of the group were running a soap powder unit, besides the group’srunning enterprises like mushroom cultivation and vegetable cultivation as envisagedunder the scheme. Table 6.2 shows the income and expenditure of the unit for themonth of September 1999.
The materials required for the unit were purchased in bulk from IRTC, Palakkad anddistributed to the members. During September, 500 kg of soap powder was manufac-
Mushroom boom
Mushroom was introduced as an innovative product in the women groups of the scheme.Extensive training was given on the cultivation techniques and managing practices. Ithas come to be a priority item in the training schedules, due to the effortlessness inproviding the training and facility in demonstrating results. Procurement of spores wasmade from the production centres of Kerala Agricultural University and IRTC, Palakkad.No marketing study was done at any of the stages and therefore a heavy burden has beeninflicted on members, for marketing of their produce in the local markets of Palakkad. Ithas become a practice to present the mushroom and its processed products in theneighbourhoods and the houses of the relatives of the members. The taste buds of Keraliteshave not yet accepted the mushroom recipes. Further, the cost and the nutrient compo-sitions of mushrooms have to compete with those of fish, which has high acceptance andavailability in Kerala. Mushroom cultivation vanished from the activities of the groupsin the seasons subsequent to our field investigation.
Products Quantity produced in a month Expense (Rs.) Profit (Rs.)Murukku 5000 nos 2500 1400Arikondattam 80 kg 2000 800Pappadam 800 packets 16000 6400Total 19600 8600

39
Table 6.2 Income and expenditure of Soap Powder unit (Erimayur I)
tured. The powder was marketed locally by the members @ Rs 15 per kg. Totalprofit for the month of September was Rs 2,875 with an individual share of Rs 575.Data collected for the month of October showed a profit of Rs 19,500 with an indi-vidual share of Rs 1091.
Constraints and strategies
Credit availability
The scheme itself is not credit-oriented. This often is an obstacle in developing theenterprises into viable units. Credit availability never seemed to be a concern for thescheme in any of its functions. The members, therefore, had to start an enterprisewith their own assets or fetch support by individual effort from financial institutions.
Marketing
The project has failed in developing proper marketing channels for the enterprisesestablished by the groups or their members. For selling the products, the membersapproached the nearest market. They also did direct sales, to households, of prod-ucts that had at least a minimum local demand.
Procurement of inputs
Availability of quality inputs was another constraint experienced by the members.Whatever inputs the members procured were the results of their own individual orsubgroup efforts. No efforts were there to procure inputs on a group basis. So therewas little chance to cut down the input cost. Non-availability of quality seeds wasthe major constraint in the case of enterprises such as mushroom and vegetable culti-vation. Usage of low-quality seeds often led to plant diseases and complete devasta-tion of the crops.
Materials required Quantity Cost (Rs) Soda ash 100 kg 1300
Sodium Sulphate 100 kg 900
Talcum powder 150 kg 625
Glober salt 150 kg 625
Slurry 7.5 Litre 375
Colour 250 g 125
Detergent Compound 75 ml 75
Plastic cover 1.5 kg 100
Travel expenses 500
Total 4625

40
Non-flexible training schedules
One of the main constraints pointed out by the members about the scheme was theinflexible nature of the training schedule. The members or the beneficiaries had norole in fixing the individual items of the training schedule and the choice of activities.The enterprises were selected at the commencement of the scheme and a commontraining was given to all the members of the scheme irrespective of their particularinterests or inclinations. Training was given in livestock management to memberswho did not have cattle and who did not intend to do cattle rearing. This approachhad created a feeling among the locals that the training was not intended for equippingmembers to take up productive activities and therefore need not be taken seriously.
Inaccessibility of facilitators
Facilitators are the role models of the women members of the scheme. They aresupposed to reach the members in person and keep pace with the programme inplanning, helping the farmers to solve problems and guiding them in every activityrelated to group functioning. However, the facilitators never reached the groups intime. They had to do administrative work at the headquarters and conduct weeklymeetings. Further, they had to reach remote areas from headquarters to meet all the10 groups within their jurisdiction. Above all, the job of the facilitators was purelytemporary in nature and they got only a meagre remuneration.
Lower rate of adoption
The major reasons for the poor rate of adoption are the large number of enterprisesalready in existence, poor marketing facilities, and lack of follow-up activity. Theinflexible nature of the training schedule had made the enterprises unadaptable, sincethere existed little leeway in the choice of enterprises. Further, if an enterprise failed
The riddle of market
The demand for the products made by women groups was, in general, erratic. Womenmanaged to sell their products in local households and marketplaces through direct con-tacts. The only promising market for their product outside their immediate neighbourhoodwas, they claimed, trade fairs and exhibitions conducted by the department and otheragencies. A few groups managed to get orders from the established marketing agenciesor food-processing units. Such agencies approached the women groups and placed or-ders for specific products stipulating the prices and the period of time within which thesupplies were to be made. The products procured from the groups at trivial prices werethen branded, packaged and marketed by these agencies with a handsome margin. Evenorders from export groups reached the women groups for products like pickles and driedstuffs. There were ample opportunities for these enterprises to grow if supported bycredit and marketing facilities. But the question of how to do so and who to create suchlinks, remains yet to be answered.

41
there was no mechanism to buffer the loss incurred to the members. This risk factorrestrained the members from experimenting innovative ventures.
Lack of savings
None of the groups had a comfortable amount in the form of group savings. Thescheme seemed to have never considered group savings as an essential component inits functioning. Neither the department nor the group members had initiated anycredit and savings-linked programmes.
Unsustainable enterprises
Most of the enterprises were adopted by the groups merely on persuasion from thedepartment. Proper planning or deployment of support facilities was never on theagenda of the implementing agency. This shortcoming had affected the sustainabilityof many of the enterprises.
Lack of thriftiness
Though the basic objective of the scheme was to empower the women groups as self-help thrift groups, none of the groups satisfied the objective. It was certain that themajority of the groups would stop functioning if the department winds up the scheme.A few groups or subgroups might continue in existence since the enterprises servedas the means of livelihood for their members. The members complained that noinitiative was taken at any stage for guiding the women groups in achieving thisobjective of providing sustenance to members. The facilitators revealed that theywere not able to visit the women groups in person frequently, a condition necessaryfor the success of an exercise to make the groups to become thrifty and savingsoriented.
Suggestions
The following strategies emerge from the inferences drawn from the study. A prag-matic approach is necessary for an organisational set-up to function effortlessly,especially for ushering in a viable economic activity. Such an approach can be evolved,but should have provision for alterations and modifications to suit specific conditionsand particular problems.
Credit and savings
The prime thrust has to be given to the thriftiness of the groups. Strategies should beevolved to formulate group activity with savings as an integral part of the programme.Women members may be authorised to carry out group savings activities on theirown. The savings amount shall be treated as the credit of the group members. Demo-cratic decisions and mutual understanding amongst members would be enhanced byactive involvement of facilitators and experts in this regard. The schemes of NABARD

42
and other credit agencies may be linked to the programme for enhancing its eco-nomic viability and sustaining the thriftiness of groups.
Risk buffering and insurance coverage
There are no risk-buffering arrangements to compensate for losses incurred by themembers due to unpreventable reasons. A mechanism should be evolved for bufferinglosses caused to the members in risky enterprises. An offer of indemnity would buildthe confidence of members to go in for innovative and risky ventures. The majorityof the members belonged to the lower economic strata of society, whose incomeswere, however small they were, a sure support to their families. A welfare scheme tobring the viable groups under an insurance scheme would be a positive step.
Forward and backward linkages
Suitable forward and backward linkages may be explored for sustaining the groupprocess. The groups should have co-ordination with one another and the possibilitiesof establishing linkages among the different enterprises should be explored. Splintergroups may be promoted to undertake activities that would link up the existingenterprise to form chains of complementary activities. For example if an establishedgroup is performing animal husbandry and dairying, the groups that undertake fodderproduction, concentrated feed production, processing of milk products, etc. may bepromoted. Such an approach would increase co-operation among groups and enhancetheir bargaining power in procuring inputs and marketing their products.
Group size
The present size of the group is slightly on the higher side for members to have afeeling of compactness and togetherness. The group size need not be a fixed numberand should be flexible according to the nature of the enterprise and the social andcultural conditions of their members. The members belonging to an immediateneighbourhood may be formed into a group of more than 15 persons; but the mem-bers from a wider locality should be restricted to a smaller number, say, less than12. Linkages among groups engaged in related complementary activities may elimi-nate to some extent the disadvantages of smallness of groups.
Sustainable enterprises and selective training
Enterprises may be selected through participatory approach and the selected enterprisesshould be economically viable and feasible. The selected enterprises should be ac-ceptable to farmwomen and suitable under the conditions prevailing in their house-holds. Intensive training shall be given to the members interested to take up theactivity instead of giving superficial training in all occupations in the schedule to allthe members. Training would be effective if given in phases since the trainees wouldbe able to share these experiences in the training sessions. Foolproof technical sup-port should be given to the members adopting enterprises. The women should be

43
given an appraisal of the risk factors involved; and thorough marketing and feasibil-ity studies should be accomplished before starting an enterprise.
Channelling inputs and infrastructure
The economic viability of an enterprise is decided, in part, by production cost andsupply of quality inputs. The supply of inputs can be assured at reasonable pricethrough collective purchase of inputs. It would reduce input cost and transportationcost. Creation of infrastructural facilities (for marketing transport, storage, etc) andother support facilities like finance and technical know-how are also essential foreffective realisation of the objectives of the programme. Provision for support ofother development agencies and schemes should be ensured.
Marketing channels and quality control of products
An in-depth marketing study would help development of effective marketing strategiesfor each product. Marketing of products on a co-operative basis would be helpful tofind sustainable markets for the products. Assigning brand names for the productsmade by these women groups might give them an advantage to sell their wares.Quality of the products should be strictly maintained to ensure success in marketing.Expert groups should explore suitable marketing channels for the products.
Professional approach to training and empowerment
A professional approach is essential in the performance of facilitators and groupmembers. The members should be equipped to conduct their group activities andcarry out entrepreneurial functions with dexterity. The members should be able toencounter and guard against risks through a group approach. Professional trainingshould equip members to carry out successfully their household activities and run theenterprises simultaneously.
Continuous follow-up of activities of the groups and professionally designed re-fresher training to all the members (at present, refresher training is given to linkworkers only) would help improve their group functioning as self-help thrift groups.
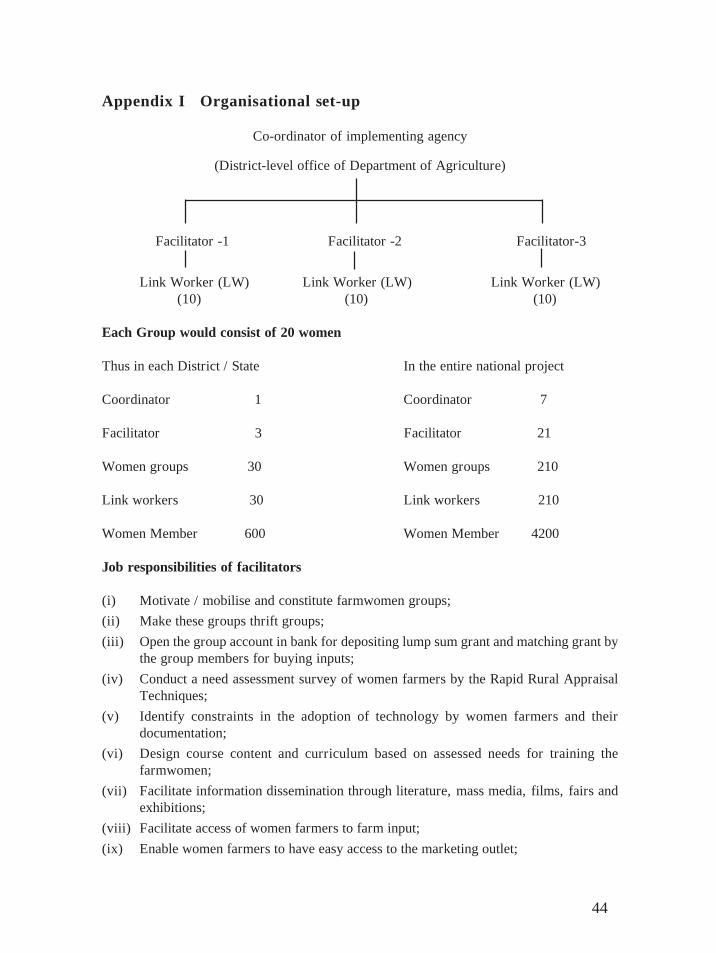
44
Appendix I Organisational set-up
Co-ordinator of implementing agency
(District-level office of Department of Agriculture)
Facilitator -1 Facilitator -2 Facilitator-3
Link Worker (LW) Link Worker (LW) Link Worker (LW)(10) (10) (10)
Each Group would consist of 20 women
Thus in each District / State In the entire national project
Coordinator 1 Coordinator 7
Facilitator 3 Facilitator 21
Women groups 30 Women groups 210
Link workers 30 Link workers 210
Women Member 600 Women Member 4200
Job responsibilities of facilitators
(i) Motivate / mobilise and constitute farmwomen groups;
(ii) Make these groups thrift groups;
(iii) Open the group account in bank for depositing lump sum grant and matching grant bythe group members for buying inputs;
(iv) Conduct a need assessment survey of women farmers by the Rapid Rural AppraisalTechniques;
(v) Identify constraints in the adoption of technology by women farmers and theirdocumentation;
(vi) Design course content and curriculum based on assessed needs for training thefarmwomen;
(vii) Facilitate information dissemination through literature, mass media, films, fairs andexhibitions;
(viii) Facilitate access of women farmers to farm input;
(ix) Enable women farmers to have easy access to the marketing outlet;

45
(x) Have a periodic interaction with the link worker for the feedback of follow-up ofwomen’s activities;
(xi) Have a content liaison with the implementing agency at the district-level;
(xii) Attend monthly and fortnightly workshops of the existing extension programmes; and
(xiii) Submit quarterly progress reports to the district agency, nodal officer and Directorateof Extension
Job responsibilities of link worker
(xiv) Hold periodic meetings of the women’s group to discuss the agriculture-relatedprogrammes / constraints / other related matters;
(xv) Attend fortnightly training sessions;
(xvi) Maintain record of the group activities; and
(xvii) Maintain a regular contact with the facilitator for providing feedback and undertakethe follow-up training.

46
References
Alahakone N. 1989. ‘Fertilizer and women in Sri Lankan agriculture’, Agro-Chemicals-News-in-Brief.
Acharya, N., S. Basu. 1996. ‘Forming federations: A case study of the Grameen MahilaSwayam Siddha Sangh, Khed Taluk, Pune’, Paper circulated at the workshop on ‘Linkages- People’s Institutions and Financial sector’. 19-21 December. Friends of women’s WorldBanking (India), Ahemdabad.
Ahmed M.A. 1999. Women’s empowerment and Self Help Groups, Kurukshetra pp. 19-20.
NABARD. 1995. Linking SHG with banks- An Indian Experience, Bombay, pp. 1-25.
Barrett, H. R., Browne, A. W. 1989. ‘Time for development? The case of women’shorticultural schemes in rural Gambia’, Scottish Geographical Magazine.
Burra, N. 1989. ‘Out of sight, out of mind: working girls in India’, International LabourReview.
Charyulu, U.V.N., M. Seetaram. 1988. ‘Participation of rural women in agriculture in thehills of Uttar Pradesh’, Journal of Rural Development, Hyderabad, 7:3, 289-297;
Chen, M. 1989. ‘A sectoral approach to promoting women’s work: lessons from India’,World Development, Oxford.
Dwaraki, B.R., N.Narayanaswamy, and N.Ramesh. 1996. ‘Towards creating a participatoryself-help credit Co-operative’, Rediscovering Co-operation, Indian Institute of Management,Anand, Gujarat, 2: 216-235
Heyzer, N. 1989. ‘Asian women wage earners: their situation and possibilities of donorintervention’, World Development, Oxford.
Koncz, K. 1988. ‘Women in agriculture’, Journal of Social Studies, No. 42,79.
Krishna, S. and K.Thankamani. 1993. ‘Empowering women through extension’, IndianJournal of Extension Education, Vol XXIX p. 44-46
Malima, V.F. 1988. ‘The role of women in farming systems’, Proceedings of the nationalworkshop on national agricultural and livestock research in Tanzania held at AICC, Arusha,25-30 April.
Mundra, S.N., Kusum Kothari. 1992. ‘Impact of TRYSEM amongst women beneficiaries’,Indian Journal of Extension Education, Vol. XXVIII
NABARD. 1997. As the Darkness Fades away, NABARD, Thiruvananthapuram. p.8
47
Norman, D., D. Baker, G.Henrich, and F.Worman. 1988. ‘Technology development andfarmers groups. Experience from Botswania’, Exploring Agriculture, 24: 321-331
Panda, A.K., A. K. Mishra. 1996. ‘SHG-Informal Co-operatives in Orissa’, Rediscoveringco-operation, Indian Institute of Management, Anand, Gujarat. 2:216-235.
Pankhurst, D. 1988. ‘Women’s lives and women’s struggles in rural Zimbabwe’, LeedsSouthern African Studies, No. 6, 18pp.
Rani, Jhansi, M.B.Asha. 1982. ‘Actual and desired type of participation by rural women inselected areas of decision making’, Indian Journal of Extension Education, vol. XVIII
Rao, D.S.K and M.Zeller. 1998. ‘Cost of promoting micro-finance self help groups inIndia- A comparison of bank and NGO promoted groups’, Working paper, BIRD, Lucknow,p.1-15.
Seema, B. 1986. ‘Role of farm women in decision-making process of a farming communityin Thiruvananthapuram district’, Unpublished M.Sc. Thesis, Kerala Agricultural University.
Singh, M.P., S. S. Gill. 1983. ‘A test to measure skills of farmers’, Indian Journal ofExtension Education, vol. XVII
Government of Kerala. 1993. Statistics for planning, Directorate of Economics and Statistics,Thiruvananthapuram.
Sudha, V. K. 1987. ‘Study of the impact of lab to land programme on tribal and non-participants in Kerala’, Unpublished M. Sc. Thesis, Kerala Agricultural University.
Tagwireyi, J.T. 1987. ‘The role of women in family nutrition. Improving food crop productionon small farms in Africa’, FAO/SIDA seminar on increased food production through low-cost food crops technology held in Harare, Zimbabwe, 2-17 March.
Thomson, S., Y. Sarikahputi. 1989. ‘Integration of rural women’s concerns into mainstreamagriculture and rural development activities’, TDRI-Quarterly-Newsletter, ThailandDevelopment Research Institute, 4:3, 14-15; 16-19; CDS. Bangkok, Thailand;
Veena, S. 1990. ‘Participation of women in farm activities’, Indian Journal of ExtensionEducation, vol XXVI, No. 1 & 2.