Embed Size (px)
Citation preview

WMO statement on the status of the
global climate in 2013
WMO-No. 1130

WMO, in collaboration with Members, began issuing annual statements on the status of the global climate in 1993. This publication was issued in collaboration with the Hadley Centre of the UK Meteorological Office, United Kingdom of Great Britain and Northern Ireland; the Climatic Research Unit (CRU), University of East Anglia, United Kingdom; the Climate Prediction Center (CPC), the National Climatic Data Center (NCDC), the National Environmental Satellite, Data, and Information Service (NESDIS), the National Hurricane Center (NHC) and the National Weather Service (NWS) of the National Oceanic and Atmospheric Administration (NOAA), United States of America; the Goddard Institute for Space Studies (GISS) operated by the National Aeronautics and Space Administration (NASA), United States; the Japan Meteorological Agency (JMA), Japan; the European Centre for Medium-Range Weather Forecasts (ECMWF), United Kingdom; the Global Precipitation Climatology Centre (GPCC), Germany; the Global Snow Laboratory, Rutgers University, United States; the National Snow and Ice Data Center (NSIDC), United States; the Colorado Center for Astrodynamics Research, University of Colorado-Boulder, United States; the Polar Science Center, University of Washington, United States; the Commonwealth Scientific and Industrial Research Organization (CSIRO) Marine and Atmospheric Research, Australia; and the Vienna University of Technology, Austria. Other contributors are the National Meteorological and Hydrological Services or equivalent climate institutions of Argentina, Armenia, Australia, Belarus, Bosnia and Herzegovina, Brazil, Bulgaria, Canada, China, Cyprus, Czech Republic, Denmark, Estonia, Fiji, Finland, France, Germany, Guinea, Hungary, Iceland, India, Iran (Islamic Republic of), Ireland, Israel, Japan, Jordan, Kenya, Latvia, Lithuania, Luxembourg, Malta, Mexico, Montenegro, Morocco, Nigeria, Norway, Pakistan, Portugal, Republic of Moldova, Romania, Russian Federation, Serbia, Slovakia, Slovenia, South Africa, Spain, Sweden, Switzerland, Thailand, Tunisia, Turkey, Ukraine, United Kingdom, United Republic of Tanzania and United States. The WMO Regional Association VI (Europe) Regional Climate Centre on Climate Monitoring, the African Centre of Meteorological Applications for Development (ACMAD, Niamey), the Hong Kong Observatory (HKO), Hong Kong, China, the Australian Research Council (ARC) Centre of Excellence for Climate System Science, University of Melbourne, Australia, and the International Research Centre on El Niño (CIIFEN, Guayaquil, Ecuador) also contributed.
WMO-No. 1130
© World Meteorological Organization, 2014
The right of publication in print, electronic and any other form and in any language is reserved by WMO. Short extracts from WMO publications may be reproduced without authorization, provided that the complete source is clearly indicated. Editorial correspondence and requests to publish, reproduce or translate this publication in part or in whole should be addressed to:
Chair, Publications BoardWorld Meteorological Organization (WMO)7 bis, avenue de la Paix Tel.: +41 (0) 22 730 84 03P.O. Box 2300 Fax: +41 (0) 22 730 80 40CH-1211 Geneva 2, Switzerland E-mail: [email protected]
ISBN 978-92-63-11130-2
NOTE
The designations employed in WMO publications and the presentation of material in this publication do not imply the expression of any opinion what-soever on the part of WMO concerning the legal status of any country, territory, city or area, or of its authorities, or concerning the delimitation of its frontiers or boundaries.
The mention of specific companies or products does not imply that they are endorsed or recommended by WMO in preference to others of a similar nature which are not mentioned or advertised.
The findings, interpretations and conclusions expressed in WMO publications with named authors are those of the authors alone and do not neces-sarily reflect those of WMO or its Members.
Cover illustration: Praveen Agrawal / WFP

ContentsForeword 2
Preface 3
Key findings 4
Temperatures 4
Rain, snow and ice 5
Oceans 7
Regional highlights 8
Tropical cyclones 15
Greenhouse gases and ozone-depleting substances 17
Major weather and climate events around the world in 2013 19
Explaining the summer 2012/2013 and annual 2013 record warmth in Australia 20

ForewordThe dramatic impact of climate variability and climate change continued to be felt all over the world throughout 2013 The WMO Statement on the Status of the Global Climate in 2013 pro-vides a snapshot of global and regional trends in weather and climate over the past year and highlights some of the year’s most significant extreme events
The year 2013 tied with 2007 as the sixth warm-est since global records began in 1850 Although the climate varies naturally from year to year, it is clear that the planet is experiencing an overall warming trend Thirteen of the fourteen warmest years on record have all occurred in the twenty-first century, and each of the past three decades has been warmer than the last, culminating with 2001–2010 as the warmest decade on record As highlighted by the Fifth Assessment Report of the Intergovernmental Panel on Climate Change, this steady warming is caused by rising levels of anthropogenic greenhouse gases in the atmosphere
We now have a better understanding of human- induced climate change, and climate scientists can increasingly determine how large-scale pressure and temperature patterns influence the weather The best known of these is the El Niño-Southern Oscillation (ENSO) in the Pacific Ocean, which affects weather patterns around the world through “teleconnections” In addition to ENSO, the North Atlantic Oscillation, the Arctic Oscillation, jet streams and other recurring patterns also often explain why weather conditions are wetter, drier, warmer, cooler or stormier than average
Weather forecasting, including the prediction of storms and other hazards, has greatly evolved in recent years In October 2013, the events sur-rounding Cyclone Phailin, the second strongest tropical cyclone to strike India since modern records began, showed how improved fore-casting, combined with government action to build national resilience and provide shelters, greatly reduces the loss of life Nevertheless, extreme events can still cause fatalities and destroy property, so we must continue enhanc-ing preparedness, strengthening early warning systems and implementing a multi-hazard approach to disaster risk reduction
The Statement draws on input from leading research institutions and from the National Meteorological and Hydrological Services of WMO Members This summary has been pub-lished in all six official WMO languages in order to reach the broadest possible readership However, I also strongly encourage interested readers to examine the more detailed underlying report, which is available on the WMO website
(M Jarraud) Secretary-General
2

3
This Statement is based on datasets and infor-mation that were made available by WMO Members and partners for 2013 and assessed in their global and regional geographical context Comparisons were made with climatological averages and records (historical background) whenever possible and appropriate
The global temperature assessment is based on three independent datasets that are maintained by the Met Office Hadley Centre and the Climatic Research Unit of the University of East Anglia (HadCRU), both in the United Kingdom; the National Climatic Data Center of the National Oceanic and Atmospheric Administration (NCDC–NOAA), based in the United States; and the Goddard Institute for Space Studies (GISS) operated by the National Aeronautics and Space Administration (NASA), also in the United States The HadCRU dataset extends back to 1850, and the NCDC and GISS datasets (and hence the combined dataset) extend back to 1880 Other datasets have also been used for additional analysis
The content was developed and peer-reviewed by several experts affiliated with international and regional climate institutions, centres and programmes, and by the world’s National Meteorological and Hydrological Services (NMHSs), the main providers of the under-lying observations and climate information More than 50 NMHSs provided direct input
to the Statement following the WMO call for contributions Many others made their data and climate reports available on their websites, and these were accessed when necessary When doubts arose as to facts and figures, WMO communicated with the relevant national source in order to verify the information before its inclusion in the Statement The definition of the Regions is based on the WMO regional structure, as follows:
• Africa (Region I)• Asia (Region II)• South America (Region III)• North America, Central America and the
Caribbean (Region IV)• South-West Pacific (Region V)• Europe (Region VI)
WMO Climate System Monitoring uses Essential Climate Variables (ECVs) as defined by the Global Climate Observing System Some 50 ECVs have been identified as fundamental for global observation This Statement incorporates assessments of the status of the global climate and observed extremes detected using ECV data and products, including air temperature, precipitation, stratospheric ozone and long-lived greenhouse gases (atmospheric ECVs); snow cover, ice sheets and soil moisture (terrestrial ECVs); as well as sea ice, sea level rise, sea surface temperature and ocean acidification (oceanographic ECVs)
Preface

4
TEMPERATURES
The year 2013 tied with 2007 as the sixth warm-est since global records began in 1850 The global average surface temperature was 0 50°C ±0 10°C (0 90°F ±0 18°F) above the 1961–1990 average and 0 03°C (0 05°F) above the 2001–2010 average The past year was also warmer than both 2011 and 2012, which, though marked by cooling La Niña conditions, were 0 43°C and 0 46°C above average, respectively
Warming El Niño and cooling La Niña events are major drivers of natural variability in the climate system Neither condition was present during 2013, which was among the four warmest
ENSO-neutral years on record Thirteen of the fourteen warmest years on record, including 2013, have all occurred in the twenty-first cen-tury The warmest on record are 2010 and 2005, followed by 1998 El Niño conditions dominated the early months of 2010 and 1998, and weak El Niño-type conditions extended from 2004 to the first half of 2005
To arrive at these figures, WMO takes an average of the three main global temperature datasets, which are managed separately and use differ-ent methodologies Other datasets produce similar but slightly different results A separate temperature analysis conducted by the Japan Meteorological Agency, for example, estimates that 2013 was the second warmest year on record According to reanalysis data from the European Centre for Medium-Range Weather Forecasts, 2013 tied with 1998 as the fourth warmest since 1958
Because the capacity for heat absorption differs over land and over sea, the air over the land tends to warm up faster Across the world’s land surfaces, the 2013 global air temperature was 0 85°C ±0 17°C above the 1961−1990 aver-age and 0 06°C above the 2001−2010 average, the fourth highest on record A very warm November–December period that ranked second behind 2006 contributed to this high tempera-ture anomaly Over the global ocean, the surface temperature for 2013 tied with 2004 and 2006 as
Figure 1. Global land air surface and sea surface temperature anomalies (°C) for 2013, relative to 1961–1990(Source: Met Office Hadley Centre, United Kingdom, and Climatic Research Unit, University of East Anglia, United Kingdom)
Figure 2. Annual global average temperature anomalies (relative to 1961–1990) from 1850 to 2013 from the Hadley Centre/CRU (HadCRUT4) (black line and grey area, representing average and 95 per cent uncertainty range), the NOAA National Climatic Data Center (red), and the NASA Goddard Institute for Space Studies (blue) (Source: Met Office Hadley Centre, United Kingdom, and Climatic Research Unit, University of East Anglia, United Kingdom)
180 90W 0 90E 18090S
45S
0
45N
90N
–10 –5 –3 –1 –0.5 –0.2 0 0.2 0.5 1 3 5 10
1850 1900 1950 2000Year
– 0.8
– 0.6
– 0.4
– 0.2
0
0.2
0.4
0.6
Glo
bal
ave
rag
e te
mp
erat
ure
an
om
aly
(°C
) Met Office Hadley Centre and Climatic Research UnitNOAA National Climatic Data CenterNASA Goddard Institute for Space Studies
Key findings

5
the sixth warmest on record, at 0 35°C ±0 07°C above the 1961−1990 average
The northern hemisphere’s weather patterns during early 2013 were largely influenced by the Arctic Oscillation This brought cooler- than-average spring temperatures to much of Europe, the south-eastern United States, north-western Russian Federation and parts of Japan The Arctic region, meanwhile, was considerably warmer than average, along with much of central and northern Africa, the eastern Mediterranean, southern Russian Federation and much of China This so-called warm Arctic, cold continents pattern is characteristic of the Arctic Oscillation’s negative phase The year 2013 saw the most negative Arctic Oscillation on record for the month of March A similar pattern with high pressure over Greenland and low pressure to the south re-emerged in late spring, once again causing cold Arctic air to surge into western and central Europe
In the southern hemisphere, summer was extremely warm, with monthly January tem-perature anomalies reaching +5°C in parts of Australia Exceptional warm conditions were also present during the winter, with New Zealand experiencing its warmest winter on record The beginning of austral summer 2013/2014 was very hot in parts of South America, with the December temperature reaching new record highs As a result of the continued warmth
throughout the year across parts of the southern hemisphere, 2013 was the warmest year on record in Australia, second warmest in Argentina and third warmest in New Zealand Modelling experiments have indicated that the odds of the record Australian hot summer occurring were increased fivefold by human-induced climate change (see page 20 and accompanying figure)
RAIN, SNOW AND ICE
Global precipitation during 2013 equalled the 1961–1990 average of 1 033 mm, according to the National Oceanic and Atmospheric Administration (United States) Precipitation at
Figure 4. January–December global land and ocean surface temperature anomalies (relative to 1961–1990) for the period 1950–2013; years that started with a moderate or strong La Niña already in place are shown in blue; years that started with a moderate or strong El Niño already in place are shown in red; other years are shown in grey.
Figure 3. Global ranked land and ocean surface temperatures for the warmest 50 years. Inset shows global ranked surface temperatures from 1850. The size of the bars indicates the 95 per cent confidence limits associated with each year. Values are simple area-weighted averages for the whole year. (Source: Met Office Hadley Centre, United Kingdom, and Climatic Research Unit, University of East Anglia, United Kingdom)
10 20 30 40 50
–0.2
0.0
0.2
0.4
0.6
Tem
per
atu
re d
iffe
ren
ce (
°C)
fro
m 1
961–
1990
ave
rag
e
0 50 100 150Rank
–0.6–0.8
–0.4–0.20.00.20.40.6
Rank of hottest years to coldest
2010
2005
1998
2003
2002
2013
2007
2006
2009
2012
2004
2001
2011
2008
1997
1995
1999
2000
1990
1991
1988
1996
1994
1987
1983
1981
1989
1993
1980
1992 19
4419
7319
8619
7719
7919
53 1878
1963 19
4119
8219
8418
8019
58 1940
1969
1961
1962 19
4319
85
2011–20132001–20101991–20001971–19901951–19701931–19501911–19301850–1910
1942
-0.30
-0.20
-0.10
0.00
0.10
0.20
0.30
0.40
0.50
0.60
1950 1955 1960 1965 1970 1975 1980
Year
Tem
per
atu
re a
no
mal
y (°
C)
1985 1990 1995 2000 2005 2010
El Niño La Niña Neutral
6
the regional level, however, varied significantly For example, wetter-than-average conditions were seen across most of Greenland, the southern Arabian Peninsula, central India and western China Drier-than-average conditions were present over the western United States, much of northern Canada, northern Siberia and the eastern inland of Australia
Winter snow cover in North America has var-ied widely over the past few years During the 2012/2013 winter, snow cover extent was 500 000 km2 above the 1981–2010 average, resulting in the fourteenth largest winter extent for the continent since records began in 1966 During the spring, North American snow cover was 830 000 km2 above average, making it the tenth largest spring extent for the continent and the largest since 1997
During the same period, snow cover extent across the Eurasian continent was 1 71 million km2 above the 1981–2010 average, the third largest winter extent on record for this region and the largest since 2003 In the spring, the continent’s snow cover contracted significantly to 430 000 km2 below average, resulting in the fourteenth small-est extent on record for the season In May,
Eurasian snow cover dipped to 7 3 million km2, setting a new record low for that month
As further evidence of the rapid response of the Arctic cryosphere to increasing air tem-peratures, the northern hemisphere June snow cover is currently decreasing at a faster rate than Arctic summer minimum sea-ice extent, and at rates that exceed the projection of cli-mate models June 2013 snow cover across the hemisphere was the second lowest, greater only than the record low of 2012
Soil moisture is a key variable for monitor-ing the climate system because it strongly influences the exchange of water and energy between the land surface and the atmo-sphere Very wet soil conditions resulting from hydrometeorological events were noticeable and had an impact on floods in a number of regions including eastern parts of the Russian Federation, north-eastern China, India, the Philippines and central Europe On the other hand, annual soil moisture anomalies indicated dryness in the southern hemisphere, where Australia, South America and southern Africa experienced severe drought conditions during the first part of the year
Figure 5. Annual precipitation anomalies for global land areas for 2013; gridded 1.0-degree raingauge-based in mm/month (relative to 1951–2000) (Source: Global Precipitation Climatology Centre, Deutscher Wetterdienst, Germany)
90S
60S
30S
0
30N
60N
90N
120W 60W180 0 60E 120E 180
–50 10–70 50–10–30 30 70

7
Arctic sea-ice extent reached its annual max-imum on 15 March at 15 13 million km2 This was approximately 0 5 million km2 below the average 1981–2010 annual maximum, making it the sixth smallest maximum sea-ice extent since satellite records began in 1979 During the 2012/2013 growth season, Arctic sea-ice extent grew by 11 72 million km2, the largest seasonal increase on record; this growth can be explained by the record small sea-ice extent of September 2012 Arctic maximum sea-ice extent in March has decreased at an average rate of 2 6 per cent per decade
Another way to assess the state of the Arctic sea ice is to estimate the age of the ice, given that first-year ice is the thinnest and most sus-ceptible to melting Ice that was four years of age and older decreased from 18 per cent of the ice cover in March 1984 to 2 per cent in March 2012 It increased slightly to 3 per cent in 2013 In March 1984, 56 per cent of the ice pack was composed of first-year ice, while in March 2013 first-year ice comprised 78 per cent of total ice cover at its peak
The Arctic reached its annual minimum sea-ice cover on 13 September, at 5 10 million km2 or 18 per cent below the 1981–2010 average minimum, making it the sixth smallest annual minimum on record All seven of the lowest Arctic sea-ice extents in the satellite record have occurred in the last seven years, beginning with 2007 September Arctic sea-ice extent has decreased at an average rate of 13 7 per cent per decade The total minimum sea-ice volume, which combines measures of ice extent and model simulations of ice thickness, was higher in 2013 than in 2010, 2011 and 2012, but lower than in 2007 and well below the 1979−2012 average
February marked the end of the Antarctic sea-ice melt season in 2013 The annual minimum extent of sea ice was reached on 20 February at 3 68 million km2 This was the second largest annual minimum sea-ice extent for Antarctica In addition, Antarctic sea-ice extent reached a record maximum for the second year in a row On 1 October, it was 19 57 million km2, 2 7 per cent higher than the 1981−2010 average
September Antarctic sea-ice extent has increased at an average rate of 1 1 per cent per decade
Scientists believe that changes in atmospheric circulation over the past three decades, which have weakened the prevailing winds that circle Antarctica, may be a factor The increasing extent of the ice may also be linked to changing ocean circulation and a build-up of cold freshwater on the surface of the Southern Ocean due to increasing precipitation and melting land-based ice shelves
Melting at the surface of the Greenland ice sheet was much less dramatic in 2013 than in the record year of 2012 It peaked in late July, when satellites detected melting over 44 per cent of the surface This coincided with record warmth in south-western Greenland (30 July saw a temperature of 25 9°C in Maniitsoq, the high-est temperature ever recorded in Greenland) The last decade has experienced accelerated melting of the sea-ice cover and mass loss of the Greenland ice sheet
OCEANS
The ocean acts as an effective buffer for the climate system by absorbing and storing a large amount of excess carbon and heat from the atmosphere It has absorbed approximately one quarter of all the carbon dioxide (CO2) released into the atmosphere by humans since the start of the industrial revolution This absorbed CO2 forms a weak carbonic acid, which causes ocean
Jan Feb AprMar Aug Oct DecNovMay Jun SepJul2
4
6
8
12
14
16
10
Ext
ent (
mill
ion
s o
f sq
uar
e ki
lom
etre
s)
20121981–2010 average
2013
Month
Figure 6. Arctic sea-ice extent in 2013, compared with 2012 and the 1981–2010 average(Source: National Snow and Ice Data Center, United States)

8
acidification As a result, the pH of the ocean has decreased by 0 11, which corresponds approximately to a 30 per cent increase in acidity Ocean acidification is already harming corals, shellfish and other marine life
While the rate at which surface air temperatures are rising has slowed in recent years, heat continues to be trapped in the Earth system, mostly as increased ocean heat content About 93 per cent of the excess heat trapped in the Earth system between 1971 and 2010 was taken up by the ocean From around 1980 to 2000, the ocean gained about 50 zettajoules (1021 joules) of heat Between 2000 and 2013, it added about three times that amount Prior to 2000, most of the heat was trapped between the sea surface and a depth of 700 m Since then, most of the heat has been stored at depths of 700 m to 2 000 m The increased uptake in this region may be due to changes in atmospheric and ocean circulation patterns in the tropical Pacific and to interactions with large-scale climate patterns such as ENSO and the Pacific Decadal Oscillation
Globally, sea level has risen by 19 cm since the start of the twentieth century, mostly because of the thermal expansion of the oceans and the melting of glaciers and ice caps Since mea-surements began in 1993, sea level has been rising at about 2 9–3 2 mm/yr (based on two separate estimates, each with an uncertainty of ±0 4 mm/yr), with some year-to-year variability
This range encompasses the observed rate of about 3 mm/yr for the 2001–2010 decade and is around double the observed twentieth century trend of 1 6 mm/yr
Preliminary analyses indicate that the global average sea level reached a new record high in March Some regions of the globe are experi-encing greater sea-level rise than others (some are even experiencing declining sea levels) due to local variations in currents, land movements and ocean warming The region of the Pacific Ocean near the Philippines has observed some of the highest rising sea-level rates over the past half century This contributed to the enormous devastation in parts of the Philippine islands, when Typhoon Haiyan struck in November and caused a massive storm surge
REGIONAL HIGHLIGHTS
AFRICA
The continent experienced an overall hot year, with 2013 ranking as the second warmest on record, behind 2010 The temperature in Vioolsdrif, South Africa, soared to 47 3°C on 4 March – the hottest March temperature ever measured in Africa In West Africa, the temperature in Navrongo, Ghana, reached 43°C on 6 March, the warmest temperature ever measured in Ghana Several temperature records were also broken in Kenya Spring and October temperatures in Tunisia, which were
60°S
30°
EQ
30°
60°N
90°E 180° 90°W 0°
mm/year
−30 −20 −10 0 10 20 30
Figure 7. Sea level trends for the period 2003–2013 (Source: Commonwealth Scientific and Industrial Research Organization (CSIRO) Marine and Atmospheric Research, Australia)
AG
NIE
SZK
A FL
AK
/ REU
TERS
Women collect water at the Chaquelane resettlement camp near the flood hit town of Chokwe, in southern Mozambique.
9
2 2°C and 4°C above average, respectively, contributed to one of the 10 warmest years in the country since 1950
Above-average precipitation occurred in northern Mali and adjacent areas in Algeria Below-average precipitation was recorded along the Gulf of Guinea, from Côte d’Ivoire to Nigeria and over the southernmost parts of Ghana, Benin and Togo
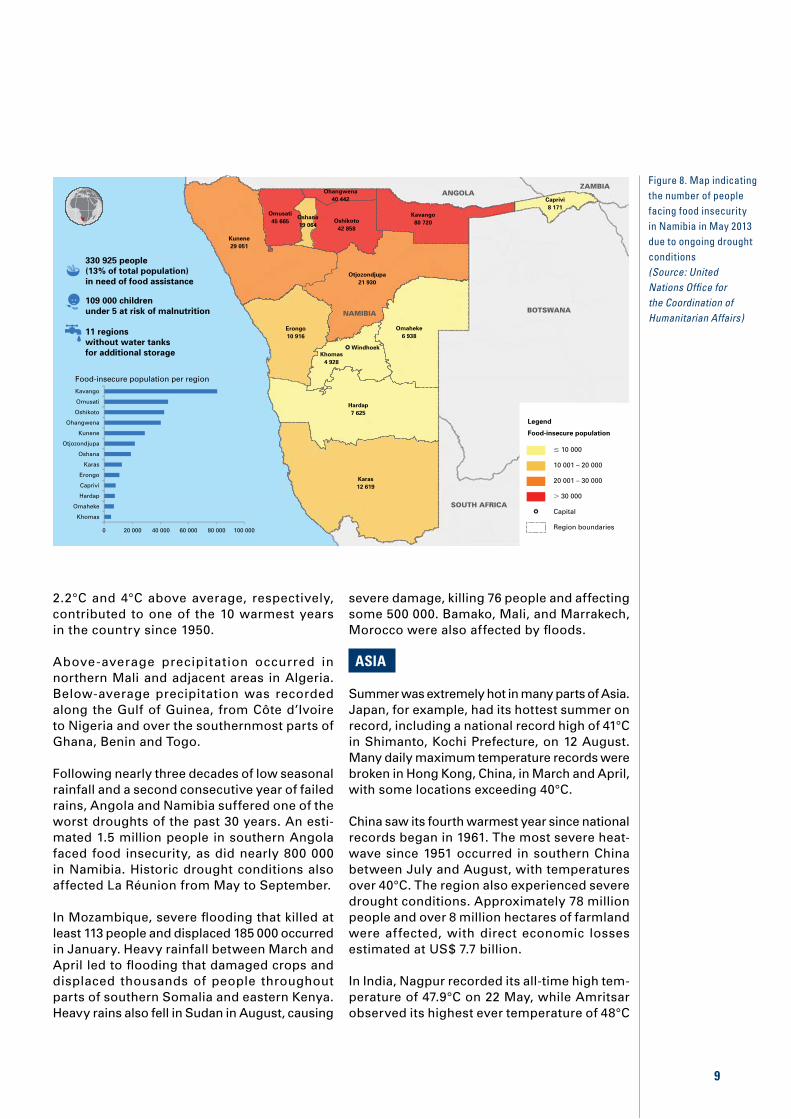
Following nearly three decades of low seasonal rainfall and a second consecutive year of failed rains, Angola and Namibia suffered one of the worst droughts of the past 30 years An esti-mated 1 5 million people in southern Angola faced food insecurity, as did nearly 800 000 in Namibia Historic drought conditions also affected La Réunion from May to September
In Mozambique, severe flooding that killed at least 113 people and displaced 185 000 occurred in January Heavy rainfall between March and April led to flooding that damaged crops and displaced thousands of people throughout parts of southern Somalia and eastern Kenya Heavy rains also fell in Sudan in August, causing
severe damage, killing 76 people and affecting some 500 000 Bamako, Mali, and Marrakech, Morocco were also affected by floods
ASIA
Summer was extremely hot in many parts of Asia Japan, for example, had its hottest summer on record, including a national record high of 41°C in Shimanto, Kochi Prefecture, on 12 August Many daily maximum temperature records were broken in Hong Kong, China, in March and April, with some locations exceeding 40°C
China saw its fourth warmest year since national records began in 1961 The most severe heat-wave since 1951 occurred in southern China between July and August, with temperatures over 40°C The region also experienced severe drought conditions Approximately 78 million people and over 8 million hectares of farmland were affected, with direct economic losses estimated at US$ 7 7 billion
In India, Nagpur recorded its all-time high tem-perature of 47 9°C on 22 May, while Amritsar observed its highest ever temperature of 48°C
330 925 people(13% of total population)in need of food assistance
109 000 childrenunder 5 at risk of malnutrition
11 regionswithout water tanksfor additional storage
Food-insecure population per region
Kavango
Omusati
Oshikoto
Ohangwena
Kunene
Otjozondjupa
Oshana
Karas
Erongo
Caprivi
Hardap
Omaheke
Khomas
0 20 000 40 000 60 000 80 000 100 000
NAMIBIA
ANGOLAZAMBIA
BOTSWANA
SOUTH AFRICA
Kunene29 051
Ohangwena40 442
Omusati45 665
Oshana19 064
Oshikoto42 858
Kavango80 720
Caprivi8 171
Otjozondjupa21 930
Erongo10 916
Omaheke6 938
Khomas4 928
Hardap7 625
Karas12 619
Legend
Food-insecure population
� 10 000
10 001 – 20 000
20 001 – 30 000
� 30 000
Capital
Region boundaries
Windhoek
Figure 8. Map indicating the number of people facing food insecurity in Namibia in May 2013 due to ongoing drought conditions (Source: United Nations Office for the Coordination of Humanitarian Affairs)

Figure 9. Significant climate anomalies and events in 2013 (Source: National Climatic Data Center, NOAA, United States)
Western North Pacific typhoon seasonAbove-average activity:31 storms, 13 typhoons;the most active season since 2004
Typhoon Usagi16–24 SeptemberMaximum winds – 260 km/h Made landfall in northern Philippines on 21 September, severely damaging the agriculture in the region and causing floods and landslides that claimed 30 lives
Typhoon Haiyan3–11 NovemberMaximum winds – 315 km/h Strongest tropical cyclone on record for any basin to make landfall; also the deadliest Philippine typhoon on record, killing over 6 200 people
Tropical Storm Haruna19 February–1 MarchMaximum winds – 164 km/h Made landfall in Madagascar on 22 February and vacillated for 7 days in the Mozambique channel
Tropical Storm Chantal7–10 JulyMaximum winds – 100 km/h Fastest-moving tropical cyclone observed in the deep Tropics (south of 20°N) in the Atlantic basin on record (1966–2013)
SudanHeavy rains throughout much of Sudan between 1 and 4 August, spawning significant flooding
Southern AfricaLarge rainfall deficit during much of the year in Botswana, Namibia and Angola, causing one of the worst droughts in 30 years
South-West Pacific cyclone seasonWell-below-average activity: 5 storms, 4 cyclones
South-West Indian Ocean cyclone seasonNear-average activity:10 storms, 7 cyclones
South AfricaTemperatures rising to 47.3°C on 4 March in Vioolsdrif; the hottest March temperature recorded anywhere in Africa
Russian FederationWarmest November and December since national records began in 1891; overall, the country’s sixth warmest year on record
NorwaySecond wettest December, behind 1975, since national records began in1900
North Indian Ocean cyclone seasonBelow-average activity: 5 storms, 3 cyclones
New ZealandThird warmest year since national records began in 1909; also, fourth warmest July and warmest August, resulting in the warmest June–August (winter) period
MaliFlooding caused by heavy rains between 9–12 August in the Kidal and Segou regions, with torrential rains on 28 August provoking flash floods in Bamako
GreenlandHighest air temperature ever observed in Greenland recorded in Maniitsoq when temperatures soared to 25.9°C on 30 July
Global tropical cyclone activityNear-average activity: 94 storms, 41 hurricanes/typhoons/cyclones
GhanaTemperatures reaching 43.0°C in Navrongo on 6 March; the country’s hottest temperature ever measured for any month
Extra-tropical stormWidespread wind gusts reaching 111–129 km/h across south-east England, the strongest autumn storm in the region since 2002
El Niño-Southern Oscillation (ENSO)Neutral ENSO conditions persisted throughout the year.
Eastern North Pacific hurricane seasonAbove-average activity:20 storms, 9 hurricanes
Eastern CanadaMajor storm on 21 December in the east, causing flight delays and highway accidents
Cyclone Phailin4–14 OctoberMaximum winds – 260 km/h Strongest storm in the North Indian basin since the Odisha Super Cyclone in 1999
Central EuropeThe most intense and extended flooding in Danube and Elbe river catchments since at least 1950, caused by extreme precipitation
CanadaTorrential downpours on 19 June triggering floods that caused billions of dollars in damages across parts of southern Alberta; Canada’s costliest natural disaster
BrazilHeavy rains across parts of south-eastern states during December, triggering floods and landslides; record rainfall for the month in many states; over 400 per cent of the average December rainfall in the city of Aimores; torrential downpours resulting in 45 fatalities
BrazilBelow-average rainfall in the north-east in early 2013 and in some locations the worst drought in the past half century
AustraliaWarmest year on record; warmest December–February, third warmest June–August and warmest September–November contributing to overall record warmth
Australian cyclone seasonBelow-average activity:10 storms, 4 cyclones
ArgentinaPersistent heatwave during mid-December in north and central regions, with several locations observing new maximum, minimum and mean temperature records for December; warmth throughout the year contributing to 2013 ranking as the second warmest year on record behind 2012
Atlantic hurricane seasonNear-average activity:13 storms, 2 hurricanesNo major hurricanes in the basin for the first time since 1994; lowest number of hurricanes since 1982
Alaska, United StatesWet conditions, resulting in the third wettest year in the 96-year record for the state
MexicoFor the first time since 1958, two tropical systems, Hurricanes Manuel (Eastern North Pacific) and Ingrid (North Atlantic), made landfall nearly simultaneously on 15 September. Copious rain led to flooding and landslides.
United StatesImproved drought conditions across the south-east and central regions but deteriorating conditions in the Far West; California’s driest year and fourth driest year on record in Oregon
United KingdomColdest March since 1962 and May since 1996; overall, coldest spring since 1962; 20 cm or more of snow during 22–24 March in northern region; the region’s most significant late winter snow event since 1979
SpainMore than triple the monthly average precipitation in March; wettest March since national records began in 1947
FranceSecond coldest mean maximum temperature in May since 1950
ChinaOne of the most severe heatwaves during July and August in southern region; daily maximum temperatures higher than 40°C recorded at more than 300 stations, the heat causing the death of over 40 people
Antarctic sea-ice extentSecond largest minimum sea-ice extent in the Antarctic during the melt season; during the growth season, largest sea-ice extent since records began in 1979
Middle EastRare snowstorm event in western Syrian Arab Republic, Jordan and Israel in mid-December
Islamic Republic of Iran
Moderate to extreme drought during August–September in Ghorveh and Hamedan
Republic of Korea and JapanWarmest summers (June–August) on record; new national daily maximum temperature in Japan when temperatures rose to 41˚C in Kochi Prefecture on 12 August
China and Russian FederationHeavy rain in August in parts of eastern Russian Federation and north-eastern China; in China, Nankouqian Township received half its annual average total in a single day on 16 August; in the Russian Federation, worst flooding in 120 years in more than 140 towns
10
Cyclone maximumwind legend
(km/h)
63 – 118119 – 153154 – 177178 – 208209 – 251 > 251

Western North Pacific typhoon seasonAbove-average activity:31 storms, 13 typhoons;the most active season since 2004
Typhoon Usagi16–24 SeptemberMaximum winds – 260 km/h Made landfall in northern Philippines on 21 September, severely damaging the agriculture in the region and causing floods and landslides that claimed 30 lives
Typhoon Haiyan3–11 NovemberMaximum winds – 315 km/h Strongest tropical cyclone on record for any basin to make landfall; also the deadliest Philippine typhoon on record, killing over 6 200 people
Tropical Storm Haruna19 February–1 MarchMaximum winds – 164 km/h Made landfall in Madagascar on 22 February and vacillated for 7 days in the Mozambique channel
Tropical Storm Chantal7–10 JulyMaximum winds – 100 km/h Fastest-moving tropical cyclone observed in the deep Tropics (south of 20°N) in the Atlantic basin on record (1966–2013)
SudanHeavy rains throughout much of Sudan between 1 and 4 August, spawning significant flooding
Southern AfricaLarge rainfall deficit during much of the year in Botswana, Namibia and Angola, causing one of the worst droughts in 30 years
South-West Pacific cyclone seasonWell-below-average activity: 5 storms, 4 cyclones
South-West Indian Ocean cyclone seasonNear-average activity:10 storms, 7 cyclones
South AfricaTemperatures rising to 47.3°C on 4 March in Vioolsdrif; the hottest March temperature recorded anywhere in Africa
Russian FederationWarmest November and December since national records began in 1891; overall, the country’s sixth warmest year on record
NorwaySecond wettest December, behind 1975, since national records began in1900
North Indian Ocean cyclone seasonBelow-average activity: 5 storms, 3 cyclones
New ZealandThird warmest year since national records began in 1909; also, fourth warmest July and warmest August, resulting in the warmest June–August (winter) period
MaliFlooding caused by heavy rains between 9–12 August in the Kidal and Segou regions, with torrential rains on 28 August provoking flash floods in Bamako
GreenlandHighest air temperature ever observed in Greenland recorded in Maniitsoq when temperatures soared to 25.9°C on 30 July
Global tropical cyclone activityNear-average activity: 94 storms, 41 hurricanes/typhoons/cyclones
GhanaTemperatures reaching 43.0°C in Navrongo on 6 March; the country’s hottest temperature ever measured for any month
Extra-tropical stormWidespread wind gusts reaching 111–129 km/h across south-east England, the strongest autumn storm in the region since 2002
El Niño-Southern Oscillation (ENSO)Neutral ENSO conditions persisted throughout the year.
Eastern North Pacific hurricane seasonAbove-average activity:20 storms, 9 hurricanes
Eastern CanadaMajor storm on 21 December in the east, causing flight delays and highway accidents
Cyclone Phailin4–14 OctoberMaximum winds – 260 km/h Strongest storm in the North Indian basin since the Odisha Super Cyclone in 1999
Central EuropeThe most intense and extended flooding in Danube and Elbe river catchments since at least 1950, caused by extreme precipitation
CanadaTorrential downpours on 19 June triggering floods that caused billions of dollars in damages across parts of southern Alberta; Canada’s costliest natural disaster
BrazilHeavy rains across parts of south-eastern states during December, triggering floods and landslides; record rainfall for the month in many states; over 400 per cent of the average December rainfall in the city of Aimores; torrential downpours resulting in 45 fatalities
BrazilBelow-average rainfall in the north-east in early 2013 and in some locations the worst drought in the past half century
AustraliaWarmest year on record; warmest December–February, third warmest June–August and warmest September–November contributing to overall record warmth
Australian cyclone seasonBelow-average activity:10 storms, 4 cyclones
ArgentinaPersistent heatwave during mid-December in north and central regions, with several locations observing new maximum, minimum and mean temperature records for December; warmth throughout the year contributing to 2013 ranking as the second warmest year on record behind 2012
Atlantic hurricane seasonNear-average activity:13 storms, 2 hurricanesNo major hurricanes in the basin for the first time since 1994; lowest number of hurricanes since 1982
Alaska, United StatesWet conditions, resulting in the third wettest year in the 96-year record for the state
MexicoFor the first time since 1958, two tropical systems, Hurricanes Manuel (Eastern North Pacific) and Ingrid (North Atlantic), made landfall nearly simultaneously on 15 September. Copious rain led to flooding and landslides.
United StatesImproved drought conditions across the south-east and central regions but deteriorating conditions in the Far West; California’s driest year and fourth driest year on record in Oregon
United KingdomColdest March since 1962 and May since 1996; overall, coldest spring since 1962; 20 cm or more of snow during 22–24 March in northern region; the region’s most significant late winter snow event since 1979
SpainMore than triple the monthly average precipitation in March; wettest March since national records began in 1947
FranceSecond coldest mean maximum temperature in May since 1950
ChinaOne of the most severe heatwaves during July and August in southern region; daily maximum temperatures higher than 40°C recorded at more than 300 stations, the heat causing the death of over 40 people
Antarctic sea-ice extentSecond largest minimum sea-ice extent in the Antarctic during the melt season; during the growth season, largest sea-ice extent since records began in 1979
Middle EastRare snowstorm event in western Syrian Arab Republic, Jordan and Israel in mid-December
Islamic Republic of Iran
Moderate to extreme drought during August–September in Ghorveh and Hamedan
Republic of Korea and JapanWarmest summers (June–August) on record; new national daily maximum temperature in Japan when temperatures rose to 41˚C in Kochi Prefecture on 12 August
China and Russian FederationHeavy rain in August in parts of eastern Russian Federation and north-eastern China; in China, Nankouqian Township received half its annual average total in a single day on 16 August; in the Russian Federation, worst flooding in 120 years in more than 140 towns
11
TROPICAL CYCLONE CATEGORYHurricane, cyclone and typhoon are different terms for the same weather phenomenon that is accompanied by torrential rain and maximum sustained wind speeds (near centre) exceeding 119 kilometres per hour Such a weather phenomenon is referred to by the following name depending on the region:
• Hurricane: Western North Atlantic, central and eastern North Pacific, Caribbean Sea and Gulf of Mexico;
• Typhoon: Western North Pacific;
• Cyclone: Bay of Bengal and Arabian Sea;
• Severe tropical cyclone: Western South Pacific and South-East Indian Ocean;
• Tropical cyclone: South-West Indian Ocean

12
on both 23 and 24 May More than 2 700 people perished due to the heat South-west Asian monsoon rainfall for the country as a whole was 106 per cent of the average, but was character-ized by regional variations The monsoon had an early onset over all of India and brought the worst flooding and devastation in the past half century to regions near the India-Nepal border North-western India received nearly double its average June rainfall; thousands of people were killed and many more went missing
Pakistan saw its most severe heatwave in decades, with temperatures reaching 51°C in Larkana, the highest May temperature in the city since 1998 Cotton crops and rice paddies were damaged, and more than 100 people died Punjab and Sindh provinces were inundated by floods due to heavy monsoon rains during most of August The floods covered about 200 000 km2, killing an estimated 250 people and affecting nearly 1 5 million
Northern East Asia had a cold period during its 2012/2013 winter season, associated with neg-ative Arctic Oscillation conditions and blocking patterns around eastern Siberia Most of Siberia was 2°C−3°C below average, making this one of its coldest winters of the twenty-first century
From the end of July to mid-August, unusually heavy rain fell near the Amur river, which marks the border between China and the Russian
Federation The Songhuajiang and Liaohe river basins in north-eastern China saw their heaviest floods since 1998 Massive flooding was also reported in eastern Russian Federation More than 140 towns were affected by the worst flooding in 120 years
SOUTH AMERICA
Temperatures in South America were dominated by hot conditions in most parts of the continent, except for some limited areas in southern Brazil and the north-central and western parts of South America, which had near to colder than average temperatures A warm October–December period – including the hottest December on record – contributed to the second warmest year in Argentina since records began in 1961, behind only the record warmth of 2012 In December, the most significant heatwave since 1987 struck central and northern Argentina
North-eastern Brazil experienced its worst drought in 50 years This followed the 2001–2010 decade, when large parts of the Amazon Basin saw prolonged drought The Brazilian Plateau, which is the core monsoon region in South
Figure 10. Precipitation anomalies over South America during the active monsoon season, September 2012– May 2013 (Sources: NOAA Climate Prediction Center, United States, and Instituto Nacional de Meteorologia and Centro de Previsão de Tempo e Estudos Climáticos, Brazil)
10N
EQ
10S
20S
30S
40S
50S
60S80W 60W 40W
200016001200800600400200–200–400–600–800–1200
MO
HSI
N R
AZA
/ RE
UTE
RS
A boy jumps into a water canal to cool himself with others on a hot day in the eastern city of Lahore, Pakistan.

13
Figure 11. Drought conditions over North America for the beginning of 2013 (Sources: NOAA National Climatic Data Center, in association with the United States Department of Agriculture, the NOAA Climate Prediction Center and the National Drought Mitigation Center, United States; Environment Canada and Agriculture and Agri-Food, Canada; the Comisión Nacional del Agua, and the Servicio Meteorológico Nacional, Mexico)
America, experienced its largest rainfall deficit since records began in 1979; damages exceeded US$ 8 billion
On 2 April, La Plata, Argentina, received about 300 mm of rainfall in just three hours The torrential downpour led to flash floods that resulted in more than 50 fatalities, making this one of the worst weather disasters in the history of Argentina Many states in Brazil also had extremely heavy rainfall during December, with at least seven cities setting new precipi-tation records In south-eastern Brazil, the city of Aimores received more than four times its average rainfall for the month
NORTH AMERICA, CENTRAL AMERICA AND THE CARIBBEAN
Temperatures across most of North America were above average during 2013, but were more moderate overall than in 2012 Winter was warmer than average in Canada and the United States, although spring in the contiguous United States was the coolest since 1996 Temperatures in the United States rebounded during the sum-mer, and the warmth continued into September
Summer in Alaska was the second hottest on record, and October–December was the sixth warmest such period on record for the state Mexico experienced a record warm July and August and a warm autumn
In Canada, 2013 was the thirteenth driest year on record Nevertheless, torrential downpours overwhelmed Calgary and vast areas of south-ern Alberta in June, forcing 100 000 people to evacuate their homes and causing close to US$ 6 billion in damage The contiguous United States was wetter than average for the year, with some geographical variations Two states, Michigan and North Dakota, experienced record wet conditions Alaska observed its third wettest year on record and the wettest in the past 50 years
A major drought that encompassed large parts of the central United States in 2012 and early 2013 improved across much of the country By the end of 2013, about 31 per cent of the country was experiencing drought, down from about 61 per cent at the beginning of the year California had its driest year since records began in 1895; San Francisco received only 16 per cent
LS
SS
L
S
S
L
L
L
L
L
S
L
L
L
L
SL
SL
SL
SL
SL
SL
SL
SL
SL
SL
SL
Intensity:
D0 Abnormally dry
D1 Drought – moderate
D2 Drought – severe
D3 Drought – extreme
D4 Drought – exceptional
Drought impact types:
Delineates dominant impacts
S = Short-term, typically < 6 months
(e.g. agriculture, grasslands)
L = Long-term, typically > 6 months
(e.g. hydrology, ecology)
Drought not analyzedin shaded areas

14
of its average annual rainfall since local records began in 1947 Very hot conditions, combined with strong winds and drought, contributed to the worst wildfire in Colorado history
The contiguous United States was hit by several late-season winter storms In April, Bismarck, North Dakota received 44 cm of snow, setting a new calendar-day record Duluth, Minnesota and Rapid City, South Dakota each had their snowiest month on record, with 129 cm and 109 cm, respectively El Reno, Oklahoma, was struck by a particularly powerful tornado: at 4 3 km, it was the widest tornado ever observed in the United States
In the Caribbean, the Guadeloupe archipelago experienced strong drought conditions between January and March, and the lack of rain dam-aged sugar cane and banana crops Martinique received exceptionally heavy rainfall in April
SOUTH-WEST PACIFIC
In Australia, 2013 was the warmest year since national records began in 1910, at 1 20°C above average and 0 17°C higher than the previous record in 2005 January was the hottest month ever observed in the country The summer (December–February) and spring (September–November) were both the hottest on record, and the winter (June–August) was the third warmest On 7 January, a new national average
daily maximum temperature of 40 30°C was set The temperature in Moomba, South Australia, reached 49 6°C, the highest recorded in the state since 1960 Hobart recorded its all-time high observed temperature of 41 8°C on 4 January, while the temperature in Sydney reached 45 8°C on 18 January, the hottest since records began During the same month, a tropical low caused major flooding along much of the east coast of Queensland and northern New South Wales In Queensland, five people were killed and 8 000 residents were forced to evacuate as floods reached record heights
New Zealand experienced its warmest winter on record and its third warmest year overall since national records began in 1909 The northern and eastern parts of the country had their driest year on record and suffered drought, while other parts experienced near-record high annual rainfall
Drier-than-normal weather conditions since late 2012 resulted in severe drought conditions in the northern Marshall Islands This led to critical shortages of drinking water, damaged food crops and the declaration of a national state of disaster Abundant rain fell in June over the south of Atuona in the Marquesas Islands of French Polynesia On 5 June, the region received 66 1 mm of precipitation in one hour Heavy rains following an extra-tropical depression fell on New Caledonia during 1–3 July A total of 714 mm of rain fell in a 24-hour period, setting a new record
EUROPE AND THE MIDDLE EAST
The year 2013 was the sixth warmest on record across Europe Many regions were warmer than average at the start of 2013 The north-east of Iceland had its warmest January–February period on record In Lithuania, February was 3°C warmer than average However, the Jungfraujoch in the high mountains of Switzerland saw its coldest winter in the past 40 years
The north of the European part of the Russian Federation experienced the coldest March in the past half century, as temperatures plunged 8°C −10°C below average in some areas France, the Netherlands and the United Kingdom all had their coolest springs in decades In Iceland, a
Highest onrecord
Very muchabove average
Above average
Average
Below average
Very muchbelow average
10
8–9
4–7
2–3
1
Lowest onrecord
Temperature decile ranges
Figure 12. Annual (1 January– 31 December) average temperature deciles map for Australia for the period 1910–2013 (Source: Australian Bureau of Meteorology)

15 15
new minimum record for May was set when the temperature fell to –21 7°C in the eastern inland At the same time, the western Greenland coast had its record warmest March, and Norway and Sweden each observed one of their warmest months of May since their national records began
Summer was very hot for many European coun-tries Portugal endured one of its worst July heatwaves since 1941 The extended August heatwave in Austria set a new national record high of 40 5°C On 8 August, many stations in Slovenia observed their highest temperatures on record, with several exceeding 40°C On the same day in Slovakia, the temperature in Bratislava reached 39 4°C, the highest since observations began in 1850
The beginning of autumn was also anomalously warm over Europe Unusual warmth settled over the Russian Federation towards the end of 2013 Following its record warmest November of 5 3°C above the 1961–1990 average, the country observed its record warmest December, at 4 6°C above average Moscow and Saint Petersburg broke their daily maximum temperature records on 25 December by 0 4°C and 1 4°C, respectively
Extreme precipitation in the Alpine region and in Austria, Czech Republic, Germany, Poland and Switzerland caused the most intense and extended flooding in the Danube and Elbe river
catchments since at least 1950, as more than 400 mm of rain fell in some localized areas during 29 May–3 June Austria observed its wettest May–June period since records began in 1858 Some rivers reached historical record heights; in Germany, Passau saw its highest water level since 1501
During 10–15 December, a rare snowstorm hit parts of the Middle East In Egypt, snow fell in Cairo for the first time in 112 years The Syrian Arab Republic, Jordan and Israel also received unprecedented amounts of snow Cold weather accompanied the storm On 15 December, the temperature in Shoubak, Jordan, plummeted to –16°C, the lowest temperature ever recorded in the country
An extra-tropical cyclone struck the United Kingdom on 28 October, the strongest autumn storm to hit the region since 2002 During 4–7 December, an extra-tropical cyclone moved from west to east across northern Europe; the resulting storm surges, including in the United Kingdom and the Netherlands, were the worst in the past six decades In Germany, the storm surge reached 4–6 m above mean sea level, but dykes were 8 m tall
TROPICAL CYCLONES
Globally, there were 94 storms during 2013 (wind speeds equal to or greater than 63 km/h)
Figure 13. Temperature anomalies over Europe during March 2013 (Source: Deutscher Wetterdienst, Germany)
< –4
–4 – –3
–3 – –2
–2 – –1
–1 – 0
0 – 1
1 – 2
2 – 3
3 – 4
> 4
°C

The number of storms was higher than in 2012 (84 storms), 2011 (74 storms) and 2010 (67 storms, the lowest number in the modern satellite era) It should be noted that the total number of storms does not necessarily correlate with the number of storms that affect inhabited land areas
The Atlantic Ocean basin experienced 13 named storms, just above the 1981–2010 average of 12 storms, but below the recent decade of 2001–2010, which saw an average of 15 storms per year No storms attained major intensity (wind speed of 178 km/h) The intensity and duration of the season’s hurricanes were mea-sured as 33 per cent of the average, the lowest value since 1994
The Eastern North Pacific basin had above-av-erage hurricane activity in 2013 There were a total of 20 storms, 9 of which intensified to hurricane status and 1 of which (Raymond ) became a major hurricane Two hurricanes from two separate basins (Ingrid in the North Atlantic and Manuel in the Eastern North Pacific) struck Mexico nearly simultaneously on 15 September This unusual event, which had not occurred
since 1958, displaced tens of thousands of residents and damaged some 22 000 homes in Guerrero state
The Western North Pacif ic Ocean basin recorded a total of 31 storms, above the 1981−2010 average of 26 and well above the most recent decadal average (2001–2010) of 23, making this the most active season since 2004 Of these storms, 13 strengthened into typhoons Typhoon Usagi (Odette) was one of the strongest cyclones globally to have formed in 2013, with 10-minute wind speeds reaching 204 km/h In November, Typhoon Haiyan (named Yolanda in the Philippines) became one of the strongest storms on record to ever make landfall anywhere on the globe, with maximum 10-minute wind speeds reach-ing 230 km/h prior to landfall Haiyan caused significant damage across South-East Asia, and the Philippines bore the brunt of the devasta-tion Storm surges of 5–6 m were reported in heavily populated low-lying areas of Tacloban and in the islands of Samar and Leyte Damage caused by immediate surge and following inundation was the worst in the past several decades, with more than 6 200 deaths and
16 16
NA
SA Typhoon Haiyan approaching the Philippines on 7 November 2013

about 14 million people affected, according to reports from the United Nations Office for the Coordination of Humanitarian Affairs The Philippine National Disaster Risk Reduction and Management Council estimated that total damages exceeded US$ 850 million in that country alone
The North Indian Ocean basin recorded a slightly above-average season with five storms compared with the 1981–2010 average of four; three of these storms (Phailin, Lehar and Madi) evolved into very severe cyclonic storms Phailin forced 1 1 million residents in Odisha and Andhra Pradesh states to be evacuated ahead of the storm, one of the largest such evacuations in the history of India
Ten tropical storms were observed in the South-West Indian Ocean basin during the 2012/2013 tropical cyclone season This is close to the long-term 1981–2010 average and the 2001–2010 average of nine tropical storms Seven of these storms reached tropical cyclone status, which is well above the average of four
The Australian basin recorded a near-average 2012/2013 cyclone season, with 10 tropical storms compared with the 1981–2010 average of 11 and the most recent decadal average of 9 Four of these storms became severe tropical cyclones The strongest cyclone of the season was Rusty, with a financial impact likely exceed-ing US$ 100 million
In the South-West Pacific Ocean basin, the 2012/2013 tropical cyclone season was well below average, with 5 named tropical storms compared with the 1981–2010 average of 12 and the 2001–2010 decadal average of 10 Four of these storms attained severe tropical cyclone status, similar to the 1981–2010 average Severe Tropical Cyclone Evan was the strongest storm in the basin during the season, killing 10 people and causing damages of over US$ 300 million in Samoa and Fiji alone
GREENHOUSE GASES AND OZONE-DEPLETING SUBSTANCES
The WMO Global Atmosphere Watch Programme reports that atmospheric levels of CO2, methane (CH4) and nitrous oxide (N2O) reached new highs in 2012 Data for 2013 have not yet been com-piled Globally averaged levels of CO2 reached 393 1±0 13 parts per million (ppm), 41 per cent above pre-industrial levels (before 1750) In May 2013, for the first time since observations began, daily average CO2 levels at several stations outside the Arctic exceeded the symbolic thresh-old of 400 ppm (CO2 levels reach a seasonal maximum in the northern hemisphere spring, before vegetation growth and other processes start to absorb the CO2 )
Atmospheric concentrations of CH4 reached a new high of 1 819±1 parts per billion (ppb) in 2012, or 160 per cent higher than the pre- industrial level Concentrations of N2O reached
17
Figure 14. Left : Globally averaged CO2 mole fraction (a) and its growth rate (b) from 1984 to 2012. Annually averaged growth rate is shown as columns in (b). Centre: Globally averaged CH4 mole fraction (a) and its growth rate (b) from 1984 to 2012. Annually averaged growth rate is shown as columns in (b). Right: Globally averaged N2O mole fraction (a) and its growth rate (b) from 1980 to 2012. Annually averaged growth rate is shown as columns in (b).
1600
1650
1700
1750
1800
1850
1985 1990 1995 2000 2005 2010Year
CH
4 m
ole
fra
ctio
n (
pp
b) (a)
330
340
350
360
370
380
390
400
1985 1990 1995 2000 2005 2010Year
CO
2 m
ole
fra
ctio
n (
pp
m) (a)
300
305
310
315
320
325
330
1980 1985 1990 1995 2000 2005 2010Year
N2O
mo
le f
ract
ion
(p
pb
) (a)
Year
-5
0
5
10
15
20
1985 1990 1995 2000 2005 2010
CH
4 g
row
th r
ate
(pp
b/y
r) (b)
Year
0
1
2
3
4
1985 1990 1995 2000 2005 2010
CO
2 g
row
th r
ate
(pp
m/y
r) (b)
Year
0
0.5
1
1.5
2
1980 1985 1990 1995 2000 2005 2010
N2O
gro
wth
rat
e (p
pb
/yr) (b)

18
325 1±0 1 ppb, which is 20 per cent above the pre-industrial level
As a result, the NOAA Annual Greenhouse Gas Index for 2012 was 1 32, representing a 32 per cent increase in total radiative forcing (relative to 1750) by all long-lived greenhouse gases since 1990 Rising concentrations of greenhouse gases are the main driver of climate change
While chlorofluorocarbons, halons and other harmful chemicals have been phased out under the Montreal Protocol on Substances
that Deplete the Ozone Layer, these gases can remain in the atmosphere for many years They deplete the stratospheric ozone layer that protects life on Earth The resulting Antarctic ozone hole contributes to changes in wind patterns and the regional climate in Antarctica The Antarctic ozone hole reached a maximum of 23 1 million km2 on 15 September and 24 million km2 on 16 September This is more than the seasonal maxima observed in 2010 and 2012, but somewhat less than the 24 4 million km2 seasonal maximum reached in 2011
Jul Aug Sep Oct Nov Dec
200 250 300 350
0
5
10
15
20
25
30
0
5
10
15
20
25
30
1992–2012
2011
2012
2006
2013
2004
2002
2000
Are
a [
106
km2 ]
Day number
Month
Figure 15. Daily area (million km2) of the Antarctic ozone hole for 2013 compared with the two previous ozone holes (2012 and 2011). The plot covers the period from 1 July to 31 December. Also shown for comparison are two years that experienced weak ozone holes (2004 and 2002). The two largest ozone holes on record (in 2000 and 2006) are also shown. The thick light grey line shows the daily ozone hole area averaged over 1992–2012. The plot is produced at WMO and based on data from the Multi Sensor Reanalysis (MSR) of the Royal Netherlands Meteorological Institute until 2008 and on GOME-2 data from the EUMETSAT-operated Metop-A satellite from 2009. More information about the MSR dataset can be found at http://www.atmos-chem-phys.net/10/11277/2010/acp-10-11277-2010.pdf.

19
MAJOR WEATHER AND CLIMATE EVENTS AROUND THE WORLD IN 2013
• Typhoon Haiyan (Yolanda), one of the strongest storms to ever make landfall, devastated parts of the central Philippines
• Surface air temperatures over land in the southern hemisphere were very warm, resulting in widespread heatwaves; Australia saw record warmth for the year, Argentina its second warmest year and New Zealand its third warmest
• Frigid polar air swept across parts of Europe and the south-eastern United States
• Severe drought gripped Angola, Botswana and Namibia
• Heavy monsoon rains led to severe floods on the India-Nepal border
• Abundant rains and flooding impacted north-eastern China and eastern Russian Federation
• Heavy rains and floods affected Sudan and Somalia
• Major drought affected southern China
• North-eastern Brazil experienced its worst drought in the past 50 years
• The widest tornado ever observed hit El Reno, Oklahoma in the United States
• Extreme precipitation led to severe floods in the Alps and in Austria, the Czech Republic, Germany, Poland and Switzerland
• Israel, Jordan and the Syrian Arab Republic were struck by unprecedented snowfall
• An extra-tropical windstorm affected several countries in western and northern Europe
• Greenhouse gas concentrations in the atmosphere reached record highs
• The global oceans reached new record high sea levels
• The Antarctic sea-ice extent reached a record daily maximum

THE IMPORTANCE OF ATTRIBUTION SCIENCE
In 2012, the World Climate Research Programme (WCRP), which is sponsored by WMO, the Intergovernmental Oceanic Commission of the United Nations Educational, Scientific and Cultural Organization and the International Council for Science, identified six grand chal-lenges within the climate science community The prediction and attribution of extreme events is one of these grand challenges Extreme cli-mate events that have large impacts on society, both physically and economically, are increas-ingly requiring prompt and credible scientific explanations
Today, there is a growing ability within the climate science community to untangle the complexities of understanding the natural and human-induced factors contributing to specific extreme weather and climate events Recent analyses of various events show that the effects of natural weather and climate fluctuations played a key role in the intensity and evolution of many extreme events However, for some events, the analyses revealed compelling evidence that human-caused climate change, due to the emission of heat-trapping gases, also contributed Understanding the influences on such events helps us to better understand how and why extreme events are changing In addition, calculating how the odds of a particular extreme event have changed pro-vides a way to quantify the influence of climate change on these events
The Australia summer 2012/2013 area-averaged surface air temperature was the hottest since national records began in 1910 In addition to the summer, temperature records were also broken on daily and monthly timescales Later in 2013, new national 12-month period tem-perature records were set in three consecutive months: for the period ending in August, then in September and once again in October Lastly, a new calendar-year record was set at the end of 2013
Contr ibut ing fac tors to these record 2013 Australian temperatures, including
human-induced climate change and natural variability associated with El Niño-Southern Oscillation (ENSO), were investigated using a suite of climate model simulations Using nine state-of-the-art global climate models that participated in the WCRP Coupled Model Intercomparison Project Phase 5, changes in the probability of extreme Australian sum-mer temperatures due to human influences were investigated These nine models simu-late well the observed probability distribution of Australian average summer and 12-month average temperatures since 1910
The probability of hot Australian summers was calculated for model experiments incorporating human influences (changes in the concen-trations of greenhouse gases, aerosols and ozone in the atmosphere) and natural causes (solar radiation changes and emissions from volcanic eruptions), and this was compared with the results from a parallel set of experi-ments that included only natural causes The comparison shows that human-induced climate change substantially increased the likelihood of the record-breaking Australian summer of 2013; when human influences were included in model simulations, the probability of very hot summer temperatures across Australia, such as in 2013, increased at least fivefold These types of extreme Australian summers become even more frequent in simulations of the future under further global warming
The recent record Australian summer was also notable because it occurred when ENSO con-ditions were neutral to weak La Niña; these conditions typically produce cooler tempera-tures across Australia Prior to 2013, six of the eight hottest Australian summers occurred during El Niño years, but natural ENSO vari-ations are very unlikely to explain the record 2013 Australian heat
Using the same modelling approach, prelim-inary analysis of the Australian area-average temperature record for the calendar year 2013 indicates that human-induced causes vastly increased the odds of setting a new
Explaining the summer 2012/2013 and annual 2013 record warmth in Australia
20
Sophie C Lewis and David J Karoly, ARC Centre of Excellence for Climate System Science, University of Melbourne, Australia

−3 0 3−2 1−1 2 40
Prob
abili
ty d
ensi
ty
0.4
0.6
0.2
Modelsnatural
Models natural +anthropogenic(2006–2020)
Observations
0.81998 2013
Temperature changes relative to 1911–1940
Probability density functions for Australian summer temperature anomalies (relative to 1911–1940) for observations (dashed black, all years shown); model simulations considering only natural causes (green, all years shown); and model simulations considering both anthropogenic and natural causes (red, years 2006–2020 shown). Vertical dashed lines show the observed 2013 temperature anomalies for the 2012/2013 Australian summer and the second hottest Australian summer on record (1997/1998).
temperature record In the model experiments, it is virtually impossible to reach such a high temperature due to natural climate variations alone In simulations with only natural causes considered, none of the 13 000 model years analysed exceed the previous hottest year in Australia, which was observed in 2005 Conversely, in simulations for the period 2006–2020 that include both natural and human-induced causes, such records occur approximately once every 10 years
In summary, comparing climate model simula-tions with and without human factors shows that the record hot Australian summer of 2012/2013 was about five times as likely as a result of human-induced influence on climate and that
the record hot calendar year of 2013 would have been virtually impossible without human contributions of heat-trapping gases, illustrating that some extreme events are becoming much more likely due to climate change
Attributing Australia’s record warm summer 2012/2013 and record warm calendar year 2013 to human influences – Sophie C Lewis and David J Karoly, ARC Centre of Excellence for Climate System Science, University of Melbourne, Australia Adapted from: “Anthropogenic contributions to Australia’s record summer temperatures of 2013”, Geophysical Research Letters , 40(14):3705–3709 (28 July 2013), available at http://onlinelibrary wiley com/doi/10 1002/grl 50673/abstract
21

For more information, please contact:
World Meteorological Organization7 bis, avenue de la Paix – P.O. Box 2300 – CH 1211 Geneva 2 – Switzerland
Communications and Public Affairs Office
Tel.: +41 (0) 22 730 83 14/15 – Fax: +41 (0) 22 730 80 27
E-mail: [email protected]
www.wmo.int JN 1
4223