Embed Size (px)
Citation preview

American Association of Individual Investors
Silicon Valley Chapter
presents
Financial Planning Workshop
Safe Withdrawal Rates
from your Retirement Portfolio
Fred Smith
Email: [email protected]
Webcast details at www.siliconvalleyaaii.org

Financial Planning Workshops
Fundamentals of Investing
• Building a Diversified Portfolio
• Introduction to Computerized Investing
• Active versus Passive Investing Strategies
• Retirement Planning
• Managing your Cash Flow in Retirement
• >>> Safe Withdrawal Rates from your Retirement Portfolio
• Social Security and Medicare
• Estate Planning
2

Overview
Bengen’s Four Percent Rule
Variations on Bengen’s Rule
RMD drawdown method
Bucket strategies
Equity glide paths
Most people spend more time planning a two-week vacation than their retirement.
Anonymous
3

Background to Bengen’s Rule
• Ibbotson data from 1926 to 1992
Common stocks 10.3% annual growth rate
Intermediate Treasuries 5.1% growth rate
Inflation 3% per annum
• Portfolio of 60% stocks/40% bonds
Average return = 8.2% per annum
Real Return = 5.2% per annum
• Withdrawal rate of 5% pa should be OK ?
4

Let’s Try An Experiment
Assume $1M retirement portfolio on 1/1/1980
Invest 60% stock index + 40% intermediate bonds
Rebalance annually
Withdraw 4% ($40,000) to fund expenses for 1980
Withdraw the same amount on January 1 each year
increased 3% per annum for inflation
How long does the portfolio last?
Repeat for various withdrawal rates
5

Simple Diversified Portfolio
60% Stock: S&P 500 Index (VFINX)
Compound annual growth rate 1980-2015 = 10.4%
+ 40% Bonds: 5-year Treasuries
Compound annual growth rate 1980-2015 = 5.9%
= Simple diversified portfolio
Compound annual growth rate 1980-2015 = 9.0%
Real growth rate after 3% annual inflation = 6.0%
$1M grows to $22M over 36 years with no withdrawals
6

S&P 500 Total Return (VFINX)
7

5-Year Treasury Total Return
8

60%S/40%B Portfolio Total Return
9

Portfolio Value with Various
Withdrawal Rates
10

How About Less Favorable Timing?
What happens if we start the drawdowns in 2000?
Use the total returns from 2000 thru 2015 for the
first years of retirement, followed by the data from
years 1980 thru 1999
Same 9.0% per annum return over the total 36 year
period so long as there are no cash-flows
How does this affect our retirement plan with
annual drawdowns?
11

Portfolio Returns with Unfavorable
Timing Starting in 2000
12
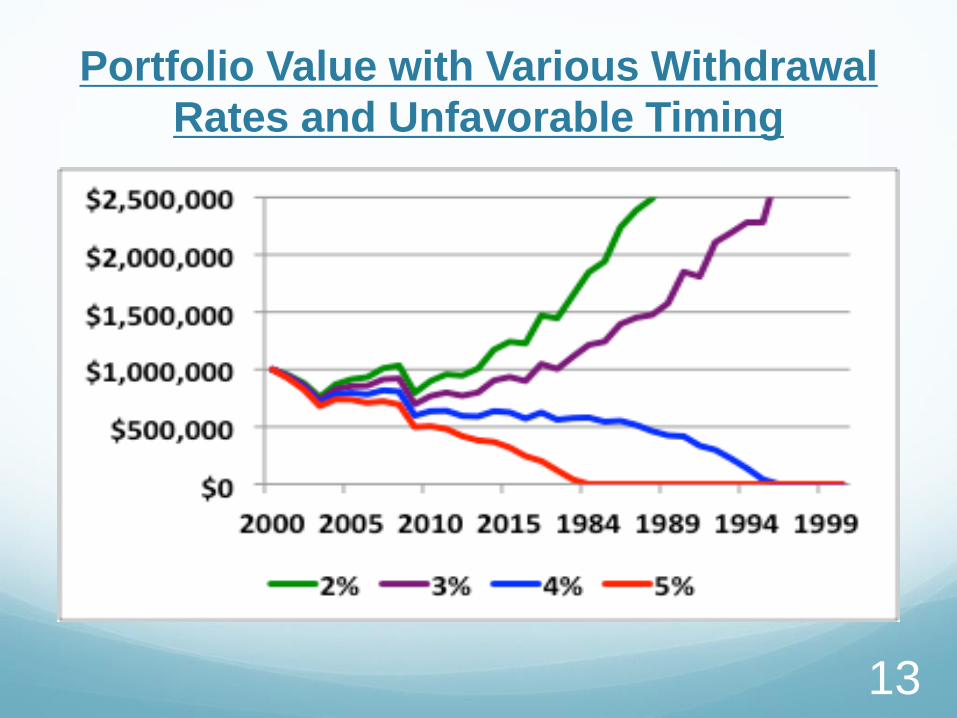
Portfolio Value with Various Withdrawal
Rates and Unfavorable Timing
13
Lessons Learned
Not good enough to look just at the averages for
investment returns and inflation
Must look at what actually happened year-by-year
Performance during the early retirement years is
critically important
Beware a severe stock market downturn “event”
coupled with high inflation
Per Michael Kitces: Similar problem exists for later
years of the accumulation phase.
14

Bengen’s Research (1994)
Use Ibbotson’s annual data from 1926 thru 1992
50% common stocks + 50% intermediate treasuries
Rebalanced annually
Withdraw 3% of portfolio at the start of every year
Adjusted for 3% per annum inflation
Evaluate portfolio performance over consecutive
30-year periods, e.g. 1926-1955, 1927-1956, etc.
Repeat for 4%, 5%, 6% withdrawal rates
15
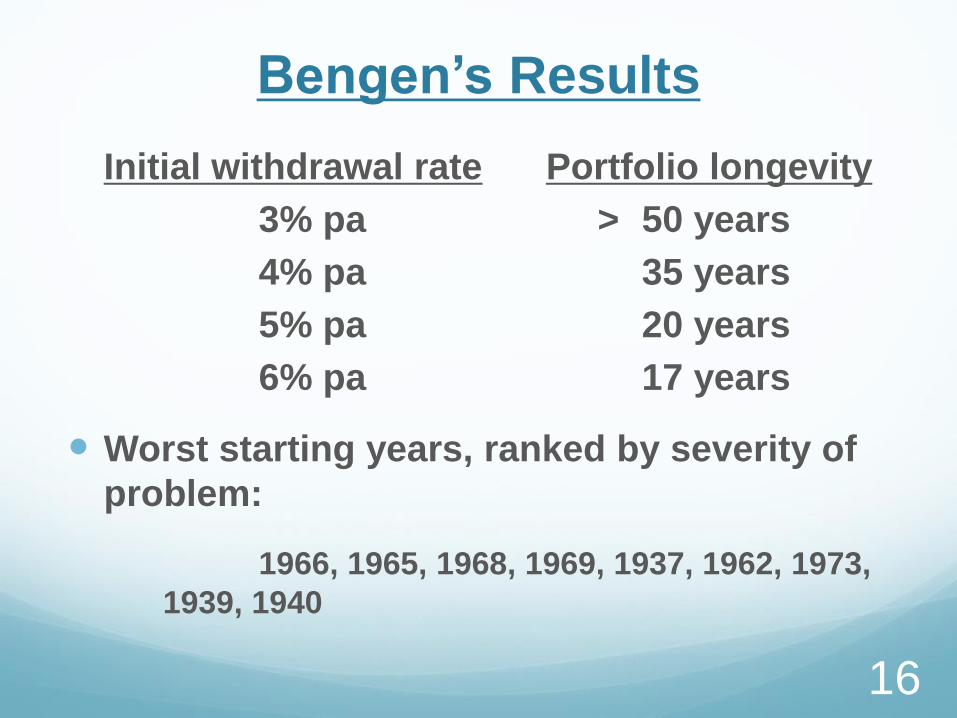
Bengen’s Results
Initial withdrawal rate Portfolio longevity
3% pa > 50 years
4% pa 35 years
5% pa 20 years
6% pa 17 years
Worst starting years, ranked by severity of
problem:
1966, 1965, 1968, 1969, 1937, 1962, 1973,
1939, 1940
16

Bengen’s Four Percent Rule
Set up 50% - 75% of portfolio in equities
with the balance in intermediate Treasuries
Withdraw 4% of assets in first year
Increase by inflation for subsequent years
Most portfolios should last over 50 years
Worst case portfolio lasts 35 years
17

Variations on Bengen’s 4% Rule
Bengen (2004)
OK to use 4.5% withdrawal rate if small cap stocks are included
35% Large cap stocks
18% Small cap stocks
47% Intermediate Treasuries
Bengen (2012)
Informal Rule: Take pre-emptive action if current withdrawal rate exceeds the initial rate by 25%
18

Trinity Study (1998)
Similar to Bengen’s research except …
Used long-term high-grade corporate bonds instead of
intermediate treasuries
Used Ibbotson data from 1926 through 1995
Calculated “portfolio success rates” instead of worst case
portfolio longevity
i.e. percentage of all past payout periods where the
portfolio ended with a positive balance
75% Stocks/25% Bonds with CPI adjusted withdrawals
Results:
Withdrawal rates: 3% 4% 5% 6% 7%
Port success rate: 100% 98% 83% 68% 49%
19

Israelsen (2016)
Evaluated two different portfolios using
Ibbotson data from 1926 through 2014
Conservative:
15% large cap + 10% small cap stocks
+ 55% bonds + 20% cash
Moderate:
40% large cap + 25% small cap stocks
+ 25% bonds + 10% cash
Used fixed inflation from 0% thru 6%/year
20
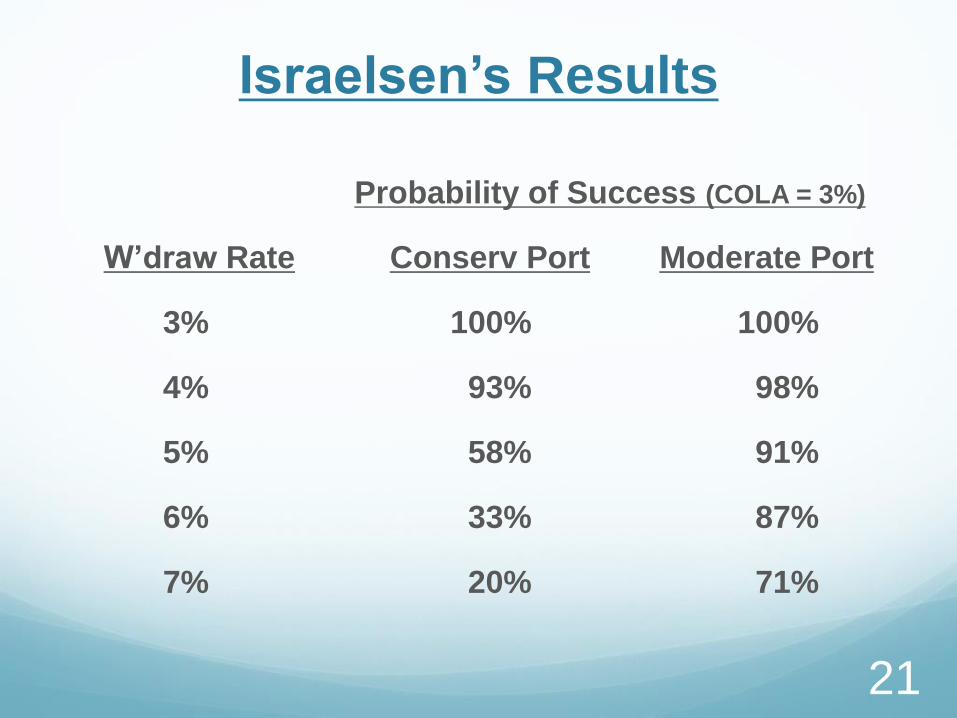
Israelsen’s Results
Probability of Success (COLA = 3%)
W’draw Rate Conserv Port Moderate Port
3% 100% 100%
4% 93% 98%
5% 58% 91%
6% 33% 87%
7% 20% 71%
21

Guyton and Klinger (2006)
Eight-asset diversified portfolio, 40 year longevity
Portfolio management rule
Determines the source of each withdrawal
Limits withdrawals from equities with negative returns
Inflation rule
Caps maximum annual CPI increase at 6%
Capital preservation and prosperity rules
Act as +/- 20% “guardrails” around initial rate
With these rules 5.2% - 6.2% initial rate OK
22

Kitces (2015)
Most people following the 4% rule die with a final
portfolio significantly greater than the original
value
Ratcheting 4% Rule
Start with a conservative withdrawal rate for the early
retirement years, say 4%
Any year the portfolio balance is greater than 50% higher
than the original value, increase the withdrawal rate,
including all COLA increases, by 10%
Limit this 10% ratchet to a maximum of once every third
year.
23

Current Environment
Pfau and Dokken (2015)
Dangerous to use historic data
The 4% rule may be optimistic today
Unprecedented low interest rates
High stock market valuations (Shiller PE10)
40 year horizon from retirement date is more appropriate
4% withdrawal rate from a 75% stock portfolio
has only a 73% success rate
Even a 2% withdrawal rate has only a 90%
success rate i.e. 10% chance of failure
24

William Sharpe (2013)
For any retirement portfolio the amount you
withdraw should depend on
1. How much money you have in the account
2. How long you are likely to need it
After the first year all Bengen’s “x”% rules
no longer depend on Item 1 above.
25

Limitations of Bengen-Like Rules
Cash flow determined only by initial portfolio value;
no dependence on current market value
Constant fixed real cash flow
Unravels in periods of high inflation
Assumes historical worst case sequence of returns
risk
Typically $$$ from excess returns left on the table
for heirs
May be significantly greater than initial portfolio
Could have funded improved life style
26

Overview
Bengen’s Four Percent Rule
Variations on Bengen’s Rule
>>> RMD drawdown method
Bucket strategies
Equity glide paths
27

IRS Required Minimum Distribution
RMD Method
Sun and Webb (2012)
Advantages
Easy to follow
Conservative withdrawal rate
Does not drive asset allocation
Responds to current market value
Disadvantage
Variable withdrawals
Withdrawals not tailored to needs
28

IRS RMD Table III Uniform LifetimeAge Years RMD Age Years RMD
70 27.4 3.6% 86 14.1 7.1%
71 26.5 3.8% 87 13.4 7.5%
72 25.6 3.9% 88 12.7 7.9%
73 24.7 4.0% 89 12.0 8.3%
74 23.8 4.2% 90 11.6 8.8%
75 22.9 4.4% 91 10.8 9.3%
76 22.0 4.5% 92 10.2 9.8%
77 21.2 4.7% 93 9.6 10.4%
78 20.3 4.9% 94 9.1 11.0%
79 19.5 5.1% 95 8.6 11.6%
80 18.7 5.3% 96 8.1 12.3%
81 17.9 5.6% 97 7.6 13.2%
82 17.1 5.8% 98 7.1 14.1%
83 16.3 6.1% 99 6.7 14.9%
84 15.5 6.5% 100 6.3 15.9%
85 14.8 6.8% - - - 29

RMD and Bengen WithdrawalsFavorable Conditions Starting in 1980
30
Age
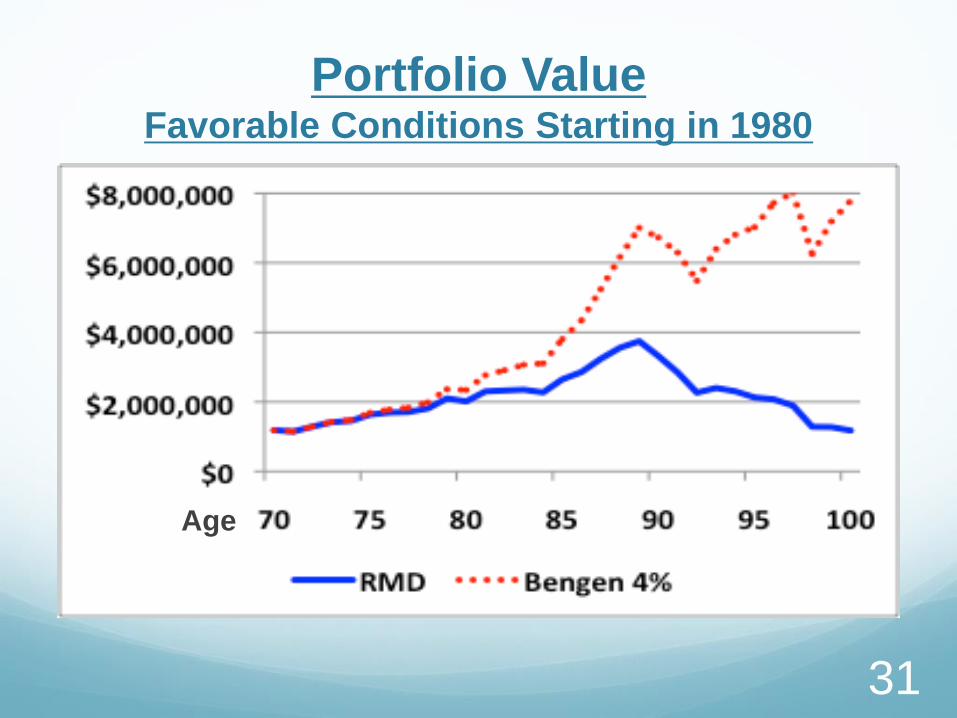
Portfolio ValueFavorable Conditions Starting in 1980
31
Age

RMD and Bengen WithdrawalsUnfavorable Conditions Starting in 2000
32
AgeAge

Portfolio ValueUnfavorable Conditions Starting in 2000
33
Age

Overview
Bengen’s Four Percent Rule
Variations on Bengen’s Rule
RMD drawdown method
>>> Bucket strategies
Equity glide paths
34

Simple Bucket Model
Bucket 1 Bucket 2 .
Purpose: Living expenses Growth
Inflation protection
Timeframe: Short-term Long-term
Assets: Cash, CDs, T-bills Diversified portfolio
MM funds, etc. Stocks, Bonds, etc.
35

Simple Bucket Strategy
Every year …
… Withdraw living expenses from Bucket 1
… Transfer 3% - 6% from Bucket 2 to Bucket 1
May include: Interest and dividends
Proceeds from rebalancing
Proceeds from tax-loss harvesting
Sale of principal
36

Three Bucket Variation
• Bucket 1: Short-term (1-2 years)
– Cash, Checking/savings accounts
– Money market fund, T-bills, Short-term CDs, etc.
• Bucket 2: Intermediate term (2-10 years)
– CD ladder, short/intermediate-term bonds, etc.
– High quality dividend paying stocks
• Bucket 3: Long-term (>10 years)
– Diversified long–term portfolio
– Stocks, long-term bonds, etc.
37

Funnel View
* Long-term diversified portfolio (10+ years) *
* $$$$$ *
* Intermediate-term portfolio (5 yrs) *
* $$$ *
* Short-term account (1 yr) *
* $ *
* $ *
* $ *
$
38

Constant Percentage Strategy
Typical mechanical approach
Transfer say 3-5% annually of Bucket 3 to Bucket 2
Transfer say 20% annually of Bucket 2 to Bucket 1
Withdraw monthly living expenses from Bucket 1
Easy to implement
May require selling from Bucket 3 in down
market
39

Setting Up a Bucket Strategy
Estimate “paycheck” needs
Living expenses less Social Security, pension, etc.
Select a bucket management strategy
Pick a sustainable withdrawal rate
Create and fund buckets
Buckets 1, 2 and 3 (1-2yrs, 2-10yrs and 10+ yrs)
Document the plan
Monitor progress annually
40

Standby Reverse Mortgage and
Your Bucket Strategy
Consider integrating a Home Equity Conversion
Mortgage (HECM) line of credit into your bucket
strategy
Use a smaller short-term bucket to minimize “dead
money” in today’s environment, plus a HECM line
of credit to supplement it for emergencies
Also use the HECM to avoid selling assets in a bear
market
Borrow against HECM line of credit in down markets
Repay in bull market
41

Overview
Bengen’s Four Percent Rule
Variations on Bengen’s Rule
RMD drawdown method
Bucket strategies
>>> Equity glide paths
42

Equity Glide Paths for Your
Retirement Portfolio
Traditional glide path
“Age in fixed income”, Balance in equities
Declining equity glide path thru accumulation and
decumulation phases
Age Fixed Income Equities
25 25% 75%
45 45% 55%
65 65% 35%
85 85% 15%
95 95% 5%
43

Recent Research
Retirees face maximum risk on retirement day
Longevity risk (30-40 years)
Sequence of return risk
Lowest allocation to stocks
Pfau and Kitces (2014)
V-shaped equity glide path
High early in career, 80%-100%
Lowest on retirement day, most vulnerable, 20%-40%
Increasing thereafter as we age, 60%-80%
Blanchett (2015)
Optimum glide path depends on initial environment
44

Equity Glide Paths
45
Age
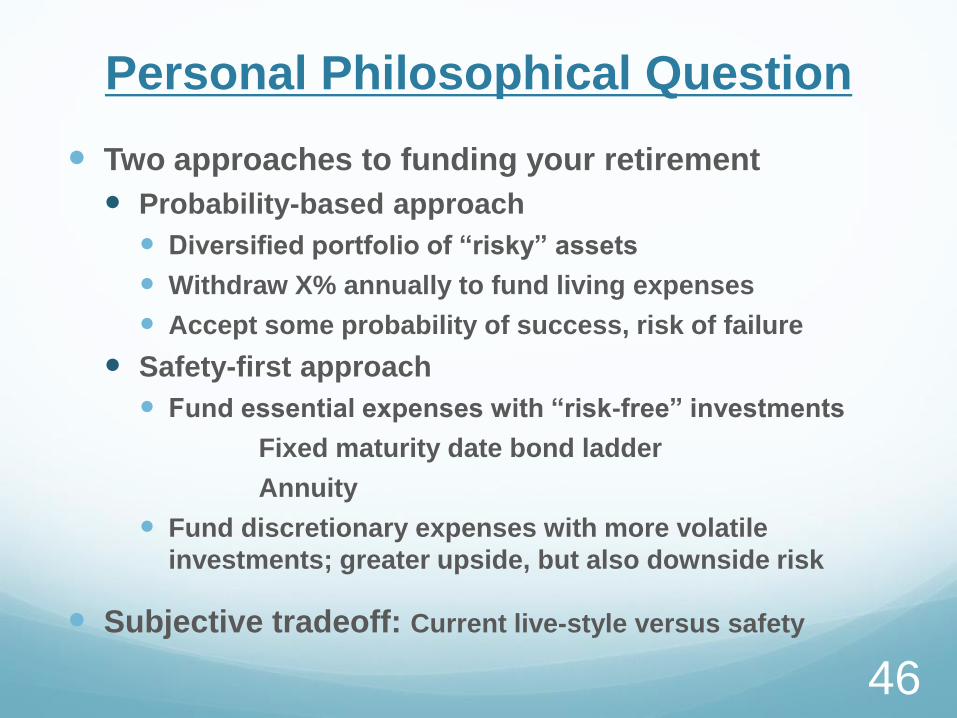
Personal Philosophical Question
Two approaches to funding your retirement
Probability-based approach
Diversified portfolio of “risky” assets
Withdraw X% annually to fund living expenses
Accept some probability of success, risk of failure
Safety-first approach
Fund essential expenses with “risk-free” investments
Fixed maturity date bond ladder
Annuity
Fund discretionary expenses with more volatile
investments; greater upside, but also downside risk
Subjective tradeoff: Current live-style versus safety
46

When Does “Safety-First” Trump
Current Lifestyle?
Picking too high a withdrawal rate may necessitate
reducing your withdrawals significantly to avoid
running out of money
Picking too low a withdrawal rate could mean that
you end up with a significant unintended portfolio
surplus when you die, while missing out on lifestyle
when alive
Review your Personal Investor Profile (PIP) and
Investment Policy Statement (IPS) to determine
where you stand
47

Parting Thoughts
There is no rule to satisfy an optimum withdrawal
stream from a retirement portfolio of volatile assets
with unknown expected returns for an
indeterminate period.
The future may be very different to the past
There is no such thing as a “safe withdrawal rate”
“Safe” means “Safe as far as we can tell”
Be conservative initially, more aggressive later
Consider a longevity annuity starting at age 85
Stay flexible; Review your plan regularly.
48

Summary
Safe Withdrawal Rates from your Retirement
Portfolio
Bengen’s 4% rule
Variations on Bengen’s Rule
RMD method
Bucket strategies
Equity glide paths
This is the last of 3 workshops on Retirement
Planning
49

Next Month We will Cover …..
Social Security Claiming Strategies
Full retirement age
Early retirement, Late retirement
Simple claiming strategies for singles
File and Suspend
Strategies for married couples
Claim some now, more later
Effect of the Bipartisan Budget Act of 2015
Medicare
Myths and reality
50
Before Next Month’s Workshop …..
Review you retirement plan
For those already retired …
How did the equity markets behave for the first few
years of your retirement?
Have you had to adjust your withdrawal rate?
Do you use a bucket strategy? Is it written down?
How do you feel about rising equity glide paths?
51

Further Reading• Charles Rotblut, “The Sequence in Which Returns Occur Affects Your
Wealth”, AAII Journal, May 2015
• William P. Bengen, “Determining Withdrawal Rates Using Historical Data”, Journal of Financial Planning, October 1994
• William P. Bengen, “How Much Is Enough?”, Financial Advisor Magazine, May 2012
• Phillip I. Cooley, Carl M. Hubbard and Daniel T. Walz, “Retirement Savings: Choosing a Withdrawal Rate That Is Sustainable”, AAII Journal, February 1998 (Trinity study)
• Jonathan T. Guyton and William J. Klinger, “Decision Rules and Maximum Initial Withdrawal Rates”, Journal of Financial Planning, March 2006
• Craig Israelsen, “The Mathematics of Retirement Portfolios”, AAII Journal, January 2016
• Maria Scott Crawford, “Finding the Right Withdrawal Rate: One Key to Portfolio Sustainability”, AAII Journal, July 2012
• David Blanchett, Marciej Kowara and Peng Chen, “Optimal Withdrawal Strategy for Retirement Income Portfolios”, Morningstar, September 2012
52

Further Reading continued
• Wade Pfau and Wade Dokken, “Why 4% Could Fail”, Financial Advisor
Magazine, September 2015
• William Sharpe, “The X% Rule”, Retirement Income Scenarios blog,
December 2013
• Wei Sun and Anthony Webb, “Retirement Withdrawals: Can You Base Them
on RMDs?”, AAII Journal, December 2012
• Colleen Jaconetti et al, “A More Dynamic Approach to Retirement Spending”,
AAII Journal April 2014
• Christine Benz, “Using the Bucket Approach With Your Retirement Portfolio”,
AAII Journal, October 2013
John Salter, Shaun Pfeiffer and Harold Evensky, “Standby Reverse
Mortgages: A Risk Management Tool for Retirement Distributions”, Journal of
Financial Planning, August 2011
David M. Cordell and Thomas P. Langdon, “Hedging Longevity Risk for
Worry-Free Retirement”, Journal of Financial Planning, May 2013
53
Further Reading continued
• Wade D. Pfau and Michael E. Kitces, “Reducing Retirement Risk with a Rising
Equity Glide Path”, Journal of Financial Planning, January 2014
• Michael Kitces and Wade Pfau, “Reduce Stock Exposure in Retirement, or
Gradually Increase It?”, AAII Journal, April 2014
• Michael Kitces and Wade Pfau, “Retirement Risk, Rising Equity Glide Paths,
and Valuation-Based Asset Allocation, Journal of Financial Planning, March
2015
• Michael Kitces and Wade Pfau, “Increasing Retirement Withdrawal Rates
Through Asset Alloction”, AAII Journal, April 2015
• Luke Delorme, “Mathematical Support for Rising Equity Glide Paths”, AAII
Journal, September 2015
• David Blanchett, “Initial Conditions and Optimal Retirement Glide Paths”,
Journal of Financial Planning, September 2015
• David Blanchett, “Exploring the Optimal Equity Allocation path for Retirees”,
AAII Journal, December 2015
54

Useful Websites
www.aaii.com Broad selection of financial planning material
www.siliconvalleyaaii.org Previous presentations on various topics
www.santaclaracountylib.org/Adults/Business & Money
www.RetirementIncomeScenarios.blogspot.com Bill Sharpe
www.investopedia.com
www.bogelheads.org
www.obliviousinvestor.com/index-funds/ Mike Piper blog
www.rickferri.com/investment-philosophy/ Rick Ferri
blogRetirementIncomeScenarios.blogspot.com Bill Sharpe
55

Cartoon
56