Embed Size (px)
Citation preview

plants
Article
Comparative Plastomics of Ashwagandha (Withania,Solanaceae) and Identification of Mutational Hotspotsfor Barcoding Medicinal Plants
Furrukh Mehmood 1,2 , Abdullah 1 , Zartasha Ubaid 1, Yiming Bao 3,4 , Peter Poczai 2,* andBushra Mirza 1,5,*
1 Department of Biochemistry, Quaid-i-Azam University, Islamabad 45320, Pakistan;[email protected] (F.M.); [email protected] (A.); [email protected] (Z.U.)
2 Botany Unit, Finnish Museum of Natural History, University of Helsinki, P.O. Box 7,FI-00014 Helsinki, Finland
3 National Genomics Data Center, Beijing Institute of Genomics, Chinese Academy of Sciences, and ChinaNational Center for Bioinformation, Beijing 100101, China; [email protected]
4 School of Future Technology, University of Chinese Academy of Sciences, Beijing 100049, China5 Vice Chancellor of Lahore College for Women University, Lahore 54000, Pakistan* Correspondence: [email protected] (P.P.); [email protected] (B.M.)
Received: 9 May 2020; Accepted: 12 June 2020; Published: 15 June 2020�����������������
Abstract: Within the family Solanaceae, Withania is a small genus belonging to the Solanoideaesubfamily. Here, we report the de novo assembled chloroplast genome sequences of W. coagulans,W. adpressa, and W. riebeckii. The length of these genomes ranged from 154,162 to 154,364 base pairs(bp). These genomes contained a pair of inverted repeats (IRa and IRb) ranging from 25,029 to25,071 bp that were separated by a large single-copy (LSC) region of 85,635–85,765 bp and a smallsingle-copy (SSC) region of 18,457–18,469 bp. We analyzed the structural organization, gene contentand order, guanine-cytosine content, codon usage, RNA-editing sites, microsatellites, oligonucleotideand tandem repeats, and substitutions of Withania plastomes, which revealed high similarities amongthe species. Comparative analysis among the Withania species also highlighted 10 divergent hotspotsthat could potentially be used for molecular marker development, phylogenetic analysis, and speciesidentification. Furthermore, our analyses showed that even three mutational hotspots (rps4-trnT,trnM-atpE, and rps15) were sufficient to discriminate the Withania species included in current study.
Keywords: ashwagandha; chloroplast genome; indels; medicinal plants; mutational hotspots;phylogenomics; Solanaceae; substitutions; Withania
1. Introduction
The globally distributed megadiverse Solanaceae family includes 93 genera and 2700 species [1–3].The genus Withania Pauq., belonging to the subfamily Solanoideae, contains 10–20 species [1]. Amongthe worldwide list of Withania species, ashwagandha or winter cherry (W. somnifera (L.) Dunal) andpaneer booti or ashutosh booti (W. coagulans (Stocks) Dunal) are considered highly important due totheir therapeutic potential. Withania species are pivotal in the Ayurvedic medicine system in SoutheastAsia, and W. somnifera has been used for medicinal purposes for around 3000 years [4,5]. Many studiesof Withania have described various pharmacological properties of these species, (e.g., anti-inflammatory,anticancer, antidepressant, neuroprotective, and hepatoprotective) [6–9]. The ubiquity of such herbalproducts has expanded globally in recent decades. The worldwide market for medicinal plants isanticipated to reach 5 trillion USD by 2050, with Europe driving the market [10]. Although medicinalplants are outstanding sources of innovative drug development, assessing their pharmacological
Plants 2020, 9, 752; doi:10.3390/plants9060752 www.mdpi.com/journal/plants

Plants 2020, 9, 752 2 of 20
properties and effectiveness requires comprehensive approaches. Ashwagandha (Withania species)products show irregularities in quality through the herbal medicinal value chain affecting their impactand safety [11]. The quality of these manufactured herbal products is globally highly variable, andconsistent analytical approaches are required to identify and monitor their quality along the value chain.The herbal medicine industry has considered DNA barcoding as a method that can be consistentlyapplied in quality control over the manufactured products and to identify medicinal materials toprotect consumers from dishonest suppliers. In addition, this method can also be used to identify toxicherbal materials in life-threatening situations, prevent poisoning, and improve control procedures ofherbal drug substances [12].
The structure and composition of the chloroplast genome (or plastome) can be utilized to generatemolecular markers that can be used in DNA barcoding [13]. Chloroplasts are important and universalorganelles that are essential for photosynthesis. Chloroplasts are also associated with the synthesis ofvitamins, pigments, fatty acids, and amino acids through various biochemical pathways [14]. Amongmany plant species, plastomes are 75–250 kilobases (kb) in size [15] and contain 120 genes, whichinclude protein-encoding, ribosomal RNA (rRNA), and transfer RNA (tRNA) genes [16]. The structureof angiosperm plastomes varies from circular to linear even within the cells of the same individual [17].Circular-formed plastomes show a typically quadripartite in structure, with two inverted repeats (IRs)separating the large single-copy (LSC) and a small single-copy (SSC) regions [15,18,19]. Plastomesshow frequent variation in the number of tandem repeats, insertions and deletions (indels), singlenucleotide polymorphism (SNPs), and as well as other rearrangements including translocations andinversion [19–21]. Plastomes have been termed as “super barcodes”, due to their comparativelyconserved organization, gene content, adequate level of nucleotide substitution in protein-encodinggenes, and uniparental inheritance, which make them excellent sources of phylogenetic reconstructionand species identification at diverse taxonomic levels [22–25]. Plastome-sequencing data can also beuseful for agricultural trait improvement [26], transplastomics [27,28], population genetics [29], andconservation of species facing extinction [30].
Here, we aimed to assemble and compare the complete chloroplast genome sequences ofW. coagulans, W. adpressa Coss., and W. riebeckii Schweinf. ex Balf.f. in addition to the previouslyreported W. somnifera genome [24]. We also sought to analyze the phylogenetic relationship of the genusamong the Solanaceae family and to analyze differences in the organization of Withania plastomes suchas repeats, indels, and substitutions, and to identify mutational hotspots for future DNA barcoding.
2. Materials and Methods
2.1. Genome Assembly and Annotation
Fresh green leaves of W. coagulans were obtained from Mianwali, Pakistan (32.5839◦ N 71.5370◦ E).The leaf segments were washed in 70% ethanol and total genomic DNA extraction was carried outaccording to the CTAB (cetyltrimethylammonium bromide) method of Lu et al. [31]. DNA quality andconcentration were assessed by Colibri spectrometer Nanodrop (Titertek-Berthold, Berthold DetectionSystems GmbH, Pforzheim, Germany) and 1% agarose gel electrophoresis. Genome sequencing wascarried out by the Beijing Institute of Genomics using the Illumina HiSeq PE150 platform (IlluminaInc., San Diego, CA, USA). Furthermore, the Illumina sequence data of W. adpressa (5 Gb) andW. riebeckii (5 Gb) were acquired from the sequence read archive (SRA) deposited under accessionnumbers SRR8718119 and SRR8718120. The raw sequencing read quality was verified with the FastQCtool [32]. We used Velvet 1.2.10 [33] with k-mer sizes of 31, 41, 51, and 71 to initially assemble thelarge sequence contigs from raw paired-end reads. These contigs were then combined to producecomplete chloroplast genomes though de novo assembly carried out with Geneious R8.1 (BiomattersLtd., Auckland, New Zealand) [34]. The junction sites between LSC, SSC, and IR were determined forthese novel assembled plastomes. Annotations of these genomes were performed, using GeSeq [35]and CPGAVAS2 [36]. The results were compared, inspected checking the start/stop codons manually.
Plants 2020, 9, 752 3 of 20
Additionally, tRNA genes were identified using tRNAscan-SE version 2.0 under default parameters [37]and ARAGORN version 1.2.38 [38]. CPGAVAS2 [36] and Clico FS [39] were used to draw circularmaps of the genomes. The average coverage depths of the Withania species plastomes were determinedby mapping the reads to the de novo assembled plastome through the Burrows–Wheeler aligner(BWA) [40] and visualizing in the Tablet [41]. The novel annotated plastomes were deposited in NCBIunder the following accession numbers: W. coagulans (MN216390), W. adpressa (BK010847), and W.riebeckii (BK010849). The plastome of W. coagulans was also deposited in the GWH database of theNational Genomics Data Center [42] (accession number GWHACBF00000000).
2.2. Comparative Chloroplast Genome Analysis
All de novo chloroplast genomes were aligned with multiple alignment using fast Fouriertransform (MAFFT) 7.309 [43], using default parameters. Protein-encoding genes, intergenic spacer(IGS) regions, and introns were extracted to calculate the average number of nucleotide differencesper site or nucleotide diversity (π) with a 100 bp window size as implemented in DnaSP v6 [44].The substitution, transition (Ts), and transversion (Tv) rates were resolved from the MAFFT alignment,using W. somnifera as a reference. Each structural element, including the LSC, SSC, and IR, wasaligned individually to analyze SNPs and indel polymorphisms with Geneious and DnaSP, respectively.The junction sites of the IRs and their border positions were compared using all Withania species andsix additional Solanaceae outgroup species (Table S9), using the default setting of the IRscope [45].The intergeneric comparison was carried out to gain insight to differences and syntenies that may existbetween Withania and other Solanaceae species. Circoletto [46] was used to compare structural featuresof Withania chloroplast genomes using blastn search (e-value of <1 × 10⁻¹⁰) to create a Circos output.
The predictive RNA editor for plants-chloroplast genes (PREP-cp) was used to predict putativeRNA editing sites using default settings [47], while codon usage and amino-acid frequencies wereanalyzed in Geneious R8.1. The ratios of synonymous (Ks) and non-synonymous (Ka) substitutions foreach extracted protein-encoding gene were calculated with DnaSP for all Withania, using W. somniferaas reference. The data were interpreted as: Ka/Ks > 1, Ka/Ks = 1, Ka/Ks < 1, representing positive,neutral, and purifying selection, respectively. Microsatellites in Withania plastomes were detected withthe microsatellite-web (MISA) [48], using a minimal repeat number of 7 for mononucleotide simplesequence repeats (SSRs), 4 for dinucleotide SSRs, and 3 for tri-, tetra-, penta-, and hexanucleotide SSRs.REPuter [49] was also used to locate forward (F), reverse (R), palindromic (P), and complementary (C)repeats with the following parameters: min. repeat size 30 bp, Hamming distance 3, min. similaritypercentage of two repeat copies 90%, and max. computed repeats 500. A subsequent search for repeatswas also carried out with tandem repeat finder [50] using default parameters.
2.3. Phylogenomic Analysis
We included all available Withania plastome sequences in our analysis and added further Solanaceaeplastomes (Organelle Genome Resources of NCBI, accessed on 21 January 2020) from closely relatedgroups of Physaleae and additional taxonomic groups from the so-called ‘x = 12 clade’. This groupencompasses species of the traditional subfamily Solanoideae, Nicotiana L. and the Australian endemictribe Anthocercideae belonging to Nicotianoideae. This strongly supported group is united withthe cytological synapomorphy of chromosome numbers based on 12 pairs [1]. We used Petunia ×atkinsiana (Sweet) D. Don ex W.H. Baxter (Syn.: Petunia × hybrida Vilm.) as an outgroup to rootour tree, since this was the only available complete chloroplast genome sequence outside the x = 12clade. For phylogenetic analysis, we removed one of the IR regions (IRa), and subsequently excisedall protein-encoding genes from the plastomes. The reading frames were manually verified duringextraction by checking the start and stop codons. We discarded accD, ycf 1, and ycf 15 from our finalalignment, because these genes were highly variable in size. The trans-spliced rps12 was also notincluded in the phylogenetic alignment together with sequence of the inf A pseudogene. The nucleotidesequences of 74 protein-coding genes were aligned with MAFFT (default setting) via the Geneious shell.

Plants 2020, 9, 752 4 of 20
IQ-TREE [51] was used to determine the best-fitting models for each partition of concatenated matrixusing the TESTMERGEONLY and AICc (Akaike information criterion corrected for small samplesizes) options in the built-in ModelFinder [52]. The maximum likelihood (ML) tree search was carriedout using the ultrafast bootstrap approximation (UFBoot; [53]) with 1000 replicates. UFBoot reducescomputing time and provides an efficient alternative to standard bootstrap [53]. Branch supports werealso assessed using the SH-like approximate likelihood ratio test (SH-aLRT), while final phylogenetictrees were edited using TreeDyn [54,55].
For further analyses we divided the dataset into protein-coding gene subsets according to theheuristic searches carried out with Partition Finder v1.1.1 [56] and default settings using Bayesianinformation criterion (BIC). Intron regions were regarded as distinct subsets. Partitioned Bayesianphylogenetic analyses were carried out with MrBayes v.3.2.3 [57]. jModelTest [58] was used withdefault settings to infer fitting substitution models (see Table S10). One cold and three heated Markovchains were run parallel with 2 × 10⁶ generations sampling every 100th tree per generation, withunlinked parameters across partitions. Branch length and topology parameters were set unlinked.Convergence was checked using the average standard deviation of split frequencies (ASDFs; <0.01)was used to measure convergence of the runs. A majority-rule consensus tree was constructed fromthe runs with a 25% burn-in removal.
3. Results
3.1. Organization and Characteristics of Withania Plastomes
Our comparative analysis revealed that Withania species have similar plastome structures (Figure 1and Table 1). The length of the assembled plastome varied between 154,162 and 154,364 bp. The averagecoverage depth of the assembled plastomes of W. coagulans, W. adpressa, and W. riebeckii was 573×,566×, and 590×, respectively. The total guanosine-cytosine (GC) content of the de novo assembledWithania plastomes was 37.7%, as was the previously sequenced species.
The IRs showed a higher GC content (43.2%) compared to the large- (35.7%) and small-singlecopy regions (31.8%), which could have been due to the occurrence of rRNA genes containing GC-richregions [19,59–61]. The plastomes of the de novo assembled Withania species had 132 genes fromwhich 18 were represented in duplication in the inverted repeats (Table 2, Figure 2). All Withaniaplastomes contained 86 protein-encoding, 37 tRNA, and 8 rRNA genes. The IR regions contained 18duplicated genes and out of these 7 were protein-encoding, 4 were rRNA, and 7 were tRNA genes.The clpP and ycf 3 genes had two introns in their nucleotide sequence, while rps16, atpF, rpoC1, petB,petD, rpl16, ndhA, rpl2, and ndhB had only one. The 5′ end exon of the trans-spliced gene rps12 wasfound in the LSC and the 3′ end exons were located in the IR. The GC content was the highest amongtRNAs (53%) and rRNAs (55.3%). Hydrophobic amino acids were abundant, while the acidic aminoacids were present in the least amount in plastomes of the genus Withania. These amino acids wereadenine-thymine (AT)-rich sequences in all species (Figure 3A). The analysis of codon usage and aminoacids frequencies indicated leucine (Leu) as the most frequent and cysteine (Cys) as a rare amino acidin Withania plastomes (Figure 3B). The codon usage also revealed a shift towards A/T at the third codonposition (Table S1).

Plants 2020, 9, 752 5 of 20
Plants 2019, 10, x FOR PEER REVIEW 5 of 20
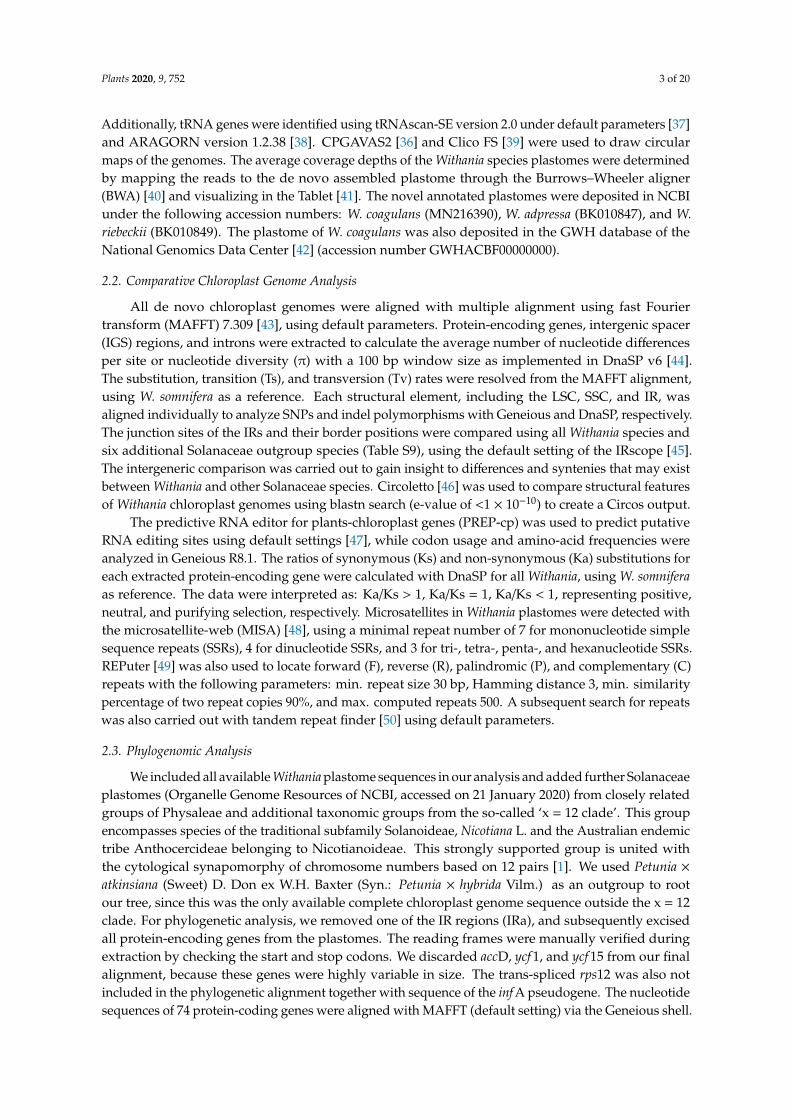
Figure 1. Structural comparison of Withania plastomes showing a high level of synteny and the lack of large rearrangements. The start and end points of the sequences are marked by green and orange blocks. The colored blocks outside the sequences refer to the score/max bit core ration, with green ≤0.50, orange ≤0.75, and red >0.75. Blue blocks and chords represent the inverted repeats (IRs).
Figure 2. Consensus circular genome map of Withania plastomes. The first larger ring represents the gene structure of the chloroplast genome. The GC content is plotted as a green line while a skewed GC plot is presented as an orange/black track around the inner circles. The second ring is displaying the IRs as longer black boxes, while tandem repeats are represented by short bars. The third, and last circle shows the output of MISA microsatellite detection, where reverse repeats are connected with green arcs, while red arcs represent forward repeats.
Figure 1. Structural comparison of Withania plastomes showing a high level of synteny and the lack oflarge rearrangements. The start and end points of the sequences are marked by green and orange blocks.The colored blocks outside the sequences refer to the score/max bit core ration, with green ≤ 0.50,orange ≤ 0.75, and red > 0.75. Blue blocks and chords represent the inverted repeats (IRs).
Table 1. Summary of Withania chloroplast genome features.
Characteristics W. somnifera W. coagulans W. adpressa W. riebeckii
Size (base pair; bp) 154,386 154,196 154,364 154,162
LSC length (bp) 85,688 85,659 85,765 85,635
SSC length (bp) 18,464 18,467 18,457 18,469
IR length (bp) 25,117 25,035 25,071 25,029
Number of genes 132 132 132 132
Protein-coding genes 86 86 86 86
tRNA genes 37 37 37 37
rRNA genes 8 8 8 8
Duplicate genes 18 18 18 18
GC content
Total (%) 37.7% 37.7% 37.7% 37.7%
LSC (%) 35.7% 35.7% 35.7% 35.7%
SSC (%) 31.8% 31.8% 31.8% 31.8%
IR (%) 43.2% 43.2% 43.2% 43.2%
CDS (%) 38.2% 38.2% 38.2% 38.2%
rRNA (%) 55.3% 55.3% 55.3% 55.3%
tRNA (%) 53% 52.9% 53% 53%
All gene (%) 40% 39.8% 39.8% 39.8%
Protein coding part (CDS) (%bp) 50.9% 51.0% 51.0% 51.0%
All gene (%bp) 72.06% 72.11% 72.07% 72.13%
Non-coding region (%bp) 27.94% 27.89% 27.93% 27.87%

Plants 2020, 9, 752 6 of 20
Plants 2019, 10, x FOR PEER REVIEW 5 of 20
Figure 1. Structural comparison of Withania plastomes showing a high level of synteny and the lack of large rearrangements. The start and end points of the sequences are marked by green and orange blocks. The colored blocks outside the sequences refer to the score/max bit core ration, with green ≤0.50, orange ≤0.75, and red >0.75. Blue blocks and chords represent the inverted repeats (IRs).
Figure 2. Consensus circular genome map of Withania plastomes. The first larger ring represents the gene structure of the chloroplast genome. The GC content is plotted as a green line while a skewed GC plot is presented as an orange/black track around the inner circles. The second ring is displaying the IRs as longer black boxes, while tandem repeats are represented by short bars. The third, and last circle shows the output of MISA microsatellite detection, where reverse repeats are connected with green arcs, while red arcs represent forward repeats.
Figure 2. Consensus circular genome map of Withania plastomes. The first larger ring represents thegene structure of the chloroplast genome. The GC content is plotted as a green line while a skewed GCplot is presented as an orange/black track around the inner circles. The second ring is displaying theIRs as longer black boxes, while tandem repeats are represented by short bars. The third, and last circleshows the output of MISA microsatellite detection, where reverse repeats are connected with greenarcs, while red arcs represent forward repeats.Plants 2019, 10, x FOR PEER REVIEW 6 of 20
Figure 3. (A) Assessment of amino-acid groups and (B) amino-acid frequency comparison among Withania species.
Table 1. Summary of Withania chloroplast genome features.
Characteristics W. somnifera W. coagulans W. adpressa W. riebeckii Size (base pair; bp) 154,386 154,196 154,364 154,162
LSC length (bp) 85,688 85,659 85,765 85,635 SSC length (bp) 18,464 18,467 18,457 18,469 IR length (bp) 25,117 25,035 25,071 25,029
Number of genes 132 132 132 132 Protein-coding genes 86 86 86 86
tRNA genes 37 37 37 37 rRNA genes 8 8 8 8
Duplicate genes 18 18 18 18
GC content
Total (%) 37.7% 37.7% 37.7% 37.7% LSC (%) 35.7% 35.7% 35.7% 35.7% SSC (%) 31.8% 31.8% 31.8% 31.8% IR (%) 43.2% 43.2% 43.2% 43.2%
CDS (%) 38.2% 38.2% 38.2% 38.2% rRNA (%) 55.3% 55.3% 55.3% 55.3% tRNA (%) 53% 52.9% 53% 53% All gene % 40% 39.8% 39.8% 39.8%
Protein coding part (CDS) (%bp) 50.9% 51.0% 51.0% 51.0% All gene (%bp) 72.06% 72.11% 72.07% 72.13%
Non-coding region (%bp) 27.94% 27.89% 27.93% 27.87%
Figure 3. (A) Assessment of amino-acid groups and (B) amino-acid frequency comparison amongWithania species.

Plants 2020, 9, 752 7 of 20
Table 2. Genes and their functional categories in Withania chloroplast genomes.
Category for Gene Group of Gene Name of Gene
Photosynthesis-RelatedGenes
Photosystem I psaA psaB psaC psaI psaJ
Photosystem II
psbA PsbB psbC psbD psbE
psbF psbH psbI psbJ psbK
psbL psbM psbN
Cytochromeb/f complex
psbT psbZ petN petA petL
petG petD * petB *
ATP synthase atpI atpH atpA atpF * atpE
atpB
Assembly/stabilityof photosystem I ycf 3 ** ycf 4
NADPHdehydrogenase
ndhB *,a ndhH ndhA * ndhI ndhG
ndhJ ndhE ndhF ndhC ndhK
ndhD
Rubisco rbcL
Transcriptionand TranslationRelated Genes
RNA Genes
TranscriptionSmall subunitof ribosome
rpoA rpoC2 rpoC1 * rpoB rps16 *
rps7 a rps15 rps19 rps3 rps8
rps14 rps11 rps12 a,* rps18 rps4
rps2
Large subunitof ribosome
rpl2 a,* rpl23 a, rpl32 rpl22 rpl14
rpl33 rpl36 rpl20 rpl16 *
Ribosomal RNA rrn16 a rrn4.5 a rrn5 a rrn23 a
Transfer RNA
trnV-GAC a trnI-CAU * trnA-UGC a,* trnN-GUU a trnP-UGG
trnW-CCA trnV-UAC * trnL-UAA * trnF-GAA trnR-ACG a
trnT-UGU trnG-UCC a,* trnT-GGU trnR-UCU trnE-UUC
trnY-GUA trnD-GUC trnC-GCA trnS-GCU trnH-GUG
trnK-UUU trnQ-UUG trnf M-CAU trnG-GCC trnS-UGA
trnS-GGA trnF-GAA trnM-CAU trnL-CAA *
trnI-GAU *,a trnL-UAG
Other Genes
RNA processing matK
Carbonmetabolism cemA
Fatty acidsynthesis accD
Proteolysis clpP **
Component of TICcomplex ycf 1 a
Hypotheticalproteins ycf 2 a Ycf 15
* Gene with one intron, ** gene with two introns, a gene with two copies, same genes in all Withania species.
3.2. Divergence Hotspots in Withania
Our comparison showed that all Withania genomes had similar nucleotide compositions in allstructural (LSC, SSC, and IR) and coding regions, which extended even to IGSs (Table S2). The numberof substitutions ranged between 25 and 116, while substitution types were shared among species(Table 3). A/G and C/T SNPs occurred frequently among the genomes (Table 3), while the ratio ofTs and Tv in the plastomes ranged from 1.04 to 1.25 in the LSC and between 0.5 and 1.5 in the SSC;the ratio varied from 1.3 to 2 in the IR region (Table S3). In general, Ts were more frequent in Withania,consistent with observations in other plant species [61,62]. Indels were frequent in the LSC region andtheir number ranged from 32 to 46. The IRs contained only a few indels (Table 4). This may havebeen due to the observation that IR sequences evolve under concerted evolution compared to LSC andSSC regions that contain more substitutions [63]. When all positions with single- or multinucleotide

Plants 2020, 9, 752 8 of 20
variations as SNPs were considered, 207 SNPs were identified, which corresponds to a mean SNPfrequency of 0.2070 SNPs/kb in Withania species. Indels showed a mean frequency of 0.116/kb.
Table 3. Substitution and their distribution in Withania plastomes, compared to the W. somniferaas reference.
Types W. coagulans W. adpressa W. riebeckii
A/G 4 19 28
C/T 10 15 30
A/C 3 11 18
C/G 2 2 3
G/T 4 14 25
A/T 2 5 12
Total 25 66 116
LSC 20 43 79
SSC 5 20 30
IR 0 3 7
Table 4. Insertions and deletions among Withania species compared to the W. somnifera reference genome.
W. coagulans Indel Length (bp) Indel Average Length
LSC 27 133 4.926
SSC 3 61 20.33
IR 2 82 41.00
W. adpressa Indel Length (bp) Indel Average Length
LSC 27 143 5.296
SSC 6 11 1.833
IR 5 68 13.60
W. riebeckii Indel Length (bp) Indel Average Length
LSC 34 213 5.917
SSC 6 103 17.16
IR 4 106 26.50
The indels and SNP mutational events in the plastome showed uneven distributions and clusteredas “hotspots” [64,65]. These fast evolving regions are ideally suited for DNA barcoding [66]. The IGSwere more polymorphic (average π = 0.0027) than protein-coding regions (π = 0.0011) and introns(average π = 0.0015). Among the Withania species, the values ranged from 0.0003 (psaB) to 0.0119(ndhl-ndhA region; Figure 4). We selected the 10 most polymorphic regions for further investigationbased on the analysis of mutation rates of the complete chloroplast genome sequences (Table 5). Fromthe selected regions, nine were IGSs, and one was a protein-coding gene (rps15). We assessed theefficacy of these regions to discriminate among the four species of Withania and found that three regions(rps4-trnT, trnM-atpE, and rps15) provided enough information for successful barcoding.
We also investigated the Ks and Ka substitutions and their ratio (Ka/Ks; Table S4). We selected 77protein-encoding genes for further analysis and observed that 69 genes had Ks = 0 and 58 had Ka = 0,while 72 genes had both Ks and Ka = 0. Of the protein-encoding genes, four (accD, ycf 2, ycf 1, and ndhF)had Ka/Ks ratios > 1. ycf 1 and psbC showed Ka/Ks ratios > 0–1 for W. riebeckii, ndhF for W. coagulans,and rps15 for W. adpressa and accD, ycf 2 showed Ka/Ks > 0 for W. adpressa and W. riebeckii, and rpoC2 forW. coagulans and W. riebeckii. The low divergence of most chloroplast genes showed signs of purifyingselection to conserve the sequence and function of proteins related to photosynthesis.

Plants 2020, 9, 752 9 of 20
Plants 2019, 10, x FOR PEER REVIEW 9 of 20
genes showed signs of purifying selection to conserve the sequence and function of proteins related to photosynthesis.
Table 5. Mutational hotspots among Withania species.
S. No Region Nucleotide Diversity T. No's of Mutation Region Length 1 ndhI-ndhA 0.0119 2 84 2 trnY-GUA-trnE-UUC 0.0085 1 59 3 rpl14-rpl16 0.0080 2 125 4 rps19-rpl2 0.0071 1 70 5 rps15 0.0064 3 261 6 trnM-CAU-atpE 0.0053 2 221 7 rps4-trnT-UGU 0.0051 3 364 8 trnQ-UUG-psbK 0.0048 3 346 9 ndhH-rps15 0.0045 1 111 10 trnG-GCC-trnR-UCU 0.0041 1 164
Figure 4. Circular visualization of the distribution of polymorphisms among Withania species. The plastome is shown as a size-proportioned (bp) grey bar in the outer circle. In the inner circle, the values of the (A) average number of nucleotide differences per site or nucleotide diversity (π) and (B) indel diversity are shown with a 100 bp window size.
3.3. Repeat Structure and Analyses
Chloroplast repeat sequences are important sources of variation for evolutionary studies, plant breeding, and construction of linkage maps [67–69]. We performed a microsatellite analysis that revealed shared microsatellite loci ranging from 376 (W. coagulans) to 379 (W. adpressa). Poly-A and T SSR motifs were frequent in Withania chloroplast genome sequences, while AT/TA dinucleotide stretches were also highly abundant. The mononucleotide motifs occurred in 7–17-unit repeats, while dinucleotide repeats had a frequent 4–5-units, whereas other types of SSRs were present mainly in 3–5-unit repeats. Most SSRs occurred in the LSC, followed by IR and SSC (Figure 5) (Table S5). REPuter was also employed to locate further tandem repeats in all Withania species. A
Figure 4. Circular visualization of the distribution of polymorphisms among Withania species.The plastome is shown as a size-proportioned (bp) grey bar in the outer circle. In the inner circle, thevalues of the (A) average number of nucleotide differences per site or nucleotide diversity (π) and(B) indel diversity are shown with a 100 bp window size.
Table 5. Mutational hotspots among Withania species.
S. No Region Nucleotide Diversity T. No’s of Mutation Region Length
1 ndhI-ndhA 0.0119 2 84
2 trnY-GUA-trnE-UUC 0.0085 1 59
3 rpl14-rpl16 0.0080 2 125
4 rps19-rpl2 0.0071 1 70
5 rps15 0.0064 3 261
6 trnM-CAU-atpE 0.0053 2 221
7 rps4-trnT-UGU 0.0051 3 364
8 trnQ-UUG-psbK 0.0048 3 346
9 ndhH-rps15 0.0045 1 111
10 trnG-GCC-trnR-UCU 0.0041 1 164
3.3. Repeat Structure and Analyses
Chloroplast repeat sequences are important sources of variation for evolutionary studies, plantbreeding, and construction of linkage maps [67–69]. We performed a microsatellite analysis thatrevealed shared microsatellite loci ranging from 376 (W. coagulans) to 379 (W. adpressa). Poly-A andT SSR motifs were frequent in Withania chloroplast genome sequences, while AT/TA dinucleotidestretches were also highly abundant. The mononucleotide motifs occurred in 7–17-unit repeats, whiledinucleotide repeats had a frequent 4–5-units, whereas other types of SSRs were present mainly in3–5-unit repeats. Most SSRs occurred in the LSC, followed by IR and SSC (Figure 5) (Table S5). REPuterwas also employed to locate further tandem repeats in all Withania species. A total of 66 oligonucleotide

Plants 2020, 9, 752 10 of 20
repeats were found among Withania species. The F and P repeats were present in large numbers inall species. The oligonucleotide repeats were variable in size (30–60 bp) and a large fraction of therepeats was located in the LSC and existed in IGS regions, followed by gene, intron, and coding DNAsequence (CDS) regions (Figure 6; Table S7). The number of tandem repeats varied from 22 to 25 bpamong Withania species (Figure 7; Table S6).
Plants 2019, 10, x FOR PEER REVIEW 10 of 20
oligonucleotide repeats were found among Withania species. The F and P repeats were present in large numbers in all species. The oligonucleotide repeats were variable in size (30–60 bp) and a large fraction of the repeats was located in the LSC and existed in IGS regions, followed by gene, intron, and coding DNA sequence (CDS) regions (Figure 6; Table S7). The number of tandem repeats varied from 22 to 25 bp among Withania species (Figure 7; Table S6).
Figure 5. Comparative analysis of microsatellite repeats among Withania species. (A) Total number of microsatellites and their classification according to the number of repeat units. (B) The distribution of microsatellites among structural regions of the plastome. (C) Repeat unit composition of Withania microsatellites.
Figure 6. (A) The total number of oligonucleotide repeats among Withania species and their distribution according to specific characteristics. (B) The distribution of repeats in size ranges. (C) The number of repeats grouped according to their location in each structural region (D) The distribution of repeats in intergenic spacer regions (IGS), genes, coding DNA sequences (CDS), and introns and their proportionate occurrence.
Figure 5. Comparative analysis of microsatellite repeats among Withania species. (A) Total number ofmicrosatellites and their classification according to the number of repeat units. (B) The distributionof microsatellites among structural regions of the plastome. (C) Repeat unit composition ofWithania microsatellites.
Plants 2019, 10, x FOR PEER REVIEW 10 of 20
total of 66 oligonucleotide repeats were found among Withania species. The F and P repeats were present in large numbers in all species. The oligonucleotide repeats were variable in size (30–60 bp) and a large fraction of the repeats was located in the LSC and existed in IGS regions, followed by gene, intron, and coding DNA sequence (CDS) regions (Figure 6; Table S7). The number of tandem repeats varied from 22 to 25 bp among Withania species (Figure 7; Table S6).
Figure 5. Comparative analysis of microsatellite repeats among Withania species. (A) Total number of microsatellites and their classification according to the number of repeat units. (B) The distribution of microsatellites among structural regions of the plastome. (C) Repeat unit composition of Withania microsatellites.
Figure 6. (A) The total number of oligonucleotide repeats among Withania species and their distribution according to specific characteristics. (B) The distribution of repeats in size ranges. (C) The number of repeats grouped according to their location in each structural region (D) The distribution of repeats in intergenic spacer regions (IGS), genes, coding DNA sequences (CDS), and introns and their proportionate occurrence.
Figure 6. (A) The total number of oligonucleotide repeats among Withania species and their distributionaccording to specific characteristics. (B) The distribution of repeats in size ranges. (C) The numberof repeats grouped according to their location in each structural region (D) The distribution ofrepeats in intergenic spacer regions (IGS), genes, coding DNA sequences (CDS), and introns and theirproportionate occurrence.

Plants 2020, 9, 752 11 of 20Plants 2019, 10, x FOR PEER REVIEW 11 of 20
Figure 7. The assessment of tandem repeats (A) The total number of tandem repeats and (B) their distribution among functional regions of the plastome. (C) Tandem repeat number, size, and distribution.
3.4. Comparative Plastomics and Inverted Repeat Boundaries
The plastome of land plants has a conserved quadripartite structure while variation frequently occurs in a form of expansion and contraction of the junction sites that could rarely even lead to the loss of the entire IR regions [70,71]. The size of each structural element of the plastome (LSC, SSC, and IR) shows variation at the junction sites JL (LSC/IR) and JS (IR/SSC). Studying these boundaries among plant linages could broaden our knowledge about chloroplast genome evolution and speciation processes [72]. Syntenies among the junction sites could be conserved between species and could explain relationships among them [73]. To investigate such events, we compared the JL (LSC/IR) and JS (IR/SSC) junction sites of Withania plastomes (Figure 8). The resemblance at junctions revealed the close resemblance among the Withania species. The rps19 gene was found at the junction site of JLB (LSC/IRb), and a portion of this gene (8–59 bp) was copied in the IRa in all Withania genomes. The ndhF gene was entirely present in the SSC region in W. somnifera and W. adpressa, but in W. coagulans (5 bp) and W. riebeckii (3 bp) it was located in the IRb region.
Figure 7. The assessment of tandem repeats (A) The total number of tandem repeats and (B) theirdistribution among functional regions of the plastome. (C) Tandem repeat number, size, and distribution.
3.4. Comparative Plastomics and Inverted Repeat Boundaries
The plastome of land plants has a conserved quadripartite structure while variation frequentlyoccurs in a form of expansion and contraction of the junction sites that could rarely even lead to theloss of the entire IR regions [70,71]. The size of each structural element of the plastome (LSC, SSC,and IR) shows variation at the junction sites JL (LSC/IR) and JS (IR/SSC). Studying these boundariesamong plant linages could broaden our knowledge about chloroplast genome evolution and speciationprocesses [72]. Syntenies among the junction sites could be conserved between species and couldexplain relationships among them [73]. To investigate such events, we compared the JL (LSC/IR) andJS (IR/SSC) junction sites of Withania plastomes (Figure 8). The resemblance at junctions revealed theclose resemblance among the Withania species. The rps19 gene was found at the junction site of JLB(LSC/IRb), and a portion of this gene (8–59 bp) was copied in the IRa in all Withania genomes. The ndhFgene was entirely present in the SSC region in W. somnifera and W. adpressa, but in W. coagulans (5 bp)and W. riebeckii (3 bp) it was located in the IRb region.
3.5. Putative RNA-Editing Sites
RNA editing is the molecular processes that can alter the sequence of the transcribed RNA byinsertion, deletion, or nucleotide substitution [46]. RNA editing aids in creating transcripts andmaintaining protein diversity [74], thus several sites are conserved in the plastome of angiosperms [75].To examine the RNA editing in Withania species, we predicted putative sites in the plastomes usingPREP-cp. This revealed 37 putative sites in 15 genes of W. somnifera, while 35, 39, and 37 editing siteswere found in 13 genes of W. coagulans and in 14 genes of W. adpressa and W. riebeckii, respectively.The gene clpP has editing sites only in W. somnifera and ccsA only in W. adpressa. Among Withaniaspecies ndhB (9), ndhD (7), and rpoB (5) had the highest number of RNA-editing sites. All specieshad high levels of conversion for serine (Ser) to leucine (Leu; 60%, 53.8%, and 59.4%, respectively),followed by proline (Pro) to Leu (14.28%, 17.94%, and 16.21%, respectively), and Ser to phenylalanine(Phe; 8.57%, 10.2%, and 10.8%, respectively). Of the putative RNA-editing sites detected, 33 (94.2%),34 (87.1%), and 33 (89.1%) codons were substituted on the second nucleotide and two (5.71%), five(12.8%), and four (10.81%) codons were substituted in the first nucleotide in W. coagulans, W. adpressa,and W. riebeckii, respectively. Many amino acids were converted from Ser to Leu helping to formhydrophobic amino acids, e.g., valine (Val), Leu, and Phe (Table S8).

Plants 2020, 9, 752 12 of 20Plants 2019, 10, x FOR PEER REVIEW 12 of 20
Figure 8. The comparative assessment of junction sites among six Withania species and six outgroups of Solanaceae. Genes are represented by boxes above (negative-strand) and below (positive-strand) the proportionate line. The size of each gene and their relative position at the junctions are shown in base pairs (bp). The figure shows the conservation of the junctions among Withania species with mild shifts at the JSB (IRb/SSC).
3.5. Putative RNA-Editing Sites
RNA editing is the molecular processes that can alter the sequence of the transcribed RNA by insertion, deletion, or nucleotide substitution [46]. RNA editing aids in creating transcripts and maintaining protein diversity [74], thus several sites are conserved in the plastome of angiosperms [75]. To examine the RNA editing in Withania species, we predicted putative sites in the plastomes using PREP-cp. This revealed 37 putative sites in 15 genes of W. somnifera, while 35, 39, and 37 editing sites were found in 13 genes of W. coagulans and in 14 genes of W. adpressa and W. riebeckii, respectively. The gene clpP has editing sites only in W. somnifera and ccsA only in W. adpressa. Among Withania species ndhB (9), ndhD (7), and rpoB (5) had the highest number of RNA-editing sites. All species had high levels of conversion for serine (Ser) to leucine (Leu; 60%, 53.8%, and 59.4%, respectively), followed by proline (Pro) to Leu (14.28%, 17.94%, and 16.21%, respectively), and Ser to phenylalanine (Phe; 8.57%, 10.2%, and 10.8%, respectively). Of the putative RNA-editing sites detected, 33 (94.2%), 34 (87.1%), and 33 (89.1%) codons were substituted on the second nucleotide and two (5.71%), five (12.8%), and four (10.81%) codons were substituted in the first nucleotide in W. coagulans, W. adpressa, and W. riebeckii, respectively. Many amino acids were converted from Ser to Leu helping to form hydrophobic amino acids, e.g., valine (Val), Leu, and Phe (Table S8).
3.6. Phylogenetic Analysis
We performed maximum-likelihood (ML) and Bayesian analysis for phylogenetic reconstruction for 19 Solanaceae species, based on selected protein-coding gene sequences extracted from whole-plastome sequences. Based on a 69,582-bp alignment, our tree was reconstructed and
Figure 8. The comparative assessment of junction sites among six Withania species and six outgroupsof Solanaceae. Genes are represented by boxes above (negative-strand) and below (positive-strand) theproportionate line. The size of each gene and their relative position at the junctions are shown in basepairs (bp). The figure shows the conservation of the junctions among Withania species with mild shiftsat the JSB (IRb/SSC).
3.6. Phylogenetic Analysis
We performed maximum-likelihood (ML) and Bayesian analysis for phylogenetic reconstruction for19 Solanaceae species, based on selected protein-coding gene sequences extracted from whole-plastomesequences. Based on a 69,582-bp alignment, our tree was reconstructed and resolved identical topologiesfor both methods and a phylogenetic tree were supported by high bootstrap values and posteriorprobabilities (Figure 9). The genus Withania was represented by W. adpressa, native to North Africa,Morocco, and Algeria, W. coagulans from the eastern distribution area, W. riebeckii native to the islandof Socotra, Jemen, and finally, the widespread W. somnifera. Our phylogenetic analysis with limitedtaxonomic sampling resolved Withania as a monophyletic of the genus. However, further sampling isneeded to investigate the relationship of the allied genera especially from Athenaea Sendtn., AurelianaSendtn., and Mellissia Hook. f. not included in our analysis, which were shown to be closely related toWithania [76]. Our results were consistent with previous findings based on plastid intergenic atpB-rbcLspacer [77], ndhF and trnLF [1], or whole plastome sequences [18].

Plants 2020, 9, 752 13 of 20
Plants 2019, 10, x FOR PEER REVIEW 13 of 20
resolved identical topologies for both methods and a phylogenetic tree were supported by high bootstrap values and posterior probabilities (Figure 9). The genus Withania was represented by W. adpressa, native to North Africa, Morocco, and Algeria, W. coagulans from the eastern distribution area, W. riebeckii native to the island of Socotra, Jemen, and finally, the widespread W. somnifera. Our phylogenetic analysis with limited taxonomic sampling resolved Withania as a monophyletic of the genus. However, further sampling is needed to investigate the relationship of the allied genera especially from Athenaea Sendtn., Aureliana Sendtn., and Mellissia Hook. f. not included in our analysis, which were shown to be closely related to Withania [76]. Our results were consistent with previous findings based on plastid intergenic atpB-rbcL spacer [77], ndhF and trnLF [1], or whole plastome sequences [18].
Figure 9. Maximum likelihood (ML) tree reconstructed among 19 species of Solanaceae based on 74 protein-coding genes. Bootstrap, SH-aLRT values and Bayesian posterior probabilities are indicated at each node as UFBoot/SH-aLRT/PP. Unmarked nodes have maximum support values. The scale bar is proportional to substitution per site.
4. Discussion
Chloroplast DNA (cpDNA) is frequently used in plant phylogenetics at various levels (i.e., generic level and above) [19,66,78]. It has also been used in Solanaceae systematics to infer family level phylogenetic relationships and to identify major clades and dispersal events [79]. Thus, we characterized, annotated, and analyzed the plastome of Withania species, which was further used in phylogenetic inference. Withania species belong to a rather diverse and widely distributed Withaninae clade within the so-called physaloid group. Species of the genus Withania are
Figure 9. Maximum likelihood (ML) tree reconstructed among 19 species of Solanaceae based on74 protein-coding genes. Bootstrap, SH-aLRT values and Bayesian posterior probabilities are indicatedat each node as UFBoot/SH-aLRT/PP. Unmarked nodes have maximum support values. The scale bar isproportional to substitution per site.
4. Discussion
Chloroplast DNA (cpDNA) is frequently used in plant phylogenetics at various levels (i.e.,generic level and above) [19,66,78]. It has also been used in Solanaceae systematics to infer family levelphylogenetic relationships and to identify major clades and dispersal events [79]. Thus, we characterized,annotated, and analyzed the plastome of Withania species, which was further used in phylogeneticinference. Withania species belong to a rather diverse and widely distributed Withaninae clade withinthe so-called physaloid group. Species of the genus Withania are morphologically similar: the flowersare found in lateral clusters (fascicles) lacking a supporting inflorescence stem (peduncle). The flowerpetals (corollas) are bell or elongated cup-shaped, sometimes urn-shaped, circular and flattened (rotate),or trumpet-shaped (salverform), while the filaments often form nectar grooves with lateral attachments.The Withaninae clade consists of approximately seven small often monotypic genera mostly foundin the Old World, e.g., Tubocapsicum (Wettst.) Makino, Mellissia, Aureliana, or Discopodium Hochst.D’Arcy [80] considered Withania to be one of the truly Old-World genera, while Symon [81] regardedit as a distinctive African Gondwanan element. Withania has a center of distribution around Spain,NW Africa extending to the Canary Islands, while another is located in India, the southern regionof the Arabian Peninsula, and the Horn of Africa. The phylogenetic relationships within the genusare poorly known, and the biology, chromosome numbers, and the exact number of species are alsolacking. Chromosome counts showed that most species of Withania are polyploids with 2n = 2x =

Plants 2020, 9, 752 14 of 20
48 [82], derived from the x = 12 haploid chromosome number typical for the majority of Solanaceaespecies. In addition to the currently accepted Withania taxa, there are 35 unresolved botanical namesthat need further investigation to clarify the taxonomy of the genus.
In the Hepper’s treatment [83], Withania consisted of 10 species, which were extended byHunziker [84] with the addition of nine mesophytes from the genera Mellissia Hook. and PhysaliastrumMakino. These additions extended the geographical range of the genus from the Canary Islands inthe west, through Asia to China and Japan in the east. Symon [81] also emphasized the similarityof Mellissia (a critically endangered endemic of St Helena) to Withania but retained them as distinctgenera. In contrast, Hunziker [84] included Mellissia within Withania and molecular results supportthis placement [1]. There is no consensus on the positions of the small clades related to Withania, whileits closest relatives are also debated. In our analysis, Withania formed a clade together with Physalis,similarly to the findings of Deanna et al. [82], although this branching is supported by only weakbootstrap values.
Plastome sequences could be used as tools to further elucidate species boundaries and investigatethe phylogenetic relationships among the small clades of Withaninae and resolve the taxonomic debateover the placement of Melissia and other monotypic genera. For such barcoding studies our resultscould provide valuable reference genomes for assemblies. The hotspot regions described in our studycould be useful in such phylogenetic or even population genetic investigations. It was previouslydemonstrated that identifying highly variable regions by comparative plastomics could provide revealloci that could be used in DNA barcoding [85–87]. Such divergent hotspots in the plastomes can beapplied for DNA barcoding at the generic level [29,88–90]. Thus, the set of 10 polymorphic regionsidentified among Withania in our study could be applied for DNA barcoding. Moreover, similar to theaforementioned studies, our identified mutational hotspots showed high discrimination propertiesand from the 10 mutational hotspots, three regions were found to be sufficient for the identification ofthe four Withania species included in our study.
We analyzed Ks substitutions and Ka substitutions of protein-coding genes and recorded greaterKs substitutions relative to the Ka substations. Such observations are essential markers in evolutionfor defining slow- and fast-evolving genes [91]. The Ka/Ks ratio also informs us about the selectionpressure on these genes. When the Ka/Ks value is minimal, it represents purifying selection, whilevalues similar to it or equal to 1 represent neutral evolution, and values greater than 1 denote positiveselection [85]. Most plastid genes showed a minimal Ka/Ks ratio (<1), demonstrating that purifyingselection is acting over these genes, due to functional constraints of the plastome. However, atpB, ndhD,ndhF, rpoA, rpoC1, rps2, and rps12 showed greater Ka/Ks values (>1), possibly indicating selectivepressure acting over these genes that was previously proposed in other groups [92–95]. Our samplingin the Withania clade was limited to explore the biological causes of the elevated Ka/Ks ratios observedin cases involving these genes. Here, we suggest that the following set of genes could be the principalcandidates in investigations of these environmental interactions and their effects on plastid genes. Suchinvestigations should include a nearly complete phylogenetic sampling of Withania and consider theeffects of arbitrary variations in Ka and Ks values leading to false positive inferences and values higherthan 1. These shortcoming can be bypassed by complete sampling and additional tests of selectivepressure also stressed here for future analyses.
5. Conclusions
It has been shown that DNA barcoding can fail in complicated groups [96]. Solanaceae includesmany species complexes with tangled taxonomy such examples of species groups can be found inpotatoes and its wild relatives, e.g., Solanum brevicaule complex [97], or the eggplant and its wild relatives(S. melongena complex [98]) but in other clades of the family for example in the genus Petunia [99] orclosely related Physalis [100]. In these complicated groups well known plastid barcode regions (e.g.,trnH-psbA, matK) could lack enough polymorphism and thus could fail to provide species-specificinformation necessary for differentiation [96]. It has been shown that plastid genome based “super
Plants 2020, 9, 752 15 of 20
barcoding” could overcome these difficulties and could differentiate species in difficult taxonomicgroups. This approach has been successfully employed in the S. melongena complex to trace theancestors of cultivated eggplant and differentiate closely related wild species [98]. Here, we comparedthe complete plastome sequences of four Withania species and investigated if plastid genomes based“super barcoding” could be applied among closely related ashwagandha species. The structure of thesegenomes showed synteny with a previously reported organization of Solanaceae species. We identifiedsequence divergence hotspots and located repeat sequences and indels in the plastomes of Withaniaspecies. These regions may constitute a useful means to develop suitable molecular markers for speciesidentification and DNA barcoding of ashwagandha medicinal products. It is hoped that our study willaid the development of DNA barcoding markers to clarify the taxonomic identity of Withania speciesin medicinal plant production. Such plastome-based “super barcoding” could be repeatable, reliable,and sensitive enough to distinguish look-alike species of ashwagandha.
Supplementary Materials: The following are available online at http://www.mdpi.com/2223-7747/9/6/752/s1,Table S1: Base composition in the chloroplast genome of W. somnifera, W. coagulans, W. adpressa and W. riebeckii;Table S2: Codon usage in the chloroplast genome of W. somnifera, W. coagulans, W. adpressa and W. riebeckii; TableS3: Putative RNA editing sites composition in the chloroplast genome of W. somnifera, W. coagulans, W. adpressaand W. riebeckii; Table S4: Comparison of synonymous and non-synonymous substitution in Withania species S5:Microsatellites loci in the chloroplast genome of W. somnifera, W. coagulans, W. adpressa and W. riebeckii; Table S6:Oligonucleotide repeats in chloroplast genomes of W. somnifera, W. coagulans, W. adpressa and W. riebeckii; Table S7:Tandem Repeat sequences in the chloroplast genome of W. somnifera, W. coagulans, W. adpressa and W. riebeckii;Table S8: The distribution and characteristics of SNPs found among Withania plastid genomes; Table S9: NCBIGenBank accession numbers used in this study; Table S10: Model selected for each data partition identified bysoftware Partition Finder for protein-coding chloroplast genes and intron regions in maximum likelihood (ML)analysis and Bayesian inference (BI).
Author Contributions: Conceptualization: F.M., B.M., P.P.; Formal analysis: F.M., A., Z.U., P.P.; Investigation:F.M., A., Z.U., P.P.; Methodology: F.M., A., Z.U., P.P.; Project administration: B.M., P.P., Y.B.; Resources: B.M., P.P.,Y.B.; Software: F.M., A., Z.U., P.P.; Supervision: B.M., P.P.; Validation: F.M., P.P.; Visualization: F.M., P.P.; Writingoriginal draft: F.M., A., P.P.; Writing—review and editing: F.M., A., P.P. All authors have read and agreed to thepublished version of the manuscript.
Funding: This research was funded by the National Key Research and Development Program of China(2016YFE0206600 to Y.B.); The 13th Five-year Informatization Plan of the Chinese Academy of Sciences(XXH13505–05 to Y.B.); The Open Biodiversity and Health Big Data Program of IUBS (to Y.B.).
Acknowledgments: We acknowledge the DNA4 Technologies LLC (Withania adpressa and Withania riebeckii)for sequencing and deposition of the raw sequencing data in the public repository of the National Center ofBiotechnology Information. The authors thank James Thompson for editing the manuscript.
Conflicts of Interest: The authors declare that they have no conflict of interest.
References
1. Olmstead, R.G.; Bohs, L.; Migid, H.A.; Santiago-Valentin, E.; Garcia, V.F.; Collier, S.M. A molecular phylogenyof the Solanaceae. Taxon 2008, 57, 1159–1181. [CrossRef]
2. Olmstead, R.G.; Bohs, L. A summary of molecular systematic research in Solanaceae: 1982–2006. SolanaceaeIV: Genomics meets biodiversity. In Proceedings of the VIth International Solanaceae Conference, Madison,WI, USA, 23–27 July 2006; pp. 255–268.
3. Knapp, S.; Bohs, L.; Nee, M.; Spooner, D.M. Solanaceae—A model for linking genomics with biodiversity.Comp. Funct. Genom. 2004, 5, 285–291. [CrossRef]
4. Mirjalili, M.H.; Moyano, E.; Bonfill, M.; Cusido, R.M.; Palazón, J. Steroidal lactones from Withania somnifera,an ancient plant for novel medicine. Molecules 2009, 14, 2373–2393. [CrossRef] [PubMed]
5. Singh, P.; Guleri, R.; Singh, V.; Kaur, G.; Kataria, H.; Singh, B.; Kaur, G.; Kaul, S.C.; Wadhwa, R.; Pati, P.K.Biotechnological interventions in Withania somnifera (L.) dunal. Biotechnol. Genet. Eng. Rev. 2015, 31, 1–20.[CrossRef] [PubMed]
6. Uddin, Q.; Samiulla, L.; Singh, V.K.; Jamil, S.S. Phytochemical and pharmacological profile of Withaniasomnifera dunal: A review. J. Appl. Pharm. Sci. 2012, 2, 170–175.
7. Maurya, R. Chemistry and pharmacology of Withania coagulans: An ayurvedic remedy. J. Pharm. Pharm.2010, 62, 153–160. [CrossRef] [PubMed]

Plants 2020, 9, 752 16 of 20
8. Ul-Haq, I.; Youn, U.J.; Chai, X.; Park, E.-J.; Kondratyuk, T.P.; Simmons, C.J.; Borris, R.P.; Mirza, B.; Pezzuto, J.M.;Chang, L.C. Biologically active withanolides from Withania coagulans. J. Nat. Prod. 2013, 76, 22–28. [CrossRef][PubMed]
9. Rehman, S.; Keefover-Ring, K.; Haq, I.U.L.; Dilshad, E.; Khan, M.I.; Akhtar, N.; Mirza, B. Drier climaticconditions increase withanolide content of Withania coagulans enhancing its inhibitory potential againsthuman prostate cancer cells. Appl. Biochem. Biotechnol. 2019, 188, 460–480. [CrossRef] [PubMed]
10. Shinwari, Z.K. Medicinal plants research in Pakistan. J. Med. Plants Res. 2010, 4, 161–176.11. Raclariu, A.C.; Heinrich, M.; Ichim, M.C.; de Boer, H. Benefits and limitations of DNA barcoding and
metabarcoding in herbal product authentication. Phytochem. Anal. 2018, 29, 123–128. [CrossRef]12. Li, M.; Cao, H.; But, P.P.H.; Shaw, P.C. Identification of herbal medicinal materials using DNA barcodes.
J. Syst. Evol. 2011, 49, 271–283. [CrossRef]13. Jin, S.; Daniell, H. The engineered chloroplast genome just got smarter. Trends Plant. Sci. 2015, 20, 622–640.
[CrossRef] [PubMed]14. Cooper, G. Chloroplasts and Other Plastids in the Cell: A Molecular Approach, 2nd ed.; Sinauer Associates:
Sunderland, MA, USA, 2000.15. Palmer, J.D. Comparative organization of chloroplast genomes. Annu. Rev. Genet. 1985, 19, 325–354.
[CrossRef]16. Daniell, H.; Lin, C.-S.; Yu, M.; Chang, W.-J. Chloroplast genomes: Diversity, evolution, and applications in
genetic engineering. Genome Biol. 2016, 17, 134. [CrossRef] [PubMed]17. Oldenburg, D.J.; Bendich, A.J. DNA maintenance in plastids and mitochondria of plants. Front. Plant. Sci.
2015, 6, 883. [CrossRef] [PubMed]18. Amiryousefi, A.; Hyvönen, J.; Poczai, P. The chloroplast genome sequence of bittersweet (Solanum dulcamara):
Plastid genome structure evolution in Solanaceae. PLoS ONE 2018, 13, 1–23. [CrossRef] [PubMed]19. Abdullah; Shahzadi, I.; Mehmood, F.; Ali, Z.; Malik, M.S.; Waseem, S.; Mirza, B.; Ahmed, I.; Waheed, M.T.
Comparative analyses of chloroplast genomes among three Firmiana species: Identification of mutationalhotspots and phylogenetic relationship with other species of Malvaceae. Plant. Gene 2019, 19, 100199.[CrossRef]
20. Henriquez, C.L.; Abdullah; Ahmed, I.; Carlsen, M.M.; Zuluaga, A.; Croat, T.B.; Mckain, M.R. Evolutionarydynamics of chloroplast genomes in subfamily Aroideae (Araceae). Genomics 2020, 112, 2349–2360. [CrossRef]
21. Xu, J.-H.; Liu, Q.; Hu, W.; Wang, T.; Xue, Q.; Messing, J. Dynamics of chloroplast genomes in green plants.Genomics 2015, 106, 221–231. [CrossRef]
22. Moore, M.J.; Bell, C.D.; Soltis, P.S.; Soltis, D.E. Using plastid genome-scale data to resolve enigmaticrelationships among basal angiosperms. Proc. Natl. Acad. Sci. USA 2007, 104, 19363–19368. [CrossRef]
23. Ravi, V.; Khurana, J.P.; Tyagi, A.K.; Khurana, P. An update on chloroplast genomes. Plant. Syst. Evol. 2008,271, 101–122. [CrossRef]
24. Mehmood, F.; Abdullah; Shahzadi, I.; Ahmed, I.; Waheed, M.T.; Mirza, B. Characterization of Withaniasomnifera chloroplast genome and its comparison with other selected species of Solanaceae. Genomics 2020,112, 1522–1530. [CrossRef] [PubMed]
25. Iram, S.; Hayat, M.Q.; Tahir, M.; Gul, A.; Abdullah; Ahmed, I. Chloroplast genome sequence of Artemisiascoparia: Comparative analyses and screening of mutational hotspots. Plants 2019, 8, 476. [CrossRef][PubMed]
26. Bansal, K.C.; Saha, D. Chloroplast genomics and genetic engineering for crop improvement. Agric. Res. 2012,1, 53–66. [CrossRef]
27. Waheed, M.T.; Thönes, N.; Müller, M.; Hassan, S.W.; Razavi, N.M.; Lössl, E.; Kaul, H.P.; Lössl, A.G.Transplastomic expression of a modified human papillomavirus L1 protein leading to the assembly ofcapsomeres in tobacco: A step towards cost-effective second-generation vaccines. Transgenic Res. 2011, 20,271–282. [CrossRef] [PubMed]
28. Waheed, M.T.; Ismail, H.; Gottschamel, J.; Mirza, B.; Lössl, A.G. Plastids: The green frontiers for vaccineproduction. Front. Plant. Sci. 2015, 6, 1005. [CrossRef] [PubMed]
29. Ahmad, I. Evolutionary Dynamics in Taro. Ph.D. Thesis, Massey University, Palmerston North, NewZealand, 2014.

Plants 2020, 9, 752 17 of 20
30. Wambugu, P.W.; Brozynska, M.; Furtado, A.; Waters, D.L.; Henry, R.J. Relationships of wild and domesticatedrices (Oryza AA genome species) based upon whole chloroplast genome sequences. Sci. Rep. 2015, 5, 13957.[CrossRef] [PubMed]
31. Murray, M.G.; Thompson, W.F. Rapid isolation of high molecular weight plant DNA. Nucleic Acids Res. 1980,8, 4321–4325. [CrossRef]
32. Andrews, S. FASTQC. A Quality Control Tool for High throughput Sequence Data. Available online:https://www.bioinformatics.babraham.ac.uk/projects/fastqc/ (accessed on 14 February 2020).
33. Zerbino, D.R.; Birney, E. Velvet: Algorithms for de novo short read assembly using de Bruijn graphs. GenomeRes. 2008, 18, 821–829. [CrossRef]
34. Kearse, M.; Moir, R.; Wilson, A.; Stones-Havas, S.; Cheung, M.; Sturrock, S.; Buxton, S.; Cooper, A.;Markowitz, S.; Duran, C.; et al. Geneious basic: An integrated and extendable desktop software platform forthe organization and analysis of sequence data. Bioinformatics 2012, 28, 1647–1649. [CrossRef]
35. Tillich, M.; Lehwark, P.; Pellizzer, T.; Ulbricht-Jones, E.S.; Fischer, A.; Bock, R.; Greiner, S. GeSeq-versatile andaccurate annotation of organelle genomes. Nucleic Acids Res. 2017, 45, W6–W11. [CrossRef] [PubMed]
36. Shi, L.; Chen, H.; Jiang, M.; Wang, L.; Wu, X.; Huang, L.; Liu, C. CPGAVAS2, an integrated plastome sequenceannotator and analyzer. Nucleic Acids Res. 2019, 47, W65–W73. [CrossRef] [PubMed]
37. Lowe, T.M.; Chan, P.P. tRNAscan-SE On-line: Integrating search and context for analysis of transfer RNAgenes. Nucleic Acids Res. 2016, 44, W54–W57. [CrossRef] [PubMed]
38. Laslett, D.; Canback, B. ARAGORN, a program to detect tRNA genes and tmRNA genes in nucleotidesequences. Nucleic Acids Res. 2004, 32, 11–16. [CrossRef] [PubMed]
39. Cheong, W.-H.; Tan, Y.-C.; Yap, S.-J.; Ng, K.-P. Clico FS: An interactive web-based service of Circos.Bioinformatics 2015, 31, 3685–3687. [CrossRef]
40. Li, H.; Durbin, R. Fast and accurate short read alignment with burrows-wheeler transform. Bioinformatics2009, 25, 1754–1760. [CrossRef]
41. Milne, I.; Bayer, M.; Cardle, L.; Shaw, P.; Stephen, G.; Wright, F.; Marshall, D. Tablet-next generation sequenceassembly visualization. Bioinformatics 2009, 26, 401–402. [CrossRef]
42. Zhang, Z.; Zhao, W.; Xiao, J.; Bao, Y.; He, S.; Zhang, G.; Li, Y.; Zhao, G.; Chen, R.; Gao, Y.; et al. Databaseresources of the national genomics data center in 2020. Nucleic Acids Res. 2020, 48, D24–D33.
43. Katoh, K.; Kuma, K.I.; Toh, H.; Miyata, T. MAFFT version 5: Improvement in accuracy of multiple sequencealignment. Nucleic Acids Res. 2005, 33, 511–518. [CrossRef]
44. Rozas, J.; Ferrer-Mata, A.; Sanchez-DelBarrio, J.C.; Guirao-Rico, S.; Librado, P.; Ramos-Onsins, S.E.;Sanchez-Gracia, A. DnaSP 6: DNA sequence polymorphism analysis of large data sets. Mol. Biol. Evol. 2017,34, 3299–3302. [CrossRef]
45. Amiryousefi, A.; Hyvönen, J.; Poczai, P. IRscope: An online program to visualize the junction sites ofchloroplast genomes. Bioinformatics 2018, 34, 3030–3031. [CrossRef] [PubMed]
46. Darzentas, N. Circoletto: Visualizing sequence similarity with Circos. Bioinformatics 2010, 26, 2620–2621.[CrossRef] [PubMed]
47. Mower, J.P. The PREP suite: Predictive RNA editors for plant mitochondrial genes, chloroplast genes anduser-defined alignments. Nucleic Acids Res. 2009, 37, W253–W259. [CrossRef] [PubMed]
48. Beier, S.; Thiel, T.; Münch, T.; Scholz, U.; Mascher, M. MISA-web: A web server for microsatellite prediction.Bioinformatics 2017, 33, 2583–2585. [CrossRef]
49. Kurtz, S.; Choudhuri, J.V.; Ohlebusch, E.; Schleiermacher, C.; Stoye, J.; Giegerich, R. REPuter: The manifoldapplications of repeat analysis on a genomic scale. Nucleic Acids Res. 2002, 29, 4633–4642. [CrossRef]
50. Benson, G. Tandem repeats finder: A program to analyze DNA sequences. Nucleic Acids Res. 1999, 27,573–580. [CrossRef]
51. Nguyen, L.-T.; Schmidt, H.A.; von Haeseler, A.; Minh, B.Q. IQ-TREE: A fast and effective stochastic algorithmfor estimating maximum-likelihood phylogenies. Mol. Biol. Evol. 2015, 32, 268–274. [CrossRef]
52. Kalyaanamoorthy, S.; Minh, B.Q.; Wong, T.K.F.; von Haeseler, A.; Jermiin, L.S. ModelFinder: Fast modelselection for accurate phylogenetic estimates. Nat. Methods 2017, 14, 587–589. [CrossRef]
53. Hoang, D.T.; Chernomor, O.; von Haeseler, A.; Minh, B.Q.; Vinh, L.S. UFBoot2: Improving the ultrafastbootstrap approximation. Mol. Biol. Evol. 2018, 35, 518–522. [CrossRef]

Plants 2020, 9, 752 18 of 20
54. Dereeper, A.; Guignon, V.; Blanc, G.; Audic, S.; Buffet, S.; Chevenet, F.; Dufayard, J.-F.; Guindon, S.; Lefort, V.;Lescot, M.; et al. Phylogeny.fr: Robust phylogenetic analysis for the non-specialist. Nucleic Acids Res. 2008,36, W465–W469. [CrossRef]
55. Lemoine, F.; Correia, D.; Lefort, V.; Doppelt-Azeroual, O.; Mareuil, F.; Cohen-Boulakia, S.; Gascuel, O.NGPhylogeny.fr: New generation phylogenetic services for non-specialists. Nucleic Acids Res. 2019, 47,W260–W265. [CrossRef] [PubMed]
56. Lanfear, R.; Calcott, B.; Ho, S.Y.W.; Guindon, S. PartitionFinder: Combined selection of partitioning schemesand substitution models for phylogenetic analyses. Mol. Biol. Evol. 2012, 29, 1695–1701. [CrossRef] [PubMed]
57. Huelsenbeck, J.P.; Ronquist, F. MRBAYES: Bayesian inference of phylogenetic trees. Bioinformatics 2001, 17,754–755. [CrossRef] [PubMed]
58. Darriba, D.; Taboada, G.L.; Doallo, R.; Posada, D. jModelTest 2: More models, new heuristics and parallelcomputing. Nat. Methods 2012, 9, 772. [CrossRef]
59. Qian, J.; Song, J.; Gao, H.; Zhu, Y.; Xu, J.; Pang, X.; Yao, H.; Sun, C.; Li, X.; Li, C.; et al. The completechloroplast genome sequence of the medicinal plant Salvia miltiorrhiza. PLoS ONE 2013, 8, e57607. [CrossRef][PubMed]
60. Abdullah; Mehmood, F.; Shahzadi, I.; Ali, Z.; Islam, M.; Naeem, M.; Mirza, B.; Lockhart, P.; Ahmed, I.;Waheed, M.T. Correlations among oligonucleotide repeats, nucleotide substitutions and insertion-deletionmutations in chloroplast genomes of plant family Malvaceae. J. Syst. Evol. 2020. [CrossRef]
61. Shahzadi, I.; Abdullah; Mehmood, F.; Ali, Z.; Ahmed, I.; Mirza, B. Chloroplast genome sequences of Artemisiamaritima and Artemisia absinthium: Comparative analyses, mutational hotspots in genus Artemisia andphylogeny in family Asteraceae. Genomics 2020. [CrossRef]
62. Song, Y.; Chen, Y.; Lv, J.; Xu, J.; Zhu, S.; Li, M. Comparative chloroplast genomes of Sorghum species: Sequencedivergence and phylogenetic relationships. Biomed. Res. Int. 2019. [CrossRef]
63. Sun, J.; Chen, M.; Yujiang; Zhao, D.; Tao, J. Characterization of the complete chloroplast genomes of sequencesof two diploid species: Paeonia lactiflora ‘Da Fugui’ and Paeonia ostii ‘Fengdan’ in the Paeoniaceae Family.J. Hortic. 2018, 5, 4. [CrossRef]
64. Ahmed, I.; Biggs, P.J.; Matthews, P.J.; Collins, L.J.; Hendy, M.D.; Lockhart, P.J. Mutational dynamics of aroidchloroplast genomes. Genome Biol. Evol. 2012, 4, 1316–1323. [CrossRef]
65. Shaw, J.; Lickey, E.B.; Schilling, E.E.; Small, R.L. Comparison of whole chloroplast genome sequences tochoose noncoding regions for phylogenetic studies in angiosperms: The tortoise and the hare III. Am. J. Bot.2007, 94, 275–288. [CrossRef] [PubMed]
66. Hollingsworth, P.M.; Graham, S.W.; Little, D.P. Choosing and using a plant DNA barcode. PLoS ONE 2011, 6,e19254. [CrossRef] [PubMed]
67. Worberg, A.; Quandt, D.; Barniske, A.M.; Löhne, C.; Hilu, K.W.; Borsch, T. Phylogeny of basal eudicots:Insights from non-coding and rapidly evolving DNA. Org. Divers. Evol. 2007, 7, 55–77. [CrossRef]
68. Powell, W.; Morgante, M.; McDevitt, R.; Vendramin, G.G.; Rafalski, J.A. Polymorphic simple sequencerepeats regions in chloroplast genomes: Applications to the population genetics of pines. Proc. Natl. Acad.Sci. USA 1995, 92, 7759–7763. [CrossRef]
69. Xue, J.; Wang, S.; Zhou, S.L. Polymorphic chloroplast microsatellite loci in Nelumbo (Nelumbonaceae). Am. J.Bot. 2012, 99, e240–e244. [CrossRef]
70. Zhang, Y.; Du, L.; Liu, A.; Chen, J.; Wu, L.; Hu, W.; Zhang, W.; Kim, K.; Lee, S.-C.; Yang, T.-J.; et al.The Complete chloroplast genome sequences of five Epimedium species: Lights into phylogenetic andtaxonomic analyses. Front. Plant. Sci. 2016, 7, 306. [CrossRef]
71. Wang, R.J.; Cheng, C.L.; Chang, C.C.; Wu, C.L.; Su, T.M.; Chaw, S.M. Dynamics and evolution of the invertedrepeat-large single copy junctions in the chloroplast genomes of monocots. BMC Evol. Biol. 2008, 8, 36.[CrossRef]
72. Palmer, J.D.; Jansen, R.K.; Michaels, H.J.; Chase, M.W.; Manhart, J.R. Chloroplast DNA variation and plantphylogeny. Ann. Mo. Bot. Gard. 1988, 75, 1180–1206. [CrossRef]
73. Liu, H.; He, J.; Ding, C.; Lyu, R.; Pei, L.; Cheng, J.; Xie, L. Comparative analysis of complete chloroplastgenomes of Anemoclema, Anemone, Pulsatilla, and Hepatica revealing structural variations among genera intribe Anemoneae (Ranunculaceae). Front. Plant. Sci. 2018, 9, 1–16. [CrossRef]

Plants 2020, 9, 752 19 of 20
74. Bundschuh, R.; Altmüller, J.; Becker, C.; Nürnberg, P.; Gott, J.M. Complete characterization of the editedtranscriptome of the mitochondrion of Physarum polycephalum using deep sequencing of RNA. Nucleic AcidsRes. 2011, 39, 6044–6055. [CrossRef]
75. Zeng, W.H.; Liao, S.C.; Chang, C.C. Identification of RNA editing sites in chloroplast transcripts of Phalaenopsisaphrodite and comparative analysis with those of other seed plants. Plant. Cell Physiol. 2007, 48, 362–368.[CrossRef] [PubMed]
76. Kool, A.; Oxelman, B.; Thulin, M. Phylogeny of Withania (Solanaceae). In Proceedings of the Abstracts XVIIInternational Botanical Congress, Vienna, Austria, 17–23 July 2005; p. 360.
77. Jamil, I.; Qamarunnisa, S.; Azhar, A.; Shinwari, Z.K.; Ali, S.I.; Qaiser, M.; Jamil, I.; Al, E.T. Subfamilialrelationships within Solanaceae as inferred from atpB-rbcL intergenic spacer. Pak. J. Bot. 2014, 46, 585–590.
78. Jansen, R.K.; Cai, Z.; Raubeson, L.A.; Daniell, H.; de Pamphilis, C.W.; Leebens-Mack, J.; Muller, K.F.;Guisinger-Bellian, M.; Haberle, R.C.; Hansen, A.K.; et al. Analysis of 81 genes from 64 plastomes resolvesrelationships in angiosperms and identifies genome-scale evolutionary patterns. Proc. Natl. Acad. Sci. USA2007, 104, 19369–19374. [CrossRef] [PubMed]
79. Olmstead, R.G.; Sweere, J.A.; Spangler, R.E.; Bohs, L.; Palmer, J.D. Phylogeny and provisional classificationof the Solanaceae based on chloroplast DNA. In Solanaceae IV: Advances in Biology and Utilization; Nee, M.,Symon, D.E., Lester, R.N., Jessop, J.P., Eds.; Royal Botanic Gardens, Kew: Richmond, UK, 1999; pp. 111–137.
80. D’Arcy, W.G. The Solanaceae since 1976, with a review of its biogeography. In Solanaceae III: Taxonomy,Chemistry, Evolution; Hawkes, J.G., Lester, R.N., Nee, M., Estrada, N., Eds.; Royal Botanic Gardens, Kew:Richmond, UK, 1991; pp. 75–138.
81. Symon, D.E. Gondwanan elements of the Solanaceae. In Solanaceae III: Taxonomy, Chemistry, Evolution;Hawkes, J.G., Lester, R.N., Nee, M., Estrada, N., Eds.; Royal Botanical Gardens, Kew: Richmond, UK, 1991;pp. 139–150.
82. Deanna, R.; Smith, S.D.; Särkinen, T.; Chiarini, F. Patterns of chromosomal evolution in the florally diverseAndean clade Iochrominae (Solanaceae). Perspect. Plant. Ecol. Evol. Syst. 2018, 35, 31–43. [CrossRef]
83. Hepper, F.N. Old world Withania (Solanaceae): A taxonomic review and key to the species. In Solanaceae III:Taxonomy, Chemistry, Evolution; Hakes, J.G., Lester, R.N., Nee, M., Estrada, N., Eds.; Royal Botanic Gardens,Kew: Richmond, UK, 1991; pp. 211–228.
84. Hunziker, A.T. Genera Solanacearum: The Genera of Solanaceae Illustrated, Arranged According to a New System;ARG Gantner Verlag: Ruggell, Liechtenstein, 2001.
85. Choi, K.S.; Chung, M.G.; Park, S. The complete chloroplast genome sequences of three veroniceae species(Plantaginaceae): Comparative analysis and highly divergent regions. Front. Plant. Sci. 2016, 7, 1–8. [CrossRef]
86. Abdullah; Waseem, S.; Mirza, B.; Ahmed, I.; Waheed, M.T. Comparative analyses of chloroplast genome inTheobroma cacao and Theobroma grandiflorum. Biologia 2020, 75, 761–771. [CrossRef]
87. Henriquez, C.L.; Abdullah; Ahmed, I.A.; Carlsen, M.M.; Zuluaga, A.; Croat, T.B.; Mckain, M.R. Molecularevolution of chloroplast genomes in Monsteroideae (Araceae). Planta 2020, 251, 72. [CrossRef]
88. Ahmed, I.; Matthews, P.J.; Biggs, P.J.; Naeem, M.; Mclenachan, P.A.; Lockhart, P.J. Identification of chloroplastgenome loci suitable for high-resolution phylogeographic studies of Colocasia esculenta (L.) Schott (Araceae)and closely related taxa. Mol. Ecol. Resour. 2013, 13, 929–937. [CrossRef]
89. Dong, W.; Liu, J.; Yu, J.; Wang, L.; Zhou, S. Highly variable chloroplast markers for evaluating plant phylogenyat low taxonomic levels and for DNA barcoding. PLoS ONE 2012, 7, e35071. [CrossRef]
90. Nguyen, V.B.; Park, H.-S.; Lee, S.-C.; Lee, J.; Park, J.Y.; Yang, T.-J. Authentication markers for five major Panaxspecies developed via comparative analysis of complete chloroplast genome sequences. J. Agric. Food Chem.2017, 65, 6298–6306. [CrossRef]
91. Kimura, M. Model of effectively neutral mutations in which selective constraint is incorporated. Proc. Natl.Acad. Sci. USA 1979, 76, 3440–3444. [CrossRef] [PubMed]
92. Lawrie, D.S.; Messer, P.W.; Hershberg, R.; Petrov, D.A. Strong purifying selection at synonymous sites in D.melanogaster. PLoS Genet. 2013, 9, e1003527. [CrossRef] [PubMed]
93. Poczai, P.; Hyvönen, J. The complete chloroplast genome sequence of the CAM epiphyte Spanish moss(Tillandsia usneoides, Bromeliaceae) and its comparative analysis. PLoS ONE 2017, 12, e0187199. [CrossRef][PubMed]

Plants 2020, 9, 752 20 of 20
94. Mehmood, F.; Abdullah; Ubaid, Z.; Shahzadi, I.; Ahmed, I.; Waheed, M.T.; Poczai, P.; Mirza, B. Plastidgenomics of Nicotiana (Solanaceae): Insights into molecular evolution, positive selection and the origin of thematernal genome of Aztec tobacco (Nicotiana rustica). BioRxiv 2020. [CrossRef]
95. Abdullah; Mehmood, F.; Shahzadi, I.; Waseem, S.; Mirza, B.; Ahmed, I.; Waheed, M.T. Chloroplast genome ofHibiscus rosa-sinensis (Malvaceae): Comparative analyses and identification of mutational hotspots. Genomics2020, 112, 581–591. [CrossRef]
96. Spooner, D.M. DNA barcoding will frequently fail in complicated groups: An example in wild potatotes.Am. J. Bot. 2009, 96, 1177–1189. [CrossRef]
97. Miller, J.T.; Spooner, D.M. Collapse of species boundaries in the wild potato Solanum brevicaule complex(Solanaceae, S. sect. Petota): Molecular data. Plant. Syst. Evol. 1999, 214, 103–130. [CrossRef]
98. Aubriot, X.; Knapp, S.; Syfert, M.M.; Poczai, P.; Buerki, S. Shedding new light on the origin and spread of thebrinjal eggplant (Solanum melongena L.) and its wild relatives. Am. J. Bot. 2018, 105, 1175–1187. [CrossRef]
99. Kulcheski, F.R.; Muschner, V.C.; Lorenz-Lemke, A.P.; Stehmann, J.R.; Bonatto, S.L.; Salzano, F.M.; Freitas, L.B.Molecular phylogenetic analysis of Petunia Juss. (Solanaceae). Genetica 2006, 126, 3–14. [CrossRef]
100. Sullivan, J.R. Systematics of the Physalis viscosa complex (Solanaceae). Syst. Bot. 1985, 10, 426–444. [CrossRef]
© 2020 by the authors. Licensee MDPI, Basel, Switzerland. This article is an open accessarticle distributed under the terms and conditions of the Creative Commons Attribution(CC BY) license (http://creativecommons.org/licenses/by/4.0/).