Embed Size (px)
Citation preview

With Steve Nison, CMTPresident: Candlecharts.com


• Any market• Any time frame• Simple to apply• Safety first trading• Early reversals for razor
sharp entries and exits
Benefits of Nison Candlesticks
www.candlecharts.com

Profit Leaker
Profit Leaker


www.candlecharts.com
open close
open
RealBody
high
low
Real Bodies / Shadows
ANATOMY OF THE CANDLESTICK LINE
close
Shadow

21
22
23
24
25
26
27
28session open high low close
1 22 26 21 26
2 26 27 26 27
3 23 27 22 22
4 25 28 22 25
5 27 27 24 24
1 2 3 4 5
Reading the Market’s Message
Using the data below, draw the candlestick lines and then analyze whateach candlestick line says about who’s in control of the market

21
22
23
24
25
26
27
28session open high low close
1 22 26 21 26
2 26 27 26 27
3 23 27 22 22
4 25 28 22 25
5 27 27 24 24
1 2 3 4 5
Reading the Market’s Message
Using the data below, draw the candlestick lines and then analyze whateach candlestick line says about who’s in control of the market

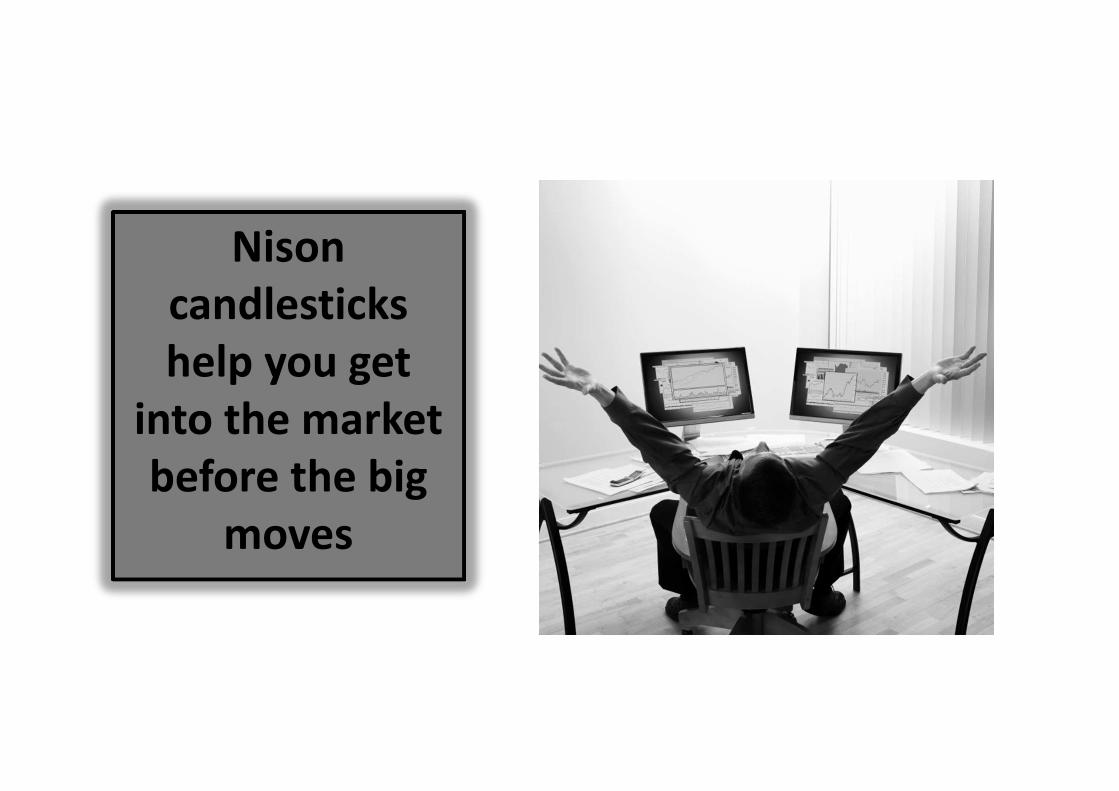
Nisoncandlestickshelp you get
into the marketbefore the big
moves

Evolution of Charts:The 1st Dimension
Line chart
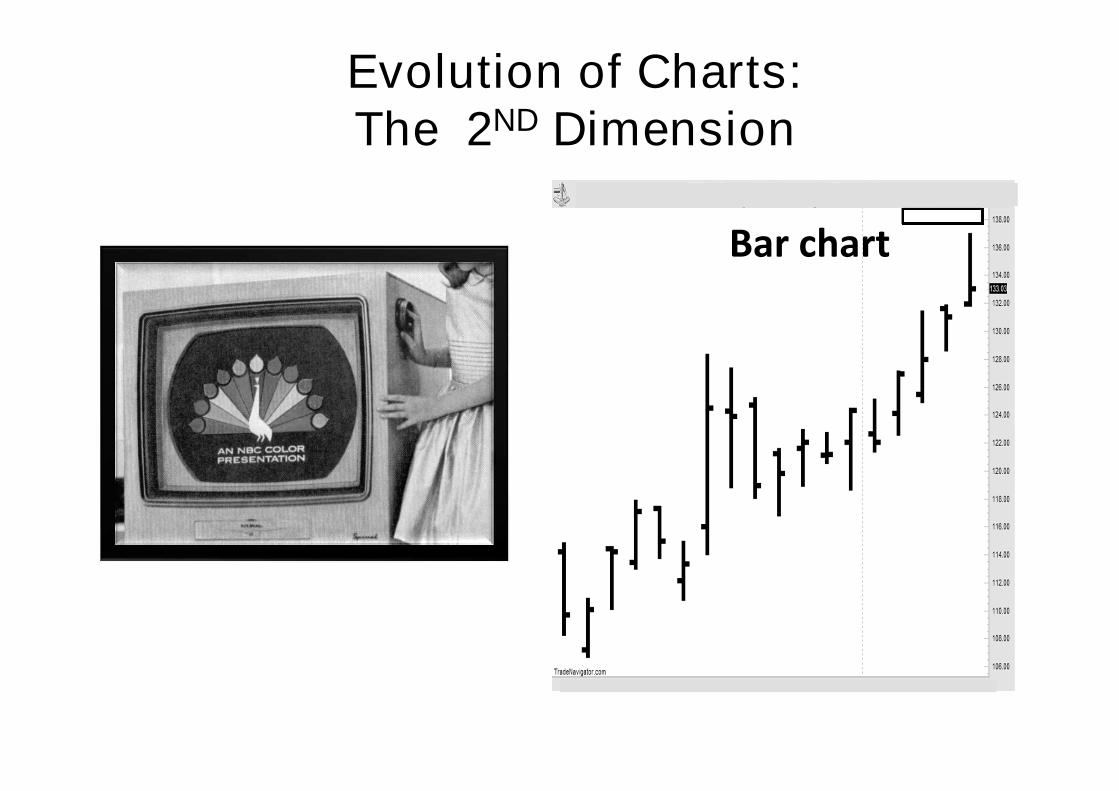
Evolution of Charts:The 2ND Dimension
Bar chart

Evolution of Charts:The 3rd Dimension
candlestick chart

www.candlecharts.com
Black or white candle with long uppershadow compared to real body.
Market Implication:
Potential top reversal
•Market Implication:
For a more details and nuances on successfully using this signal refer toVolume 1-Module 1 and Volume 3-Module 2 of the Nison Educational Series

www.candlecharts.com
Shooting Star “signals trouble overhead”

Nison candlesticks provide you with“Safety First Trading”
© Steve Nison’s Candlecharts.com
www.candlecharts.com
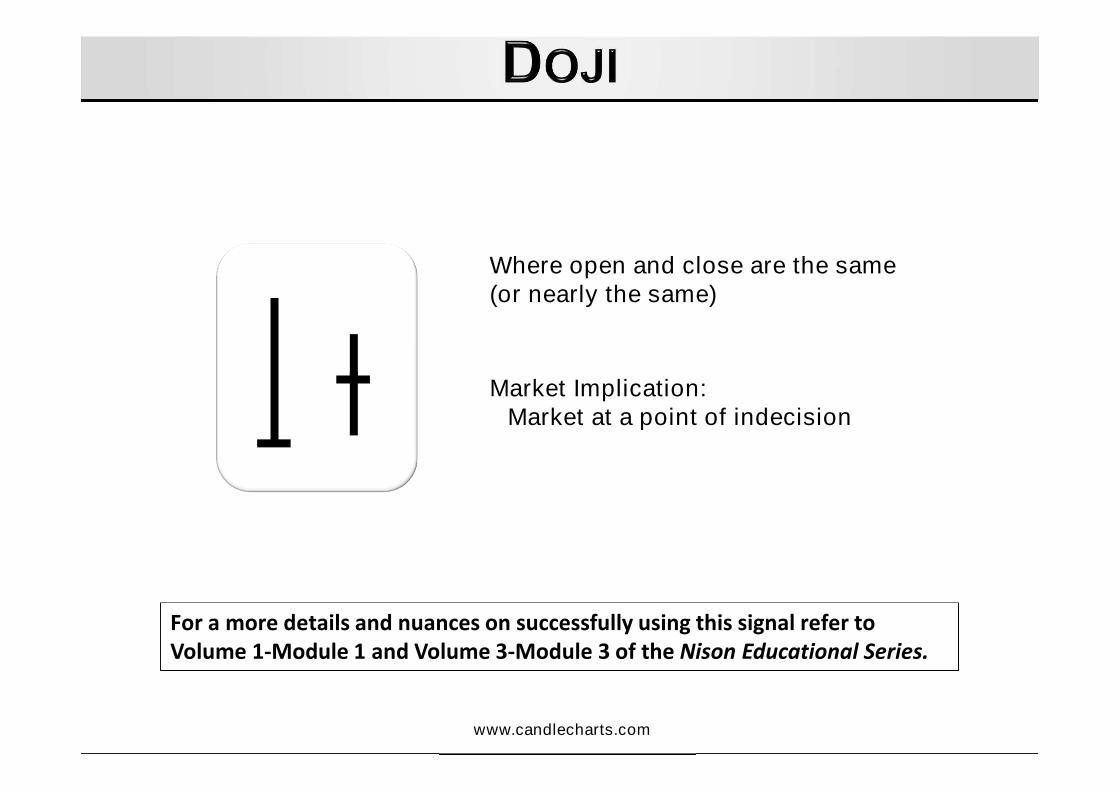
Where open and close are the same(or nearly the same)
Market Implication:Market at a point of indecision
For a more details and nuances on successfully using this signal refer toVolume 1-Module 1 and Volume 3-Module 3 of the Nison Educational Series.

www.candlecharts.com
Doji
The red arrowsshow the bullshave completecontrol. The dojialters the trend.
Doji
www.candlecharts.com
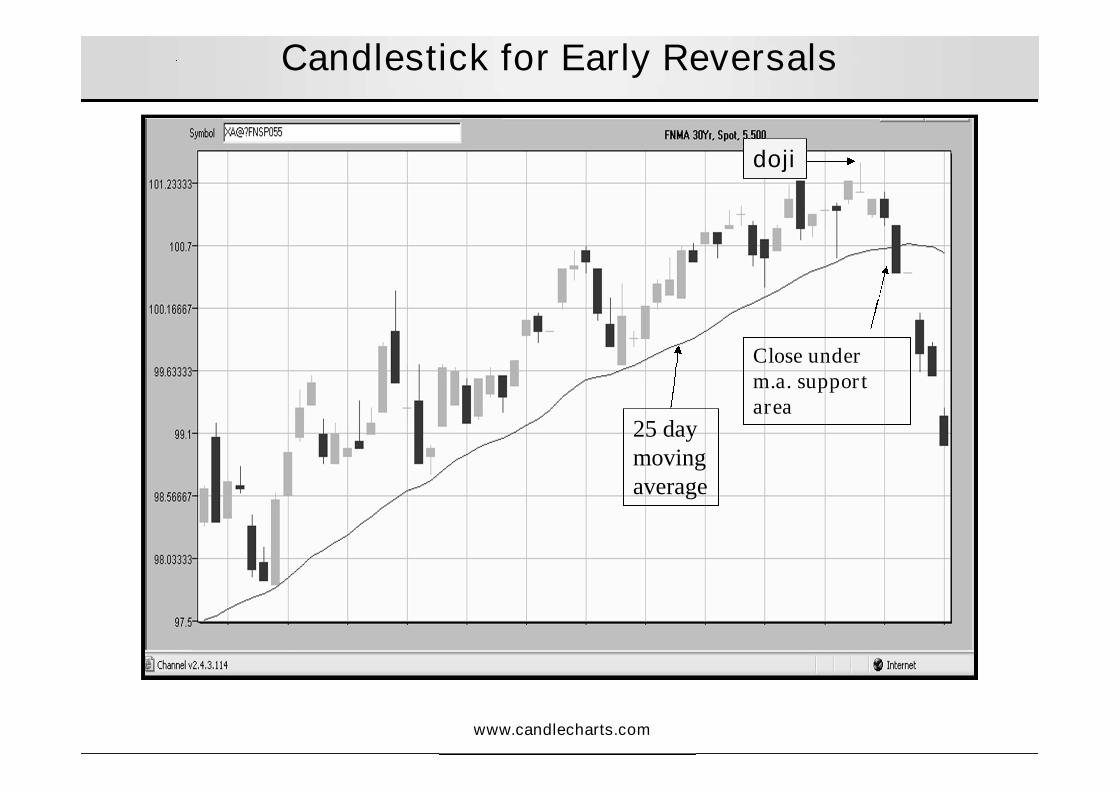
25 daymovingaverage
Close underm.a. supportarea
Candlestick for Early Reversals
doji

www.candlecharts.com
The cost of not using candles
Holding the highs verywell so looks fine
Chart courtesy of Genesis FT

www.candlecharts.com
Now what does this candle chart say?
Does the market stilllook fine?
Chart courtesy of Genesis FT
www.candlecharts.com
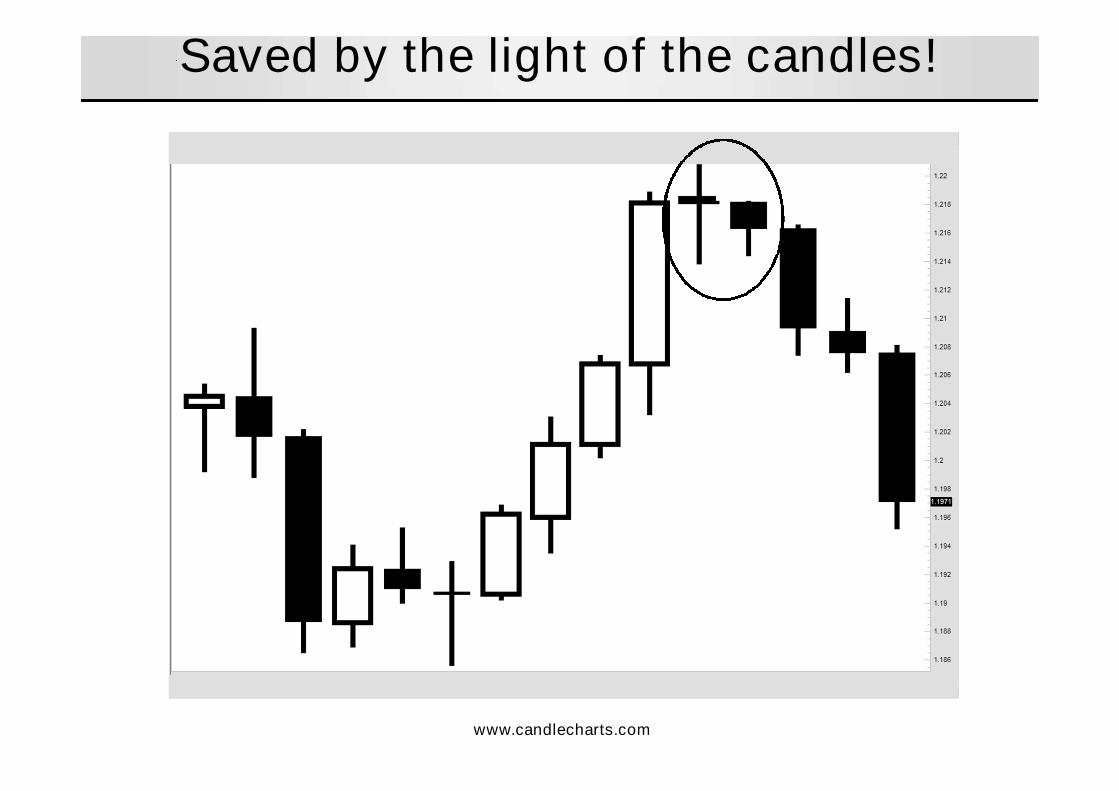
Saved by the light of the candles!

Warren Buffet’s Rules ofMoney Management
Rule 1 – Not to lose money
Rule 2 – Don’t forget rule 1

www.candlecharts.com
Saved by the light of the candles!
Those poortraders/investors whogot fooled into buyinghere.
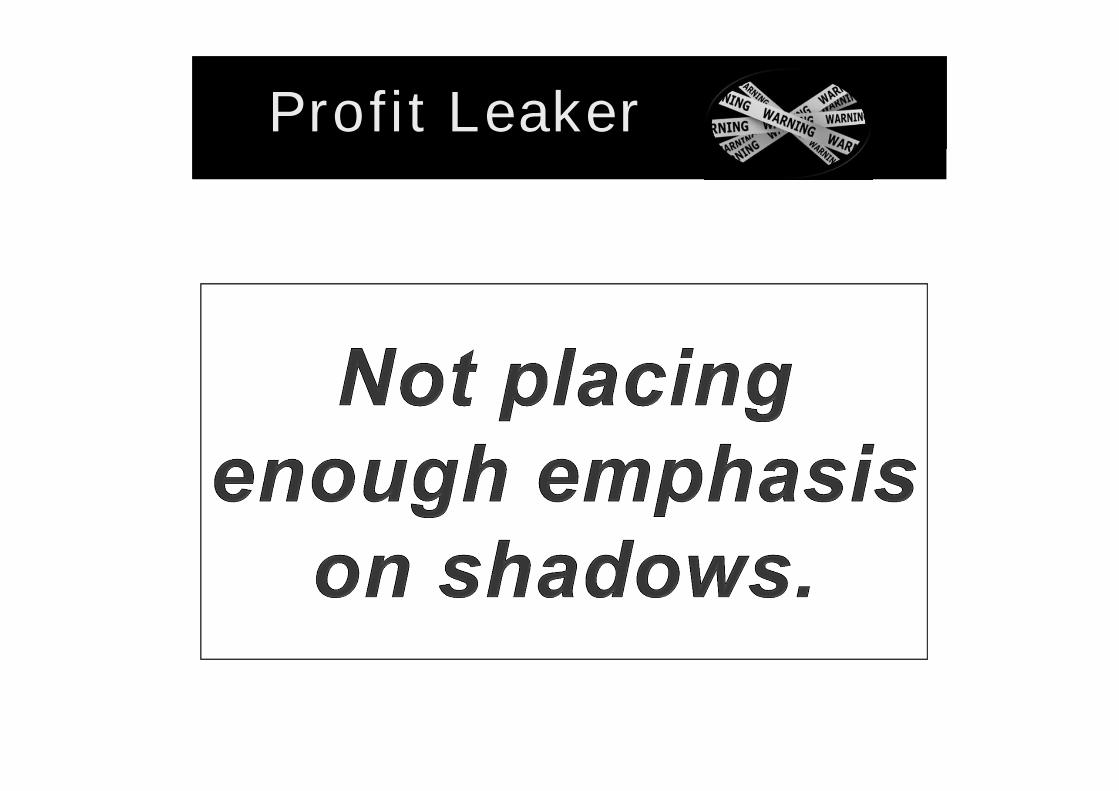
Profit Leaker
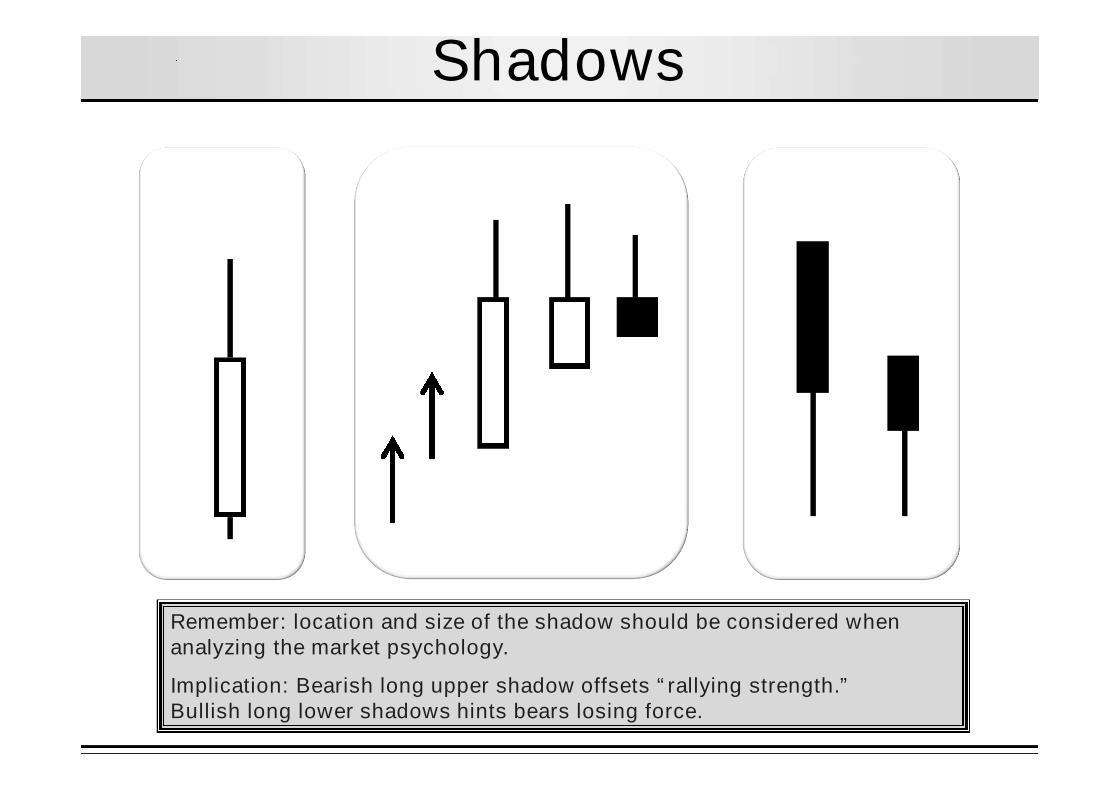
Shadows
Remember: location and size of the shadow should be considered whenanalyzing the market psychology.
Implication: Bearish long upper shadow offsets “rallying strength.”Bullish long lower shadows hints bears losing force.

www.candlecharts.com
Although this market isdescending, the longlower shadows offsetssome of the negativeoutlook
Long lower (bullish) shadows
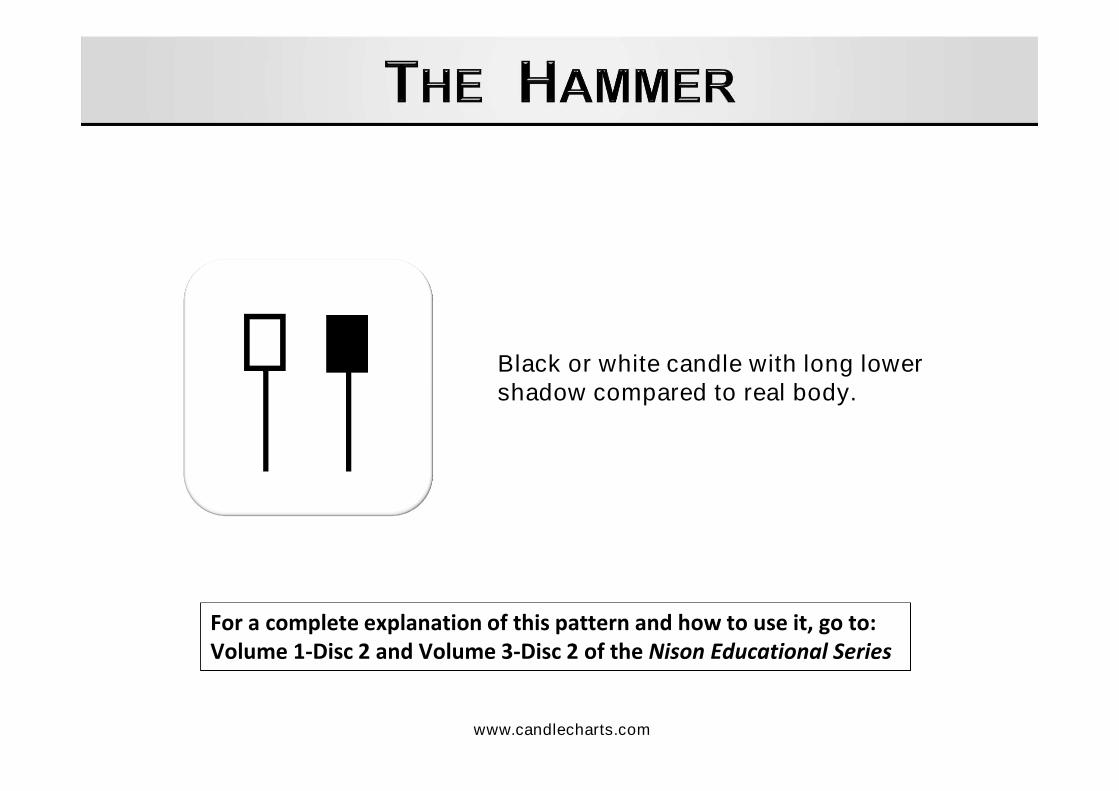
Black or white candle with long lowershadow compared to real body.
www.candlecharts.com
For a complete explanation of this pattern and how to use it, go to:Volume 1-Disc 2 and Volume 3-Disc 2 of the Nison Educational Series
www.candlecharts.com
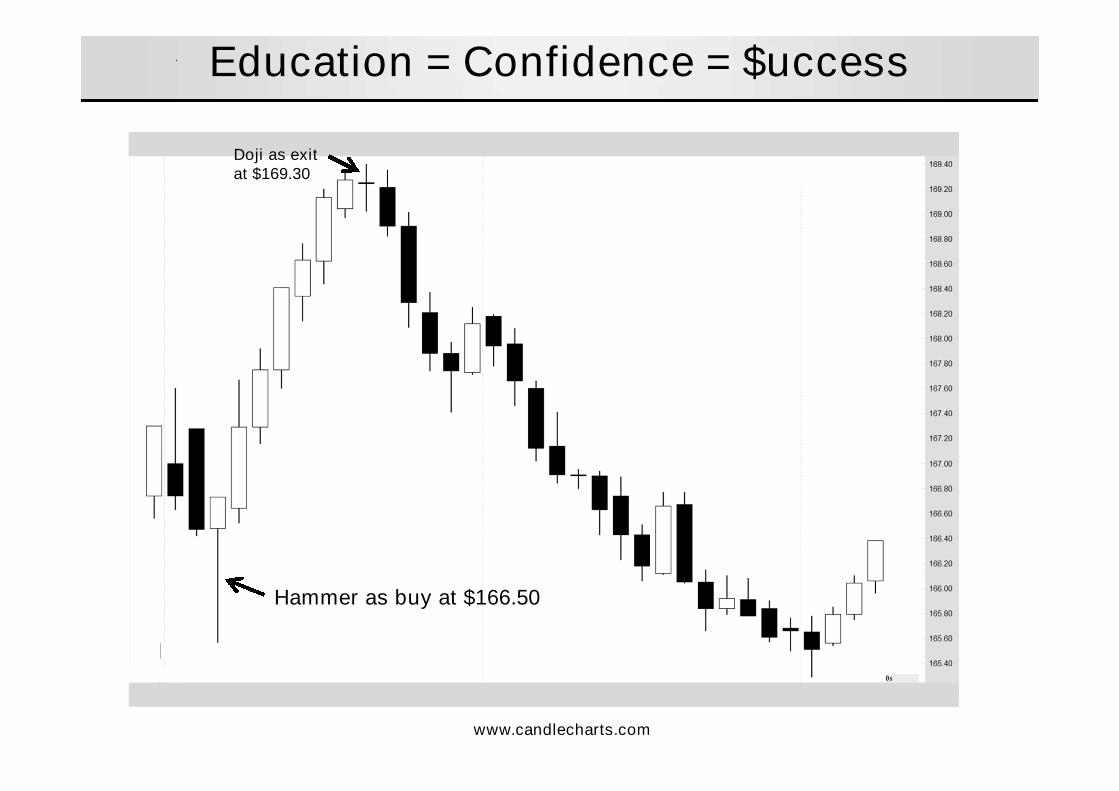
Hammer as buy at $166.50
Education = Confidence = $uccess
Doji as exitat $169.30
www.candlecharts.com
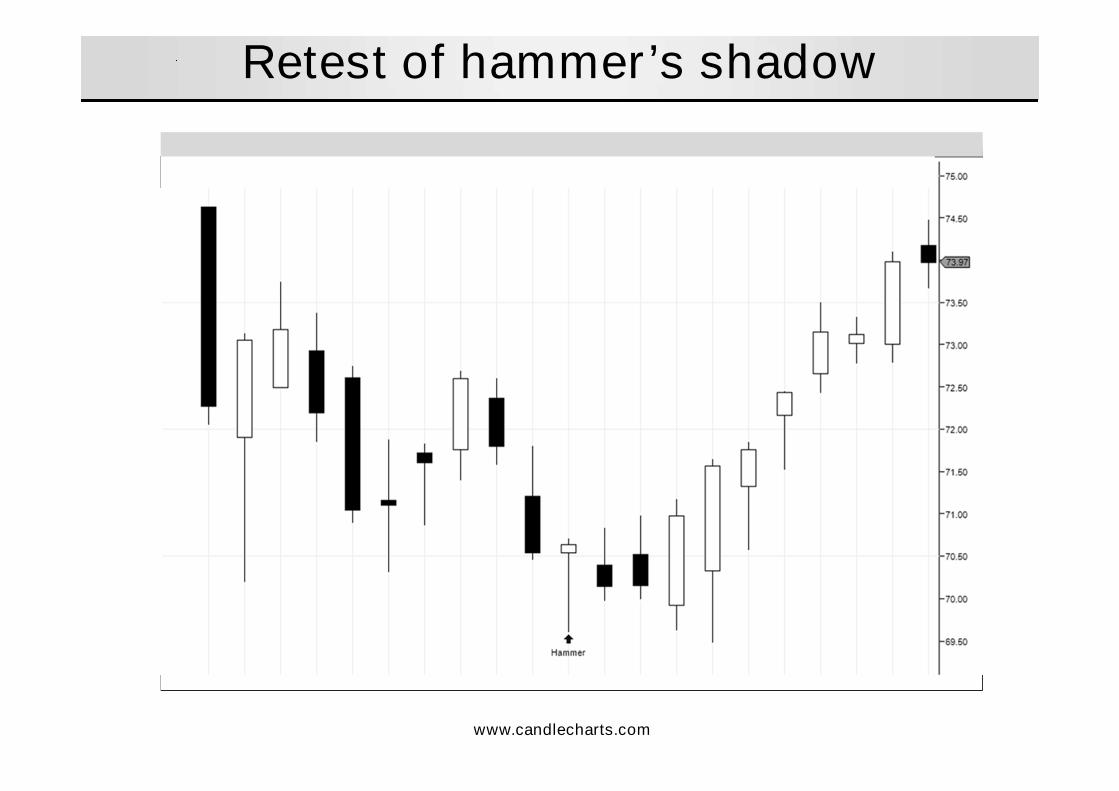
Retest of hammer’s shadow
www.candlecharts.com
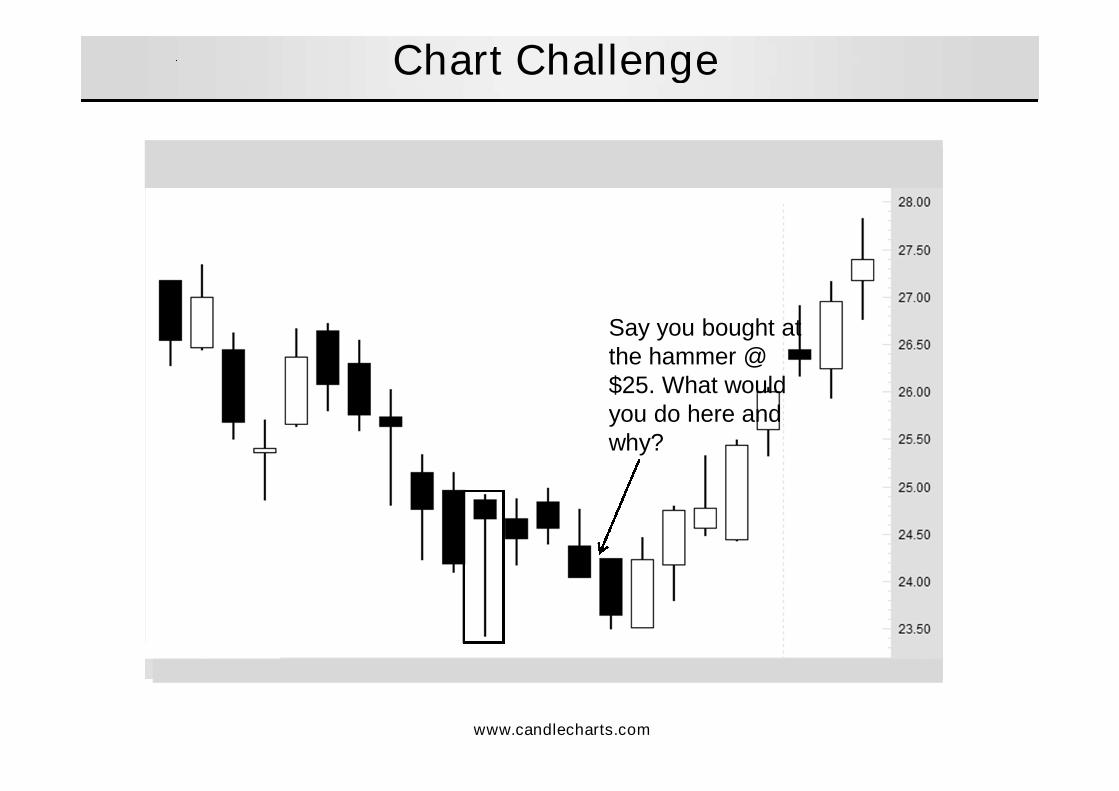
Chart Challenge
Say you bought atthe hammer @$25. What wouldyou do here andwhy?

Profit Leaker
www.candlecharts.com
“To know where you stand is as importantas candlestick pattern recognition”
www.candlecharts.comwww.candlecharts.com
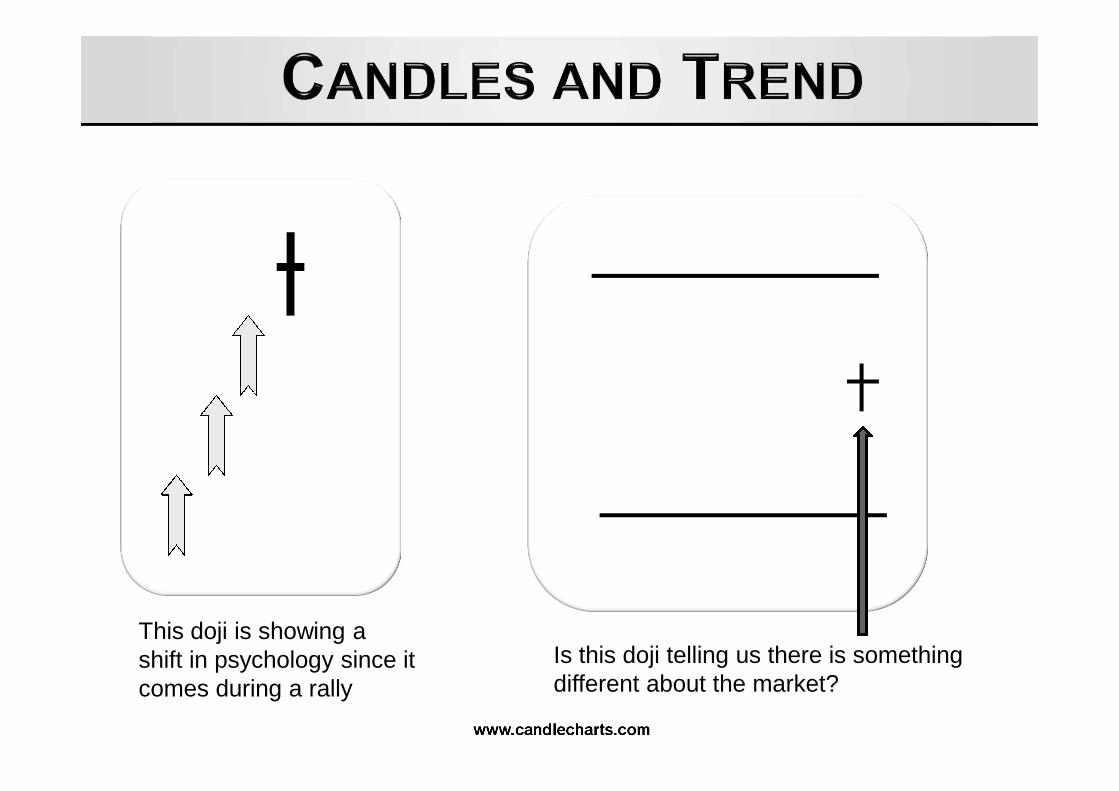
This doji is showing ashift in psychology since itcomes during a rally
Is this doji telling us there is somethingdifferent about the market?
www.candlecharts.com
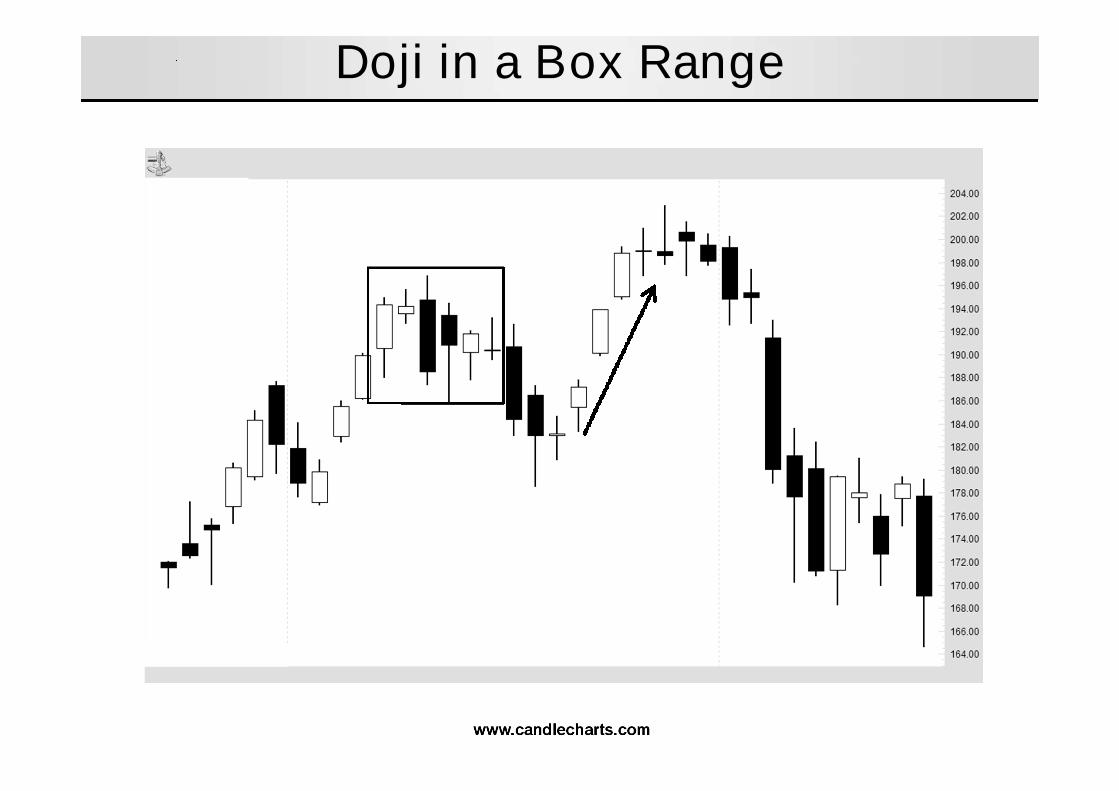
Doji in a Box Range
www.candlecharts.com

www.candlecharts.com
“Combinations of bullish and bearishcandle lines indicate the direction of themarket and investors psychologicalconflicts at important turning points.”
www.candlecharts.comwww.candlecharts.com
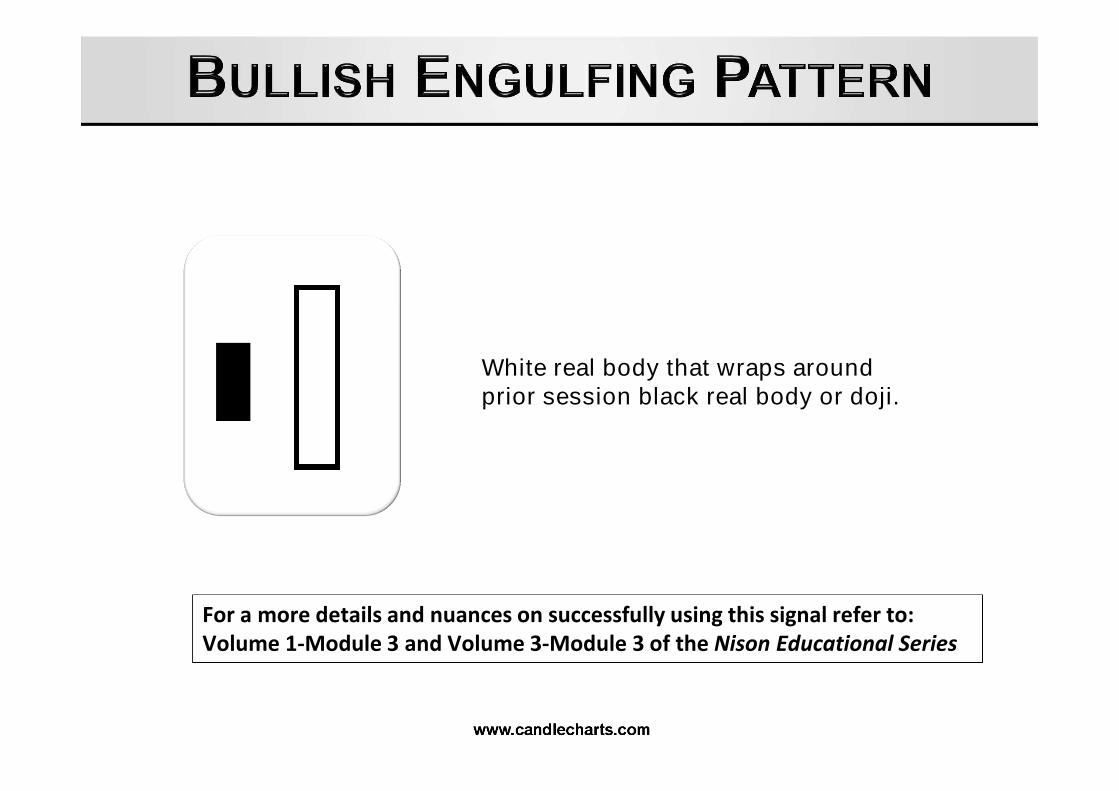
White real body that wraps aroundprior session black real body or doji.
www.candlecharts.com
For a more details and nuances on successfully using this signal refer to:Volume 1-Module 3 and Volume 3-Module 3 of the Nison Educational Series

www.candlecharts.com
Dual candlestick signals

www.candlecharts.com
Black real body wraps around priorsession white real body or doji.
For a complete explanation of this pattern and how to use it, go to:Volume 1- Module 3 and Volume 1-Module 4 of the Nison Educational Series
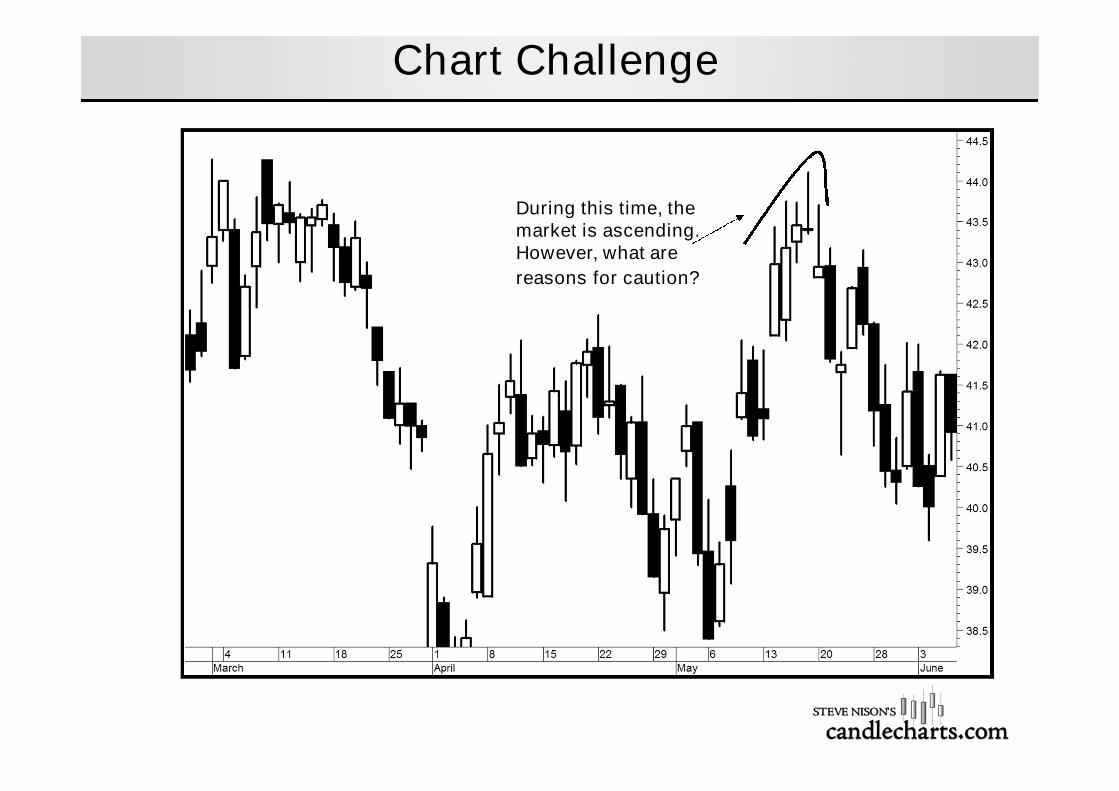
During this time, themarket is ascending.However, what are
reasons for caution?
Chart Challenge

www.candlecharts.com
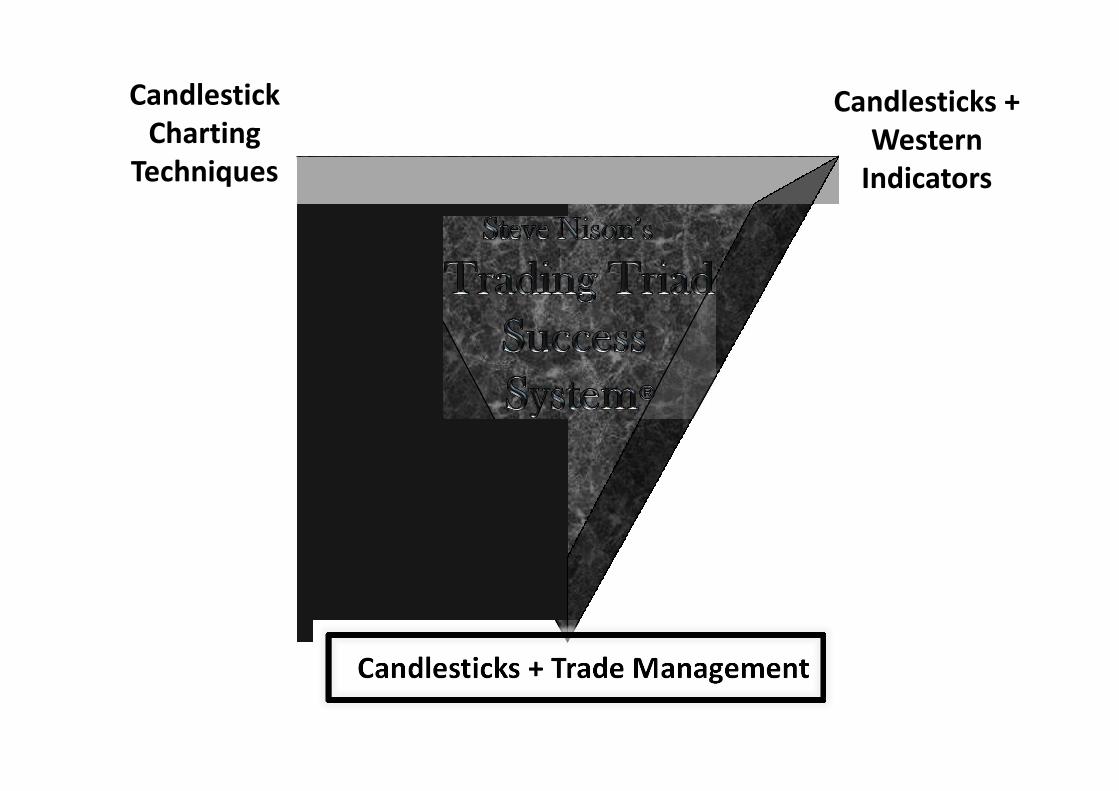
Nison Power Concept

CandlestickCharting
Techniques
Candlesticks +Western
Indicators
Candlesticks + Trade Management

East + West ConfirmationWhere a candle signal confirms a Western technical signal

EAST & WEST CONFIRMATIONEAST & WEST CONFIRMATION
Nison candles with:• Trendlines• Bollinger Bands• RSI• Stochastics• MACD• Price Patterns• Retracements• Moving Averages
Etc
Nison candles with:• Trendlines• Bollinger Bands• RSI• Stochastics• MACD• Price Patterns• Retracements• Moving Averages
Etc


Think this FX market had trouble near 91.90?

www.candlecharts.com
East + West = Higher Confidence
Hammer atSupport
CandlestickCharting
Techniques
Candlesticks +Western
Indicators
Candlesticks + Trade Management

What is one of the best ways to make money?
Those poor traderswho got fooled intobuying here.

www.candlecharts.com
Speed is the Essence of Successful Trading
Resistance zone


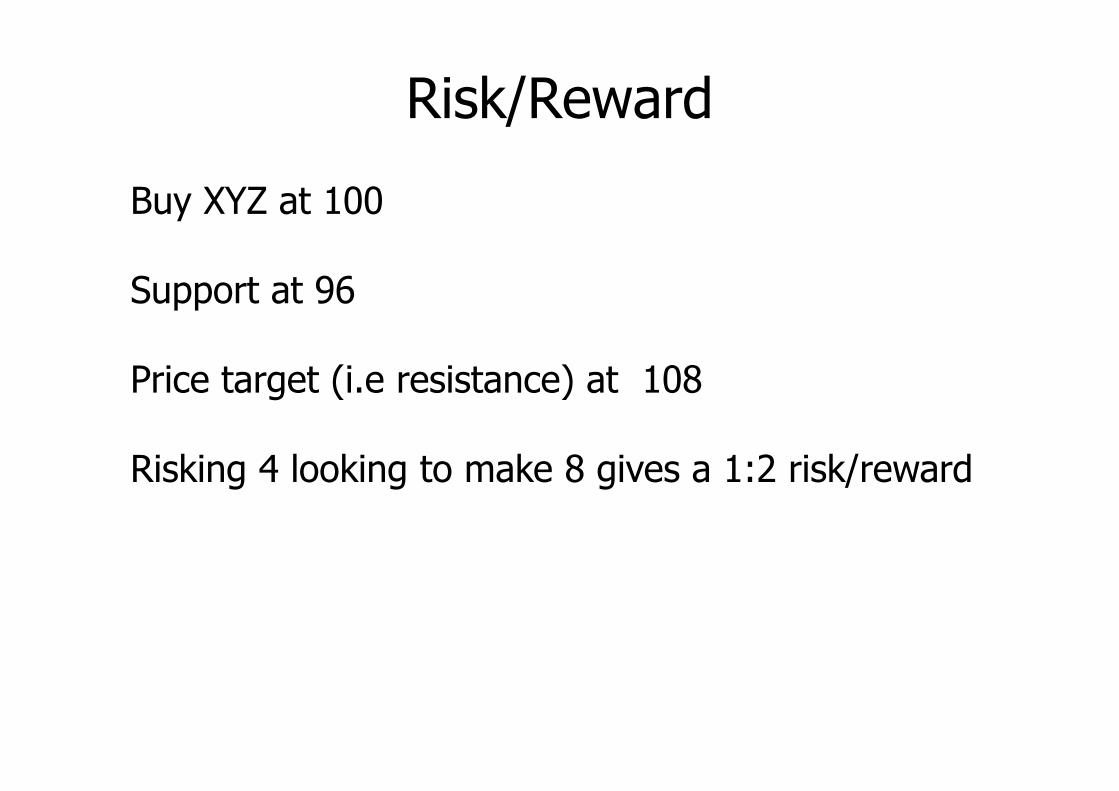
Risk/Reward
Buy XYZ at 100
Support at 96
Price target (i.e resistance) at 108
Risking 4 looking to make 8 gives a 1:2 risk/reward
www.candlecharts.com
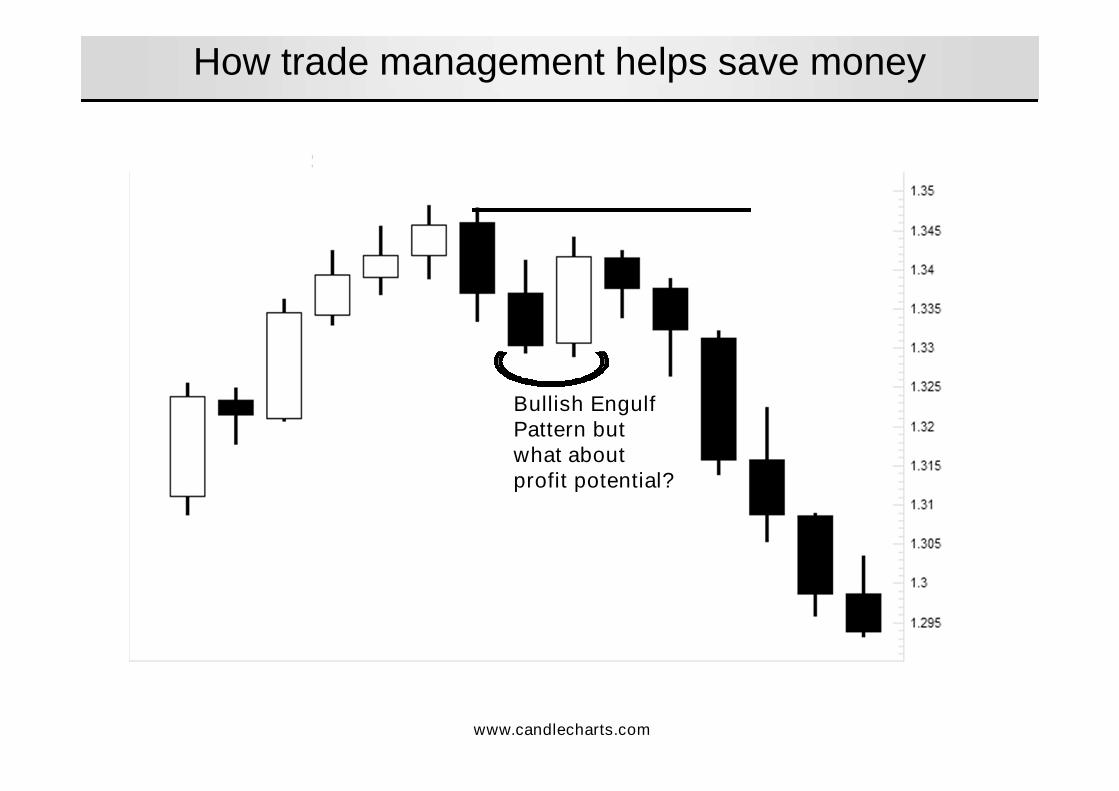
How trade management helps save money
Bullish EngulfPattern butwhat aboutprofit potential?

How trade management helps save money
• Relie on us for correct candlestick training• Benefits of candles• Anatomy of the candlestick line• Reading the market’s message• Importance of shadows• The shooting star• The hammer• The bullish engulfing pattern• The doji• How candlesticks provide “safety first” trading• The importance of “candlesticks in context”• The power of East + West• Nison Power Concepts• Trade management• Chart challenges• Candlestick Profit Leakers
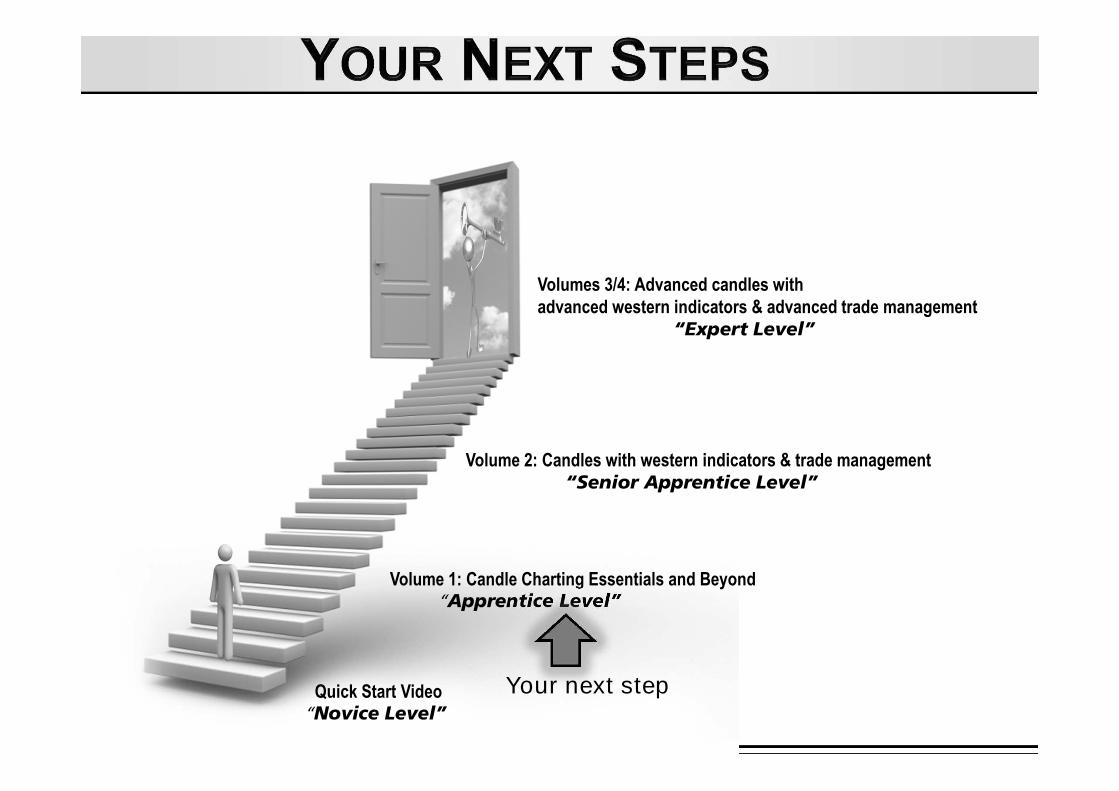
Volume 1: Candle Charting Essentials and Beyond“Apprentice Level”
Volume 2: Candles with western indicators & trade management“Senior Apprentice Level”
Volumes 3/4: Advanced candles withadvanced western indicators & advanced trade management
“Expert Level”
Quick Start Video“Novice Level”
Your next step


www.candlecharts.com


![Japanese Candlestick Charting Techniques [1991 330p S. Nison] [Trading eBook]](https://img.dokumen.tips/doc/110x75/55cf87f555034664618be125/japanese-candlestick-charting-techniques-1991-330p-s-nison-trading-ebook.jpg)
