Embed Size (px)
Citation preview
Witchcraft Beliefs as a Cultural Legacy of the
Atlantic Slave Trade: Evidence from Two Continents∗
Boris Gershman†
American University
December 2017
Abstract
This paper formally examines the hypothesis that the historic slave trade contributed
to the propagation of persistent witchcraft beliefs on both sides of the Atlantic. As docu-
mented in archival records and case studies, the Atlantic slave trade, a source of hardship for
millions of people in Sub-Saharan Africa, was commonly perceived by the locals as a form
of witchcraft, and its perpetrators were viewed as witches and cannibals. Furthermore, in
response to the rising demand for slaves, witch trials became a common vehicle of supplying
captives by condemning the accused individuals and their families to slavery. Consistent
with these narratives, we find that representatives of ethnic groups which were more heavily
exposed to the Atlantic slave trade in the past are more likely to believe in witchcraft today,
thus establishing a link between historical trauma and contemporary culture. Exploring the
role of the slave trade in cultural transmission across continents, we further show that Afro-
descendants in Latin America are substantially more likely to believe in witchcraft relative to
other racial groups. Moreover, accounting for race and other relevant factors, people residing
in regions historically more reliant on African slave labor are also more likely to be witchcraft
believers.
Keywords: Culture, Persistence, Slave trade, Superstition, Witchcraft
JEL Classification Numbers: O10, Z10, Z12, Z13
∗I thank seminar and conference participants at the 2017 ASREC conference in Boston, RHI seminar
at Wageningen University, Economic History and Development Workshop at George Mason University,
EMSCH 50th anniversary conference at Moscow State University, and NES 25th anniversary conference in
Moscow. Paul Dower, James Fenske, Nathan Nunn, and Katya Zhuravskaya contributed useful comments.
A special thanks goes to Neha Sahgal and Kelsey Jo Starr from the Pew Research Center for sharing
additional data.†Department of Economics, American University, 4400 Massachusetts Avenue NW, Washington, DC
20016-8029 (e-mail: [email protected]).
1 Introduction
Beliefs in witchcraft, broadly defined as the ability of certain people to use supernatural
techniques to cause harm or acquire wealth at the expense of others, are highly widespread
in the modern world. According to recent surveys, conducted in dozens of countries and
multiple continents over the past decade, many millions of individuals across the globe
claim to believe in witchcraft.1 Such beliefs are not simply an innocuous relic of the
past, but a cultural phenomenon that has been argued to have very real ramifications,
from impeding wealth accumulation and restricting economic mobility to eroding social
relations and inciting violence (Gershman, 2016; Forsyth, 2016).
Yet, despite the growing evidence on the heavy burden of witchcraft beliefs within
communities around the world, particularly in developing countries, our understanding of
their origins and factors contributing to their persistence remains quite limited. This paper
highlights the deep historical roots of contemporary witchcraft beliefs by showing that the
observed variation in their prevalence across Sub-Saharan Africa and Latin America can
be traced back to the Atlantic slave trade, the backbone of an extractive economic system
that was connecting these two continents for about four centuries.
The idea that the slave trade experience promoted witchcraft beliefs among affected so-
cieties in Sub-Saharan Africa is motivated by two striking patterns documented in archival
records and elaborated upon in recent work by historians and cultural anthropologists.
First, since the slave trade represented a major source of severe hardship for the majority
of affected local population, it was readily interpreted as a form of witchcraft and its perpe-
trators were labeled as witches. That is, a preexisting cultural framework of understanding
misfortune was adjusted and applied to explain the new source of evil. Importantly, the
nature of the slave trade fit right into the “zero-sum” worldview typical of witchcraft believ-
ers: the European witches and cannibals, as well as their local accomplices, were literally
enriching themselves at the expense of other people’s lives. Second, historical accounts
indicate that the rise of the Atlantic slave trade turned local witch trials into a common
vehicle for meeting the growing demand for captives, as a result of which people accused of
witchcraft were routinely sold into slavery. Naturally, such “confirmation” of the existence
of witches through regular trials and related rituals was likely to reinforce local beliefs in
witchcraft.
1This rough estimate is based on simple extrapolation of nationally-representative survey data available
from the Pew Research Center. These surveys are discussed in greater detail in the following sections.
1
In order to systematically explore the role of the Atlantic slave trade in strengthening
witchcraft beliefs across Sub-Saharan Africa, we set up an empirical framework linking
individual-level data on self-reported beliefs in witchcraft, collected by the Pew Forum of
Religion and Public Life in 2008–2009, to the ethnicity-level estimates of historical slave
exports from Nunn and Wantchekon (2011). Our analysis reveals that representatives of
ethnic groups that were more severely raided during the Atlantic slave trade era are more
likely to believe in witchcraft today. Consistent with the narrative on the direct impact
of the slave trade on the propagation of witchcraft beliefs, this main finding continues to
hold after explicitly accounting for possible indirect transmission channels and a myriad
of potentially confounding characteristics at the individual, regional, and ethnic-group
levels, such as educational attainment, local development, ethnic diversity, precolonial
institutions, and interpersonal trust. Interestingly, no significant connection exists between
the Atlantic slave trade and a whole array of other magico-religious beliefs, which points
to the special place of witchcraft beliefs in this historical context.
Beyond directly accounting for a range of important factors in our empirical analysis, we
also pursue an instrumental-variables strategy as an auxiliary way to mitigate the possible
endogeneity problem. First, following the literature on the long-term effects of African slave
trades, we employ distance to the coast from the historical ethnic homeland as a source
of plausibly exogenous variation in the intensity of slave raids. Second, in an attempt to
refine this instrument, we exploit the available data on the volume of slaves embarked by
location to calculate the distance to the closest major slave port. Both strategies reinforce
the main result and show that, if anything, our baseline estimates understate the impact
of the Atlantic slave trade on witchcraft beliefs. Overall, the mid-range estimates imply
that, other things equal, a one-standard-deviation increase in the slave exports measure is
associated with an average increase in the likelihood of believing in witchcraft by roughly
0.13-0.15 standard deviations, a non-trivial magnitude comparable, for example, to that
of the reported negative effect of the slave trade on trust (Nunn and Wantchekon, 2011).
Importantly, the fact that we are still able to observe a significant relationship between
the Atlantic slave trade, officially terminated in the nineteenth century, and contemporary
witchcraft beliefs shows that a deep historical trauma can have a very persistent effect on
people’s beliefs.
Having established the instrumental role of the Atlantic slave trade in fostering witch-
craft beliefs at the source, in Sub-Saharan Africa, the paper next turns to Latin America,
the main destination of African captives. According to numerous historical records and
ethnographic studies, witchcraft beliefs were not simply mechanically transported across
2
the ocean as part of the captives’ cultural heritage. Just like at home, they were also
actively used by the slaves to explain their unfortunate position in the unknown land
and, along with related practices and rituals, became a powerful tool of cultural resistance
against the slave owners, the newly identified witches. In a rigorous investigation of this
matter, we use survey data collected by the Pew Research Center in 2013–2014 to demon-
strate that the current distribution of witchcraft beliefs across individuals and regions in
Latin America is indeed partly reflective of the population movements and the associated
transatlantic cultural exchange during the slave trade era. Specifically, we show that Afro-
descendants in Latin America, most of whom trace their ancestry back to the Africans
brought to the continent as slaves, are substantially more likely to believe in witchcraft
compared to other racial groups, even after accounting for individual socio-demographic
characteristics, regional development, and country fixed effects. Furthermore, conditional
on race and other relevant factors, the current residents of regions located in the tropical
coastal lowlands, a geographic belt in which African slave labor was most heavily used,
are also more likely to believe in witchcraft. These findings highlight the continuity of
witchcraft beliefs across space, as well as their persistence over time through generations of
Afro-descendants and, more generally, the population of regions historically most exposed
to African slavery.
Finally, we exploit another wave of surveys, this time predominantly covering Muslim-
majority nations in Asia and the Middle East, to conduct a placebo test of the relationship
between the prevalence of witchcraft beliefs and geographic features that mattered in the
context of our Atlantic slave trade analysis. We show that in this sample, outside the
Atlantic World, the likelihood of believing in witchcraft is completely unrelated to either
distance to the coast or elevation, suggesting that the importance of these factors in the
African and Latin American cases, respectively, is indeed unique due to their connection
to the historic slave trade.
This paper fits into multiple strands of research. First, it directly relates to the growing
literature on the origins, persistence, and transmission of culture in general and long-
standing traditional beliefs, customs, and practices, in particular.2 It is the first formal
empirical study investigating the deep determinants of contemporary witchcraft beliefs
across two continents. Unlike earlier research that focused on the possible triggers of
witch trials and killings, such as weather shocks (Oster, 2004; Miguel, 2005) or religious
competition (Leeson and Russ, 2017), this paper searches for the roots of modern witchcraft
beliefs in the long history of transatlantic slave trade. In this respect, our findings are in
2Gershman (2017) provides a comprehensive review of recent studies in this field.
3
line with the studies that identify the deep factors of persistent cultural norms, attitudes,
and preferences.3 Importantly, we do not argue that witchcraft beliefs originated as a
result of slave trades, but rather view the latter as an important factor that reinforced and
contributed to the persistence of preexisting beliefs.4
Second, this paper contributes to the literature on historical development studying the
persistent impact of events from distant past on contemporary socioeconomic outcomes
(Nunn, 2014). More specifically, it adds to the subset of this literature that focuses on
the long-term effects of African slave trades, one of the crucial episodes in global history
that affected populations in multiple continents.5 In the context of Sub-Saharan Africa,
previous empirical studies have argued that, among other things, the slave trades had an
adverse effect on economic development (Nunn, 2008a), eroded interpersonal trust (Nunn
and Wantchekon, 2011), fostered the practice of polygamy (Dalton and Leung, 2014),
shaped the gender division of labor (Teso, 2016), and reduced access to finance (Pierce
and Snyder, 2017). This paper shows that the contemporary variation in the prevalence
of witchcraft beliefs may also be partly traced back to the history of slave trades which,
given the harmful implications of these beliefs for economic self-advancement and social
relations, also points to a new cultural channel through which slave trades could have
contributed to African underdevelopment.
Furthermore, this study contributes to the literature that examines the long-term con-
sequences of the Atlantic slave trade outside Africa by looking at its impact on the cultural
landscape of the New World, the main destination for captured slaves. While there is a
large body of research focusing on the long-term consequences of slavery in the Ameri-
cas on various socioeconomic outcomes including human capital accumulation, inequality,
institutions, and political attitudes,6 there is virtually no work within economics investi-
gating the cultural exchange that resulted from the massive forced relocation of people
from the African continent. This paper shows that the variation in the prevalence of
witchcraft beliefs across Latin America partly represents the legacy of this transatlantic
cultural exchange.
3Recent examples include Galor and Ozak (2016), Becker et al. (2016), and Lowes et al. (2017).4For studies rationalizing the origins and purpose of various beliefs in the supernatural see, for example,
Leeson (2014) on oracles, Gershman (2015) on the evil eye belief, and Nunn and Sanchez de la Sierra (2017)
on bulletproofing spells.5See Bertocchi (2016) and Nunn (2017) for a detailed overview of this literature.6See, among many others, Nunn (2008b), Acemoglu et al. (2012), Bruhn and Gallego (2012), Bertocchi
and Dimico (2014), and Acharya et al. (2016).
4
Finally, this paper builds on and contributes to a large body of literature in history and
anthropology on the cultural impact of the Atlantic slave trade and the deep determinants
of witchcraft beliefs. This literature, discussed in the following sections, provides case
studies that help to understand the channels connecting slave trade experiences to local
beliefs on both sides of the Atlantic. Our analysis instead represents a systematic empirical
investigation of the hypotheses suggested in the literature.
The rest of the paper is organized as follows. The following section summarizes ethno-
graphic and historical studies regarding the impact of slave trades on the propagation of
witchcraft beliefs in Africa and pins down the two main mechanisms of this influence. Sec-
tion 3 empirically explores the relationship of interest based on the data from Sub-Saharan
Africa. Section 4 investigates the cultural transmission fostered by the slave trades by
studying the prevalence of witchcraft beliefs in modern Latin America. Section 5 presents
a placebo test of the relationship between witchcraft beliefs and geography outside the
Atlantic world. Section 6 concludes.
2 Witchcraft and slave trade in African ethnography
In her detailed account of the Temne people in Northern Sierra Leone, Shaw (1997; 2002)
argues that many aspects of their culture, including witchcraft beliefs and witchfinding
practices, were shaped by the slave trade experience and may be viewed as collective
“memories” of this unique historical trauma. Upon closer examination, these “memories”
appear to have persisted not just among the Temne, but throughout the parts of Africa
affected by the Atlantic slave trade.
Historical records and ethnographic studies reveal two common patterns that help un-
derstand this tight connection between witchcraft beliefs and the slave trade. First, many
Africans perceived slave trade as a form of witchcraft through which European witches
and their local collaborators were enriching themselves at the expense of less powerful
individuals unable to protect themselves from being captured and sold across the ocean.
Second, following the rising demand for slaves, witchcraft accusations and trials became
an important tool for convicting and enslaving individuals across communities. Through
both channels, the slave trade fostered witchcraft beliefs and related practices engender-
ing a paranoid worldview that persisted over time among ethnic groups like the Temne in
Shaw’s analysis.
5
2.1 Slave trade as a form of witchcraft in a zero-sum world
One of the few well-established general facts about witchcraft beliefs is that their most di-
rect purpose is to “explain” all sorts of misfortune including sickness, death, bad harvest,
and business failure. As such, for millions of Africans, the Atlantic slave trade represented
a major source of misfortune and suffering for over four centuries. Not surprisingly, en-
slavement came to be viewed as an act of witchcraft and slave traders as witches and
cannibals. In the words of Sweet (2003), the Atlantic slave trade was “a new form of
social and economic malevolence” introduced by Europeans which severely disrupted the
life in local communities and led to wars, disease, forced migration, and other misfortunes
(pp. 162–163). In response, the victims readily applied their traditional cultural framework
for understanding evil: they interpreted the slave trade as an act of witchcraft and labeled
its enablers as witches.
One of the earliest accounts of this link appears in the work of Wyatt MacGaffey on
the Bakongo people of Central Africa who remembered the historical slave trade “as a
form of witchcraft, whereby large numbers of Africans were improperly and prematurely
transported to the other shore” (MacGaffey, 1972, pp. 54–55). The slave traders were
viewed as witches who stole souls and transfered them to their homeland conceived as
a single continent including both Europe and America (MacGaffey, 1968, pp. 174). Law
(2011) argues that such equation of the slave trade with witchcraft was common throughout
Africa, as was the stereotypical perception (reported as early as 1450s on the Gambia River)
of the European slave traders as witches consuming the souls of their victims (pp. 10–11).
As noticed by Argenti (2007), the cannibal discourse in the context of the Atlantic slave
trade was fitting since slaves sold across the ocean never returned to their homeland and
the “transshipment was every bit as terminal as death” (p. 112).
Thornton (2003) provides an interesting perspective from the viewpoint of slaves arriv-
ing in the Americas from Central Africa, citing their own testimonies as well as those of
the Jesuit priest Alonso de Sandoval. Based on years of experience meeting slaves on ships
disembarking in the port of Cartagena in the seventeenth century, the missionary could
see a clear pattern: the slaves believed that the ocean voyage was “a type of witchcraft”
in which upon arrival, “they would be made into oil and eaten” (p. 281–282). Similarly,
according to Sweet (2003), it was “widely understood that Europeans carried away black
bodies in order to “eat” them” (p. 162). The witnesses and victims of the slave trade
developed vivid images of the different stages of this deeply disturbing practice in which
“Europeans used their hidden powers to enslave Africans and commodify their bodies for
their own enrichment” (p. 162):
6
For Central Africans, crossing kalunga (the Atlantic Ocean) in slave ships rep-
resented a premature death at the hands of witches, who nourished themselves
on black bodies in the land of the dead (the Americas). The “profits” from
these black bodies were then returned to Africa in a variety of trade goods.
Cooking oil was believed to be pressed from African flesh. The red wines that
Portuguese traders sold were said to be the blood of their African victims. Eu-
ropean cheeses were African brains. And gunpowder was thought to be the
ashen residue of African bones that were burned by Europeans.
Hawthorne (2010) echoes this narrative in his study of Upper Guinea adding that, although
coastal communities widely viewed slave traders as witches or cannibals, they were com-
pelled to cooperate since those who “failed to sate the hunger of white witches for black
bodies risked being consumed” (p. 96).
Interestingly, it is not just the Europeans, but also local chiefs involved in and profiting
from the slave trade who were commonly seen as witches and cannibals. According to
Thornton (2003), in seventeenth-century West Central Africa witches were commonly found
and were particularly dangerous among those in a position of power including European
and African rulers, slave traders, and merchants in general. Likewise, Argenti (2007)
points out that, in the Cameroon Grassfields, even though the elite class was unlikely
to be subject to direct witchcraft accusations, the “whole social stratum of slave traders
and labor recruiters” could nevertheless be identified as the “true source of cannibalism
in the polity” (p. 116–117). De Rosny (1985), a French Jesuit priest who also conducted
fieldwork in Cameroon, explains that suspicions of witchcraft were commonly directed at
the local leaders during the slave trade era, since in the “anguished times of the slave traffic,
certain chiefs had served as intermediaries, entering into negotiations to supply whites with
compatriots and reap a profit” (p. 61). He directly links the experience of slave trade to
the most popular type of sorcery beliefs (ekong) in his area of study which essentially refers
to enslavement via an act of witchcraft.
Austen (1993) places the relationship between the slave trade and witchcraft beliefs
into a broader discourse on the economic and social setting of which such beliefs are
symptomatic. In his words, the export of slaves from Africa “provides the major historical
reference for the equation of capital accumulation, zero-sum economics, and witchcraft”
(p. 100). Indeed, the view of slave traders as cannibals and witches enriching themselves at
the expense of the majority of local population fits perfectly the zero-sum worldview typical
for witchcraft believers. As succinctly formulated by Hawthorne (2010), “Europeans and
7

Eurafricans turned people into profit – slaves into tobacco, alcohol, cloth, and other things
– which was witchcraft par excellence” (p. 88).
Warnier (1995) puts the connections between the slave trade and witchcraft beliefs
among the Duala and the Bamileke of Cameroon in a broader context of African history.
According to him, witchcraft beliefs, known as kong and famla’, respectively, among these
two peoples, are “based on and developed by the disappearances due to the slave trade,
the wealth of the slave-traders and their agents during the period of the slave trade, on
the mortality in the plantations and the wealth of recruiting agents and chiefs during the
colonial period, on the inequalities experienced in illness and death, and the ostentatious
fortunes of the big men in the public service and in business in the independent state”
(p. 269). Similarly, Shaw (2002) underscores the continuity of the idea of “cannibalistic
trade” into the colonial era and argues that “in the Sierra Leone hinterland, Atlantic stories
that Europeans devoured slaves and sacrificed them to their God were reconfigured during
the legitimate trade through accusations that chiefs and traders devoured, sacrificed, and
made their dependents into medicines” (p. 246). Thus, the “memories” of cannibalism dur-
ing the Atlantic slave trade era “formed a lens through which the predatory and extractive
relationships of the legitimate trade could be evaluated.”
2.2 Witchcraft trials and accusations as tools of enslavement
Ironically, those same people who viewed the slave trade as an act of witchcraft were
themselves in danger of being accused of witchcraft and sold into slavery as a punishment.
As the abundant historical evidence indicates, the rising demand for slaves turned witch
trials into a ubiquitous tool of “producing” new captives.
There were several ways to capture and sell people into slavery during the era of the
Atlantic slave trade (Nunn, 2017). The two major channels included, first, wars or slave
raids resulting in kidnappings and, second, trials that determined guilt for various offenses
including theft, murder, inability to pay back debts, adultery, treason, and, importantly,
witchcraft. Hawthorne (2010) paints a detailed picture of how witchcraft trials played
a crucial role in producing slaves in the coastal areas of Upper Guinea. He points out
that, in contrast to raids and wars aimed at outside communities, trials were recognized as
legitimate internal affairs and “resulted in community members condemning one of their
own to enslavement” (p. 81). Among all the transgressions for which a person could be
charged, witchcraft was one the most serious crimes. Hawthorne cites available historical
records of the Europeans in Upper Guinea regarding practices of enslaving the accused
witches and their relatives. The latter were very common, as, in the words of Francisco
8
de Lemos Coelho, a Portuguese observer writing in 1684, there was “no lack of witches
in the land” (p. 83). Manuel Alvares, a Portuguese missionary writing in the early 17th
century describes a typical trial by poison ordeal as a result of which convicted witches
and their immediate kin were sold to slave traders as punishment. Hawthorne speculates
that “as the number of ships arriving in Bissau and Cacheu increased and as coastal
groups stepped up the production of slaves to garner imports after 1750, the frequency of
witchcraft accusations and trials increased as well” (p. 87).
Further south on West Africa’s Atlantic coast, in Northern Sierra Leone, witchcraft
trials were similarly a common method of enslaving local population (Shaw, 2002). Shaw
cites the late 18th century records of John Matthews, an agent for an English slave-trading
firm, who notes that slaves, apart from those taken as prisoners of war, were often “sold
for witchcraft, and other real, or imputed, crimes” and “purchased in the country with
European goods and salt” (p. 215). Matthews provides the details of witchfinding practices
in Sierra Leone via the divinatory interrogation of the corpse pointing out that witchcraft
trials frequently resulted in the enslavement of both the accused and their family if the
“deceased were a great man, and the accused poor” (p. 216). Shaw goes beyond by
pointing out that witchcraft trials blossomed during the era of the Atlantic slave trade
and the associated ritual practices persisted over time, despite their gradual “decoupling”
from enslavement, following the Anti-Slave-Trade Act of 1807.7 Finally, Shaw emphasizes
that the “development of witchfinding as the ritual production of slaves for the Atlantic
trade” was only one part of the nexus between witchcraft and slave trade. In line with the
discussion in the preceding section, she reminds of the other side of the story: “the very
imagery of witchcraft as the wrongful “eating” of people provided counterrepresentations
through which those who profited from the ritual conviction of witches were implicitly
recognized as the biggest witches of all” (p. 223).
Moving even further south, witchcraft accusations in Angola were effectively used in
supplying slaves. Ferreira (2012) cites several specific examples of Africans sold to slave
traders following such accusations. Interestingly, he also cites the local authorities in
the 18th century Benguela that acknowledged the widespread use of witchcraft accusations
following someone’s death as “a way of robbing and enslaving one another” (p. 75). Vansina
(2005), also based on Angolan experience, offers similar description and suggests that trial
by ordeal was often involved since death was commonly attributed to witchcraft and the
7Shaw cites a diary of a nineteenth-century English traveler who witnessed an investigation into the
sudden death of a young girl. He comments that a possibility was raised regarding the death resulting
from witchcraft and “had the slave trade existed, some unfortunate individual might have been accused
and sold into captivity” (p. 218).
9
culpable witch was detected through divination. Astonishingly, he argues that enslavement
was essentially an inevitable outcome of a witchcraft trial by ordeal: “If the accused died,
a number of his relatives were enslaved and sold, and if the accused was innocent, the
same number of the ‘family’ of the accuser underwent this fate” (p. 12). Gustafsson (2005)
relies on the observations from the Finnish missionary Rautanen in the late-nineteenth-
century Ovamboland, split between today’s Angola and Namibia, where de facto slave
trade was monopolized by the local kings and continued well after its de jure abolition by
the Portuguese. Rautanen remarked that “witchcraft accusations were the most common
vehicle used by King Kambonde and Chief Nehale for seizing people” (p. 46). Furthermore,
Gustafsson argues that the increased intensity of witch trials was directly linked to the
increasing demand for slaves and the growth of trade with Europeans which reinforced the
system of extracting slaves from local communities via “continuous witchcraft accusations”
(p. 58).
Further historical evidence on the active use of witch trials and accusations as a way to
generate slaves also comes from other African regions exposed to the Atlantic slave trade
including Cameroon (Warnier, 1995; Argenti, 2007), Calabar (Fyfe, 1960), the Cross River
area (Roschenthaler, 2006), Guinea (Hair, 1998), the Bight of Biafra (Nwokeji, 2010), the
kingdom of Kongo (Harms, 1981; Young, 2007; Heywood, 2009), and Zambia (Hinfelaar,
2007).8 Thus, clearly, witch trials were a common vehicle for supplying slaves across Sub-
Saharan Africa, and their expansion in response to the rising demand for captives could
have been a prominent factor reinforcing witchcraft beliefs among affected populations.
The historical narrative paints a rather convincing picture linking the rise of the Atlantic
slave trade to the propagation of witchcraft beliefs. In fact, if culture is persistent and
transmitted relatively intact across generations, the consequences of the slave trade shock
could still be seen in contemporary data. The following section provides a rigorous empirical
investigation of this proposition.
8In her study on slave settlements in the Cross River area, Roschenthaler (2006) notes that the slaves
were feared by the free villagers because they “were known for their knowledge of strong ‘medicines’ and
powerful magic” (p. 78). In their view, since slaves had been sold by their own people, they must have
committed crimes or possessed destructive witchcraft powers. This observation suggests that witchcraft
convictions were taken seriously by the local population. As will be discussed in section 4, the same was
also true for some of the slave owners in the New World.
10
3 Evidence from Sub-Saharan Africa
Our investigation begins in Sub-Saharan Africa, where millions of people were captured,
sold into slavery, and transported to the Americas between the 15th and 19th centuries. As
argued in the previous section, this experience likely reinforced local beliefs in witchcraft
and contributed to their persistence. Hence, we link the variation in contemporary preva-
lence of witchcraft beliefs across Africa to the differential historical exposure of various
ethnic groups to the slave trade.
3.1 Data
The baseline dataset employed in this first part of our analysis relies largely on a series
of surveys conducted by the Pew Forum on Religion and Public Life between December
2008 and April 2009 in nineteen countries of Sub-Saharan Africa.9 Although the original
intent of these surveys was to investigate the religious landscape of Sub-Saharan Africa
with specific focus on Islam and Christianity, the questionnaires covered a wide range of
issues including people’s adherence to traditional beliefs and practices and their views on
social and political issues.
Among other things, the surveys contain information on witchcraft beliefs. Following
Gershman (2016), we combine two (yes or no) questions to construct the baseline indi-
cator of witchcraft beliefs corresponding to the broad definition used in the introduction.
The first question simply asks whether a respondent believes in “witchcraft,” without any
clarification, whereas the second question features the belief that “certain people can cast
curses or spells that cause bad things to happen to someone.” Thus, the former question
leaves the notion of witchcraft vague and open to interpretation, while the latter captures
more precisely the relevant concept of causing harm via supernatural means.10 To mini-
mize potential for measurement error, we thus define self-proclaimed witchcraft believers
as individuals who reply “yes” to at least one of the above questions. Such believers con-
9These are: Botswana, Cameroon, Chad, Democratic Republic of the Congo (DRC), Djibouti, Ethiopia,
Ghana, Guinea-Bissau, Kenya, Liberia, Mali, Mozambique, Nigeria, Rwanda, Senegal, South Africa,
Tanzania, Uganda, and Zambia. Rwanda and South Africa effectively drop out from the main em-
pirical analysis since the key data on the ethnicity of respondents are absent in these two cases. See
http://www.pewforum.org/datasets for more details.10As discussed in Gershman (2016), the survey inaccurately refers to the description in the second
question as the “evil eye” belief which is actually a very different cultural phenomenon reflecting the fear
of the uncontrollable supernatural destructive power of envious glances (Gershman, 2015).
11
stitute 57% of the full sample of 19 countries, with national-level prevalence rate ranging
from 32% in Ethiopia to over 96% in Tanzania.
The Pew Forum surveys also contain information on basic sociodemographic character-
istics, as well as the region of residence and self-reported ethnicity of respondents.11 The
latter is particularly important since estimates of slave exports, our main explanatory vari-
able capturing the exposure to historical slave trades, are available at the ethnic-group level
(Nunn and Wantchekon, 2011). Our matching of respondents’ ethnicities in the baseline
survey to the slave exports dataset, which adopts the classification from Murdock’s (1959)
map of African ethnic homelands, resulted in more than 300 unique groups.12 Nunn and
Wantchekon (2011) provide estimates of slave exports by century and distinguish between
the Atlantic and Indian Ocean trades. As a starting point, we use their preferred measure,
defined as log(1 + exports/area), which normalizes the total number of slaves exported
between 1400 and 1900 by the area of respective ethnic homelands as shown on Murdock’s
map.
3.2 Empirical framework
Our baseline specification relates individual-level beliefs in witchcraft to the ethnicity-level
measure of slave exports, conditional on a range of potentially confounding characteristics:
witchi,e,r,c = αc + β slave expe + X′eB + X′i,e,r,cΓ + X′r,cΩ + εi,e,r,c.
Here, the binary outcome variable witchi,e,r,c captures whether individual i belonging to
an ethnic group e and residing in region r of country c believes in witchcraft or not,
and slave expe reflects the intensity of slave exports for ethnic group e. Control variables
at the ethnic, individual, and regional levels are represented by vectors X′e, X′i,e,r,c, and
X′r,c, respectively. Finally, αc reflects the presence of country fixed effects and εi,e,r,c is
the individual-level idiosyncratic component. The model is estimated via ordinary least
squares (OLS), with standard errors clustered at both ethnic and regional levels.13
We start with the most parsimonious specification which includes the main variables of
interest, country fixed effects, as well as individual’s gender, age and its square. We then
supplement the model with further sociodemographic characteristics, namely religion, ed-
11Regions of residence mostly correspond to the first-level subnational administrative units, with 188 of
them in the original sample of nineteen countries and 174 after excluding South Africa and Rwanda.12With a few adjustments, this matching also connects our dataset to the Ethnographic Atlas (Murdock,
1967) containing useful information on precolonial characteristics of ethnic groups.13Maximum likelihood estimation of equivalent probit specifications yields very similar results.
12
ucation, poverty indicator, household size, and urban location dummy.14 These additional
individual-level controls are endogenous and may in fact represent some of the channels
through which the history of slave trades affected the current prevalence of witchcraft be-
liefs. For instance, previous studies linked the slave trade experience to both lower incomes
(Nunn, 2008a) and lower levels of human capital (Obikili, 2016). Despite this issue, we
include these “bad controls” in our analysis to see whether slave trades still matter after
conditioning on the respective transmission channels.
Since data on slave exports are available for ethnic groups, control variables at this level
of analysis are particularly important. We largely follow Nunn and Wantchekon (2011) in
specifying the list of potential confounders. Most crucially, the intensity of slave trades
is plausibly correlated with the subsequent colonial rule experience and its determinants.
In particular, European influence during the relevant time frame could have affected the
prevalence and persistence of witchcraft beliefs through channels other than slave trade.
To address these issues, we first control for historical characteristics that arguably affected
the colonization process and resulting institutions, namely measures of early development
and disease environment (Acemoglu et al., 2005).
In order to capture precolonial prosperity, we employ two variables from the Ethno-
graphic Atlas, namely historical settlement pattern (an ordinal scale, ranging from nomadic
to sophisticated permanent settlements) and an index of political centralization (jurisdic-
tional hierarchy beyond local community), both of which have been viewed as measures
of early societal complexity (Murdock and Provost, 1973).15 Furthermore, we introduce
an indicator for predominant reliance on agriculture as a mode of subsistence, which has
been argued to have long-term beneficial impact on individual welfare (Michalopoulos et
al., 2016). In addition, we control for the historical presence of slavery in society, which
could have facilitated slave exports and has also been linked to important local environ-
mental characteristics (Fenske, 2013). Disease environment is proxied by the average value
of the malaria stability index within the relevant ethnic homeland based on the data from
14Religion is represented by four aggregate categories: Christian, Muslim, traditional, and unaffiliated.
An overwhelming majority of respondents identify themselves as either Muslims or Christians, with 1.78%
of the sample claiming to follow traditional/animist religion and 2.21% unaffiliated. There are three
educational categories: completed primary or less, some secondary or completed secondary, post-secondary
and higher. Poverty indicator is equal to zero, if the respondent reports insufficient money to buy food,
health care, or clothing. See Appendix A for detailed definitions of all variables.15Hawthorne (2010) argues that the level of political centralization directly affected the susceptibility of
societies to slave trade, based on his research on Upper Guinea. On the other hand, Whatley (2014) argues
that the direction of causality goes the other way, that is, the slave trade experience affected precolonial
African institutions as measured by the structure of political authority.
13
Kiszewski et al. (2004). Beyond affecting the choice of the colonizers to settle in a particular
area, susceptibility to malaria could have also affected the prevalence of witchcraft beliefs
since these are often invoked to explain illness, including malaria (Muela et al., 1998).
Furthermore, as recently shown by Esposito (2016), captives from malaria-ridden regions
of Africa were more valued by slave traders, which could have differentially affected the
exposure of ethnic groups to slave raids.
In addition to these determinants of colonial rule, we also use three ethnic-homeland-
level variables to directly measure some of the European influence beyond the slave trades:
an indicator for the presence of a colonial railway line, an indicator for the intersection with
a historical travel route of major European explorers, and the number of early-twentieth-
century Christian missions per square kilometer.
Our final set of control variables are constructed at the region-of-residence level. First,
we control for the average land suitability for agriculture as an important exogenous factor
of early development and a contributor to current prosperity level. An additional mea-
sure of regional development is nighttime luminosity per capita, with the recognition, as
earlier, that this a “bad control” potentially reflecting a channel through which historical
slave trade may have affected the prevalence of witchcraft beliefs. Second, we control for
regional index of ethnolinguistic fractionalization using the subnational diversity dataset of
Gershman and Rivera (2016b).16 As argued by Nunn (2008a) and Whatley and Gillezeau
(2011), slave trades may have contributed to increased ethnic fractionalization, yet an-
other possible factor influencing cultural beliefs in African regions. Finally, motivated by
the studies connecting weather shocks to witch trials (Oster, 2004; Miguel, 2005), we in-
troduce two additional regional controls: a measure of rainfall anomaly in the two-year
period preceding the surveys and a measure of spatial variability in temperature.
3.2.1 Baseline results
Table 1 shows the estimation results, from the most parsimonious specification in column
1 to those including groups of individual, ethnic, and regional controls in columns 2–5.17
Column 6 includes region-of-residence rather than country fixed effects and, obviously,
omits regional controls. The top row of the table displays the estimates of interest sug-
gesting that, across specifications, our measure of the overall intensity of slave exports at
16We use the standard ELF index based on the most detailed list of ethnolinguistic groups. Picking
diversity indices constructed for larger linguistic families does not qualitatively affect the reported results.17Specification in column 3 is identical to that in column 2, but is estimated on a restricted sample
corresponding to columns 4–6.
14
the ethnic-group level is positively and significantly related to contemporary prevalence of
witchcraft beliefs. In addition, column 2 reveals significant sociodemographic correlates of
witchcraft beliefs. As expected, more educated and wealthy individuals are less likely to
believe in witchcraft. On the other hand, people who claim to follow traditional/animist
religion are more likely to be witchcraft believers than Christians, Muslims, or unaffiliated.
The coefficient estimate on slave exports is somewhat diminished after inclusion of addi-
tional individual-level controls in column 2, which is consistent with the idea that religion,
education, and wealth may represent specific channels through which slave trades may
have affected witchcraft beliefs.18 Note also that people living in urban areas are more
likely to believe in witchcraft, although the coefficient loses statistical significance after
controlling for regional-level characteristics. Finally, age and gender are only significant
in the simplest specification in column 1, perhaps reflecting their correlation with more
immediately relevant factors, such as educational attainment and wealth.
Interestingly, none of the control variables at the ethnic group or regional levels, intro-
duced in columns 4 and 5, are statistically significant, while the coefficient on slave exports
remains virtually unchanged relative to its value in column 2. In other words, it does not
appear that these characteristics bias the relationship of interest. This result supports
the notion that slave trades may have directly contributed to the prevalence and persis-
tence of witchcraft beliefs through channels pinpointed in section 2 based on historical
and ethnographic evidence. Column 6 represents perhaps the most stringent specification
which includes fixed effects corresponding to 171 subnational regions in the sample. Here,
the estimates of interests are based on within-region cross-ethnicity variation in the expo-
sure to historical slave trade. This, in particular, alleviates the concern that our previous
estimates reflect the impact of slave trades on regions and point to intergenerationally
transmitted cultural influence of this historic shock at the ethnic group level.
As is well-established in the literature, there were substantial differences between At-
lantic and Indian Ocean slave trades. Importantly, although the latter was in place earlier
than the former, the overall scale of the Atlantic slave trade was much greater. Nunn
(2008a) cites the estimates, according to which approximately 12 million (surviving) slaves
were exported from Africa during the Atlantic slave trade, whereas the Indian, Red Sea,
and trans-Saharan trades altogether involved 6 million individuals.19 These distinctions
18The decline in the coefficient estimate in column 2 is almost entirely due to the introduction of controls
rather than reduced sample size relative to column 1.19For ethnicities in our baseline sample, the estimates from Nunn and Wantchekon (2011) suggest the
totals of around 9.2 and 0.68 million slaves exported during Atlantic and Indian Ocean slave trades,
respectively, between 1400 and 1900.
15
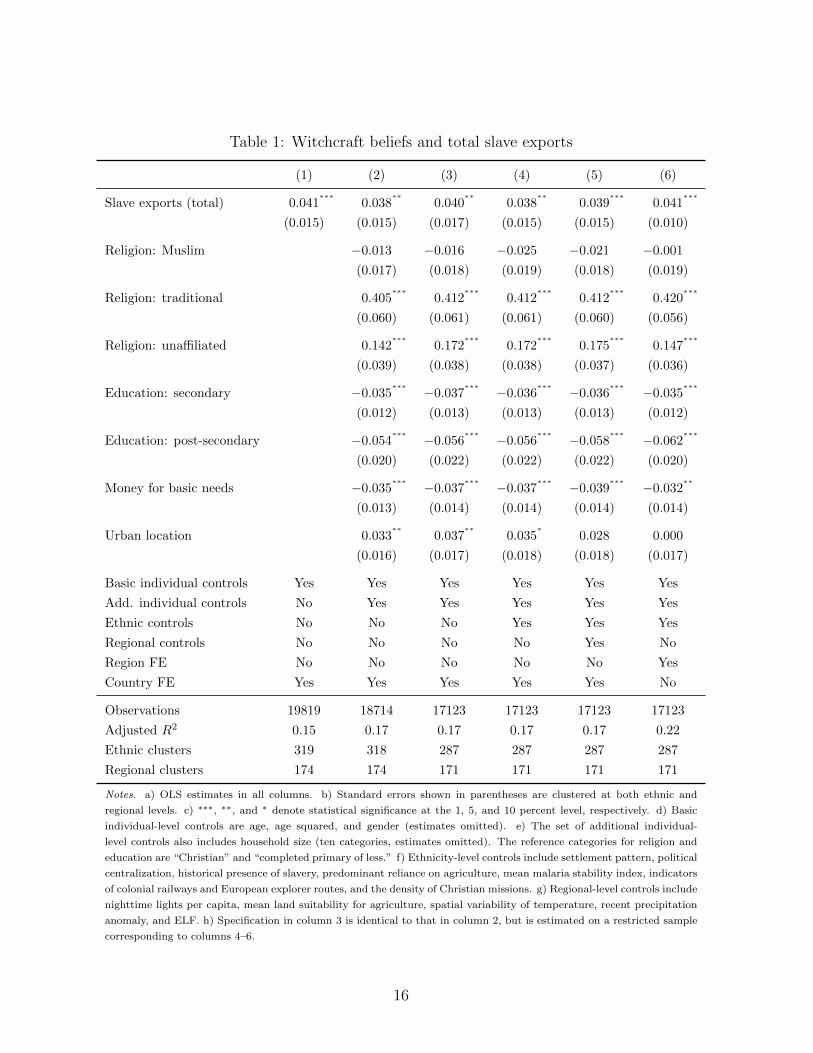
Table 1: Witchcraft beliefs and total slave exports
(1) (2) (3) (4) (5) (6)
Slave exports (total) 0.041∗∗∗
0.038∗∗
0.040∗∗
0.038∗∗
0.039∗∗∗
0.041∗∗∗
(0.015) (0.015) (0.017) (0.015) (0.015) (0.010)
Religion: Muslim −0.013 −0.016 −0.025 −0.021 −0.001
(0.017) (0.018) (0.019) (0.018) (0.019)
Religion: traditional 0.405∗∗∗
0.412∗∗∗
0.412∗∗∗
0.412∗∗∗
0.420∗∗∗
(0.060) (0.061) (0.061) (0.060) (0.056)
Religion: unaffiliated 0.142∗∗∗
0.172∗∗∗
0.172∗∗∗
0.175∗∗∗
0.147∗∗∗
(0.039) (0.038) (0.038) (0.037) (0.036)
Education: secondary −0.035∗∗∗ −0.037
∗∗∗ −0.036∗∗∗ −0.036
∗∗∗ −0.035∗∗∗
(0.012) (0.013) (0.013) (0.013) (0.012)
Education: post-secondary −0.054∗∗∗ −0.056
∗∗∗ −0.056∗∗∗ −0.058
∗∗∗ −0.062∗∗∗
(0.020) (0.022) (0.022) (0.022) (0.020)
Money for basic needs −0.035∗∗∗ −0.037
∗∗∗ −0.037∗∗∗ −0.039
∗∗∗ −0.032∗∗
(0.013) (0.014) (0.014) (0.014) (0.014)
Urban location 0.033∗∗
0.037∗∗
0.035∗
0.028 0.000
(0.016) (0.017) (0.018) (0.018) (0.017)
Basic individual controls Yes Yes Yes Yes Yes Yes
Add. individual controls No Yes Yes Yes Yes Yes
Ethnic controls No No No Yes Yes Yes
Regional controls No No No No Yes No
Region FE No No No No No Yes
Country FE Yes Yes Yes Yes Yes No
Observations 19819 18714 17123 17123 17123 17123
Adjusted R2 0.15 0.17 0.17 0.17 0.17 0.22
Ethnic clusters 319 318 287 287 287 287
Regional clusters 174 174 171 171 171 171
Notes. a) OLS estimates in all columns. b) Standard errors shown in parentheses are clustered at both ethnic and
regional levels. c) ∗∗∗, ∗∗, and ∗ denote statistical significance at the 1, 5, and 10 percent level, respectively. d) Basic
individual-level controls are age, age squared, and gender (estimates omitted). e) The set of additional individual-
level controls also includes household size (ten categories, estimates omitted). The reference categories for religion and
education are “Christian” and “completed primary of less.” f) Ethnicity-level controls include settlement pattern, political
centralization, historical presence of slavery, predominant reliance on agriculture, mean malaria stability index, indicators
of colonial railways and European explorer routes, and the density of Christian missions. g) Regional-level controls include
nighttime lights per capita, mean land suitability for agriculture, spatial variability of temperature, recent precipitation
anomaly, and ELF. h) Specification in column 3 is identical to that in column 2, but is estimated on a restricted sample
corresponding to columns 4–6.
16
may have important implications for the results, as shown in previous studies. For instance,
only Atlantic slave trades appear to affect both the rates of polygamy and attitudes to gen-
der roles in contemporary Africa (Teso, 2016), consistent with the biased preferences for
male versus female slaves in the two trades.20
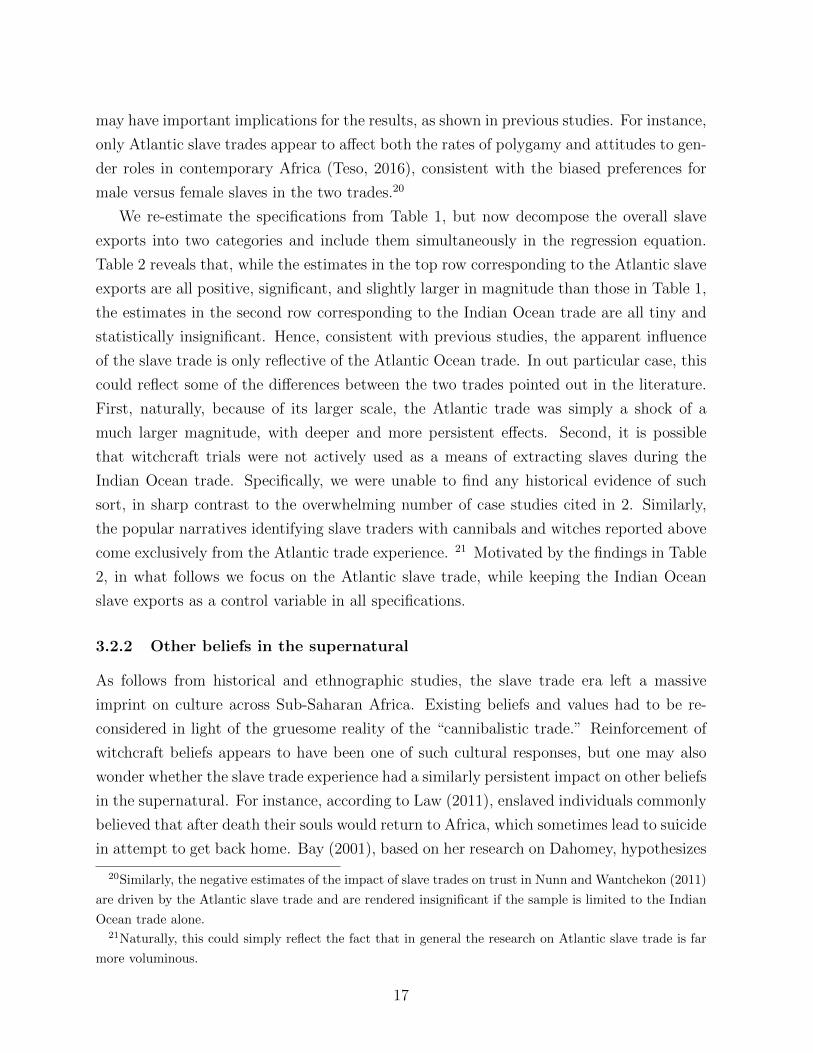
We re-estimate the specifications from Table 1, but now decompose the overall slave
exports into two categories and include them simultaneously in the regression equation.
Table 2 reveals that, while the estimates in the top row corresponding to the Atlantic slave
exports are all positive, significant, and slightly larger in magnitude than those in Table 1,
the estimates in the second row corresponding to the Indian Ocean trade are all tiny and
statistically insignificant. Hence, consistent with previous studies, the apparent influence
of the slave trade is only reflective of the Atlantic Ocean trade. In out particular case, this
could reflect some of the differences between the two trades pointed out in the literature.
First, naturally, because of its larger scale, the Atlantic trade was simply a shock of a
much larger magnitude, with deeper and more persistent effects. Second, it is possible
that witchcraft trials were not actively used as a means of extracting slaves during the
Indian Ocean trade. Specifically, we were unable to find any historical evidence of such
sort, in sharp contrast to the overwhelming number of case studies cited in 2. Similarly,
the popular narratives identifying slave traders with cannibals and witches reported above
come exclusively from the Atlantic trade experience. 21 Motivated by the findings in Table
2, in what follows we focus on the Atlantic slave trade, while keeping the Indian Ocean
slave exports as a control variable in all specifications.
3.2.2 Other beliefs in the supernatural
As follows from historical and ethnographic studies, the slave trade era left a massive
imprint on culture across Sub-Saharan Africa. Existing beliefs and values had to be re-
considered in light of the gruesome reality of the “cannibalistic trade.” Reinforcement of
witchcraft beliefs appears to have been one of such cultural responses, but one may also
wonder whether the slave trade experience had a similarly persistent impact on other beliefs
in the supernatural. For instance, according to Law (2011), enslaved individuals commonly
believed that after death their souls would return to Africa, which sometimes lead to suicide
in attempt to get back home. Bay (2001), based on her research on Dahomey, hypothesizes
20Similarly, the negative estimates of the impact of slave trades on trust in Nunn and Wantchekon (2011)
are driven by the Atlantic slave trade and are rendered insignificant if the sample is limited to the Indian
Ocean trade alone.21Naturally, this could simply reflect the fact that in general the research on Atlantic slave trade is far
more voluminous.
17
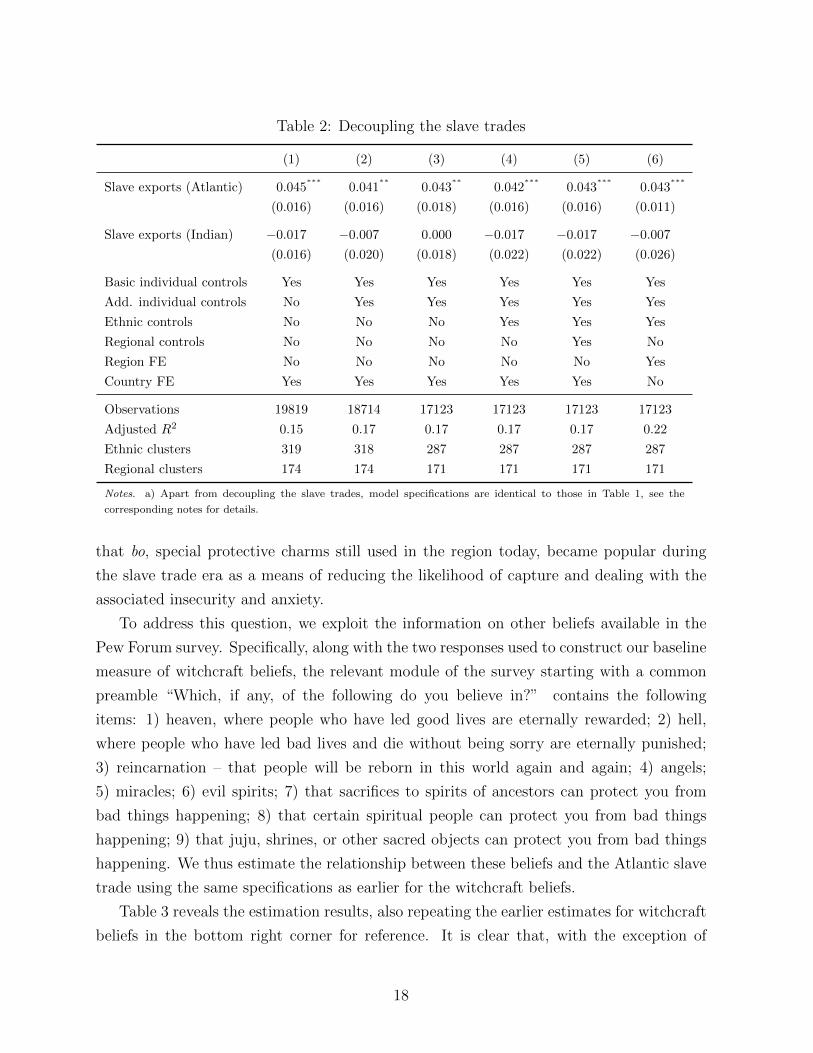
Table 2: Decoupling the slave trades
(1) (2) (3) (4) (5) (6)
Slave exports (Atlantic) 0.045∗∗∗
0.041∗∗
0.043∗∗
0.042∗∗∗
0.043∗∗∗
0.043∗∗∗
(0.016) (0.016) (0.018) (0.016) (0.016) (0.011)
Slave exports (Indian) −0.017 −0.007 0.000 −0.017 −0.017 −0.007
(0.016) (0.020) (0.018) (0.022) (0.022) (0.026)
Basic individual controls Yes Yes Yes Yes Yes Yes
Add. individual controls No Yes Yes Yes Yes Yes
Ethnic controls No No No Yes Yes Yes
Regional controls No No No No Yes No
Region FE No No No No No Yes
Country FE Yes Yes Yes Yes Yes No
Observations 19819 18714 17123 17123 17123 17123
Adjusted R2 0.15 0.17 0.17 0.17 0.17 0.22
Ethnic clusters 319 318 287 287 287 287
Regional clusters 174 174 171 171 171 171
Notes. a) Apart from decoupling the slave trades, model specifications are identical to those in Table 1, see the
corresponding notes for details.
that bo, special protective charms still used in the region today, became popular during
the slave trade era as a means of reducing the likelihood of capture and dealing with the
associated insecurity and anxiety.
To address this question, we exploit the information on other beliefs available in the
Pew Forum survey. Specifically, along with the two responses used to construct our baseline
measure of witchcraft beliefs, the relevant module of the survey starting with a common
preamble “Which, if any, of the following do you believe in?” contains the following
items: 1) heaven, where people who have led good lives are eternally rewarded; 2) hell,
where people who have led bad lives and die without being sorry are eternally punished;
3) reincarnation – that people will be reborn in this world again and again; 4) angels;
5) miracles; 6) evil spirits; 7) that sacrifices to spirits of ancestors can protect you from
bad things happening; 8) that certain spiritual people can protect you from bad things
happening; 9) that juju, shrines, or other sacred objects can protect you from bad things
happening. We thus estimate the relationship between these beliefs and the Atlantic slave
trade using the same specifications as earlier for the witchcraft beliefs.
Table 3 reveals the estimation results, also repeating the earlier estimates for witchcraft
beliefs in the bottom right corner for reference. It is clear that, with the exception of
18
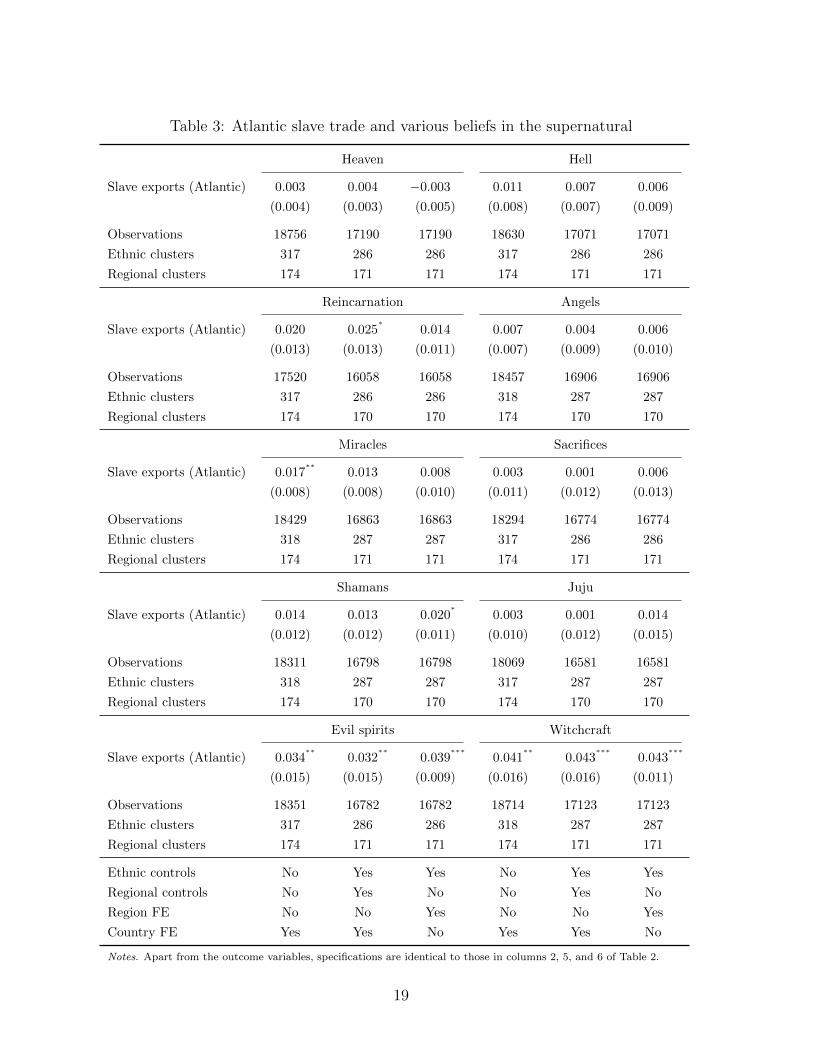
Table 3: Atlantic slave trade and various beliefs in the supernatural
Heaven Hell
Slave exports (Atlantic) 0.003 0.004 −0.003 0.011 0.007 0.006
(0.004) (0.003) (0.005) (0.008) (0.007) (0.009)
Observations 18756 17190 17190 18630 17071 17071
Ethnic clusters 317 286 286 317 286 286
Regional clusters 174 171 171 174 171 171
Reincarnation Angels
Slave exports (Atlantic) 0.020 0.025∗
0.014 0.007 0.004 0.006
(0.013) (0.013) (0.011) (0.007) (0.009) (0.010)
Observations 17520 16058 16058 18457 16906 16906
Ethnic clusters 317 286 286 318 287 287
Regional clusters 174 170 170 174 170 170
Miracles Sacrifices
Slave exports (Atlantic) 0.017∗∗
0.013 0.008 0.003 0.001 0.006
(0.008) (0.008) (0.010) (0.011) (0.012) (0.013)
Observations 18429 16863 16863 18294 16774 16774
Ethnic clusters 318 287 287 317 286 286
Regional clusters 174 171 171 174 171 171
Shamans Juju
Slave exports (Atlantic) 0.014 0.013 0.020∗
0.003 0.001 0.014
(0.012) (0.012) (0.011) (0.010) (0.012) (0.015)
Observations 18311 16798 16798 18069 16581 16581
Ethnic clusters 318 287 287 317 287 287
Regional clusters 174 170 170 174 170 170
Evil spirits Witchcraft
Slave exports (Atlantic) 0.034∗∗
0.032∗∗
0.039∗∗∗
0.041∗∗
0.043∗∗∗
0.043∗∗∗
(0.015) (0.015) (0.009) (0.016) (0.016) (0.011)
Observations 18351 16782 16782 18714 17123 17123
Ethnic clusters 317 286 286 318 287 287
Regional clusters 174 171 171 174 171 171
Ethnic controls No Yes Yes No Yes Yes
Regional controls No Yes No No Yes No
Region FE No No Yes No No Yes
Country FE Yes Yes No Yes Yes No
Notes. Apart from the outcome variables, specifications are identical to those in columns 2, 5, and 6 of Table 2.
19

witchcraft beliefs and beliefs in evil spirits in the bottom panel of the table, none of the
superstitions listed in Table 3 is robustly related to historical slave exports.22 Thus, it
appears that witchcraft beliefs (and the tightly related beliefs in evil spirits) are a special
element of local culture in terms of being related to the slave trade experience. This is
consistent with the narratives about the special role of witchcraft trials as a vehicle of
producing slaves and the reliance of local populations on witchcraft beliefs as a framework
to interpret misfortunes resulting from the slave trade.
3.3 Witchcraft, mistrust, and the slave trade
In their seminal study, Nunn and Wantchekon (2011) have shown that higher intensity of
historical slave trades directly contributed to persistently lower levels of trust across ethnic
groups in Sub-Saharan Africa, consistent with the idea that mistrust was a useful norm
which permitted to stay relatively safe during the dangerous times of slave raids. More
recently, Gershman (2016) demonstrates that the local prevalence of witchcraft beliefs in
Sub-Saharan Africa is negatively associated with trust and various indicators of prosocial
behavior, possibly reflecting the formation of antisocial attitudes due to the fears of be-
witchment and witchcraft accusations. The present investigation has so far argued that
contemporary variation in the prevalence of witchcraft beliefs in Sub-Saharan Africa repre-
sents in part a cultural legacy of the Atlantic slave trade. This triad of interrelated results
raises two natural questions. First, is trust a yet-unaccounted-for important omitted vari-
able that could explain the connection between witchcraft beliefs and slave trade? Second,
is the propagation of witchcraft beliefs a possible transmission channel in the relationship
between mistrust and slave trade? In other words, to what extent are witchcraft beliefs
and mistrust two distinct outcomes of the slave trades rather than mediating channels?
To address the first question, we introduce trust as an additional individual-level control
variable. The are two relevant items in the Pew Forum survey, one of which is the standard
“generalized trust” question while the other captures trust in people of other religion. The
first trust indicator equals unity, if a respondent believes that “most people can be trusted,”
and the second indicators equals unity, if the respondent “generally trusts people who have
different religious values.” Table 4 demonstrates that the inclusion of either measure of
trust (top and bottom panels, respectively) does not have any noticeable impact on the
coefficient of interest relating Atlantic slave trade and witchcraft beliefs. Thus, it does not
22Significant results for beliefs in evil spirits are not surprising since these are strongly related to
witchcraft beliefs. The correlation coefficient is equal to 0.61 for individual responses and goes up to
0.88 for the regional prevalence of these beliefs in the relevant sample.
20
Table 4: Witchcraft beliefs and the Atlantic slave trade: controlling for trust
(1) (2) (3) (4) (5) (6)
Slave exports (Atlantic) 0.038∗∗
0.038∗∗
0.035∗∗
0.035∗∗
0.034∗∗∗
0.034∗∗∗
(0.017) (0.017) (0.016) (0.016) (0.012) (0.012)
Trust (generalized) −0.014 −0.007 0.004
(0.014) (0.015) (0.014)
Observations 17674 17674 15364 15364 15364 15364
Ethnic clusters 316 316 285 285 285 285
Regional clusters 174 174 171 171 171 171
(7) (8) (9) (10) (11) (12)
Slave exports (Atlantic) 0.043∗∗∗
0.043∗∗∗
0.039∗∗
0.039∗∗
0.040∗∗∗
0.039∗∗∗
(0.016) (0.016) (0.016) (0.016) (0.011) (0.011)
Trust (other religion) −0.031∗∗ −0.031
∗∗ −0.019∗
(0.013) (0.013) (0.012)
Observations 18715 18715 16268 16268 16268 16268
Ethnic clusters 319 319 287 287 287 287
Regional clusters 174 174 171 171 171 171
Basic individual controls Yes Yes Yes Yes Yes Yes
Add. individual controls No No Yes Yes Yes Yes
Ethnic controls No No Yes Yes Yes Yes
Regional controls No No Yes Yes No No
Region FE No No No No Yes Yes
Country FE Yes Yes Yes Yes No No
Notes. Apart from controlling for individual trust, specifications in even-numbered columns are identical to those in
columns 1, 5, and 6 of Table 2. Specifications in odd-numbered columns provide reference estimates for cases when
individual trust is not accounted for.
seem to be the case that the depletion of trust due to the slave trade experience explains
our main result so far.
Next, we mimic the setup in Nunn and Wantchekon (2011) to see whether it is the
prevalence of witchcraft beliefs that mediates the relationship between trust and slave
trades.23 We expand the dataset used in their study, namely the third round of the Afro-
23Note that such an exercise can be done based solely on the Pew Forum data using the two available
trust questions as outcome variables. In that analysis, slave exports are insignificant, although the point
estimates have the “correct” negative sign. This contrast with the original results could be due, among
other things, to the differences in trust measures and the lists of countries covered by the Pew Forum and
Afrobarometer surveys.
21
barometer (2005–2006), to include two subsequent rounds, the fourth (2008–2009) and the
fifth (2011–2013), in order to increase both the sample size and the number of regions, for
which the data on the prevalence of witchcraft beliefs are available from the Pew Forum
surveys. The latter is especially important since the data on individual-level witchcraft
beliefs are absent in the Afrobarometer surveys.
We explore three questions that capture interpersonal trust (in relatives, neighbors, and
acquaintances) and three questions capturing trust in institutions (police, courts, and local
council). Unlike binary measures from the Pew Forum surveys, the Afrobarometer codes
the responses to each trust question on the ordinal 0–3 scale, from “not at all” to “a lot.”
We set up the regression equations the same way as earlier and use the sociodemographic
individual-level controls that are closest to the metrics used above: age, age squared,
gender, religion (5 categories), education (10 categories), urban location dummy, and two
proxies for wealth, namely employment status (four categories) and living conditions (five
categories). In addition to country fixed effects, the Afrobarometer regressions also include
dummies for survey rounds.
The results are reported in Table 5. First, consistent with Nunn and Wantchekon (2011)
and Gershman (2016), trust is negatively related both to slave exports (with the exception
of trust in acquaintances) and the regional prevalence of witchcraft beliefs. Second, in all
six cases, controlling for regional witchcraft beliefs has only a minuscule impact on the
coefficient estimates on slave exports.
Overall, the findings in this section imply that, rather than being mediating channels,
mistrust and witchcraft beliefs largely represent distinct parts of the long-term cultural
legacy of the Atlantic slave trade, a bundle of mutually reinforcing antisocial beliefs and
attitudes.
3.3.1 The IV strategy
Earlier analysis shows that the positive relationship between exposure to the Atlantic
slave trade and witchcraft beliefs is quite robust to the inclusion of plausibly relevant
control variables at different levels of observation. Still, there could be certain unobservable
omitted characteristics that bias our results. In addition, if extracting slaves from societies
with widespread witchcraft beliefs was easier, a variation of a reverse-causality argument
could be made under the assumption of long-term cultural persistence.24 Finally, it is
24For example, higher historical prevalence of witchcraft beliefs could have facilitated slave extraction via
witch trials. Note, however, that, if witchcraft beliefs reinforce mistrust (Gershman, 2016), the opposite
is likely to be true, that is, cautious mistrustful societies should be less susceptible to raids.
22

Table 5: Trust and the Atlantic slave trade: controlling for witchcraft beliefs
Relatives Neighbors Acquaintances
(1) (2) (3) (4) (5) (6)
Slave exports (Atlantic) −0.044∗∗∗ −0.041
∗∗ −0.048∗∗ −0.045
∗∗ −0.012 −0.007
(0.017) (0.016) (0.019) (0.018) (0.021) (0.019)
Witchcraft (region) −0.393∗∗∗ −0.458
∗∗∗ −0.449∗∗
(0.096) (0.147) (0.185)
Observations 41454 41454 28806 28806 29393 29393
Adjusted R2 0.12 0.12 0.17 0.17 0.15 0.15
Ethnic clusters 193 193 185 185 186 186
Regional clusters 136 136 133 133 136 136
Police Courts Local council
(7) (8) (9) (10) (11) (12)
Slave exports (Atlantic) −0.033∗∗ −0.030
∗∗ −0.048∗∗∗ −0.045
∗∗∗ −0.060∗∗∗ −0.057
∗∗∗
(0.015) (0.015) (0.014) (0.014) (0.012) (0.011)
Witchcraft (region) −0.404∗∗∗ −0.378
∗∗∗ −0.344∗∗∗
(0.145) (0.120) (0.101)
Observations 40690 40690 39816 39816 39790 39790
Adjusted R2 0.19 0.19 0.10 0.10 0.14 0.14
Ethnic clusters 193 193 193 193 193 193
Regional clusters 136 136 136 136 136 136
Notes. a) OLS estimates in all columns. b) Standard errors shown in parentheses are clustered at both ethnic and
regional levels. c) ∗∗∗, ∗∗, and ∗ denote statistical significance at the 1, 5, and 10 percent level, respectively. d) All
specifications include the full set of individual, ethnic, and regional controls, along with country and survey round
fixed effects. Basic individual-level controls are age, age squared, gender, education, employment status, religion, and
living conditions. Slave exports in the Indian Ocean trade are controlled for in all specifications. The other controls
are exactly the same as the ones listed in the notes to Table 1. e) The outcome variables are measured on the ordinal
0–3 scale.
important to keep in mind that the estimates of slave exports are likely to be imprecise,
and this measurement error could bias our baseline estimates downward. In order to
address these issues, in this section we use an instrumental variables strategy suggesting
two possible sources of conditionally exogenous variation in the intensity of slave trade.
First, following the literature on slave trades going back to Nunn and Wantchekon
(2011), we measure the distance from the centroid of each ethnic group’s historical home-
land to the coastline and use this variable as an instrument for slave exports. As widely
documented in historical narratives, slave raids generally proceeded from the coast toward
the inland part of the continent, in order to minimize transportation and other costs for
23
slave traders. Second, as an alternative, we exploit a related source of variation, namely
distance to the closest major slave trade port in Africa, arguably a more relevant predictor
of exposure to slave raids. We follow several steps to construct this instrument. We begin
by identifying the geographic coordinates of all relevant embarkation ports in Africa ac-
cording to the latest version of Voyages: The Trans-Atlantic Slave Trade Database (2016),
a process yielding 122 unique well-defined locations.25 We then look at the imputed total
number of slaves embarked in each of these ports over the relevant time period. The volume
of exports varies dramatically across ports, from 13 slaves in Trade Town to 1.4 million
in Luanda. To take into account this obvious difference in the importance of ports and
thus increase the strength of our instrument, we only select the ports in the first quartile
of the slave exports distribution, a set including 32 locations with total number of slaves
exceeding 42000 people. Finally, we measure the distance from each ethnic homeland to
the closest major port.
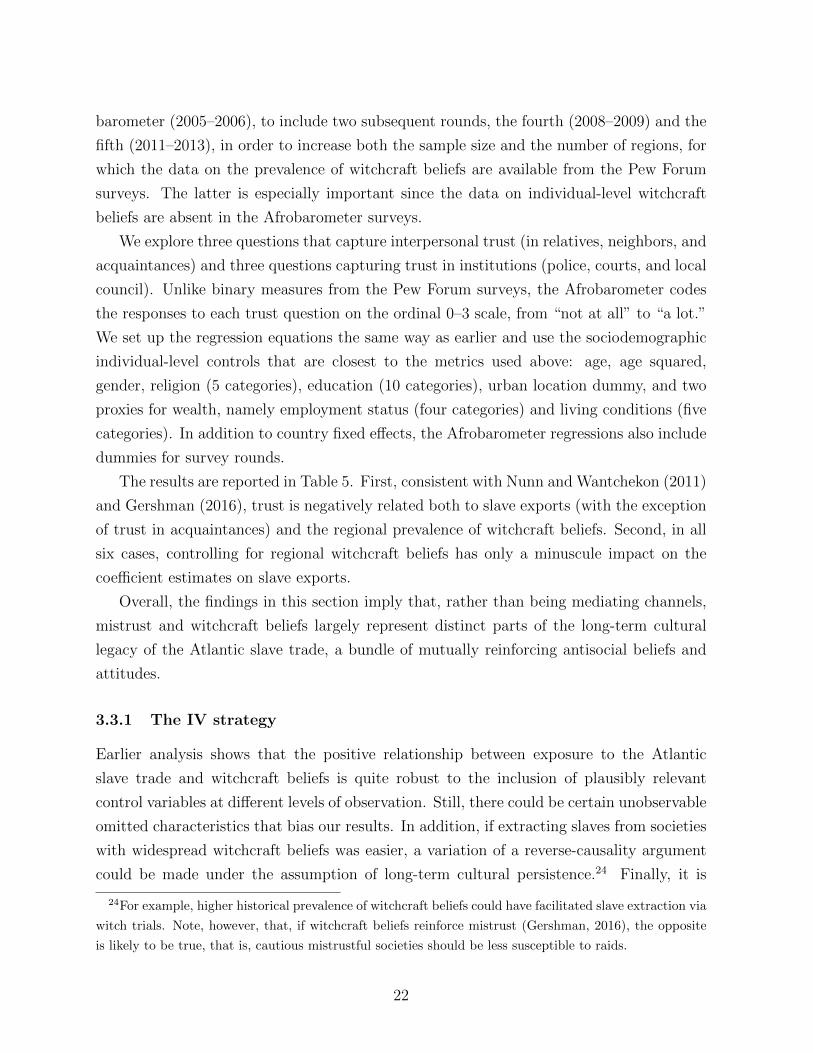
The two panels of Table 6 show the IV estimates for the same model specifications as
in Table 2 using the two alternative instruments for slave exports. Across specifications,
the coefficient of interest is positive and statistically significant. Compared to baseline
OLS values in Table 2, the magnitude of estimates is always substantially larger. This
increase is much larger for the distance to the coast instrument, in which case, for the most
stringent specifications in columns 4 and 5, the coefficient of interest goes up by a factor
of 3.2 and 4.5, respectively. For our second instrument, the IV estimates exceed their OLS
counterparts by a factor of 1.9 and 2.5, respectively. In both cases, larger IV estimates
suggest that, if the exclusion restriction holds, the baseline estimates understate the true
impact of the Atlantic slave trade on contemporary witchcraft beliefs. This is consistent
with the notion that estimates for ethnicity-level volumes of exports are noisy. Considering
that our second instrument is more likely to satisfy the exclusion restriction, being more
slave-trade specific, the underestimate in the OLS analysis is roughly by a factor of 2.
Comparison of the first-stage F -statistics in Table 6 shows that, consistent with our priors,
our second instrument, capturing distance to major embarkation ports is always stronger
than simple raw distance to the coast.26
25The dataset and its detailed description are available at http://slavevoyages.org.26As expected, limiting the set of ports to the top quartile substantially raises the strength of the
instrument. For instance, the first-stage F -statistic falls to 12.33 for specification in column 4 of Table 6,
if we define relevant ports as those with above-median volume of exports, and further to 10.72, if all ports,
no matter how small, are included. Reducing the set of ports to even larger ones, namely the top decile,
makes the instrument less strong compared to the baseline, with an F -statistic of 15.67. The qualitative
results, in terms of the size and significance of the coefficient of interest, remain similar regardless of the
chosen set of ports.
24
Table 6: Witchcraft beliefs and slave exports: IV estimates
(1) (2) (3) (4) (5) (6)
IV: Distance to the coast
Slave exports (Atlantic) 0.124∗∗∗
0.149∗∗∗
0.147∗∗∗
0.169∗∗∗
0.177∗∗∗
0.136∗∗
(0.045) (0.055) (0.054) (0.056) (0.058) (0.054)
Kleibergen-Paap F 13.48 13.05 13.84 16.16 15.59 14.50
IV: Distance to the closest major Atlantic slave trade port
Slave exports (Atlantic) 0.087∗∗∗
0.093∗∗
0.093∗∗
0.097∗∗
0.091∗∗
0.079∗
(0.033) (0.039) (0.039) (0.041) (0.041) (0.042)
Kleibergen-Paap F 16.68 16.62 17.72 21.74 23.52 18.10
Basic individual controls Yes Yes Yes Yes Yes Yes
Add. individual controls No Yes Yes Yes Yes Yes
Ethnic controls No No No Yes Yes Yes
Regional controls No No No No Yes No
Region FE No No No No No Yes
Country FE Yes Yes Yes Yes Yes No
Observations 19819 18714 17123 17123 17123 17123
Ethnic clusters 319 318 287 287 287 287
Regional clusters 174 174 171 171 171 171
Notes. a) IV/2SLS estimates in all columns. b) Standard errors shown in parentheses are clustered at both ethnic and
regional levels. c) ∗∗∗, ∗∗, and ∗ denote statistical significance at the 1, 5, and 10 percent level, respectively. d) The
sets of control variables are identical to those in Table 1, see the corresponding notes for details. e) Slave exports in
the Indian ocean trade are controlled for in all specifications. f) First-stage regression estimates are reported in Table
B.1 in appendix B.
4 Evidence from Latin America
According to the Trans-Atlantic Slave Trade Database, 96.3% out of roughly 10.5 mil-
lion African captives disembarked in the New World landed in Latin America and the
Caribbean, with close to 5 million people arriving in Brazil alone.27 This forced reloca-
tion of Africans had a massive impact on the economy and society of Latin America and,
along with European migrations, transformed the population structure of the continent.28
Without a doubt, the Atlantic slave trade shaped not only the socioeconomic, but also
the cultural landscape of the continent, although the extent to which the original ele-
25
ments of African culture were preserved or recreated in the New World is being debated
(Morgan, 1997).
4.1 Witchcraft beliefs in the transatlantic cultural exchange
The cultural legacy of the Atlantic slave trade in Latin America and the Caribbean is
perhaps most visible in the popular syncretic religions combining elements of African beliefs
and Christianity. Santerıa, Candomble, Voodoo, and Obeah are the well-known examples of
such mixed religious traditions. Here, we focus more narrowly on the possible transmission
of witchcraft beliefs across the Atlantic Ocean. Indeed, historical evidence implies that
such beliefs did represent an important element of the transatlantic cultural exchange that
had a peculiar relationship with the slave trade experience. Sweet (2003) and Hawthorne
(2010) provide detailed accounts of how certain core spiritual beliefs and rituals, common
to the cultures of various ethnic groups, were transferred from the Atlantic coast of Africa
to Brazil. Among these, beliefs in witchcraft, sorcery, or feticaria, as it was known to
the Portuguese, were instrumental in providing a framework for understanding evil and
misfortune. As the following discussion shows, witchcraft beliefs were not just brought to
the Americas, but also reconfigured to fit the realities of slavery.
The evidence presented so far shows that the slave trade experience appears to have
intensified witchcraft beliefs among the affected groups in Sub-Saharan Africa. Thus, it
comes as no surprise that the captives held on to the perception of their ordeal as a
form of witchcraft during the middle passage, as already documented above in a quote
from Alonso de Sandoval, a Jesuit priest observing the newly arrived slaves in the 17th-
century Cartagena. Schuler (1979) further argues that the common circumstances in which
enslaved Africans found themselves and the “shipmate” experience in particular created
a “fictive kinship” among them based on shared cultural norms. One manifestation of
this solidarity was “the common conviction that malicious sorcery played a part in their
misfortune” (p. 124). Similarly, Paton (2012) remarks that “on forced marches to the
African coast, on board slave ships, and in their new Atlantic settings, enslaved people
were likely to interpret what had happened and was happening to them as the result of
27Thus, destinations in mainland North America, including ports in the United States and
Canada, only account for about 3.7% of all arrivals. The original estimates are available at
http://slavevoyages.org/assessment (accessed in June 2017).28According to one recent estimate, as of 2010, the Afro-descendant population of Latin America ex-
ceeded 130 million people constituting almost a quarter of the regional total (Andrews, 2016). This includes
an estimated 97 million Afro-descendants in Brazil, 15 million in Venezuela, and 8 million in the Dominican
Republic. The sample does not cover Belize, Guatemala, the Guianas, and smaller Caribbean islands.
26
religious malevolence” (pp. 248–249). In addition, Christian rituals applied to slaves, such
as baptism, were typically understood by them as a “means of further ensuring European
“enchantment” or power over Africans” (Sweet, 2003, p. 197).
Just like at the source, in Africa, and during the middle passage, at their destination
in Latin America, the captives applied a familiar cultural framework to interpret their
position in slavery-based societies. In this system of coordinates, their miserable lives
were the direct result of witchcraft, and the witches they had to deal with now were
their masters and aligned elites. As pointed out by several authors, this view reflects the
reliance of slaves on their culture as a form of resistance. Schuler (1979) explains how the
perception of slave owners as sorcerers helped to define slave resistance in the context of
Myalism, an “Afro-Jamaican religious movement with a sorcery-eradication focus” which
viewed Europeans and assimilated African elites as ultimate sorcerers (p. 131). Among the
forms of resistance, self-protection through charms and “ritual confrontation” with masters-
sorcerers complemented strikes, revolts, and other efforts to build a united slave community.
Similarly, in the context of Brazil, Sweet (2003) describes vividly how witchcraft beliefs and
related practices among the slaves were both a common way to deal with their hardships
and a powerful tool of cultural resistance, “a stealthy, silent killer of the hated master, and
a very real threat to the colonial status quo” (p. 160). Palmie (2002) recites an account
by Esteban Montejo, a former slave who worked on the Cuban plantation of Flor de Sagua
in the early 1870s, of a “mayombe” ritual in which slaves “engaged in a kind of mystical
warfare against abusive owners” (p. 177). Echoing other historians, Palmie concludes that
witchcraft beliefs provided the slaves with both an explanation of their predicament and a
tool of resistance, and “countering witchcraft with violent sorcery became a political means
of restoring moral balance” (p. 181).
In many cases, slave resistance based on performing traditional rituals actually worked.
In a remarkable inversion, the African slaves were often viewed by their masters and church
officials as witches, and their practices were feared. As Sweet (2003) puts it, the masters
“were acutely aware of the “diabolical” power of African religions, and many lived in
constant fear of the “witchcraft” that their slaves might cast upon them” (p. 159). He
goes on to describe a number of cases from the 17th- and 18th-century Brazil of black
slaves engaging in various rituals in order to protect themselves from their masters or even
directly harm them via supernatural means. Interestingly, Sweet cites Father Andre Joao
Antonil warning those masters who administered excessive punishments that they risked
revenge from their slaves in the form of witchcraft or poison (pp. 165–166). Olwig (1995)
recounts the view of Johan Lorentz Carstens, a prominent 18th-century plantation owner
27
and slave holder from St. Thomas, who apparently believed that some of his slaves were
the masters of witchcraft and were able to “project such things as a lump of hair, cut-off
nails, and sharp, thin pieces of rusty iron into the bodies of human beings, causing them
to die in a short time” (p. 34). The fears of such supernatural abilities may even have
been behind a 1701 act making it mandatory that slaves receive instruction in Christianity
so that “their wild souls, old bad habits, idolatry, witchcraft, murder and evil would be
weakened and broken.”
Hawthorne (2010) shares multiple cases documented by priests in the 18th-century
Maranhao, in which African slaves were either accused of feticaria or described as trying
to counteract it by using protective charms identical to those found across the ocean in their
Upper Guinean homeland.29 Recall that, as described in detail in section 2, witchcraft trials
were commonly used to “produce” slaves in Sub-Saharan Africa. Indeed, Hawthorne notes
ironically that, since Upper Guineans often sold witches as slaves, one should expect to find
a considerable number of skilled practitioners of witchcraft in Maranhao (p. 239). Similarly,
Sweet (2003) points out that both Africans and the Catholic Church in Central Africa were
known to condemn suspected witches to slavery, as a result of which “a disproportionate
number of African diviners/healers probably found their way into the slave population of
Brazil, thereby exaggerating their influence among Brazil’s slaves” (p. 198). Sweet summa-
rizes this odd witchcraft-based confrontation between African slaves and their European
masters as a “witch versus witch” battle: “Africans, who understood their enslavement
to be the result of Portuguese religious malevolence, countered with their most powerful
religious antidotes, which were recognized and feared by the Portuguese as “witchcraft.”
In their attempts to counter the slings and arrows of slavery – mistreatment, malnutri-
tion, disease, kinship instability, and so on – African slaves (and freed Africans) mounted
a steady religious assault against the white witches who were causing them such grave
misfortune” (p. 164).
Thus, historical evidence indicates that witchcraft beliefs clearly found their place in
slavery-based colonies of Latin America. To African slaves, these beliefs apparently served
as both a framework for identifying the sources of their suffering and as a tool of cultural
resistance against the powerful masters. The latter, in turn, often saw their slaves’ actions
as witchcraft and even borrowed some of the African supernatural protection practices in
response. It is also entirely plausible that, over time, witchcraft beliefs were transmitted
29Interestingly, some of the Europeans in Brazil also wore protective “Mandinga pouches” and consulted
with black healers in Amazonia, borrowing African practices that were actually not that different from
those still present in Portugal at that time (p. 243).
28
across generations of slaves and their descendants, as well as Europeans and other residents
of the continent who were likely to acquire or reinforce such beliefs via their interactions
with African culture. The following section formally investigates whether the consequences
of this cultural import can be detected in the contemporary data on witchcraft beliefs in
Latin America.
4.2 Data and empirical analysis
Between October 2013 and February 2014, the Pew Research Center conducted a wave of
public opinion surveys, similar to those used in the analysis of section 3, in 18 countries
across Latin America and the Caribbean (plus Puerto Rico).30 These surveys involved over
30000 face-to-face interviews and focused on religious beliefs and practices, as well as social
and political views. Just like in the African wave of surveys, the standard questionnaire
contained a module on traditional beliefs which allows us to construct individual-level mea-
sure of witchcraft beliefs in a rather consistent way.31 According to the baseline definition,
witchcraft believers constitute 59% of the full Latin American sample and their prevalence
rate ranges from roughly 47% in Bolivia, Paraguay, and Puerto Rico to about 77% in
Honduras and Panama.
If witchcraft beliefs were indeed of particular importance to African slaves in Latin
America and represented a unique part of their cultural heritage, given vertical cultural
transmission, one may expect to observe a higher prevalence of believers among Afro-
descendants relative to other racial groups in the survey sample. To address this channel
of persistence, we first classify the respondents by race, identifying in the process the
crucial group of Afro-descendants.32 The other three categories are white, indigenous,
and mestizo. Whites largely represent the descendants of Europeans, the “indigenous”
30These include Argentina, Bolivia, Brazil, Chile, Colombia, Costa Rica, Dominican Republic,
Ecuador, El Salvador, Guatemala, Honduras, Mexico, Nicaragua, Panama, Paraguay, Peru, Uruguay,
and Venezuela. Both Chile and Puerto Rico drop out from our analysis since the key information on
race/ethnicity is missing in these two cases. The “Religion in Latin America” dataset is available at
http://www.pewforum.org/datasets.31Rather than asking directly about belief in “witchcraft” the Latin American surveys ask whether
respondents believe that “magic, sorcery or witchcraft can influence peoples lives.” Since this question
adds a broad notion of “magic” into the mix, we conduct a robustness check in which witchcraft believers
are defined only as those who believe that “certain people can cast curses or spells that cause bad things
to happen to someone.”32This group includes people self-identifying as black, of African descent, mulatto, or giving similar
responses.
29
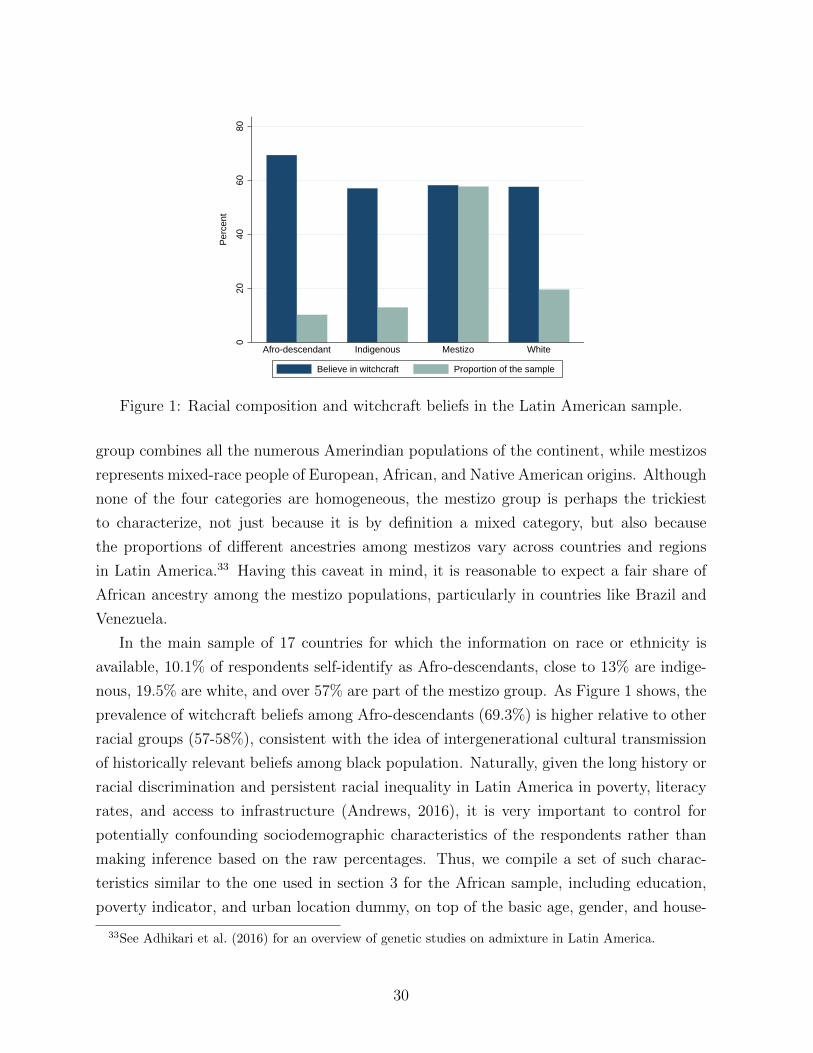
020
4060
80
Per
cent
Afro-descendant Indigenous Mestizo White
Believe in witchcraft Proportion of the sample
Figure 1: Racial composition and witchcraft beliefs in the Latin American sample.
group combines all the numerous Amerindian populations of the continent, while mestizos
represents mixed-race people of European, African, and Native American origins. Although
none of the four categories are homogeneous, the mestizo group is perhaps the trickiest
to characterize, not just because it is by definition a mixed category, but also because
the proportions of different ancestries among mestizos vary across countries and regions
in Latin America.33 Having this caveat in mind, it is reasonable to expect a fair share of
African ancestry among the mestizo populations, particularly in countries like Brazil and
Venezuela.
In the main sample of 17 countries for which the information on race or ethnicity is
available, 10.1% of respondents self-identify as Afro-descendants, close to 13% are indige-
nous, 19.5% are white, and over 57% are part of the mestizo group. As Figure 1 shows, the
prevalence of witchcraft beliefs among Afro-descendants (69.3%) is higher relative to other
racial groups (57-58%), consistent with the idea of intergenerational cultural transmission
of historically relevant beliefs among black population. Naturally, given the long history or
racial discrimination and persistent racial inequality in Latin America in poverty, literacy
rates, and access to infrastructure (Andrews, 2016), it is very important to control for
potentially confounding sociodemographic characteristics of the respondents rather than
making inference based on the raw percentages. Thus, we compile a set of such charac-
teristics similar to the one used in section 3 for the African sample, including education,
poverty indicator, and urban location dummy, on top of the basic age, gender, and house-
33See Adhikari et al. (2016) for an overview of genetic studies on admixture in Latin America.
30
hold size measures.34 We also control for the overall level of economic development at the
regional level as measured by nighttime lights per capita. Note that in the Latin American
sample, data on the region of residence are available at a highly disaggregated level for
most countries, adding up to more than 1000 subnational units.35
Our baseline estimating equation is
witchi,r,c = αc + β ancestryi,r,c + X′i,r,cΓ + X′r,cΩ + εi,r,c,
The binary outcome variable witchi,r,c captures whether individual i residing in region r of
country c believes in witchcraft or not, and ancestryi,r,c is race, which is either a categor-
ical variable reflecting the four-way classification introduced above or an Afro-descendant
dummy. Control variables at the individual and regional levels are represented by vectors
X′i,r,c and X′r,c, respectively. Finally, αc represents country fixed effects and εi,r,c is the
individual-level idiosyncratic component. The model is estimated via OLS, with standard
errors clustered at the regional level.36
The estimation results are shown in Table 7, where specifications in columns 1–3 and
4–6 employ, respectively, the four-way racial classification and the Afro-descendant indi-
cator. The model in column 1 shows that, relative to the omitted category “white,” Afro-
descendants are, on average, 6.5 percentage points more likely to believe in witchcraft, an
estimate that is highly statistically significant. Both indigenous and mestizo individuals
are also more likely to be witchcraft believers than whites, but the relevant point estimates
are about half the size of that for Afro-descendants. Furthermore, column 2 shows that
part of this association is explained away by the omitted socio-demographic characteristics.
After controlling for education, poverty indicator, and other relevant measures, the point
estimate on indigenous drops dramatically and becomes statistically insignificant, whereas
the estimates for Afro-descendants and mestizos remain significant, despite a notable re-
duction in size. Accounting for individual and regional characteristics, Afro-descendants
and mestizos are, respectively, 5 and 2.7 percentage points more likely than whites to be
witchcraft believers. This is consistent with a priori expectations, considering that mestizos
often have partly African ancestry. Estimates in columns 4–6 show that Afro-descendants
are, on average, 3.5 percentage points more likely to believe in witchcraft when compared
34Due to regional differences, religion and education categories are somewhat different across the two
continents, see appendix A for the detailed description of all variables.35Still, for Mexico, Argentina, Ecuador, Paraguay, Bolivia, and Uruguay, regions represent first-level
subnational administrative units. To take into account the difference in the size of regions in the sample,
we additionally control for region area.36Maximum likelihood estimation of equivalent probit specifications yields very similar results.
31
Table 7: Witchcraft beliefs and African ancestry in Latin America
(1) (2) (3) (4) (5) (6)
Four-way classification Afro-descendant indicator
Afro-descendant 0.065∗∗∗
0.050∗∗∗
0.050∗∗∗
0.039∗∗∗
0.035∗∗∗
0.034∗∗∗
(0.017) (0.016) (0.016) (0.013) (0.013) (0.013)
Indigenous 0.031∗
0.007 0.008
(0.018) (0.017) (0.017)
Mestizo 0.035∗∗∗
0.027∗∗
0.027∗∗
(0.012) (0.012) (0.012)
Ed.: primary/mid. sch. −0.015 −0.015 −0.014 −0.014
(0.010) (0.010) (0.010) (0.010)
Ed.: high school −0.038∗∗∗ −0.037
∗∗∗ −0.037∗∗∗ −0.036
∗∗∗
(0.012) (0.012) (0.012) (0.012)
Ed.: tech. or some uni. −0.087∗∗∗ −0.087
∗∗∗ −0.086∗∗∗ −0.086
∗∗∗
(0.017) (0.017) (0.017) (0.017)
Ed.: uni. or higher −0.106∗∗∗ −0.105
∗∗∗ −0.106∗∗∗ −0.105
∗∗∗
(0.019) (0.019) (0.019) (0.019)
Money for basic needs −0.067∗∗∗ −0.067
∗∗∗ −0.067∗∗∗ −0.067
∗∗∗
(0.008) (0.008) (0.008) (0.008)
Urban location 0.022∗∗
0.024∗∗
0.023∗∗
0.025∗∗
0.010 0.010 0.010 0.010
Basic individual controls Yes Yes Yes Yes Yes Yes
Add. individual controls No Yes Yes No Yes Yes
Regional controls No No Yes No No Yes
Country FE Yes Yes Yes Yes Yes Yes
Observations 24511 24185 24165 24511 24185 24165
Regional clusters 1039 1039 1037 1039 1039 1037
Adjusted R2 0.03 0.05 0.05 0.03 0.05 0.05
Notes. a) OLS estimates in all columns. b) Standard errors shown in parentheses are clustered at the regional level.
c) ∗∗∗, ∗∗, and ∗ denote statistical significance at the 1, 5, and 10 percent level, respectively. d) Additional individual
controls, not shown in the table, also include religion and household size variable (ten categories). The omitted category
for education is “completed primary of less.” e) Regional controls include nighttime lights per capita and region area.
to the rest of the sample pooled into one group. Note also that the estimates on included
sociodemographic characteristics are largely consistent with those for the African sample.
Higher education and wealth levels are associated with a smaller likelihood of believing
32
in witchcraft, whereas living in an urban area appears to increase that likelihood, other
things equal.
In addition to their persistence across generations of Afro-descendants, witchcraft be-
liefs may have been more likely to survive in regions historically more exposed to African
slavery, where, as shown above, such beliefs played a special role among both slaves and
their masters, and where cultural exchange occurred most actively. Although reliable
quantitative estimates of the historical spatial distribution of African slaves and their de-
scendants in Latin America are not available, its qualitative patterns have been widely
documented and are largely based on geographic factors that made the use of African slave
labor more suitable than that of coerced or enslaved indigenous population. Specifically,
the major belt of African slavery in Latin America was largely contained within tropical
coastal lowlands (TCL).37
The key explanation for this geographic pattern has to do with the pre-Columbian
population distribution in Latin America and the demographic shock caused by Old-World
diseases.38 Before the arrival of the Europeans, the densest sedentary settlements of Latin
America were found in the temperate zones of the continent, such as the Andean high-
lands and the central Mexican plateau, known for their high agricultural suitability. High
elevation was also instrumental in protecting the indigenous population against the new
pathogens brought from across the Atlantic. In contrast, indigenous communities of the
tropical lowlands had low population density and were directly exposed to the previously
unknown diseases leading to the swift decimation of those tribes upon their contact with
Europeans. The loss of this source of labor prompted attempts of a forced transfer of na-
tive populations to the tropical lowlands that was, however, unsustainable, due both to the
high death rate it entailed and the opposition of European settlers in mountainous regions
who needed their own local labor source, particularly in mining (Mellafe, 1975). Given
the massive decline of the native population and inability to replace it with captives from
other regions of the continent, the Europeans ultimately had to rely largely on African
slave labor for agricultural production in tropical lowlands.
Hawthorne (2010) describes in detail the gradual replacement of enslaved indigenous
labor by African slaves on the plantations of Maranhao, Brazil. His account provides two
main reasons behind this process, namely the high death rates of the natives from the
37Zelinsky (1949) made perhaps the most ambitious attempt to reconstruct, however crudely, the distri-
bution of black population within Latin America at six points in time between 1570 and 1940. His maps
clearly indicate the persistent predominant location of black communities in the tropical coastal lowlands
of the continent, with only a few exceptions.38See, for example, Zelinsky (1949), Mellafe (1975), and Gallup et al. (2003).
33
Old-World pathogens and the perception of the Europeans (clear from abundant historical
records) that African slaves were more productive. That perception was shaped partly
by the lower resistance of indigenous populations to tropical diseases, but also by their
higher likelihood of escape, due to the knowledge of local terrain, and the fact that settled
agricultural work was completely unknown and repugnant to Amazonian tribes which
typically subsisted by foraging. In contrast, the African slaves arriving in Maranhao and
Para from Upper Guinea came from settled agricultural societies and knew very well how
to grow crops in tropical environments (pp. 47–49).
The abundant supply of indigenous labor in the highlands also explains why African
slave labor was not nearly as actively employed in the mining sector as it was in tropical
agriculture. For instance, such large mining centers as Huancavelica in Peru or Zipaquira in
Colombia were surrounded by dense local settlements and were thus worked by indigenous
people (Mellafe, 1975). This is not to say that African slaves were entirely absent in the
mining sector. Indeed, Lane (2005) notes that, although most silver mining was carried
out by coerced indigenous labor, most gold mining was in fact done by African slaves
and their descendants. This division is perfectly consistent with the geographic factors
outlined above, since silver mines “tended to be located in the remote, dry, and often cold
high-country interior of Spanish America, whereas gold mines were mostly distributed in
lower, hotter, and wetter zones” (p. 162). The abundance of local indigenous labor, as
well as the higher costs associated with the danger of losing expensive African slaves to
mine-related disasters or a high-altitude sickness favored the use of coerced native labor in
silver mines.39 Overall, available estimates suggest that indigenous population accounted
for roughly 80% of all workers in the mines of Potosi and Zacatecas at the peak of colonial
activities (p. 173).
In addition to the fundamental role of geography in explaining the relative scarcity or
abundance of indigenous labor, two other factors help explain the geographic distribution
of African slaves and their descendants. First, slave-based agricultural production sites
were often located in relative proximity to ports and the European settlements in Latin
America that were predominantly found in coastal lowland areas (Zelinsky, 1949). Second,
as explained in Mellafe (1975), independent black communities (quilombos) resulting from
ship wrecks, individual or mass escapes of slaves, were always founded in tropical loca-
tions and typically concentrated “in the northern and coastal provinces of Colombia and
39This is particularly true of Potosi, where extreme altitudes require a substantial acclimatization period
for any worker not native to those areas, and partly explains why the use of African slave labor was more
common in Zacatecas and other Mexican mining sites located at relatively low elevation.
34
Venezuela, along the coasts of Central America, in the coastal belts and remote interior
regions of the Portuguese possessions in Brazil, and particularly in some of the islands of
the Caribbean” (p. 34), thus contributing to the tropical coastal lowland geography of the
Afro-descendant population in Latin America.
Given this rather uniform evidence, we consider three proxies to capture a region’s
historical exposure to African slavery based on its geographic features. First, we calculate
the distance from the centroid of each respondent’s region of residence to the coastline.
Although this measure should capture to some extent the “coastal” element of the distribu-
tion of Afro-descendants, it is a rather naive measure, particularly because of the coastal
proximity of the Andes, which, as discussed before, hosted some of the most populous
indigenous communities of the continent due to high altitudes. Second, we measure the
region’s average elevation, to capture the “lowland” element of the population geography
in Latin America.40 Finally, in attempt to mitigate the simplicity of the previous two
“one-dimensional” measures, we build a proxy for the “tropical coastal lowlands” triad,
based on the ecological maps of the Latin American continent.
We start off with a digital map of ecological regions of Central and South America
produced as part of an effort by the U.S. Geological Survey Earth Resources Observation
and Science Center and the U.S. Environmental Protection Agency to develop a consistent
map of ecoregions for the Western Hemisphere (Griffith et al., 1998).41 The boundaries
of ecoregions, available at three levels of aggregation, are based on various environmental
features of the continent including geology, physiography, soil type, potential and existing
vegetation, climate, and land cover. For Central and South America and the Caribbean,
the maps contain 12 ecoregions at level I, 35 at level II, and 121 at level III, where regions
at finer levels are nested within upper-level classifications. We exploit the classification at
levels II and III and flag all ecoregions roughly fitting in the “tropical coastal lowlands”
category. This process leads to a baseline of 15 level-II regions and 9 additional level-III
regions (listed in appendix A) with geographical features historically favoring the use of
African slave labor, as shown in Figure 2. Finally, for each region in our survey sample,
we measure the fraction of its area located in the tropical coastal lowlands.
We next rerun the regressions presented above, but now adding our regional geography
measures, one by one and altogether. The results are presented in Table 8. The first column
40We take the natural logarithm of both distance to the coast and elevation measures, due to extreme
skewness of these variables.41To cover Mexico, we combine this base layer with a similar map of North American ecoregions
from the Commission for Environmental Cooperation. All of these digital maps are available online at
http://ecologicalregions.info.
35
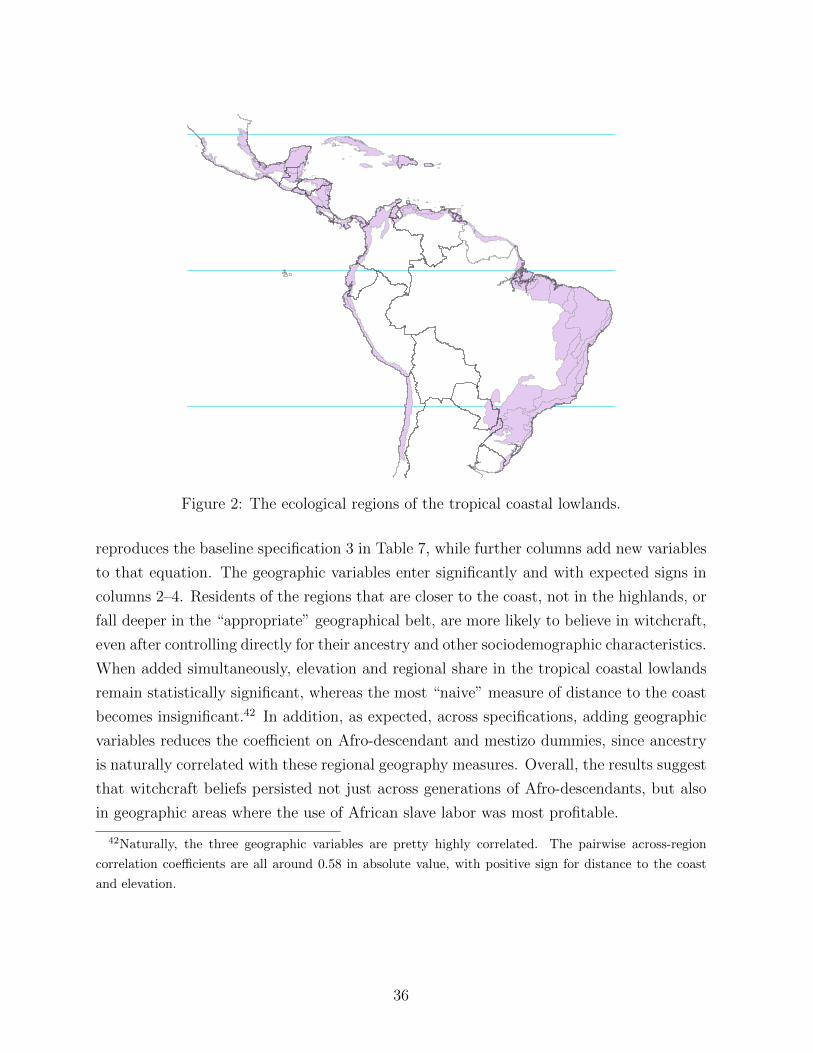
Figure 2: The ecological regions of the tropical coastal lowlands.
reproduces the baseline specification 3 in Table 7, while further columns add new variables
to that equation. The geographic variables enter significantly and with expected signs in
columns 2–4. Residents of the regions that are closer to the coast, not in the highlands, or
fall deeper in the “appropriate” geographical belt, are more likely to believe in witchcraft,
even after controlling directly for their ancestry and other sociodemographic characteristics.
When added simultaneously, elevation and regional share in the tropical coastal lowlands
remain statistically significant, whereas the most “naive” measure of distance to the coast
becomes insignificant.42 In addition, as expected, across specifications, adding geographic
variables reduces the coefficient on Afro-descendant and mestizo dummies, since ancestry
is naturally correlated with these regional geography measures. Overall, the results suggest
that witchcraft beliefs persisted not just across generations of Afro-descendants, but also
in geographic areas where the use of African slave labor was most profitable.
42Naturally, the three geographic variables are pretty highly correlated. The pairwise across-region
correlation coefficients are all around 0.58 in absolute value, with positive sign for distance to the coast
and elevation.
36
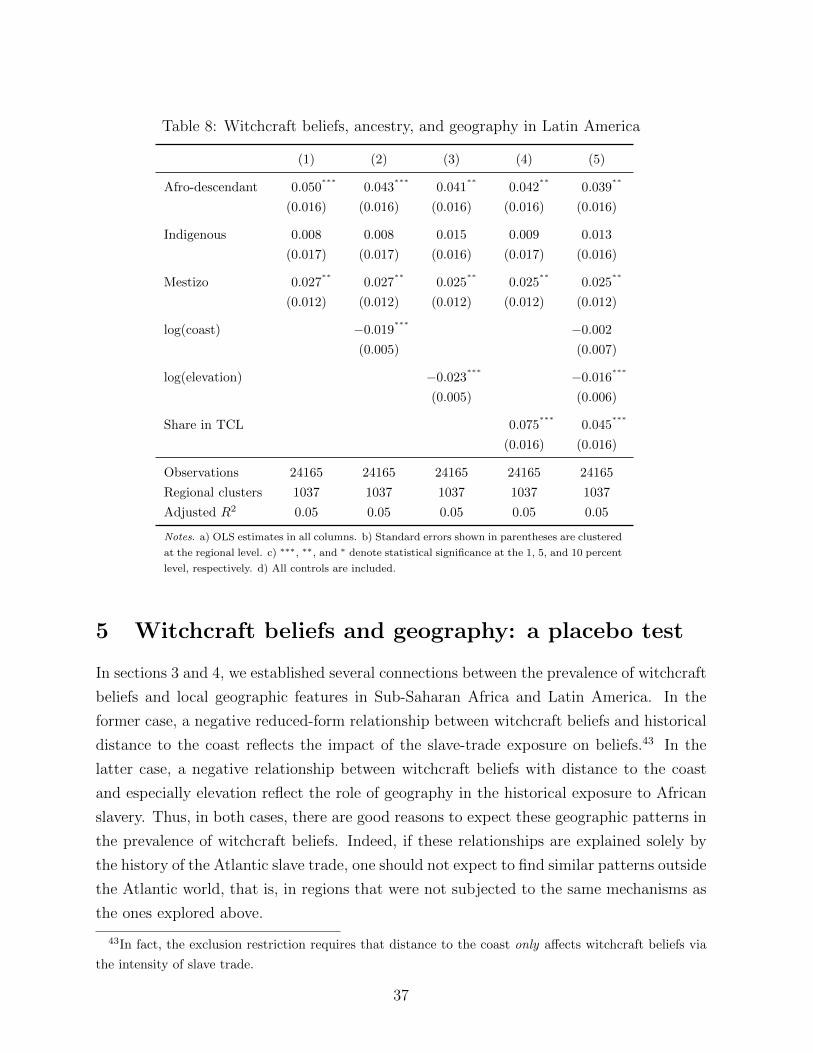
Table 8: Witchcraft beliefs, ancestry, and geography in Latin America
(1) (2) (3) (4) (5)
Afro-descendant 0.050∗∗∗
0.043∗∗∗
0.041∗∗
0.042∗∗
0.039∗∗
(0.016) (0.016) (0.016) (0.016) (0.016)
Indigenous 0.008 0.008 0.015 0.009 0.013
(0.017) (0.017) (0.016) (0.017) (0.016)
Mestizo 0.027∗∗
0.027∗∗
0.025∗∗
0.025∗∗
0.025∗∗
(0.012) (0.012) (0.012) (0.012) (0.012)
log(coast) −0.019∗∗∗ −0.002
(0.005) (0.007)
log(elevation) −0.023∗∗∗ −0.016
∗∗∗
(0.005) (0.006)
Share in TCL 0.075∗∗∗
0.045∗∗∗
(0.016) (0.016)
Observations 24165 24165 24165 24165 24165
Regional clusters 1037 1037 1037 1037 1037
Adjusted R2 0.05 0.05 0.05 0.05 0.05
Notes. a) OLS estimates in all columns. b) Standard errors shown in parentheses are clustered
at the regional level. c) ∗∗∗, ∗∗, and ∗ denote statistical significance at the 1, 5, and 10 percent
level, respectively. d) All controls are included.
5 Witchcraft beliefs and geography: a placebo test
In sections 3 and 4, we established several connections between the prevalence of witchcraft
beliefs and local geographic features in Sub-Saharan Africa and Latin America. In the
former case, a negative reduced-form relationship between witchcraft beliefs and historical
distance to the coast reflects the impact of the slave-trade exposure on beliefs.43 In the
latter case, a negative relationship between witchcraft beliefs with distance to the coast
and especially elevation reflect the role of geography in the historical exposure to African
slavery. Thus, in both cases, there are good reasons to expect these geographic patterns in
the prevalence of witchcraft beliefs. Indeed, if these relationships are explained solely by
the history of the Atlantic slave trade, one should not expect to find similar patterns outside
the Atlantic world, that is, in regions that were not subjected to the same mechanisms as
the ones explored above.
43In fact, the exclusion restriction requires that distance to the coast only affects witchcraft beliefs via
the intensity of slave trade.
37
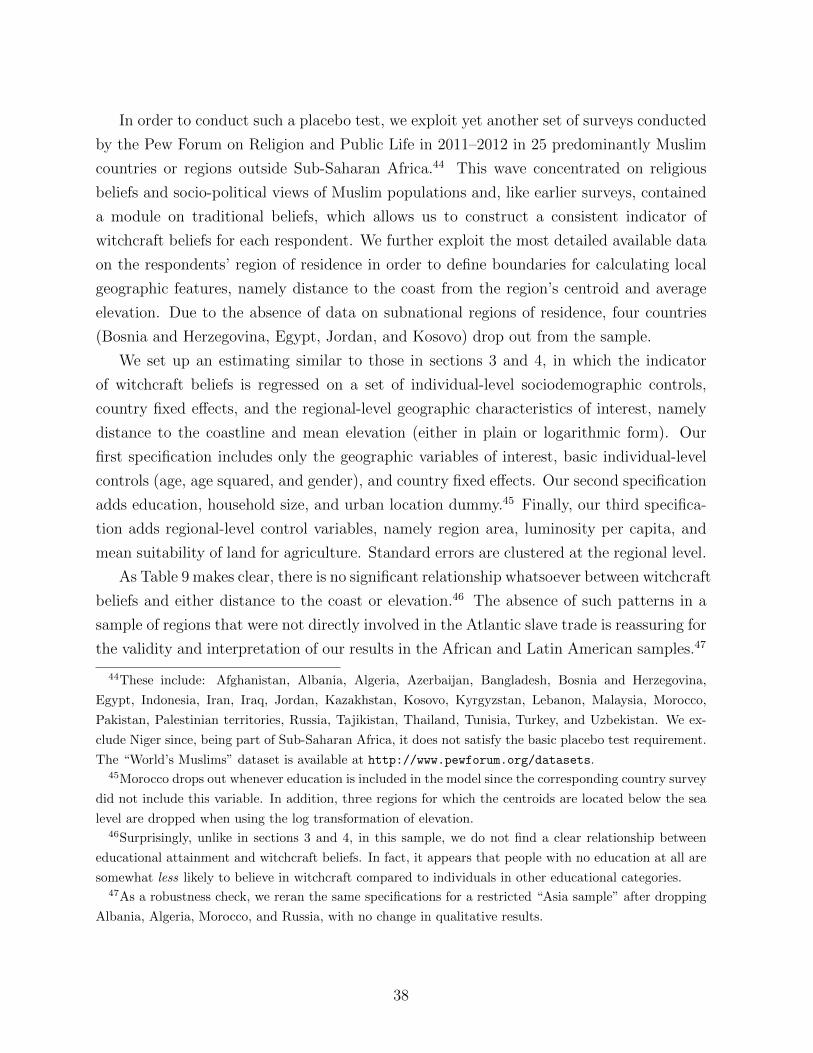
In order to conduct such a placebo test, we exploit yet another set of surveys conducted
by the Pew Forum on Religion and Public Life in 2011–2012 in 25 predominantly Muslim
countries or regions outside Sub-Saharan Africa.44 This wave concentrated on religious
beliefs and socio-political views of Muslim populations and, like earlier surveys, contained
a module on traditional beliefs, which allows us to construct a consistent indicator of
witchcraft beliefs for each respondent. We further exploit the most detailed available data
on the respondents’ region of residence in order to define boundaries for calculating local
geographic features, namely distance to the coast from the region’s centroid and average
elevation. Due to the absence of data on subnational regions of residence, four countries
(Bosnia and Herzegovina, Egypt, Jordan, and Kosovo) drop out from the sample.
We set up an estimating similar to those in sections 3 and 4, in which the indicator
of witchcraft beliefs is regressed on a set of individual-level sociodemographic controls,
country fixed effects, and the regional-level geographic characteristics of interest, namely
distance to the coastline and mean elevation (either in plain or logarithmic form). Our
first specification includes only the geographic variables of interest, basic individual-level
controls (age, age squared, and gender), and country fixed effects. Our second specification
adds education, household size, and urban location dummy.45 Finally, our third specifica-
tion adds regional-level control variables, namely region area, luminosity per capita, and
mean suitability of land for agriculture. Standard errors are clustered at the regional level.
As Table 9 makes clear, there is no significant relationship whatsoever between witchcraft
beliefs and either distance to the coast or elevation.46 The absence of such patterns in a
sample of regions that were not directly involved in the Atlantic slave trade is reassuring for
the validity and interpretation of our results in the African and Latin American samples.47
44These include: Afghanistan, Albania, Algeria, Azerbaijan, Bangladesh, Bosnia and Herzegovina,
Egypt, Indonesia, Iran, Iraq, Jordan, Kazakhstan, Kosovo, Kyrgyzstan, Lebanon, Malaysia, Morocco,
Pakistan, Palestinian territories, Russia, Tajikistan, Thailand, Tunisia, Turkey, and Uzbekistan. We ex-
clude Niger since, being part of Sub-Saharan Africa, it does not satisfy the basic placebo test requirement.
The “World’s Muslims” dataset is available at http://www.pewforum.org/datasets.45Morocco drops out whenever education is included in the model since the corresponding country survey
did not include this variable. In addition, three regions for which the centroids are located below the sea
level are dropped when using the log transformation of elevation.46Surprisingly, unlike in sections 3 and 4, in this sample, we do not find a clear relationship between
educational attainment and witchcraft beliefs. In fact, it appears that people with no education at all are
somewhat less likely to believe in witchcraft compared to individuals in other educational categories.47As a robustness check, we reran the same specifications for a restricted “Asia sample” after dropping
Albania, Algeria, Morocco, and Russia, with no change in qualitative results.
38
Table 9: Witchcraft beliefs and geography outside the Atlantic world
(1) (2) (3) (4) (5) (6)
Distance to the coast 0.018 0.016 0.029
(0.031) (0.031) (0.033)
Elevation 0.021 0.023 0.014
(0.023) (0.024) (0.025)
Log(distance) 0.001 0.002 0.000
(0.009) (0.010) (0.010)
Log(elevation) 0.005 0.006 0.002
(0.010) (0.011) (0.011)
Basic individual controls Yes Yes Yes Yes Yes Yes
Add. individual controls No Yes Yes No Yes Yes
Regional controls No No Yes No No Yes
Country FE Yes Yes Yes Yes Yes Yes
Observations 25779 24194 24194 25709 24124 24124
Regional clusters 412 363 363 409 360 360
Adjusted R2 0.16 0.14 0.15 0.16 0.14 0.15
Notes. a) OLS estimates in all columns. b) Standard errors shown in parentheses are clustered at the regional level.
c) Basic individual controls are age, age squared, and gender. d) Additional individual controls include education,
household size, and urban location dummy. e) Regional controls include nighttime lights per capita and region area.
6 Concluding remarks
This paper shows that the variation in contemporary witchcraft beliefs on both sides of
the Atlantic ocean can be partly explained by the history of the slave trade. Witchcraft
beliefs are more prevalent among African ethnic groups that were more heavily exposed to
the Atlantic slave trade in the past. They are also more prevalent among Afro-descendants
in Latin America, as well as in those regions of the continent where the use of African
slave labor was historically more intense. These findings are consistent with historical
and anthropological narrative about the role of the slave trade in propagation of witchcraft
beliefs and demonstrate how big shocks can reinforce existing cultural beliefs and contribute
to their persistence. They also shed light on the nature of these beliefs and related practices
as a cultural framework for interpreting misfortune, understanding and resisting evil, and
as a flexible mechanism for exerting power and punishing individuals in local communities.
39
Appendices
A Description of variables
Pew Forum individual-level variables in section 3 (Sub-Saharan Africa)
Raw data and documentation for “Tolerance and Tension: Islam and Christianity in Sub-Saharan Africa”
are available at http://www.pewforum.org/datasets.
Personal belief in witchcraft. Dummy variable equal to 1, if the respondent claims to believe in
witchcraft or the evil eye, i.e., that “certain people can cast curses or spells that cause bad things to
happen to someone” (or both), and 0, otherwise.
Religion. Four categories: Christian, Muslim, traditional religion, unaffiliated.
Education. Level of educational attainment, three categories: completed primary or less, some secondary
or completed secondary, post-secondary and higher.
Shortage of money. Dummy variable equal to zero, if the respondent reports insufficient money to buy
food, health care, or clothing. The original question is: “Have there been times during the last year when
you did not have enough money: 1) to buy food your family needed? 2) to pay for medical and health
care your family needed? 3) to buy clothing your family needed?”
Household size. Eight categories: three or fewer, four, five, six, seven, eight, nine, ten or more.
Other beliefs. Measures of personal and regional beliefs are constructed in the same way as for witchcraft.
Other beliefs include the following: heaven, where people who have led good lives are eternally rewarded;
hell, where people who have led bad lives and die without being sorry are eternally punished; reincarnation
– that people will be reborn in this world again and again; angels; miracles; evil spirits; that sacrifices to
spirits of ancestors can protect you from bad things happening; that certain spiritual people can protect
you from bad things happening; that juju, shrines, or other sacred objects can protect you from bad things
happening.
Generalized trust. Dummy variable equal to 1, if the respondent replies that “most people can be
trusted,” and 0, otherwise.
Trust in people of other religion. Dummy variable equal to 1, if the respondent replies that she
“generally trusts people who have different religious values,” and 0, otherwise.
Ethnicity-level variables in section 3 (Sub-Saharan Africa)
Slave exports. Number of exported slaves of a given ethnicity normalized by the area of homeland
historically inhabited by the respective ethnic group, available separately for the Atlantic and Indian
ocean trades. The baseline variables are log-transformed, as described in the text. Source: Nunn and
Wantchekon (2011), dataset available at http://scholar.harvard.edu/nunn/pages/data-0.
Settlement pattern. A measure of residence fixity, on the ordinal scale: nomadic or fully migratory
(1); seminomadic (2); semisedentary (3); compact but impermanent settlements (4); neighborhoods of dis-
persed family homesteads (5); separated hamlets, forming a single community (6); compact and relatively
permanent settlements (7); complex settlements (8). Source: Murdock (1967).
40
Jurisdictional hierarchy beyond local community. A measure of political centralization, on the
ordinal scale: no levels, no political authority beyond community (1); one level, for example, petty chief-
doms (2), two levels, for example, larger chiefdoms (3); three levels, for example, states (4); four levels, for
example, large states (5). Source: Murdock (1967).
Historical reliance on agriculture. Dummy variable equal to 1, if the contribution of agriculture to
subsistence exceeds 50%, and 0, otherwise. Source: Murdock (1967).
Historical presence of slavery. Dummy variable equal to 1, if slavery within society is “absent or near
absent,” and 0, otherwise. Source: Murdock (1967).
Malaria stability index. Index measuring the stability of malaria transmission based on regionally
dominant vector mosquitoes. Takes values from 0 to 39 and is available for cells at 0.5 degree resolution.
The variable used in the analysis is the average value of the index across cells falling in each ethnic
homeland. Source: Kiszewski et al. (2004).
Colonial railways. Dummy variable equal to 1, if a colonial railway line, as recorded for 1911 by the
Century Company, was present anywhere within the ethnic homeland, and 0, otherwise. Source: own
calculations using the shapefile downloaded at http://scholar.harvard.edu/nunn/pages/data-0.
European explorers. Dummy variable equal to 1, if a major route of European explorers during
precolonial and early colonial periods, as recorded for 1911 by the Century Company, passed through
the ethnic homeland, and 0, otherwise. Source: own calculations using the shapefile downloaded at
http://scholar.harvard.edu/nunn/pages/data-0.
Christian missions. The total number of Catholic and Protestant missions, as recorded in 1924 by
William Roome, located within the ethnic homeland, per square kilometer. Source: own calculations
using the shapefile downloaded at http://scholar.harvard.edu/nunn/pages/data-0.
Distance to the coastline. Great circle distance from the ethnic homeland’s centroid to the closest
location on the coastline. Computed using the haversine formula and measured in km. Source: own
calculations using the coastline shapefile downloaded at http://www.naturalearthdata.com.
Distance to major slave port. Great circle distance from the ethnic homeland’s centroid to the closest
major slave port. Computed using the haversine formula and measured in km. Major slave ports are
defined as 32 ports in the first quartile of the distribution by the number of embarked slaves as recorded
in the 2016 edition of the Transatlantic Slave Trade Database. Source: own calculations using the data
on slave embarkations by port available at http://slavevoyages.org.
Region-level variables in section 3 (Sub-Saharan Africa)
Nighttime lights per capita. Data on luminosity come from the Defense Meteorological Satellite
Program’s Operational Linescan System (DMSP-OLS) that reports stable images of Earth at night cap-
tured between 20:00 and 21:30. The measure ranges from 0 to 63 and is available for cells at 30 arc-
second resolution, see Henderson et al. (2012) for technical details. We aggregate luminosity data for
2008 and 2009 at the regional level and then take their average. The latter is then divided by the
region’s population size (see below) to obtain the final measure of lights per capita. Source: http:
//ngdc.noaa.gov/eog/dmsp/downloadV4composites.html.
Population size. Data on population counts come from LandScan Africa (2013) for cells at 30 arc-second
resolution. We calculate the sum of all grid values in each region to find regional population counts. Source:
http://web.ornl.gov/sci/landscan.
41
Mean suitability of land for agriculture. Index of suitability of land for rain-fed agriculture (max-
imizing technology mix). Coded on the scale from 1 (very high suitability) to 8 (not suitable) for
cells at 5 arc-minute resolution. The variable used in the analysis is the average value of the suit-
ability index across cells in each region. Source: FAO GAEZ dataset (plate 46) downloaded at http:
//webarchive.iiasa.ac.at/Research/LUC/GAEZ/index.htm and own calculations.
Spatial variability of temperature. Raw data on annual mean temperature and precipitation (1950–
2000) are available for cells at 30 arc-second resolution. Spatial variability is calculated as the standard
deviation of cell values for each region. Source: Hijmans et al. (2005) and own calculations, raw data
available at http://www.worldclim.org/current.
Precipitation anomaly. Average monthly precipitation during the period 2006-2008 (two years before
the survey wave) relative to the long-run average (1951-2000), censored at 100%. Raw pixel-level data are
available at 0.5 resolution from the Global Precipitation Climatology Centre (full data reanalysis, version
7). The final measure is derived by spatial averaging over the pixels in each region. Source: Schneider et al.
(2015) and own calculations, raw data available at http://www.cgd.ucar.edu/cas/catalog/surface/
precip/gpcc.html.
Ethnolinguistic fractionalization. Standard ELF indices constructed at different levels of linguistic
aggregation based on regional-level data on ethnolinguistic composition. For Nigeria, the indices were
recalculated using the data from the 2013 Demographic and Health Survey at the level of geopolitical
zones, to be consistent with the Pew Forum administrative division. Source: Gershman and Rivera
(2016b), own calculations for Nigeria, and, for the Democratic Republic of the Congo, GIS-based indices
constructed using the World Language Mapping System and disaggregated population data from LandScan,
as described in Gershman and Rivera (2016a).
Afrobarometer individual-level variables in section 3 (Sub-Saharan Africa)
Raw survey data and codebooks are available at http://www.afrobarometer.org/data.
Trust questions. Measures of interpersonal trust are based on the following questions: “How much do
you trust each of the following types of people: your relatives? your neighbors? other people you know?”
Measures of trust in institutions are based on the following questions: “How much do you trust each of the
following, or haven’t you heard enough about them to say: police? courts of law? elected local government
council?” The answers are coded on the scale from 0 (not at all) to 3 (a lot).
Employment status. The original question is: “Do you have a job that pays a cash income? Is it
full-time or part-time? And are you presently looking for a job (even if you are presently working)?” Four
categories: no (not looking); no (looking); yes, part-time; yes, full-time.
Religion. Five categories: Christian, Muslim, traditional religion, unaffiliated, other.
Living conditions. The original question is: “In general, how would you describe your own present living
conditions?” Five categories: very bad; fairly bad; neither good nor bad; fairly good; very good.
Education. Ten categories: no formal schooling; informal schooling only (including Koranic schooling);
some primary schooling; primary school completed; some secondary school/high school; secondary school
completed/high school completed; post-secondary qualifications, other than university, e.g., a diploma or
degree from polytechnic or college; some university; university completed; post-graduate.
42
Pew Forum individual-level data in section 4 (Latin America)
Raw data and documentation for “Religion in Latin America” are available at http://www.pewforum.
org/datasets.
Personal belief in witchcraft. Dummy variable equal to 1, if the respondent claims to believe either
that “magic, sorcery or witchcraft can influence peoples lives” or in the evil eye, i.e., that “certain people
can cast curses or spells that cause bad things to happen to someone” (or both), and 0, otherwise.
Race/ancestry. Four categories: Afro-descendant, indigenous, mestizo, white. The Afro-descedant
category includes the following responses: Afro-descedant, Afroboliviano, black, Garifuna, mulatto, negro,
Palenquero of San Basilio, Raizal of San Andres and Providencia. The indigenous category includes the
following responses: Amerindian, Andean indigenous, Aymara, Chiquitano, Guarani, indigenous, Lecos,
Moxeno, native, Quechua, rain-forest indigenous, Tacana. The mestizo category includes the following
responses: mestizo, mestizo (ladino), mestizo (creole), mixed (white and indigenous). The white category
includes the following responses: white, blanco.
Afro-descendant dummy. Dummy variable equal to 1, if the respondent is classified as Afro-descendant,
and 0, otherwise.
Religion. Four categories: Catholic, Protestant, unaffiliated, other.
Education. Level of educational attainment, five categories: less than elementary; complete primary or
middle school; some or complete high school; technical or some university; complete university or higher.
Shortage of money. Identical to the definition in section 3 analysis, see above.
Household size. Identical to the definition in section 3 analysis, see above.
Region-level variables in section 4 (Latin America)
Nighttime lights per capita. Identical to the definition in section 3 analysis (see above), but uses 2014
LandScan data to calculate regional population size.
Distance to the coastline. Identical to the definition in section 3 analysis, see above.
Elevation. Elevation data at the pixel level are available from the USGS GTOPO30 digital dataset at 30
arc-second resolution. Mean elevation is calculated as the average value across pixels in each region and is
measured in meters. Source: own calculations using the raster file downloaded at http://www.fao.org/
geonetwork/srv/en/main.home.
Regional share in the tropical coastal lowlands. Share of region’s area located in the zone de-
fined as “tropical coastal lowlands” representing a set of level-II and level-III ecological regions of Latin
America. Level-II regions are: Dry Gulf of Mexico Coastal Plains and Hills, Northwestern Plain of the
Yucatan Peninsula, Southern Pacific Coastal Plains and Hills, Humid Gulf of Mexico Coastal Plains
and Hills, Yucatan Peninsula Plains and Hills, Sierra Los Tuxtlas, Western Pacific Plain and Hills, So-
conusco/Guatemalan Coastal Plains and Hills, Greater Antilles, Caribe/Pacific Lowland Plains and Hills,
Venezuelan Coastal Andes, Peruvian/Atacaman Deserts, Amazon and Coastal Lowlands, Caatinga, and
Atlantic Forests. The coastal area of the Amazon and Coastal Lowlands in the Amazon river mouth region
is delineated using the boundary of the Marajo varzea subregion as depicted in the World Wildlife Fund’s
map of terrestrial ecoregions. Level-III regions are: Pacific Volcanic Lowlands, Caribbean Coastal Plains
and Hills, Miskito Lowland Pine Savanna, Costa Rica/Panama Pacific Plains and Hills, Gurupi Plains and
Low Tablelands, Northern Maranhao Plains, Northern Piauı Plains, Espinhaco/Diamantina Hills and Low
43
Mountains, Brazil/Uruguay Coastal Pampa. Source: own calculations, original digital maps of ecoregions
are available at http://ecologicalregions.info.
Pew Forum individual-level variables in section 5 (placebo test)
Raw data and documentation for “The World’s Muslims” are available at http://www.pewforum.org/
datasets.
Personal belief in witchcraft. Identical to the definition in section 3 analysis, see above.
Education. Level of educational attainment, six categories: no schooling; some/complete primary school;
some/complete middle school; some/complete high school; technical or some university; university or
higher.
Household size. Identical to the definition in section 3 analysis, see above.
Region-level variables in section 5 (placebo test)
Nighttime lights per capita. Identical to the definition in section 3 analysis (see above), but uses 2014
LandScan data to calculate regional population size.
Distance to the coastline. Identical to the definition in section 3 analysis, see above; measured in
kilometers. Excludes the (inland) Caspian Sea and the Arctic ocean coastline.
Elevation. Identical to the definition in section 4 analysis (see above), but using GTOPO30 panels
covering the countries of interest; measured in kilometers. Source: own calculations using the raster file
downloaded at https://webmap.ornl.gov/ogc/dataset.jsp?ds_id=10003.
44
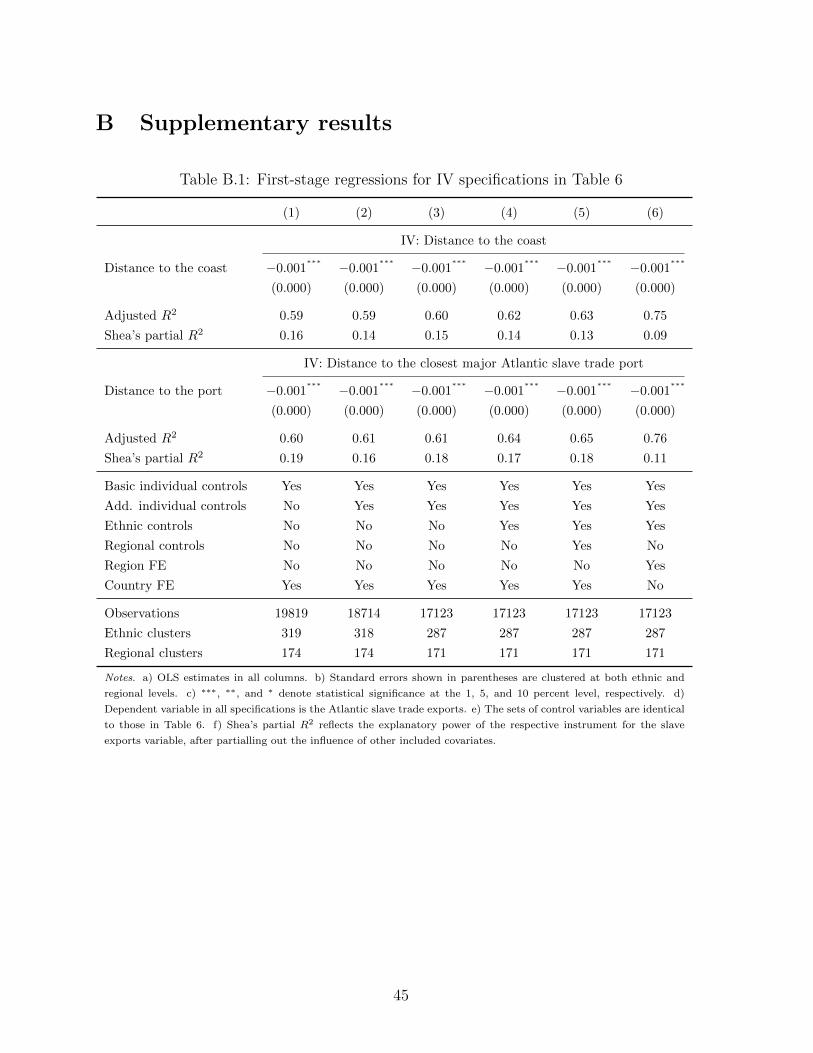
B Supplementary results
Table B.1: First-stage regressions for IV specifications in Table 6
(1) (2) (3) (4) (5) (6)
IV: Distance to the coast
Distance to the coast −0.001∗∗∗ −0.001
∗∗∗ −0.001∗∗∗ −0.001
∗∗∗ −0.001∗∗∗ −0.001
∗∗∗
(0.000) (0.000) (0.000) (0.000) (0.000) (0.000)
Adjusted R2 0.59 0.59 0.60 0.62 0.63 0.75
Shea’s partial R2 0.16 0.14 0.15 0.14 0.13 0.09
IV: Distance to the closest major Atlantic slave trade port
Distance to the port −0.001∗∗∗ −0.001
∗∗∗ −0.001∗∗∗ −0.001
∗∗∗ −0.001∗∗∗ −0.001
∗∗∗
(0.000) (0.000) (0.000) (0.000) (0.000) (0.000)
Adjusted R2 0.60 0.61 0.61 0.64 0.65 0.76
Shea’s partial R2 0.19 0.16 0.18 0.17 0.18 0.11
Basic individual controls Yes Yes Yes Yes Yes Yes
Add. individual controls No Yes Yes Yes Yes Yes
Ethnic controls No No No Yes Yes Yes
Regional controls No No No No Yes No
Region FE No No No No No Yes
Country FE Yes Yes Yes Yes Yes No
Observations 19819 18714 17123 17123 17123 17123
Ethnic clusters 319 318 287 287 287 287
Regional clusters 174 174 171 171 171 171
Notes. a) OLS estimates in all columns. b) Standard errors shown in parentheses are clustered at both ethnic and
regional levels. c) ∗∗∗, ∗∗, and ∗ denote statistical significance at the 1, 5, and 10 percent level, respectively. d)
Dependent variable in all specifications is the Atlantic slave trade exports. e) The sets of control variables are identical
to those in Table 6. f) Shea’s partial R2 reflects the explanatory power of the respective instrument for the slave
exports variable, after partialling out the influence of other included covariates.
45
References
Acemoglu, Daron, Camilo Garcıa-Jimeno, and James A. Robinson, “Finding
Eldorado: Slavery and long-run development in Colombia,” Journal of Comparative
Economics, November 2012, 40 (4), 534–564.
, Simon Johnson, and James A. Robinson, “Institutions as a Fundamental Cause
of Long-Run Growth,” in Philippe Aghion and Steven N. Durlauf, eds., Handbook of
Economic Growth, Vol. 1A, Amsterdam: Elsevier, 2005, chapter 6, pp. 385–472.
Acharya, Avidit, Matthew Blackwell, and Maya Sen, “The Political Legacy of
American Slavery,” Journal of Politics, July 2016, 78 (3), 621–641.
Adhikari, Kaustubh, Javier Mendoza-Revilla, Juan Camilo Chacon-Duque,
Macarena Fuentes-Guajardo, and Andres Ruiz-Linares, “Admixture in Latin
America,” Current Opinion in Genetics & Development, 2016, 41, 106–114.
Andrews, George Reid, Afro-Latin America: Black Lives, 1600–2000, Cambridge, MA:
Harvard University Press, 2016.
Argenti, Nicolas, The Intestines of the State: Youth, Violence, and Belated Histories in
the Cameroon Grassfields, Chicago, IL: University of Chicago Press, 2007.
Austen, Ralph E., “The Moral Economy of Witchcraft: An Essay in Comparative His-
tory,” in Jean Comaroff and John L. Comaroff, eds., Modernity and Its Malcontents:
Ritual and Power in Postcolonial Africa, Chicago, IL: University of Chicago Press,
1993, chapter 4, pp. 89–110.
Bay, Edna B., “Protection, Political Exile, and the Atlantic Slave Trade: History and
Collective Memory in Dahomey,” Slavery & Abolition, 2001, 22 (1), 22–41.
Becker, Sascha O., Katrin Boeckh, Christa Hainz, and Ludger Woessmann,
“The Empire Is Dead, Long Live the Empire! Long-Run Persistence of Trust and
Corruption in the Bureaucracy,” Economic Journal, February 2016, 126 (590), 40–74.
Bertocchi, Graziella, “The Legacies of Slavery In and Out of Africa,” IZA Journal of
Migration, 2016, 5 (24), 1–19.
and Arcangelo Dimico, “Slavery, Education, and Inequality,” European Economic
Review, August 2014, 70, 197–209.
46
Bruhn, Miriam and Francisco A. Gallego, “Good, Bad, and Ugly Colonial Activities:
Do They Matter for Economic Development?,” Review of Economics and Statistics,
May 2012, 94 (2), 433–461.
Dalton, John T. and Tin Cheuk Leung, “Why Is Polygyny More Prevalent in Western
Africa? An African Slave Trade Perspective,” Economic Development and Cultural
Change, July 2014, 62 (4), 599–632.
de Rosny, Eric, Healers in the Night, Maryknoll, NY: Orbis Books, 1985.
Esposito, Elena, “Side Effects of Immunities: African Slavery in the U.S. South,” 2016.
Working Paper, European University Institute.
Fenske, James, “Does Land Abundance Explain African Institutions?,” Economic Jour-
nal, December 2013, 123 (573), 1363–1390.
Ferreira, Roquinaldo Amaral, Cross-Cultural Exchange in the Atlantic World: Angola
and Brazil during the Era of the Slave Trade, Cambridge University Press, 2012.
Forsyth, Miranda, “The Regulation of Witchcraft and Sorcery Practices and Beliefs,”
Annual Review of Law and Social Science, 2016, 12, 331–351.
Fyfe, Christopher, “Peter Nicholls – Old Calabar and Freetown,” Journal of the Histor-
ical Society of Nigeria, 1960, 2 (1), 105–114.
Gallup, John Luke, Alejandro Gaviria, and Eduardo Lora, Is Geography Destiny?
Lessons from Latin America, Washington, D.C.: Inter-American Development Bank,
2003.
Galor, Oded and Omer Ozak, “The Agricultural Origins of Time Preference,” American
Economic Review, October 2016, 106 (10), 3064–3103.
Gershman, Boris, “The Economic Origins of the Evil Eye Belief,” Journal of Economic
Behavior & Organization, February 2015, 110, 119–144.
, “Witchcraft Beliefs and the Erosion of Social Capital: Evidence from Sub-Saharan
Africa and Beyond,” Journal of Development Economics, May 2016, 120, 182–208.
, “Long-Run Development and the New Cultural Economics,” in Matteo Cervelatti
and Uwe Sunde, eds., Demographic Change and Long-Run Development, Cambridge,
MA: MIT Press, 2017, chapter 9, pp. 221–261.
47
and Diego Rivera, “Measuring Regional Ethnolinguistic Diversity in Sub-Saharan
Africa: Surveys vs. GIS,” August 2016. Working Paper, American University.
and , “Subnational Diversity in Sub-Saharan Africa: Insights from a New
Dataset,” September 2016. Working Paper, American University.
Griffith, Glenn E., James M. Omernik, and Sandra H. Azevedo, “Ecological clas-
sification of the Western Hemisphere,” Technical Report, U.S. Environmental Protec-
tion Agency, Western Ecology Division, Corvallis, OR, 1998.
Gustafsson, Kalle, “The Trade in Slaves in Ovamboland, ca. 1850–1910,” African Eco-
nomic History, 2005, 33, 31–68.
Hair, Paul Edward Hedley, “Heretics, Slaves and Witches: As Seen by Guinea Jesuits
c. 1610,” Journal of Religion in Africa, 1998, 28 (2), 131–144.
Harms, Robert W., River of Wealth, River of Sorrow: The Central Zaire Basin in the
Era of the Slave and Ivory Trade, 1500–1891, New Haven and London: Yale University
Press, 1981.
Hawthorne, Walter, From Africa to Brazil: Culture, Identity, and an Atlantic Slave
Trade, 1600–1830, Cambridge University Press, 2010.
Henderson, J. Vernon, Adam Storeygard, and David N. Weil, “Measuring Eco-
nomic Growth from Outer Space,” American Economic Review, April 2012, 102 (2),
994–1028.
Heywood, Linda M., “Slavery and Its Transformation in the Kingdom of Kongo: 1491–
1800,” Journal of African History, 2009, 50 (1), 1–22.
Hijmans, Robert J., Susan E. Cameron, Juan L. Parra, Peter G. Jones, and
Andy Jarvis, “Very High Resolution Interpolated Climate Surfaces for Global Land
Areas,” International Journal of Climatology, 2005, 25, 1965–1978.
Hinfelaar, Hugo F., “Witch-Hunting in Zambia and International Illegal Trade,” in Ger-
rie ter Haar, ed., Imagining Evil: Witchcraft Beliefs and Accusations in Contemporary
Africa, Africa World Press, Inc, 2007, chapter 10, pp. 229–245.
Kiszewski, Anthony, Andrew Mellinger, Andrew Spielman, Pia Malaney,
Sonya Ehrlich Sachs, and Jeffrey Sachs, “A Global Index Representing the Sta-
bility of Malaria Transmission,” American Journal of Tropical Medicine and Hygiene,
May 2004, 70 (5), 486–498.
48
Lane, Kris, “Africans and Natives in the Mines of Spanish America,” in Matthew Restall,
ed., Beyond Black and Red: African-Native Relations in Colonial Latin America,
Albuquerque, NM: University of New Mexico Press, 2005, chapter 6, pp. 159–184.
Law, Robin, “West Africa’s Discovery of the Atlantic,” International Journal of African
Historical Studies, 2011, 44 (1), 1–25.
Leeson, Peter T., “Oracles,” Rationality and Society, May 2014, 26 (2), 141–169.
and Jacob W. Russ, “Witch Trials,” Economic Journal, 2017, forthcoming.
Lowes, Sara, Nathan Nunn, James A. Robinson, and Jonathan Weigel, “The
Evolution of Culture and Institutions: Evidence from the Kuba Kingdom,” Econo-
metrica, July 2017, 85 (4), 1065–1091.
MacGaffey, Wyatt, “Kongo and the King of the Americans,” Journal of Modern African
Studies, August 1968, 6 (2), 171–181.
, “The West in Congolese Experience,” in Philip D. Curtin, ed., Africa and the West:
Intellectual Responses to European Culture, Madison, WI: University of Wisconsin
Press, 1972, chapter 24, pp. 49–74.
Mellafe, Rolando, Negro Slavery in Latin America, Berkeley and Los Angeles: University
of California Press, 1975.
Michalopoulos, Stelios, Louis Putterman, and David N. Weil, “The Influence of
Ancestral Lifeways on Individual Economic Outcomes in Sub-Saharan Africa,” Jan-
uary 2016. NBER Working Paper No. 21907.
Miguel, Edward, “Poverty and Witch Killing,” Review of Economic Studies, October
2005, 72 (4), 1153–1172.
Morgan, Philip D., “The Cultural Implications of the Atlantic Slave Trade: African
Regional Origins, American Destinations and New World Developments,” Slavery &
Abolition, 1997, 18 (1), 122–145.
Muela, Susanna Hausmann, Joan Muela Ribera, and Marcel Tanner, “Fake
Malaria and Hidden Parasites – The Ambiguity of Malaria,” Anthropology & Medicine,
1998, 5 (1), 43–61.
Murdock, George P., Africa: Its Peoples and Their Cultural History, New York:
McGraw-Hill Book Company, 1959.
49
, Ethnographic Atlas, Pittsburgh, PA: University of Pittsburgh Press, 1967.
and Caterina Provost, “Measurement of Cultural Complexity,” Ethnology, October
1973, 12 (4), 379–392.
Nunn, Nathan, “The Long-Term Effects of Africa’s Slave Trades,” Quarterly Journal of
Economics, February 2008, 123 (1), 139–176.
, “Slavery, Inequality, and Economic Development in the Americas: An Examination
of the Engerman-Sokoloff Hypothesis,” in Elhanan Helpman, ed., Institutions and
Economic Performance, Cambridge, MA: Harvard University Press, 2008, chapter 4,
pp. 148–180.
, “Historical Development,” in Philippe Aghion and Steven N. Durlauf, eds., Handbook
of Economic Growth, Vol. 2A, Elsevier, 2014, chapter 7, pp. 347–402.
, “Understanding the Long-Run Effects of Africa’s Slave Trades,” in Stelios
Michalopoulos and Elias Papaioannou, eds., The Long Economic and Political Shadow
of History, Vol. 2, CEPR Press, 2017, chapter 2, pp. 36–47.
and Leonard Wantchekon, “The Slave Trade and the Origins of Mistrust in
Africa,” American Economic Review, December 2011, 101 (7), 3221–3252.
and Raul Sanchez de la Sierra, “Why Being Wrong Can Be Right: Magical War-
fare Technologies and the Persistence of False Beliefs,” American Economic Review
Papers & Proceedings, May 2017, 107 (5), 582–587.
Nwokeji, G. Ugo, The Slave Trade and Culture in the Bight of Biafra: An African Society
in the Atlantic World, Cambridge University Press, 2010.
Obikili, Nonso, “The Impact of the Slave Trade on Literacy in West Africa: Evidence
from the Colonial Era,” Journal of African Economies, January 2016, 25 (1), 1–27.
Olwig, Karen Fog, “African Cultural Principles in Caribbean Slave Societies: A View
From the Danish West Indies,” in Stephan Palmie, ed., Slave Cultures and the Cultures
of Slavery, Knoxville, TN: The University of Tennessee Press, 1995, chapter 3, pp. 23–
39.
Oster, Emily, “Witchcraft, Weather and Economic Growth in Renaissance Europe,”
Journal of Economic Perspectives, Winter 2004, 18 (1), 215–228.
50
Palmie, Stephan, Wizards and Scientists: Explorations in Afro-Cuban Modernity and
Tradition, Durham and London: Duke University Press, 2002.
Paton, Diana, “Witchcraft, Poison, Law, and Atlantic Slavery,” William and Mary Quar-
terly, April 2012, 69 (2), 235–264.
Pierce, Lamar and Jason A. Snyder, “The Historical Slave Trade and Firm Access to
Finance in Africa,” Review of Financial Studies, 2017, forthcoming.
Roschenthaler, Ute M., “Translocal Cultures: The Slave Trade and Cultural Transfer
in the Cross River Region,” Social Anthropology, February 2006, 14 (1), 71–91.
Schneider, Udo, Andreas Becker, Peter Finger, Anja Meyer-Christoffer, Bruno
Rudolf, and Markus Ziese, “GPCC Full Data Reanalysis Version 7.0 at 0.5:
Monthly Land-Surface Precipitation from Rain-Gauges Built on GTS-based and His-
toric Data,” May 2015.
Schuler, Monica, “Afro-American Slave Culture,” in Michael Craton, ed., Roots and
Branches: Current Directions in Slave Studies, Pergamon Press, 1979, pp. 121–137.
Shaw, Rosalind, “The Production of Witchcraft / Witchcraft as Production: Memory,
Modernity, and the Slave Trade in Sierra Leone,” American Ethnologist, November
1997, 24 (4), 856–876.
, Memories of the Slave Trade: Ritual and the Historical Imagination in Sierra Leone,
Chicago, IL: University of Chicago Press, 2002.
Sweet, James Hoke, Recreating Africa: Culture, Kinship, and Religion in the African-
Portuguese World, 1441–1770, Chapell Hill and London: The University of North
Carolina Press, 2003.
Teso, Edoardo, “The Long-Term Effect of Demographic Shocks on the Evolution of
Gender Roles: Evidence from the Transatlantic Slave Trade,” July 2016. Working
Paper, Department of Economics, Harvard University.
Thornton, John, “Cannibals, Witches, and Slave Traders in the Atlantic World,” The
William and Mary Quarterly, April 2003, 60 (2), 273–294.
Vansina, Jan, “Ambaca Society and the Slave Trade c. 1760–1845,” Journal of African
History, 2005, 46 (1), 1–27.
51
Warnier, Jean-Pierre, “Slave-Trading without Slave-Raiding in Cameroon,” Paideuma,
1995, 41, 251–272.
Whatley, Warren, “The Transatlantic Slave Trade and the Evolution of Political Au-
thority in West Africa,” in E. Akyeampong, R. Bates, N. Nunn, and J. Robinson,
eds., African Development in Historical Perspective, Cambridge: Cambridge Univer-
sity Press, 2014, chapter 15, pp. 460–488.
and Rob Gillezeau, “The Impact of the Transatlantic Slave Trade on Ethnic Strat-
ification in Africa,” American Economic Review Papers & Proceedings, May 2011, 101
(3), 571–576.
Young, Jason R., Rituals of Resistance: African Atlantic Religion in Kongo and the
Lowcountry South in the Era of Slavery, Baton Rouge, LA: Louisiana State University
Press, 2007.
Zelinsky, Wilbur, “The Historical Geography of the Negro Population of Latin America,”
Journal of Negro History, April 1949, 34 (2), 153–221.
52