Embed Size (px)
Citation preview

Wisnik Career Enterprises, Inc.
www.wisnik.com
212.370.1010 ● [email protected]
Wisnik Law Firm Marketing / BD
Survey 2016
By Eva Wisnik
November 2016

©2016 Wisnik Career Enterprises, Inc. 2
Our Goal Is To Help You Achieve Your Goals
Dear Friends of Wisnik,
We wanted to share the current findings from the 2016 Wisnik Law Firm Marketing/BD Survey with you. The following information is based on a survey sent to all levels of legal Marketing and BD professionals at top law firms across the nation in June 2016. The results that follow were generated from 367 responses. Thank you to all of those who participated!
Our goal in sharing this information with you is to offer benchmarks for where you, your staff, and your department fall as compared to your peers. We believe that these salary and bonus numbers reflect the current market accurately. By this, I mean that if a firm were to call tomorrow and ask us what they needed to pay a BD manager, we would confidently quote them the numbers in this report. We have found that the new jobs we have received since January fall into these ranges.
We hope that you find the enclosed information valuable. Your responses to this Wisnik Law Firm Marketing/BD Survey help us to capture and confirm market trends. As for the market, we have definitely seen a continued increase in new law firm Marketing/BD positions throughout the year and are hopeful that new opportunities will continue to grow. Have a wonderful Thanksgiving and New Year and please let us know if there is any way we can help you achieve your goals!
All the best,
Eva Wisnik

3 ©2014 Wisnik Career Enterprises, Inc.
Biography
Eva Wisnik founded Wisnik Career Enterprises, Inc. in 1996 after serving as Director of Recruitment and Training for Schulte Roth & Zabel and Cadwalader, Wickersham & Taft. Over the past 20 years, she has worked with over 100 law firms, including 74 of the AmLaw 100. Eva has placed over 800 Marketing and BD professionals into law firms nation-wide, and has conducted over 600 training programs for attorneys on topics that include Business Development Skills, Time Management and Myers Briggs. In addition, Wisnik Career Enterprises, Inc. has conducted over 35 salary surveys for law firm professionals since 1998.
Eva holds an MBA in Marketing from Fordham University and a BA in Psychology from Barnard College.
Eva Wisnik
President,
Wisnik Career
Enterprises, Inc.

©2016 Wisnik Career Enterprises, Inc.
Table of Contents
4
©2016 Wisnik Career Enterprises, Inc. 5
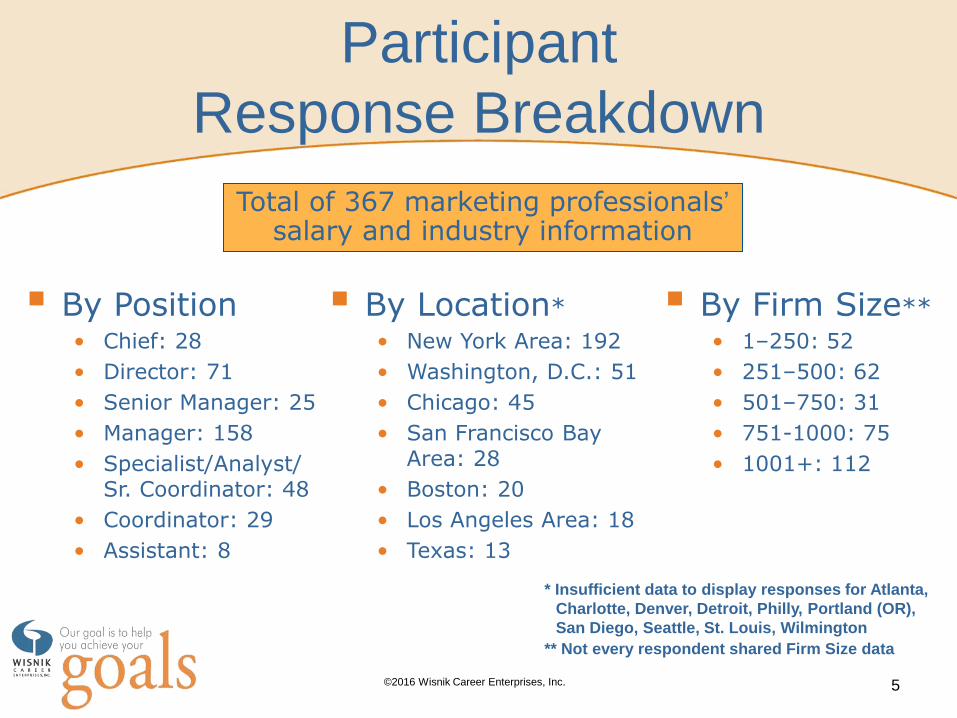
Participant
Response Breakdown
Total of 367 marketing professionals’ salary and industry information
By Position • Chief: 28
• Director: 71
• Senior Manager: 25
• Manager: 158
• Specialist/Analyst/ Sr. Coordinator: 48
• Coordinator: 29
• Assistant: 8
By Firm Size** • 1–250: 52
• 251–500: 62
• 501–750: 31
• 751-1000: 75
• 1001+: 112
By Location* • New York Area: 192
• Washington, D.C.: 51
• Chicago: 45
• San Francisco Bay Area: 28
• Boston: 20
• Los Angeles Area: 18
• Texas: 13
* Insufficient data to display responses for Atlanta,
Charlotte, Denver, Detroit, Philly, Portland (OR),
San Diego, Seattle, St. Louis, Wilmington
** Not every respondent shared Firm Size data

©2016 Wisnik Career Enterprises, Inc. 6
Summary of Interesting Survey Results
80% received a bonus AND a raise last year; 15% received either a
bonus OR a raise
30.7% have been promoted with a title change in the last 2 years
39% of ALL respondents have a graduate degree (JD, Master’s, or MBA)
and 52.5% of Chiefs and Directors have a graduate degree
51.7% say their department has increased in size in the last 2 years
84.6% of you plan to be in legal marketing 2 years from now
10% of respondents joined legal marketing/BD in the last 2 years
37% joined their current firm in the last 2 years
58% have been in legal marketing/BD for more than 8 years

Profile of a Marketing/BD
Professional

©2016 Wisnik Career Enterprises, Inc.
2016 Highest Degree of Education,
by Job Title
8
J.D. 20%
Other 4%
Master's/ MBA 8%
Bachelor's 68%
Senior Manager
J.D. 21%
Other 3%
Master's/ MBA 28%
Bachelor's 48%
Director
J.D. 19%
Other 3%
Master's/ MBA 21%
Bachelor's 57%
Chief
J.D. 16%
Other 2%
Master's/ MBA 22%
Bachelor's 60%
All Respondents

©2016 Wisnik Career Enterprises, Inc.
2016 Highest Degree of Education,
by Job Title (cont’d)
Master's/ MBA 3.5%
Bachelor's 89.5%
JD 7%
Coordinator 9
J.D. 16%
Other 1%
Master's/ MBA 24%
Bachelor's 59%
Manager
Bachelor's 100%
Assistant
J.D. 10.5%
Master's/ MBA 25% Bachelor's
64.5%
Spec./Analyst/ Sr. Coord.
©2016 Wisnik Career Enterprises, Inc.
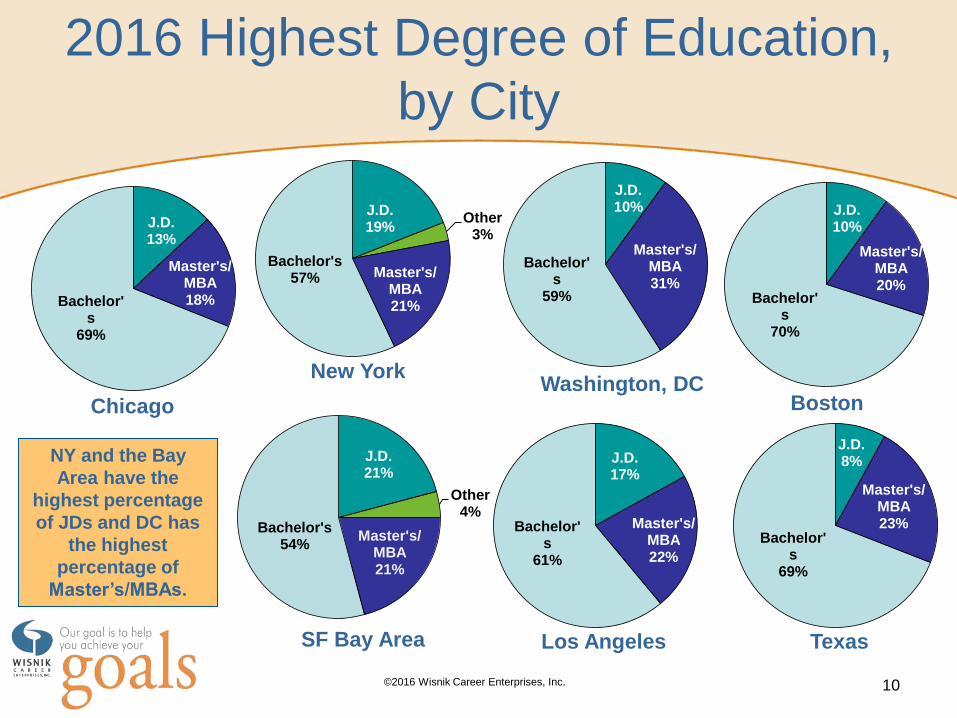
2016 Highest Degree of Education,
by City
10
J.D. 10%
Master's/ MBA 31%
Bachelor's
59%
Washington, DC
J.D. 21%
Other 4%
Master's/ MBA 21%
Bachelor's 54%
SF Bay Area
J.D. 19%
Other 3%
Master's/ MBA 21%
Bachelor's 57%
New York
J.D. 13%
Master's/ MBA 18% Bachelor'
s 69%
Chicago
J.D. 10%
Master's/ MBA 20%
Bachelor's
70%
Boston
J.D. 17%
Master's/ MBA 22%
Bachelor's
61%
Los Angeles
J.D. 8%
Master's/ MBA 23%
Bachelor's
69%
Texas
NY and the Bay
Area have the
highest percentage
of JDs and DC has
the highest
percentage of
Master’s/MBAs.
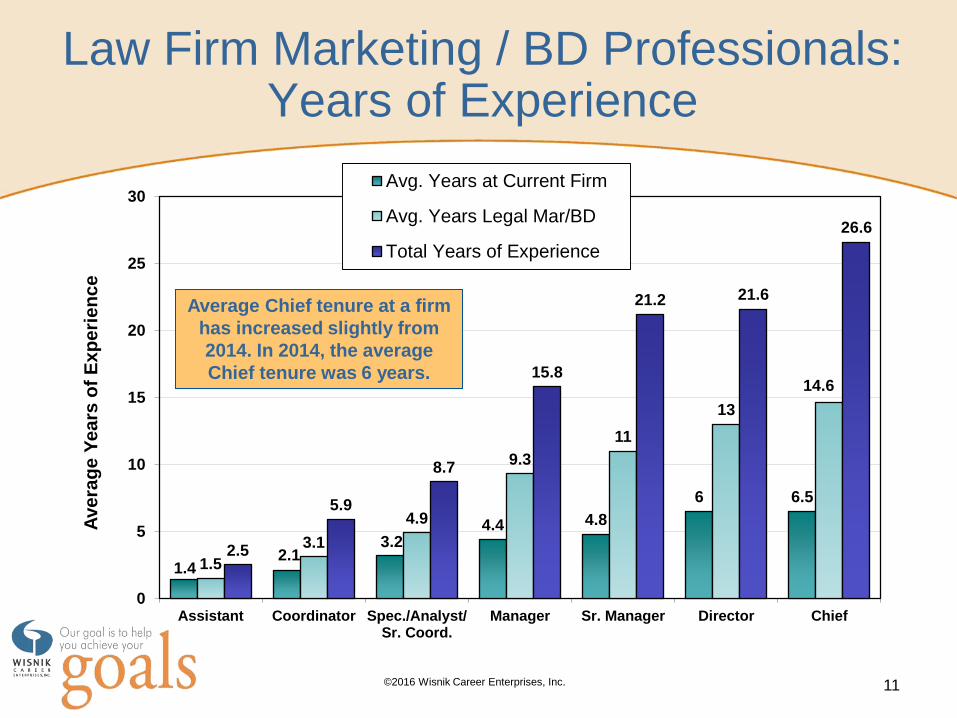
©2016 Wisnik Career Enterprises, Inc. 11
Law Firm Marketing / BD Professionals: Years of Experience
1.4 2.1
3.2 4.4 4.8
6 6.5
1.5
3.1
4.9
9.3
11
13
14.6
2.5
5.9
8.7
15.8
21.2 21.6
26.6
0
5
10
15
20
25
30
Assistant Coordinator Spec./Analyst/Sr. Coord.
Manager Sr. Manager Director Chief
Ave
rag
e Y
ea
rs o
f E
xp
eri
en
ce
Avg. Years at Current Firm
Avg. Years Legal Mar/BD
Total Years of Experience
Average Chief tenure at a firm
has increased slightly from
2014. In 2014, the average
Chief tenure was 6 years.

Wisnik Salary Findings

©2016 Wisnik Career Enterprises, Inc. 13
2016 Average Salaries, By Title
Title (# responses
with salary data)
Avg.
Salary
Median 25 - 75%
Range
Avg.
Bonus
Avg.
Raise
Chief (25): $325,288 $310,000 $235k - $375k $47,187 3.3%
Director (67): $229,940 $218,000 $186k - $270k $26,399 4.9%
Sr. Manager (22): $176,341 $180,250 $142k - $200k $13,124 5.8%
Manager (152): $131,737 $129,890 $112k - $150k $8,333 5.6%
Specialist/Analyst
Sr. Coord. (46): $81,536 $79,250 $72k - $91k $4,001 4.4%
Coordinator (26): $59,740 $60,000 $53.5k - $65k $2,579 3.7%
Assistant (7): $46,429 $44,000 $43k - $47.5k $1,850 3.6%
Notes: i) Salary data shown is base salary; ii) Number of respondents is fewer
than reported on slide 4, as not every respondent provided salary data

©2016 Wisnik Career Enterprises, Inc. 14
2016 Average Salaries by City:
NY, DC, Chicago, Bay Area, Boston, LA
Average Salary
Title New York DC Chicago Bay Area Boston LA Area
Chief: $305,300 * $282,500 $309,802 * *
Director: $249,737 $242,000 $164,750 $217,667 $220,750 $186,750
Sr. Manager: $192,600 $171,250 * * * *
Manager $137,937 $124,503 $130,763 $135,438 $114,470 $105,500
Spec./Analyst/
Sr. Coord. $83,362 $85,583 $75,213 * * *
Coordinator $60,577 $59,321 * * * *
14
* Insufficient number of respondents
©2016 Wisnik Career Enterprises, Inc. 15
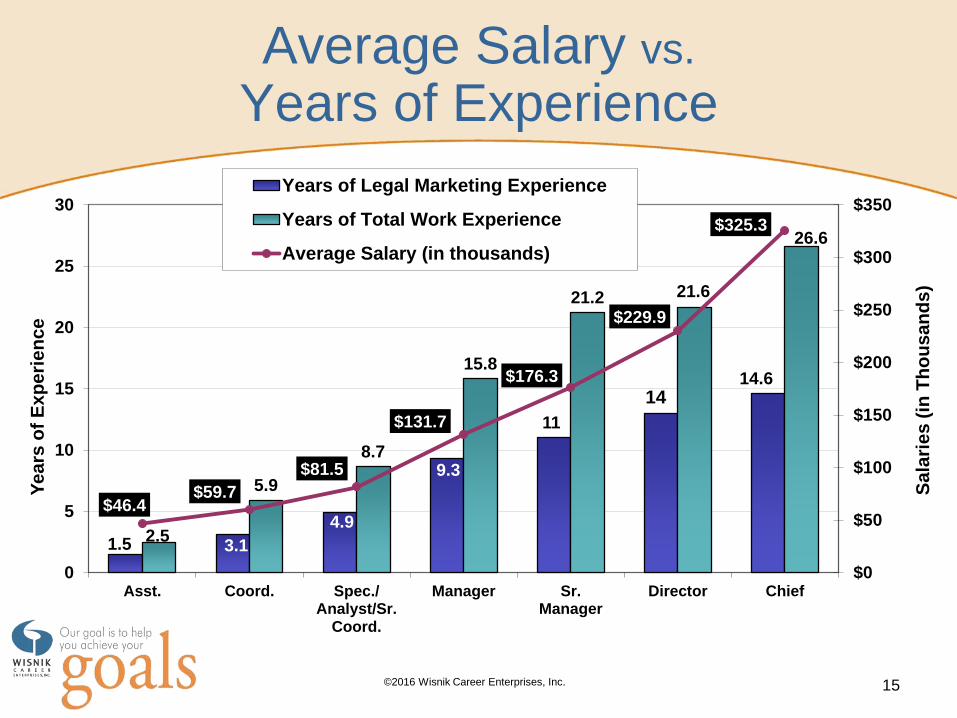
Average Salary vs. Years of Experience
1.5 3.1
4.9
9.3
11
14 14.6
2.5
5.9
8.7
15.8
21.2 21.6
26.6
$46.4 $59.7
$81.5
$131.7
$176.3
$229.9
$325.3
$0
$50
$100
$150
$200
$250
$300
$350
0
5
10
15
20
25
30
Asst. Coord. Spec./Analyst/Sr.
Coord.
Manager Sr.Manager
Director Chief
Sa
lari
es
(in
Th
ou
sa
nd
s)
Ye
ars
of
Ex
pe
rie
nc
e
Years of Legal Marketing Experience
Years of Total Work Experience
Average Salary (in thousands)
©2016 Wisnik Career Enterprises, Inc.
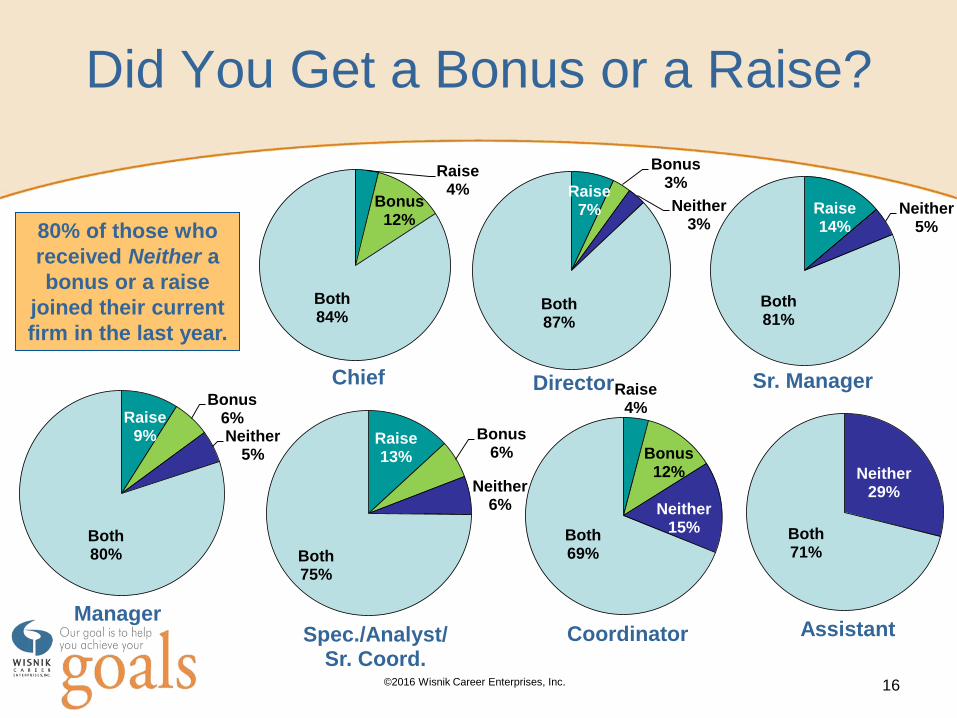
Did You Get a Bonus or a Raise?
Raise 4%
Bonus 12%
Neither 15%
Both 69%
Coordinator
16
Raise 14%
Neither 5%
Both 81%
Sr. Manager
Raise 7%
Bonus 3%
Neither 3%
Both 87%
Director
Raise 4%
Bonus 12%
Both 84%
Chief
Neither 29%
Both 71%
Assistant
Raise 13%
Bonus 6%
Neither 6%
Both 75%
Spec./Analyst/ Sr. Coord.
Raise 9%
Bonus 6% Neither
5%
Both 80%
Manager
80% of those who
received Neither a
bonus or a raise
joined their current
firm in the last year.

©2016 Wisnik Career Enterprises, Inc.
Yes 54%
No 46%
Coordinator
17
Yes 64%
No 36%
Sr. Manager
Yes 69%
No 31%
Director
Yes 74%
No 26%
Chief
Yes 43% No
57%
Assistant
Yes 65%
No 35%
Spec./Analyst/ Sr. Coord.
Are You Satisfied with Your Compensation?
Yes 66%
No 34%
Manager
Overall, 65.8% of
respondents are
satisfied with their
compensation.

©2016 Wisnik Career Enterprises, Inc.
Yes 67%
No 33%
Yes 57%
No 43%
Yes 73%
No 27%
DC Boston Chicago
By City, Are You Satisfied with Your Compensation?
Yes 67%
No 33%
SF Bay Area
Yes 75%
No 25%
Texas
Yes 66%
No 34%
New York
Yes 59%
No 41%
LA Area
Respondents from
DC and Texas are
most satisfied
with their
compensation.
18
©2016 Wisnik Career Enterprises, Inc.
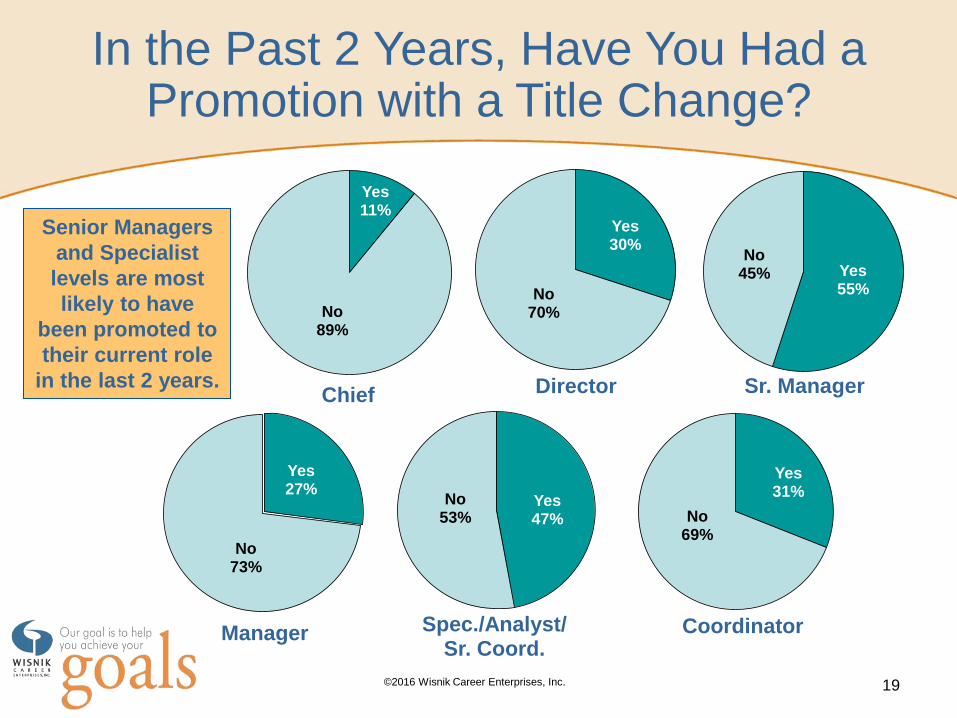
Yes 47%
No 53%
Spec./Analyst/ Sr. Coord.
19
Yes 55%
No 45%
Sr. Manager
Yes 30%
No 70%
Director
Yes 11%
No 89%
Chief
Yes 31%
No 69%
Coordinator
Yes 27%
No 73%
Manager
In the Past 2 Years, Have You Had a Promotion with a Title Change?
Senior Managers
and Specialist
levels are most
likely to have
been promoted to
their current role
in the last 2 years.

Industry Findings:
Compensation Trends Over Time
for NY, DC and Chicago
NOTE: Prior surveys only drew data from NY,
DC, and Chicago; to calculate the 2016
comparison number, we averaged salary data
from only those three cities. Thus, the average
salary on the following slide is different from the
“all cities” number reported on other slides.

©2016 Wisnik Career Enterprises, Inc. 21
$0
$50
$100
$150
$200
$250
Assistant Coordinator Spec./Analyst/Sr. Coord.
Manager Director
$45 $58
$84
$128
$209
$46 $58
$80
$135
$218
$47 $60
$83
$134
$242
Sa
lary
(in
th
ou
sa
nd
s)
2013 2014 2016
Mar/BD Professionals (NY, DC, Chicago): Average Salary Comparisons, 2013 - 2016
Salary Percent
Change from 2013:
• Assistants: +4.4%
• Coordinators: +3.4%
• Spec./Analyst/
Sr. Coord.: -1.2%
• Managers: +4.7%
• Directors: +15.8%
* Insufficient data for Chiefs

Industry Findings:
Firm Structure & Staffing

©2016 Wisnik Career Enterprises, Inc. 23
Size of Firm vs. Size of Marketing Department
0
20
40
60
80
100
1 - 250 251 - 500 501 - 750 751 - 1000 1001+
7.1
18.7
30.6
41.1
98.3
Ave
rag
e D
ep
art
me
nt
Siz
e
Firm Size
Separate or Combined Departments?
Overall, 83.5% of respondents say they
have combined Marketing/Communications
and BD departments.

©2016 Wisnik Career Enterprises, Inc.
In the Past 2 Years, Has Your
Department Size Changed?
501 -750
251 - 500 1 - 250
All Respondents
751 - 1000
Increased 51.7%
Decreased 8.4%
No Change
37%
Incr. 29%
Decr. 16%
Same 55%
Incr. 45%
Decr. 14%
Same 41%
Incr. 43%
Decr. 14%
Same 43%
24
1001+
Incr. 68%
Decr. 6%
Same 26%
Incr. 68%
Decr. 10%
Same 22%

©2016 Wisnik Career Enterprises, Inc.
Chicago
Department Size Changes: City Comparison*
New York
Incr. 50%
Decr. 12.5%
Same 37.5%
25
D.C.
Incr. 46%
Decr. 17%
Same 37%
Incr. 49%
Decr. 11%
Same 40% * Insufficient
data for Texas
SF Bay Area
Boston
Incr. 58% Decr.
17%
Same 25%
LA Area
Incr. 53%
Decr. 6%
Same 41%
Incr. 75%
Same 25%

©2016 Wisnik Career Enterprises, Inc.
Do You Think Your Department is Adequately Staffed?
All Respondents
Yes 45.5% No
55.5%
26

©2016 Wisnik Career Enterprises, Inc. 27
Average Hours Worked Per Week, Since January 1, 2016: By Title
43.4 44.5 44.2
48.1 50.9 50.8
53.5
0
10
20
30
40
50
60
Asst. Coord. Spec./Analyst/Sr. Coord.
Manager Sr. Manager Director Chief
Ave
rag
e W
ee
kly
Ho
urs
©2016 Wisnik Career Enterprises, Inc. 28
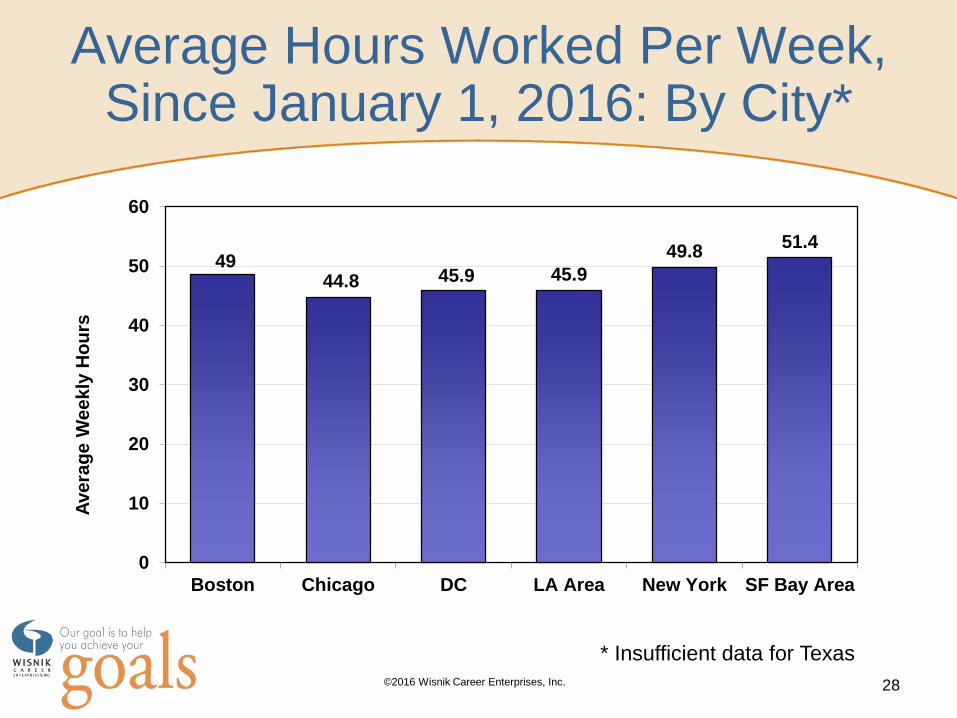
Average Hours Worked Per Week, Since January 1, 2016: By City*
49 44.8 45.9 45.9
49.8 51.4
0
10
20
30
40
50
60
Boston Chicago DC LA Area New York SF Bay Area
Ave
rag
e W
ee
kly
Ho
urs
* Insufficient data for Texas
©2016 Wisnik Career Enterprises, Inc. 29
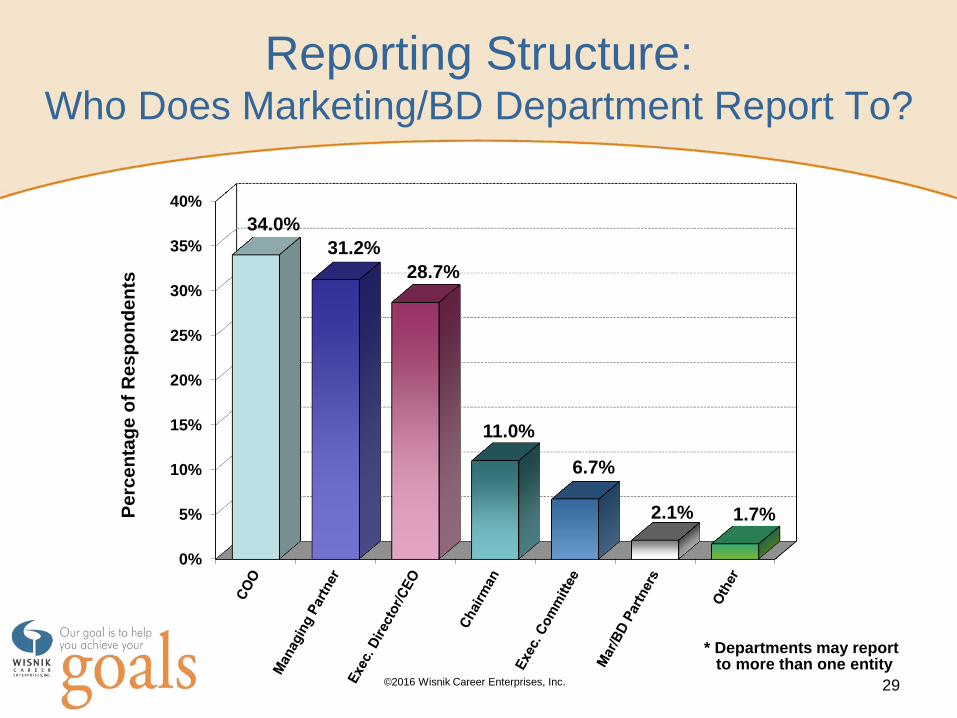
Reporting Structure: Who Does Marketing/BD Department Report To?
0%
5%
10%
15%
20%
25%
30%
35%
40%
34.0%
31.2%
28.7%
11.0%
6.7%
2.1% 1.7% Pe
rce
nta
ge
of
Re
sp
on
de
nts
* Departments may report to more than one entity

Addendum I: Salary Breakdown by Position
and Firm Size

©2016 Wisnik Career Enterprises, Inc. 31
Average Salary, Bonus, & Raise by Firm Size
Firm Size: 1-250 251-500 501+
Average Salary: $229,857 $348,400 $387,019
Median: $230,000 $320,000 $345,000
Average Bonus: $20,357 $44,000 $66,600
Average Raise: 2.6% 4.2% 3.2%
All Chiefs = 25 Avg. Salary = $325,288 Median Salary = $310,000
Avg. Bonus: $47,187 Avg. Raise: 3.3% Avg. Years of Legal Mar/BD Experience: 14.6
Avg. Tenure at Current Firm: 6.5 years

©2016 Wisnik Career Enterprises, Inc. 32
Average Salary, Bonus, & Raise by Firm Size
All Directors = 67 Avg. Salary = $229,940 Median Salary = $218,000
Avg. Bonus: $26,399 Avg. Raise: 4.9% Avg. Years of Legal Mar/BD Experience: 13
Avg. Tenure at Current Firm: 6 years
Firm Size: 1-250 251-500 501-1000 1001+
Average Salary: $208,654 $234,679 $222,056 $238,079
Median: $205,000 $223,750 $230,000 $225,000
Average Bonus: $23,823 $29,583 $19,979 $26,167
Average Raise: 4.5% 5.9% 4.1% 4.9%

©2016 Wisnik Career Enterprises, Inc. 33
Average Salary, Bonus, & Raise by Firm Size
* Insufficient number of responses
All Senior Managers = 22 Avg. Salary = $176,341 Median Salary = $180,250
Avg. Bonus: $13,124 Avg. Raise: 5.8% Avg. Years of Legal Mar/BD Experience: 11
Avg. Tenure at Current Firm: 4.8 years
Firm Size: 1-750 751-1000 1001+
Average Salary: $176,429 $160,786 $188,429
Median: $180,000 $150,000 $200,000
Average Bonus: * $14,571 $11,517
Average Raise: 5% 5.9% 5.1%

©2016 Wisnik Career Enterprises, Inc. 34
Average Salary, Bonus, & Raise by Firm Size
All Managers = 152 Avg. Salary = $131,737 Median Salary = $129,890
Avg. Bonus: $8,333 Avg. Raise: 5.6% Avg. Years of Legal Mar/BD Experience: 9.3
Avg. Tenure at Current Firm: 4.4 years
Firm Size: 1-250 251-500 501-1000 751-1000 1001+
Average Salary: $119,000 $132,135 $143,623 $137,306 $128,811
Median: $118,500 $126,000 $140,000 $135,000 $130,000
Average Bonus: $6,500 $6,547 $7,675 $9,484 $9,706
Average Raise: 7.8% 5.2% 5% 5.1% 6%

©2016 Wisnik Career Enterprises, Inc. 35
Average Salary, Bonus, & Raise by Firm Size
All Specialists/Analysts/Sr. Coord. = 46 Avg. Salary = $81,536 Median Salary = $79,250
Avg. Bonus: $4,001 Avg. Raise: 4.4% Avg. Years of Legal Mar/BD Experience: 4.9
Avg. Tenure at Current Firm: 3.2 years
Firm Size: 1-750 751-1000 1001+
Average Salary: $75,992 $85,600 $82,939
Median: $73,700 $85,500 $81,662
Average Bonus: $4,860 $3,220 $3,953
Average Raise: 4.3% 3.3% 4.4%

©2016 Wisnik Career Enterprises, Inc. 36
Average Salary, Bonus, & Raise by Firm Size
* Insufficient number of responses
NOTE: Insufficient data to provide breakdown
of Assistant salary info by Firm Size
All Coordinators = 26 Avg. Salary = $59,740 Median Salary = $60,000
Avg. Bonus: $2,579 Avg. Raise: 3.7% Avg. Years of Legal Mar/BD Experience: 3.1
Avg. Tenure at Current Firm: 2.1 years
Firm Size: 1-500 501-1000 1001+
Average Salary: $55,229 $66,692 $58,773
Median: $58,000 $67,500 $59,500
Average Bonus: * $3,583 $2,194
Average Raise: * 3.5% 3.2%

Addendum II:
Responsibilities of a
Marketing/BD Professional

©2016 Wisnik Career Enterprises, Inc. 38
BD 26%
Mar./Comm.
18%
Client Relations
13%
PR 10%
CI 4%
Events 5%
Rankings, Awards
4%
Technology 4%
Other 16%
Where do you spend your time?
37%
33.3%
40.7%
25.9%
0%
10%
20%
30%
40%
50%
More $$ IncreasedResponsibility
CareerGrowth
Other
Pe
rce
nta
ge (
%)
of
Ch
iefs
An important career driver for me is:
Chiefs: Responsibilities and the Future
100% say they plan to be in legal
Marketing/BD in two years
* Chief’s “Other” primarily includes
strategy and team management

©2016 Wisnik Career Enterprises, Inc. 39
Directors: Responsibilities and the Future
BD 23%
Mar./Comm.
20%
Client Relations
11%
PR 9%
CI 4%
Events 11%
Rankings, Awards
6%
Technology 5%
Other 11%
Where do you spend your time?
43.5%
24.6%
47.8%
14.5%
0%
10%
20%
30%
40%
50%
60%
More $$ IncreasedResponsibility
CareerGrowth
Other
Pe
rce
nta
ge (
%)
of
Dir
ec
tors
An important career driver for me is:
91% say they plan to be in legal
Marketing/BD in two years
* Director’s “Other” primarily includes
operations and team management

©2016 Wisnik Career Enterprises, Inc. 40
Sr. Managers: Responsibilities and the Future
BD 26%
Mar./Comm.
24% Client
Relations 12%
PR 9%
CI 4%
Events 7%
Rankings, Awards
10%
Technology 2%
Other 6%
Where do you spend your time?
54.5%
36.4%
59.1%
13.6%
0%
10%
20%
30%
40%
50%
60%
70%
More $$ IncreasedResponsibility
CareerGrowth
Other
Pe
rce
nta
ge (
%)
of
Sr.
Ma
nag
ers
An important career driver for me is:
100% say they plan to be in legal
Marketing/BD in two years

©2016 Wisnik Career Enterprises, Inc. 41
Managers: Responsibilities and the Future
BD 24%
Mar./Comm.
22%
Client Relations
7%
PR 9%
CI 7%
Events 13%
Rankings, Awards
9%
Technology 5%
Other 4%
Where do you spend your time?
51.6%
28.1%
58.2%
15%
0%
10%
20%
30%
40%
50%
60%
70%
More $$ IncreasedResponsibility
CareerGrowth
Other
Pe
rce
nta
ge (
%)
of
Man
ag
ers
An important career driver for me is:
85% say they plan to be in legal
Marketing/BD in two years

©2016 Wisnik Career Enterprises, Inc. 42
Specialists / Analysts / Sr. Coordinators: Responsibilities and the Future
BD 28%
Mar./Comm.
26% Client Relations
6%
PR 4%
CI 5%
Events 14%
Rankings, Awards
12%
Technology 3%
Other 2%
Where do you spend your time?
68.1%
36.2%
61.7%
10.6%
0%
10%
20%
30%
40%
50%
60%
70%
80%
More $$ IncreasedResponsibility
CareerGrowth
Other
Pe
rce
nta
ge (
%)
of
Sp
ec
./S
r. C
oo
rd.
An important career driver for me is:
74.5% say they plan to be in legal
Marketing/BD in two years

©2016 Wisnik Career Enterprises, Inc. 43
Coordinators: Responsibilities and the Future
70.4%
37%
63%
22.2%
0%
10%
20%
30%
40%
50%
60%
70%
80%
More $$ IncreasedResponsibility
CareerGrowth
Other
Pe
rce
nta
ge
(%
) o
f C
oo
rdin
ato
rs
An important career driver for me is:
67% say they plan to be in legal
Marketing/BD in two years
BD 28%
Mar./Comm.
20%
Client Relations
3%
PR 5%
CI 7%
Events 22%
Rankings, Awards
12%
Technology 1%
Other 2%
Where do you spend your time?

©2016 Wisnik Career Enterprises, Inc. 44
Assistants: Responsibilities and the Future
71.4%
42.9%
71.4%
0% 0%
10%
20%
30%
40%
50%
60%
70%
80%
More $$ IncreasedResponsibility
CareerGrowth
Other
Pe
rce
nta
ge (
%)
of
As
sis
tan
ts
An important career driver for me is:
43% say they plan to be in legal
Marketing/BD in two years
BD 15%
Mar./Comm.
26%
Client Relations
5% PR 3%
CI 6%
Events 34%
Rankings, Awards
4%
Technology 5%
Other 2%
Where do you spend your time?

Wisnik Career Enterprises, Inc.
www.wisnik.com
212.370.1010 ● [email protected]
Wisnik Law Firm Marketing / BD
Survey 2016
By Eva Wisnik
November 2016