Embed Size (px)
Citation preview

WISE M NEYA Weekly Update from SMC
(For private circulation only)
Big move by GST Council;Tax cut on selected daily items
2017: Issue 606, Week: 20th - 23rd November
Bra
nd s
mc
430

From The Desk Of Editor
(Saurabh Jain)
SMC Global Securities Ltd. (hereinafter referred to as “SMC”) is a registered Member of National Stock Exchange of India Limited, Bombay Stock Exchange Limited and its associate is member of MCX stock Exchange Limited. It is also registered as a Depository Participant with CDSL and NSDL. Its associates merchant banker and Portfolio Manager are registered with SEBI and NBFC registered with RBI. It also has registration with AMFI as a Mutual Fund Distributor.
SMC has applied with SEBI for registering as a Research Entity in terms of SEBI (Research Analyst) Regulations, 2014. SMC or its associates has not been debarred/ suspended by SEBI or any other regulatory authority for accessing /dealing in securities Market.
SMC or its associates including its relatives/analyst do not hold any financial interest/beneficial ownership of more than 1% in the company covered by Analyst. SMC or its associates and relatives does not have any material conflict of interest. SMC or its associates/analyst has not received any compensation from the company covered by Analyst during the past twelve months. The subject company has not been a client of SMC during the past twelve months. SMC or its associates has not received any compensation or other benefits from the company covered by analyst or third party in connection with the research report. The Analyst has not served as an officer, director or employee of company covered by Analyst and SMC has not been engaged in market making activity of the company covered by Analyst.
The views expressed are based solely on information available publicly available/internal data/ other reliable sources believed to be true.
SMC does not represent/ provide any warranty express or implied to the accuracy, contents or views expressed herein and investors are advised to independently evaluate the market conditions/risks involved before making any investment decision.
lobal markets that saw correction on the back of rising oil prices, saw some buying
after chances of U.S. firms of getting tax break rose after republicans declared Gthat the concerns to the plan can be addressed. There is a concern that rally in oil
prices may pressure central banks especially in Asia to hike interest rates in case inflation
picks-up thereby moving away from cheap money. Expectations of hike in interest rates by
U.S. Federal Reserve in the next meeting largely remain firm as core inflation has picked up
in the month of October.
Back at home, the stock market rallied after Moody's upgraded India's sovereign rating to
Baa2. Moody's upgraded India's rating to Baa2 from Baa3 with stable outlook. Moody's has
revised the sovereign rating of India a notch above investment grade after a long gap of 14
years. The upgrade was much awaited in response to the various initiatives including
Introduction of Goods and Services Tax (GST), improvements to the monetary policy
framework, measures to address the overhang of non-performing loans (NPLs) in the
banking system, etc. taken by the government. It may also result in more money from
global investors like pension funds, etc. who will now become eligible because of rating
upgrade. On the quarterly earning front, the September results were largely in-line with
estimates, which is a good sign. On the data front, export declined by 1.12 per cent to $23
billion in October, retreating from a six-month high growth in September as shipments of
textiles, pharmaceuticals, leather and gems and jewellery fell. Imports, however, grew by
7.6 per cent to $37.11 billion in October from $34.5 billion in the year-ago month. Trade
deficit widened to $14.02 billion during the month under review as against $11.13 billion in
October 2016. Market participants would focus on the trend in global markets, investment
by foreign portfolio investors (FPIs) and domestic institutional investors (DIIs) next week.
On the commodity market front, bullion counter may trade in a narrow range while profit
booking is expected to continue in both crude oil and natural gas in near term. U.S. crude oil
production hit a record of 9.65 million barrels per day, meaning output has risen by almost
15 percent since its mid-2016 low. OPEC and non-OPEC exporters including Russia agreed a
year ago to cut crude output by 1.8 million bpd between January this year and March 2018
to bolster prices. Oil ministers have signaled that they are likely to extend the agreement,
possibly until the end of next year. Base metals continue to remain under pressure as China's
economy cooled further last month, with industrial output, fixed-asset investment and
retail sales missing expectations. All the metal-intensive sectors (in China), such as
construction, infrastructure and property, seem to be on a slowdown. Meanwhile, some key
economic indicators like ECB president Draghi speech, US existing home sales, Fed Chair
Yellen speech, FOMC meeting minutes, US core durable goods order, Michigan consumer
sentiment data may influence the metals and energy segment.
Contents
Equity 4-7
Derivatives 8-9
Commodity 10-13
Currency 14
IPO 15
FD Monitor 16
Mutual Fund 17-18
SMC GLOBAL SECURITIES LTD.
REGISTERED OFFICES:
11 / 6B, Shanti Chamber, Pusa Road, New Delhi 110005.
Tel: 91-11-30111000, Fax: 91-11-25754365
MUMBAI OFFICE:
Lotus Corporate Park, A Wing 401 / 402 , 4th Floor ,
Graham Firth Steel Compound, Off Western Express Highway,
Jay Coach Signal, Goreagon (East) Mumbai - 400063
Tel: 91-22-67341600, Fax: 91-22-67341697
KOLKATA OFFICE:
18,Rabindra Sarani, Poddar Court, Gate No-4,5th Floor, Kolkata-700001
Tel : 91-33-39847000 Fax No : 91-33-39847004
AHMEDABAD OFFICE :
10/A, 4th Floor, Kalapurnam Building, Near Municipal Market,
C G Road, Ahmedabad-380009, Gujarat
Tel : 91-79-26424801 - 05, 40049801 - 03
CHENNAI OFFICE:
Salzburg Square, Flat No.1, III rd Floor, Door No.107, Harrington Road,
Chetpet, Chennai - 600031.
Tel: 044-39109100, Fax -044- 39109111
SECUNDERABAD OFFICE:
206, 3rd Floor, above CMR Exclusive, Bhuvana Towers, S.D.Road,
Secunderabad - 500003
Tel: 91-40-30780298/99, 39109536
DUBAI OFFICE:
2404, 1 Lake Plaza Tower, Cluster T, Jumeriah Lake Towers,
PO Box 117210, Dubai, UAE
Tel: 97145139780 Fax : 97145139781
Email ID : [email protected]
NEW YORK OFFICE:
Alliance Bernstein Building
1345 Avenue of the Americas
Second Floor, New York, NY 10105
Phone: (212) 878-3684
Toll-Free: (855) 589-1915
Fax: (866) 852-4236
Printed and Published on behalf of
Mr. Saurabh Jain @ Publication Address
11/6B, Shanti Chamber, Pusa Road, New Delhi-110005
Website: www.smcindiaonline.com
Investor Grievance : [email protected]
Printed at: S&S MARKETING102, Mahavirji Complex LSC-3, Rishabh Vihar, New Delhi - 110092 (India)
Ph.: +91-11- 43035012, 43035014, Email: [email protected]
NEWS
DOMESTIC NEWSEconomy• Moody's Investors Service raised the sovereign ratings of India by a notch,
citing economic and institutional reforms. The sovereign rating was lifted to Baa2 from Baa3. The rating outlook was changed to 'stable' from 'positive'.
• According to the commerce ministry, Export declined by 1.12 per cent to $23 billion in October, retreating from a six-month high growth in September as shipments of textiles, pharmaceuticals, leather and gems and jewellery fell. Imports, however, grew by 7.6 per cent to $37.11 billion in October from $34.5 billion in the year-ago month. Trade deficit widened to $14.02 billion during the month under review as against $11.13 billion in October 2016.
• India's retail inflation picked up in October to a seven-month high, driven by faster rises in prices of food and fuel products, dampening chances of an interest rate cut by the central bank next month. India's annual consumer inflation in October increased to 3.58 per cent from a year earlier.
Pharmaceuticals• Cipla has received final approval for its Abbreviated New Drug Application
(ANDA) for Budesonide Inhalation Suspension, 0.25mg/2mL, 0.5mg/2mL, and 1mg/2mL from the United States Food and Drug Administration (USFDA) to market a generic version of Astrazeneca's Pulmicort Respules®.
• Suven Life Sciences has secured one (1) product patent from Hong Kong, two (2) product patents from India and one (1) product patent from USA corresponding to the New Chemical Entities (NCEs) for the treatment of disorders associated with Neurodegenerative diseases and these Patents are valid through 2032, 2030 and 2034 respectively.
Healthcare• Fortis Healthcare board has approved the proposed acquisition of the
entire portfolio of Singapore-listed RHT Health Trust (RHT) for an enterprise value of around ̀ 4,650 crore.
Realty/ Construction• Ahluwalia Contracts (India) has secured new orders aggregating to`310.99
crore (approx.) for Construction of Institutional, Hospital & Commercial including Electrical, Plumbing & Firefighting Services.
Information Technology• L&T Infotech (LTI) would acquire Luxembourg based Syncordis S.A., a
leading core banking implementation services provider for 15 million euros.Automobile/ Auto Ancillaries• Tata Motors has joined hands with Energy Efficiencies Services Ltd (EESL)
for implementing energy saving measures across its manufacturing facilities in India.
• Amara Raja Batteries Ltd (ARBL) is aiming to be a Rs 10,000-crore entity in the next 2-3 years as the Hyderabad-based company clocks a solid double-digit growth in its automotive segment.
Metals• Surya Roshni has obtained orders through competitive e-bidding for LED
Street Lights amounted to Rs. 89.77 crore for Design, Manufacture, Supply and Testing under PAN India SLNP (Street light National Program) and for Chandrapur, Bikaner (Rajasthan) and Telangana from Energy Efficiency Services (EESL).
INTERNATIONAL NEWS• Industrial production in the U.S. increased by more than anticipated in the
month of October. The report said industrial production climbed by 0.9 percent in October after rising by an upwardly revised 0.4 percent in September.
• US initial jobless claims rose to 249,000, an increase of 10,000 from the previous week's unrevised level of 239,000. Economists had expected jobless claims to edge down to 235,000. The less volatile four-week moving average also climbed to 237,750, an increase of 6,500 from the previous week's unrevised average of 231,250.
• US business inventories were flat in September after climbing by a revised 0.6 percent in August. Economists had expected business inventories to come in unchanged compared to the 0.7 percent increase originally reported for the previous month.
• The euro area current account surplus rose to a record high in September. The seasonally adjusted current account surplus grew to EUR 37.8 billion in September from EUR 34.5 billion in August.
• UK Retail sales increased 0.3 percent in October from September, but slightly faster than the expected 0.2 percent and reversed the 0.7 percent drop seen in September. Stripping out fuel, sales volume grew 0.1 percent following a 0.6 percent drop in September. Economists had forecast sales to remain flat.
Ex-Date Company Purpose
20-Nov-17 Granules India Interim Dividend Re 0.25 Per Share20-Nov-17 Triveni Turbine Interim Dividend - Re 0.45 Per Share21-Nov-17 Jamna Auto Industries Interim Dividend - Re 0.30 Per Share21-Nov-17 Aurobindo Pharma Interim Dividend Rs 1.50 Per Share21-Nov-17 MRF Interim Dividend - Rs 3/- Per Share23-Nov-17 Salasar Techno Engineering Interim Dividend - Re 1/- Per Share 23-Nov-17 Polyplex Corporation Dividend - Rs 5/- Per Share23-Nov-17 Super Spinning Mills Annual General Meeing28-Nov-17 CARE Ratings Interim Dividend - Rs 6/- Per Share29-Nov-17 The New India
Assurance Company Interim Dividend - Rs 3.75 Per Share8-Dec-17 Surya Roshni Dividend - Rs 1.50 Per Share
Meeting Date Company Purpose
20-Nov-17 Videocon Industries Results20-Nov-17 MIRC Electronics Results20-Nov-17 Insecticides (India) Results20-Nov-17 Gravita India Results21-Nov-17 Patspin India Results21-Nov-17 Manaksia Steels Results22-Nov-17 Lyka Labs Results23-Nov-17 Siemens Results/Dividend23-Nov-17 Manugraph India Results/Others23-Nov-17 Kesar Terminals
& Infrastructure Results24-Nov-17 Career Point Results/Others24-Nov-17 Bharat Bijlee Results28-Nov-17 Walchandnagar Industries Results/Others29-Nov-17 Tara Jewels Results/Others29-Nov-17 Indo Tech Transformers Results2-Dec-17 Rico Auto Industries Results7-Dec-17 Shriram EPC Results
FORTHCOMING EVENTS
NOTES:1) These levels should not be confused with the daily trend sheet, which is sent every morning by e-mail in the name
of "Morning Mantra ".2) Sometimes you will find the stop loss to be too far but if we change the stop loss once, we will find more strength
coming into the stock. At the moment, the stop loss will be far as we are seeing the graphs on weekly basis and taking a long-term view and not a short-term view.
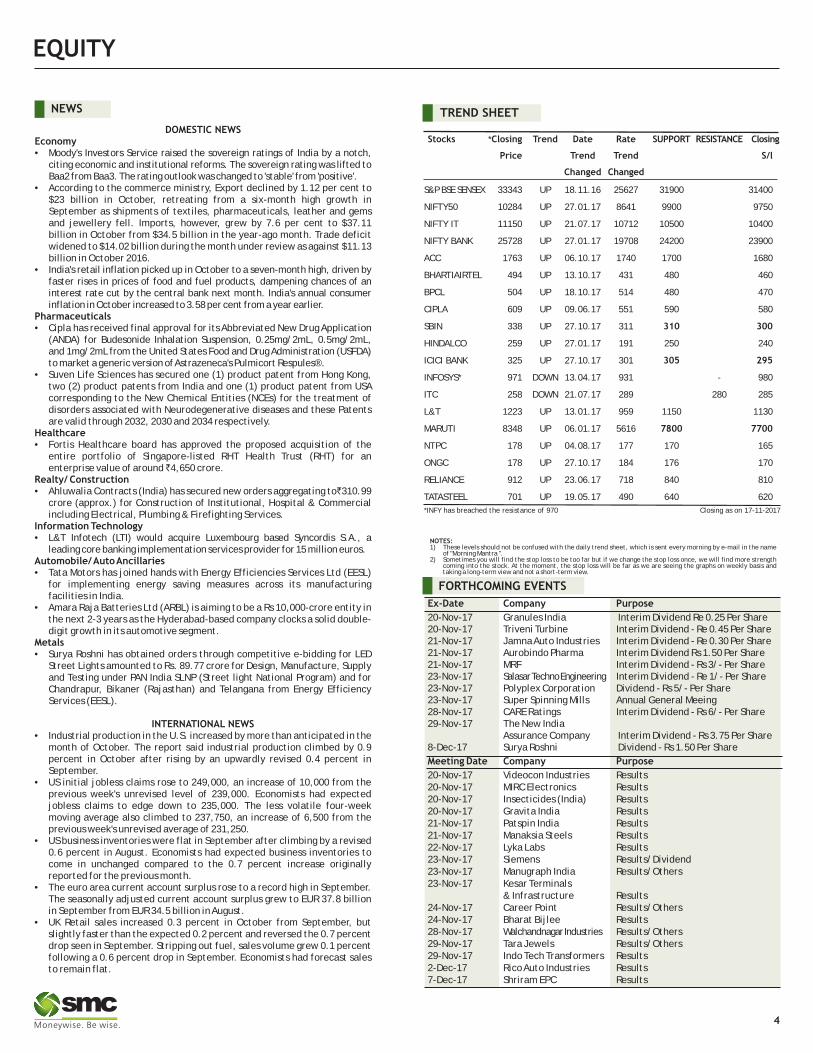
TREND SHEET
Stocks *Closing Trend Date Rate SUPPORT RESISTANCE Closing
Price Trend Trend
Changed Changed
S&P BSE SENSEX 33343 UP 18.11.16 25627 31900 31400
NIFTY50 10284 UP 27.01.17 8641 9900 9750
NIFTY IT 11150 UP 21.07.17 10712 10500 10400
NIFTY BANK 25728 UP 27.01.17 19708 24200 23900
ACC 1763 UP 06.10.17 1740 1700 1680
BHARTIAIRTEL 494 UP 13.10.17 431 480 460
BPCL 504 UP 18.10.17 514 480 470
CIPLA 609 UP 09.06.17 551 590 580
SBIN 338 UP 27.10.17 311 310 300
HINDALCO 259 UP 27.01.17 191 250 240
ICICI BANK 325 UP 27.10.17 301 305 295
INFOSYS* 971 DOWN 13.04.17 931 - 980
ITC 258 DOWN 21.07.17 289 280 285
L&T 1223 UP 13.01.17 959 1150 1130
MARUTI 8348 UP 06.01.17 5616 7800 7700
NTPC 178 UP 04.08.17 177 170 165
ONGC 178 UP 27.10.17 184 176 170
RELIANCE 912 UP 23.06.17 718 840 810
TATASTEEL 701 UP 19.05.17 490 640 620
S/l
4
Closing as on 17-11-2017*INFY has breached the resistance of 970

BSE SENSEX TOP GAINERS & LOSERS (% Change) NSE NIFTY TOP GAINERS & LOSERS (% Change)
SECTORAL INDICES (% Change)
SMC Trend
FMCGHealthcare
Auto BankRealty
Cap GoodsCons Durable
Oil & GasPower
ITMetal
Down SidewaysUp
GLOBAL INDICES (% Change)
INDIAN INDICES (% Change)
5
SMC Trend
Nifty Sensex BSE Midcap BSE Smallcap Nifty Junior S&P CNX 500
SMC Trend
FTSE 100CAC 40
NasdaqDow jonesS&P 500
NikkeiStrait times
Hang SengShanghai
INSTITUTIONAL ACTIVITY (Equity) (` Crore)
-1.04
-0.62
-0.35
-1.03 -1.03-0.98
-1.20
-1.00
-0.80
-0.60
-0.40
-0.20
0.00
Nifty Sensex BSE Midcap BSE Smallcap
Nifty Next 50
S&P CNX 500
-0.22-0.06
-3.11
-2.35
-1.58
-1.85
1.40
-4.35
-1.98
-1.57
-1.31
-5.00
-4.00
-3.00
-2.00
-1.00
0.00
1.00
2.00
Auto Index Bankex Cap Goods Index
Cons Durable Index
FMCG Index Healthcare Index
IT Index Metal Index Oil & Gas Index
Power Index Realty Index
0.63
0.15 0.13
-2.30
-1.46
-0.35
-0.97
-0.62
-0.82
-2.50
-2.00
-1.50
-1.00
-0.50
0.00
0.50
1.00
Nasdaq Comp. Dow Jones S&P 500 Nikkei Strait Times Hang Seng Shanghai Comp.
FTSE 100 CAC 40
-27.72-135.73
2680.94
1830.78
2325.93
-500.00
0.00
500.00
1000.00
1500.00
2000.00
2500.00
3000.00
Friday Monday Tuesday Wednesday Thursday
FII / FPI Activity MF Activity
2.74 2.42 2.261.87 1.81
-9.87
-8.07
-6.96-6.25
-5.86
-12.00
-10.00
-8.00
-6.00
-4.00
-2.00
0.00
2.00
4.00
Infosys Kotak Mah. Bank
Reliance Inds. Ambuja Cem. Tech Mahindra
Bharti Infra. Adani Ports Vedanta O N G C Bosch
2.912.46
2.141.60 1.55
-8.06
-6.00-5.52
-3.68 -3.54
-10.00
-8.00
-6.00
-4.00
-2.00
0.00
2.00
4.00
Infosys Kotak Mah. Bank
Reliance Inds.
TCS M & M Adani Ports O N G C Coal India Larsen & Toubro
Sun Pharma.Inds.

Beat the street - Fundamental Analysis
Source: Company Website Reuters Capitaline
6
Above calls are recommended with a time horizon of 8 to 10 months.
MAHINDRA & MAHINDRA LIMITED CMP: 1415.00 Upside:33%Target Price: 1877.00
Investment Rationale units while tractor sales increased 31.2% yoy to ?Mahindra & Mahindra, Ltd., through its 80,911 units. Performance was supported by both
subsidiaries, engages in the manufacture, automotive and tractor business.distribution, and sale of tractors, multi-utility ?The group will supply 150 of the 500 electric vehicles, light commercial vehicles, and three sedans in the first phase of the government's order wheelers. I t a l so des igns, develops, to procure 10,000 electric vehicles. It will manufactures, and markets implements that are manufacture all key components that go into an used in conjunction with tractors. electric vehicle itself as India's largest utility
?The company has robust new product plans for the vehicle maker prepares for the next transition in next four financial years; a new product every the automobile industry amid the government's year till FY21 beginning FY18. It plans to launch an push to cut dependence on fossil fuels.Multi Purpose Vehicles (MPV) code named • eU321, Valuationwhich is being developed at its technical center in Company's volume growth is on an uptrend led by Detroit and is expected to be launched after 12 strong demand in tractors and a cyclical recovery in months, vehicle on the Tivoli platform (S221) is light commercial vehicles. A pick up in rural economy expected to be launched in 2HFY19. 2 new tractor is likely and this should benefit M&M. Thus, it is platforms are expected to be launched during the expected that the company would see good growth year under M&M and Swaraj franchisee, along going forward and the stock will see a price target of with variants on Nuvo and Yuvo. `1877 in 8 to 10 months time frame on a three year
?During the quarter ended September 2018, average P/E of 24.3x and FY19 (E) earnings of ̀ 77.26.company's power brands (XUV5OO, Scorpio, Bolero) continued to perform well. Scorpio recorded highest ever sales in September; Bolero volume returned to its peak run rate of about 8000 nos./month. New products (KUV100 & TUV300) are gaining traction. Continued traction in urban sales, strong festive demand and refreshed versions of the KUV100 and TUV300 aided recovery in the compact utility vehicles portfolio, even as mainstay models such as Bolero, Scorpio and XUV500 remained on a strong footing.
?Total auto sales (passenger and commercial vehicles, inclusive of exports) during the quarter ended September 2018 improved 9% to 1.37 lakh
Face Value (`) 5.00
52 Week High/Low 1459.50/1141.80
M.Cap (`Cr.) 87955.87
EPS (`) 54.89
P/E Ratio (times) 25.78
P/B Ratio (times) 2.95
Dividend Yield (%) 0.80
Stock Exchange BSE
% OF SHARE HOLDING
P/E Chart
` in cr
Actual EstimateFY Mar-17 FY Mar-18 FY Mar-19
Revenue 43,785.40 47,719.10 54,146.40
Ebitda 4,769.30 6,167.20 6,998.90
Ebit 3,442.10 4,914.40 5,611.80
Pre-Tax Profit 5,187.50 5,904.20 6,707.20
Net Income 3,407.20 4,084.50 4,654.30
EPS 57.17 67.84 77.26
VALUE PARAMETERS
Investment Rationale period of time. The bank expects double digit loan growth for retail segment and also it is targeting ·The domestic business of the bank has improved domestic loan book growth of 15% in FY2018. 10%, driven by 9% growth in advance and 11%
growth in deposits. It has improved its domestic Valuationmarket share in loans by 20 bps and deposits by 4- The bank has been delivering on improvement on 5 bps in last six months, while the bank is asset quality, cost efficiency, other income & committed to maintain its market position. productivity in the past few quarters and execution
·Net interest margin (NIM) of the bank has improved of various strategic initiatives continues to be by 19 bps margin to 2.31% and Bank has witness ed underway as part of Project Navoday - the Bank's steady yield on advances at 6.93%, while cost of comprehensive business transformation that seeks to deposits eased 7 bps qoq to 4.54% in Q2FY2018. deliver a differentiated world-class customer
·The bank has recorded strong 27% growth in experience enabled by an energized and engaged domestic CASA deposits, while improving CASA team. The transformation journey aims at improved ratio to 38.77% end June 2017. On the loan book market share, quality business growth, portfolio front, the retail credit portfolio jumped 19%, diversification and enhanced fee income, with while wholesale loan book also increased 9% end cutting edge digitization of processes, while ensuring June 2017 over June 2016. due focus is accorded to compliance and controls.
Thus, it is expected that the stock will see a price ·The bank has exhibited increase in Gross NPA and target of `211 in 8 to 10 months time frame on a Net NPA ratios at 11.40% and 5.17% respectively at target P/Bv of 1.1x and FY19 NAVPS of ̀ 192.12.the end June 2017. However, the Provision
Coverage Ratio (PCR) was retained at healthy level of 66.28% at the end June 2017, while bank aims to improve PCR to 70% in FY2018.
·The bank has exposure of ̀ 7900 crore to 10 out of 12 accounts identified by the Reserve Bank of India for speedy resolution under IBC( Insolvency and Bankruptcy Code). The bank holds 53% provisions on these accounts, while its required to make additional provisions of `890 crore in FY2018, most of which were already factored in on account of aging of these accounts.
·The Bank expects the pace of mortgage Loan book to accelerate going forward. The share of mortgage loan book is expected to improve to 8% over a
P/B Chart
Face Value (`) 2.00
52 Week High/Low 206.60/133.60
M.Cap (`Cr.) 42050.91
EPS (`) 7.54
P/E Ratio (times) 24.21
P/B Ratio (times) 0.98
Dividend Yield (%) 0.79
Stock Exchange BSE
` in cr
% OF SHARE HOLDING
VALUE PARAMETERS
Actual Estimate
FY Mar-17 FY Mar-18 FY Mar-19
Net Inte. Income 13513.40 14767.30 16782.80
Ebit 10975.10 9488.40 10992.80
Pre-Tax Profit 2472.70 3041.70 6174.80
Net Income 1383.10 2098.80 4271.50
EPS 6.00 8.91 17.63
NAVPS 174.92 181.25 192.12
ROE 3.43 5.49 9.70
BANK OF BARODA CMP: 182.50 Upside:16%Target Price: 211.00
40.24
19.85
6.04
25.21
8.66
Foreign
Institutions
Non Promoter Corporate Holding
Promoters
Public & Others
13.4
18.71
0
1.6
59.24
7.06 Foreign
Institutions
Govt Holding
Non Promoter Corp. Hold.
Promoters
Public & Others
Charts by Spider Software India Ltd
7
EQUITY
Above calls are recommended with a time horizon of 1-2 months
Disclaimer : The analyst and its affiliates companies make no representation or warranty in relation to the accuracy, completeness or reliability of the information contained in its research. The analysis contained in the analyst research is based on numerous assumptions. Different assumptions could result in materially different results.The analyst, not any of its affiliated companies, not any of their members, directors, employees or agents accepts any liability for any loss or damage arising out of the use of all or any part of the analysis research.
SOURCE: CAPITAL LINE
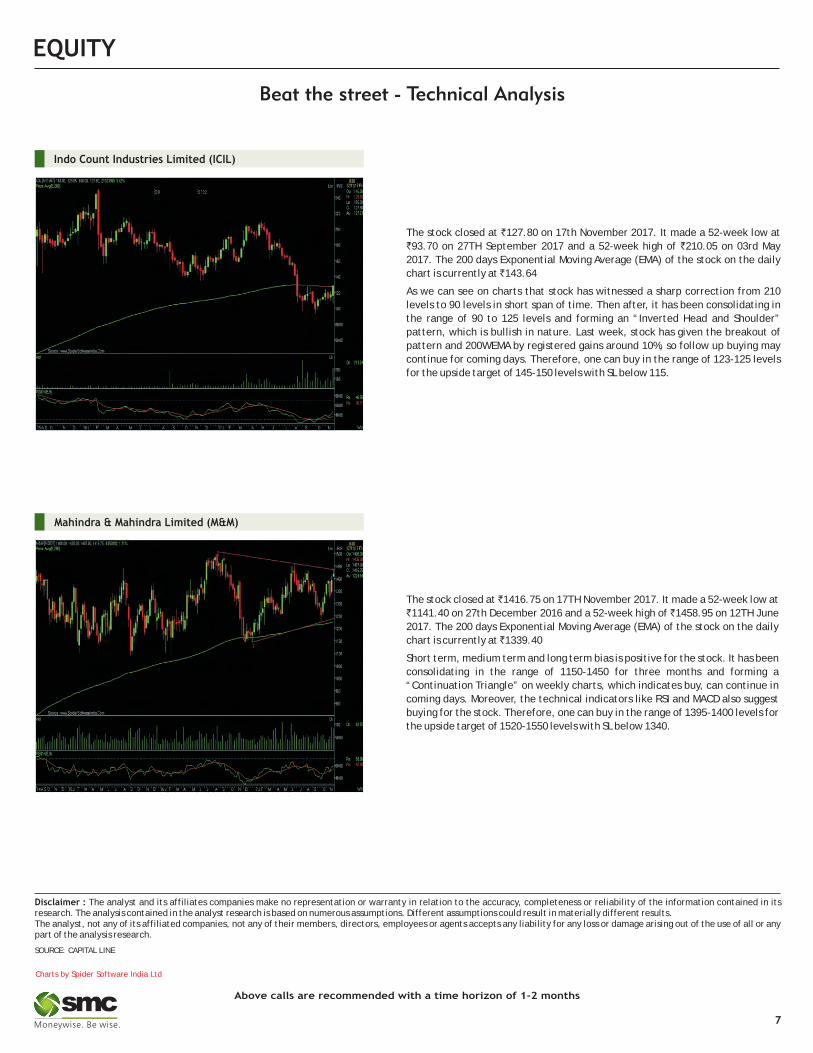
The stock closed at `127.80 on 17th November 2017. It made a 52-week low at
`93.70 on 27TH September 2017 and a 52-week high of `210.05 on 03rd May
2017. The 200 days Exponential Moving Average (EMA) of the stock on the daily
chart is currently at ̀ 143.64
As we can see on charts that stock has witnessed a sharp correction from 210
levels to 90 levels in short span of time. Then after, it has been consolidating in
the range of 90 to 125 levels and forming an “Inverted Head and Shoulder”
pattern, which is bullish in nature. Last week, stock has given the breakout of
pattern and 200WEMA by registered gains around 10%, so follow up buying may
continue for coming days. Therefore, one can buy in the range of 123-125 levels
for the upside target of 145-150 levels with SL below 115.
Indo Count Industries Limited (ICIL)
The stock closed at ̀ 1416.75 on 17TH November 2017. It made a 52-week low at
`1141.40 on 27th December 2016 and a 52-week high of ̀ 1458.95 on 12TH June
2017. The 200 days Exponential Moving Average (EMA) of the stock on the daily
chart is currently at ̀ 1339.40
Short term, medium term and long term bias is positive for the stock. It has been
consolidating in the range of 1150-1450 for three months and forming a
“Continuation Triangle” on weekly charts, which indicates buy, can continue in
coming days. Moreover, the technical indicators like RSI and MACD also suggest
buying for the stock. Therefore, one can buy in the range of 1395-1400 levels for
the upside target of 1520-1550 levels with SL below 1340.
Mahindra & Mahindra Limited (M&M)

DERIVATIVES
CHANGE IN NIFTY OPTION OI (IN QTY)
WEEKLY VIEW OF THE MARKET
NIFTY OPTION OI CONCENTRATION (IN QTY)
CHANGE IN BANKNIFTY OPTION OI (IN QTY) (MONTHLY)BANKNIFTY OPTION OI CONCENTRATION (IN QY) (MONTHLY)
On Friday, Nifty futures witnessed fresh long positions to the tune of 1.39% and bank Nifty too witnessed a huge spike in open interest to the tune of 7.82 % mainly
on the long side. Throughout the day, banking stocks traded enthusiastically with ICICI Bank taking the lead, helping Bank Nifty to end the session at an all-time
high. Still there is a lot of outstanding short position in Nifty and Index calls. We can expect another round of short covering in the coming week. As per current
derivative data, Nifty can move towards 10400-10500 levels. Derivative data indicates bullish scenario to continue. Nifty has multiple strong supports at lower
levels; supports are 10100 & 10200-10250 spot levels. We may see short covering on every dip. Option put writers are active. We have seen put writing in 10300,
10200 puts and unwinding in calls. Implied Volatility (IV) of calls was down and closed at 11.08% while that for put options closed at 11.13%. The Nifty VIX for the
week closed at 13.46% and is expected to trade sideways. The PCR OI for the week closed up at 0.88 which indicates OTM call writing. Overall data has turned
slightly positive around support levels of 10200 and more short covering can be seen towards 10500 levels in the current expiry.
In lakhs
In 10000 In 10000
AJANTPHARM (NOV FUTURE)
Buy: Above `1285
Target: `1342
Stop loss: `1255
GAIL
BUY NOV 440. PUT 7.75SELL NOV 430. PUT 4.25
LOT SIZE: 2000BEP: 436.50
MAX. PROFIT: 13000.00 (6.50*2000)MAX. LOSS: 7000.00 (3.50*2000)
OPTIONSTRATEGY
FUTURE
CEATLTD
BUY NOV 1800. CALL 34.00SELL NOV 1850. CALL 18.00
LOT SIZE: 350BEP: 1816.00
MAX. PROFIT: 11900.00 (34.00*350)MAX. LOSS: 5600.00 (16.00*350)
DERIVATIVE STRATEGIES
BEML (NOV FUTURE)
Sell: Below `1621
Target: `1550
Stop loss: `1660
BULLISH STRATEGY
SRTRANSFIN
BUY NOV 1300. CALL 33.00SELL NOV 1320. CALL 26.00
LOT SIZE: 600BEP: 1307.00
MAX. PROFIT: 7800.00 (13.00*600)MAX. LOSS: 4200.00 (7.00*600)
APOLLOTYRE (NOV FUTURE)
Sell: Below `233
Target: `226
Stop loss: `237
BEARISH STRATEGY
Call Put
6.6
4
8.6
7
11
.17
32
.02
41
.46
44
.57
54
.49
34
.64
30
.23
23
.62
16
.04
23
.56
49
.13
37
.50
51
.87
27
.57
12
.62
7.9
7
3.3
1
2.3
6
0.3
8
9.6
4
0.00
10.00
20.00
30.00
40.00
50.00
60.00
9900 10000 10100 10200 10300 10400 10500 10600 10700 10800 11000
Call Put
-0.0
5
-0.4
9
2.6
3
18
.84
8.7
6
7.0
3
8.7
4
-3.3
8
-1.2
3
-5.9
8 -2.5
6
1.4
2
-0.6
9
-3.0
5
-4.3
2
-21
.52
-8.4
2 -3.1
6
-2.2
4
-0.4
0
0.0
0
-0.5
5
-25.00
-20.00
-15.00
-10.00
-5.00
0.00
5.00
10.00
15.00
20.00
25.00
9900 10000 10100 10200 10300 10400 10500 10600 10700 10800 11000
Call Put
0.3
6
0.1
8
0.3
7
3.2
7
3.9
3
4.3
3
0.3
4
5.9
3
8.4
6
2.3
4
0.9
1
0.6
8
1.6
0
1.7
2
4.8
0 5.9
6
17
.20
0.6
2
5.0
0
8.1
4
0.4
7
0.0
7
0.00
2.00
4.00
6.00
8.00
10.00
12.00
14.00
16.00
18.00
20.00
22500 23000 23500 24000 24500 25000 25300 25500 26000 26500 27000
Call Put
0.2
6
-0.0
5
-0.0
1
-0.2
7
-0.1
6
-0.4
6
0.4
0
3.1
1
7.2
8
-2.9
8
0.2
6
0.1
3
0.1
2
-2.4
8
1.2
4
3.2
5
6.8
4
-0.2
4
2.1
6
0.1
2
-0.1
1
0.3
4
-4.00
-2.00
0.00
2.00
4.00
6.00
8.00
22500 23000 23500 24000 24500 25000 25300 25500 26000 26500 27000
8
In lakhs
9
DERIVATIVES
FII’s ACTIVITY IN DERIVATIVE SEGMENT
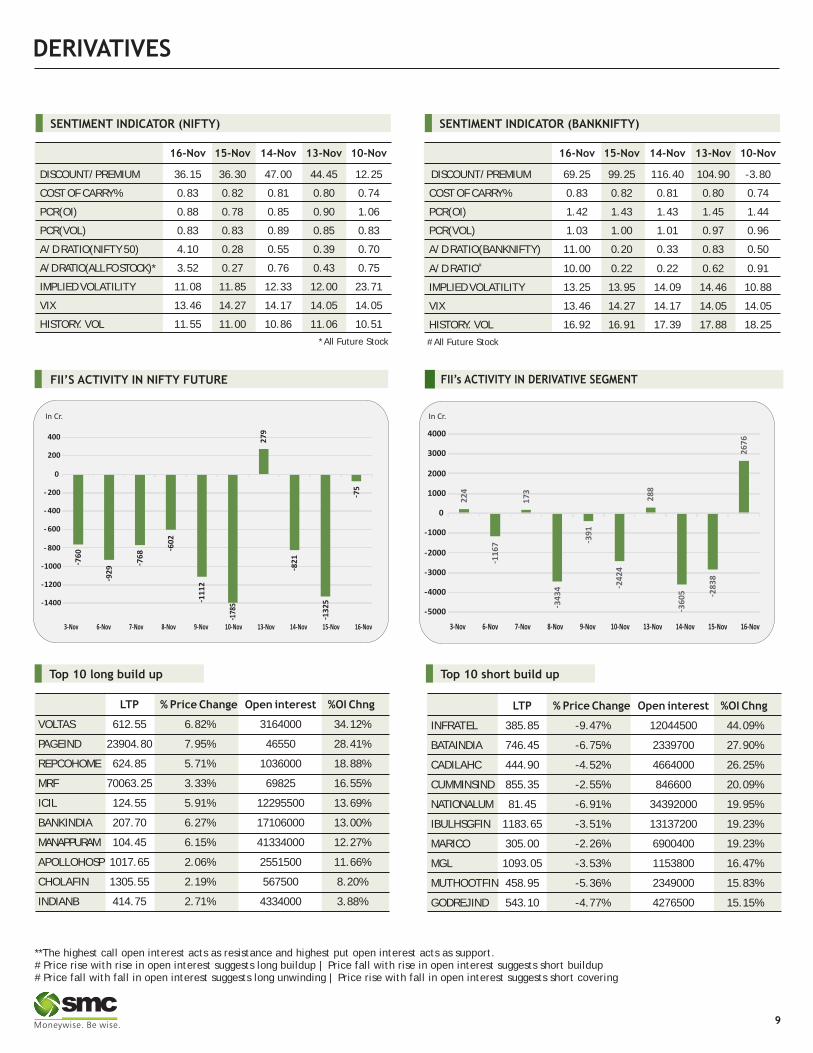
SENTIMENT INDICATOR (NIFTY)
16-Nov 15-Nov 14-Nov 13-Nov 10-Nov
DISCOUNT/PREMIUM 36.15 36.30 47.00 44.45 12.25
COST OF CARRY% 0.83 0.82 0.81 0.80 0.74
PCR(OI) 0.88 0.78 0.85 0.90 1.06
PCR(VOL) 0.83 0.83 0.89 0.85 0.83
A/D RATIO(NIFTY 50) 4.10 0.28 0.55 0.39 0.70
A/D RATIO(ALL FO STOCK)* 3.52 0.27 0.76 0.43 0.75
IMPLIED VOLATILITY 11.08 11.85 12.33 12.00 23.71
VIX 13.46 14.27 14.17 14.05 14.05
HISTORY. VOL 11.55 11.00 10.86 11.06 10.51
*All Future Stock
SENTIMENT INDICATOR (BANKNIFTY)
FII’S ACTIVITY IN NIFTY FUTURE
**The highest call open interest acts as resistance and highest put open interest acts as support.# Price rise with rise in open interest suggests long buildup | Price fall with rise in open interest suggests short buildup # Price fall with fall in open interest suggests long unwinding | Price rise with fall in open interest suggests short covering
#All Future Stock
LTP % Price Change Open interest %OI Chng
VOLTAS 612.55 6.82% 3164000 34.12%
PAGEIND 23904.80 7.95% 46550 28.41%
REPCOHOME 624.85 5.71% 1036000 18.88%
MRF 70063.25 3.33% 69825 16.55%
ICIL 124.55 5.91% 12295500 13.69%
BANKINDIA 207.70 6.27% 17106000 13.00%
MANAPPURAM 104.45 6.15% 41334000 12.27%
APOLLOHOSP 1017.65 2.06% 2551500 11.66%
CHOLAFIN 1305.55 2.19% 567500 8.20%
INDIANB 414.75 2.71% 4334000 3.88%
LTP % Price Change Open interest %OI Chng
INFRATEL 385.85 -9.47% 12044500 44.09%
BATAINDIA 746.45 -6.75% 2339700 27.90%
CADILAHC 444.90 -4.52% 4664000 26.25%
CUMMINSIND 855.35 -2.55% 846600 20.09%
NATIONALUM 81.45 -6.91% 34392000 19.95%
IBULHSGFIN 1183.65 -3.51% 13137200 19.23%
MARICO 305.00 -2.26% 6900400 19.23%
MGL 1093.05 -3.53% 1153800 16.47%
MUTHOOTFIN 458.95 -5.36% 2349000 15.83%
GODREJIND 543.10 -4.77% 4276500 15.15%
Top 10 short build upTop 10 long build up
In Cr. In Cr.
16-Nov 15-Nov 14-Nov 13-Nov 10-Nov
DISCOUNT/PREMIUM 69.25 99.25 116.40 104.90 -3.80
COST OF CARRY% 0.83 0.82 0.81 0.80 0.74
PCR(OI) 1.42 1.43 1.43 1.45 1.44
PCR(VOL) 1.03 1.00 1.01 0.97 0.96
A/D RATIO(BANKNIFTY) 11.00 0.20 0.33 0.83 0.50
#A/D RATIO 10.00 0.22 0.22 0.62 0.91
IMPLIED VOLATILITY 13.25 13.95 14.09 14.46 10.88
VIX 13.46 14.27 14.17 14.05 14.05
HISTORY. VOL 16.92 16.91 17.39 17.88 18.25
- 76
0
- 92
9 - 76
8 - 60
2
- 11
12
27
9
- 82
1
- 13
25
- 75
-1400
-1200
-1000
- 800
- 600
- 400
- 200
0
200
400
3-Nov 6-Nov 7-Nov 8-Nov 9-Nov 10-Nov 13-Nov 14-Nov 15-Nov 16-Nov
22
4
- 11
67
17
3
- 34
34
- 39
1
- 24
24
28
8
- 36
05 - 2
83
8
26
76
-5000
-4000
-3000
-2000
-1000
0
1000
2000
3000
4000
3-Nov 6-Nov 7-Nov 8-Nov 9-Nov 10-Nov 13-Nov 14-Nov 15-Nov 16-Nov
1785
-
10
SPICES
Soybean futures (Dec) is facing selling pressure with every rise & hence in days to come it may trade in the range of 2835-2910 with upside getting capped. Millers as of now are having positive crush margin of Rs 200/ton in crushing of soybean seed but as the demand of soy meal is not picking up so they are crushing soybean in limited quantity. The freight is of around $35 per tonne for bulk exports to European destination and insurance of $1 per tonne then Indian soymeal CIF rotterdam price comes at $376 which means that Indian soymeal is costlier by $12 compared to Argentine soymeal. The rally in refined soy oil futures (Dec) is expected to stay paused as the counter is facing resistance near 720 levels. In days, to come, the edible oil might witness some correction & test 680 levels, while CPO futures (Nov) may trade with a downside bias & move down towards 540-530 levels. The edible oil counter may take negative cues from the higher stocks available in the ports against limited demand. India's monthly requirement is about 18.0 lakh tons and operates at 30 days stock against which currently holding stock over 23.44 lakh tons equal to 39 days requirements. The stock of edible oils as on 1st Nov., 2017 at various ports is estimated at 884,000 tons and about 1,460,000 tons in pipelines. Mustard futures (Dec) is likely to consolidate in the range of 3885-3985 levels. The market participants are cautious because the demand has slowed down as millers are having sufficient stock in their inventory which can meet their short term crushing demand. On the contrary, the sowing of new mustard seed is lagging in Rajasthan.
OIL AND OILSEEDS
OTHER COMMODITIES
The uptrend in Kapas futures (April) will resume only if the counter surpasses the resistance near 920 levels, till then it may consolidate in the range of 895-920 levels. In fundamentals, the Cotton Association of India (CAI) has estimated the country's cotton crop at 375 lakh bales (each of 170 kg) for the 2017-18 season beginning October 2017, which is 11% higher as compared to last season. The projected balance sheet drawn by the CAI estimates the total cotton supply for the 2017-18 season at 422 lakh bales including the opening stock of around 30 lakh bales and the imports which are estimated at 17 lakh bales. On the demand side, mill consumption is estimated at around 320 lakh bales & expecting a similar trend of export like last year of about 63 lakh bales, the projected a surplus would be nearly about 39 lakh bales for 2017-18. Chana futures (Dec) may trade sideways in the range of 4600-5000 levels. The demand for chana dal is likely to gather pace as 50% import duty has been imposed on yellow peas. The market participants are optimistic because with no new shipments of yellow peas coming to India, domestic supplies may get over in about two months, after which, there will be increase in demand for chana. Cotton oilseed cake futures (Dec) may face resistance near 1580 levels & the upside may remain capped. At the spot markets, the buyers are aware of the fact that supply is likely to increase in coming days which will make sellers to quote lower price of the commodity so they might opt wait and watch approach till the price declines.
Bullion counter can witness volatile movement as Fed Chair Yellen speech and FOMC meeting minutes along with movement of greenback to give further direction to the prices. Local currency rupee can move in the range of 64.60-65.70. Gold can face resistance near $1300 in COMEX and 29900 in MCX while it has support near $1240 in COMEX and 28800 in MCX. Silver has key support near 38500 in MCX and $16.20 in COMEX. And it has resistance near 40800 in MCX and $17.50 in COMEX. Rupee appreciated last week as Moody's Investors Service raised India's sovereign bond rating for the first time since 2004, citing continued progress in economic and institutional reforms. The ratings firm upgraded India to Baa2 from Baa3. However, weighing on gold price is recovery in US equity market amid some progress over tax bill. US House last week voted in favour of their version of tax bill. However, the process is far from over and uncertainty will prevail. US Senate has rolled out its own version which will be voted soon. If that bill is also passed then both the versions will have to be reconciled. SPDR Gold Trust GLD, holdings stood at 847.04 tonnes. Cleveland Fed President Loretta Mester stated that she feels inflation is poised to pick up, clearing the way for the Fed to continue its gradual process of raising interest rates. According to the World Gold Council (WGC) “ India's gold consumption is likely to drop to its lowest in eight years in 2017, hit by government moves to make bullion trading more transparent and by faltering demand in some rural areas“
BULLIONS
Crude oil prices may witness profit booking at higher levels as it can move in the range of 3500-3680 levels in MCX. However, weighing on price is mixed economic data from major economies, unexpected rise in US crude oil stocks, record high US crude production and downbeat demand forecast in face of higher price. Prices were relatively well supported, largely due to efforts led by the Organization of the Petroleum Exporting Countries (OPEC) to withhold oil production in order to tighten the market and prop up prices. The deal is due to expire in March 2018, but OPEC will meet on Nov. 30 to discuss policy, and it is expected to agree an extension of the cuts. U.S. crude inventories rose for a second week in a row, building by 1.9 million barrels in the week to Nov. 10 to 459 million barrels, the government's Energy Information Administration (EIA). IEA's monthly report last week trimmed down its global oil demand forecast for next year to 1.3 mbpd. OPEC on other hand expects global demand to grow by 1.5 mbpd next year, up from its previous forecast of 1.38 mbpd. Natural gas may remain on volatile path as it may remain in the range of 190-215 levels in MCX. EIA noted an 18 Bcf decline in US gas stocks as against market expectations of 15 Bcf decline. However, weighing on price is mixed US weather forecast which will keep a check on heating demand for gas. Mixed factors may keep gas price choppy and range bound and one can witness some buying interest at lower levels.
ENERGY COMPLEX
Base metals counter can move with mixed bias as outcome of US durable goods orders to give further direction to the prices. China's economy cooled further last month, with industrial output, fixed asset investment and retail sales missing expectations as government extended a crackdown on debt risks and factory pollution. China's producer prices were surprisingly strong in October, while consumer inflation picked up pace, suggesting the economy remains robust despite expected curbs on factory output as the government pursues a war on smog. Copper may move in the range of 430-450 levels. China's top copper smelters reaffirmed that there will be no shortage of copper concentrate supply in 2018 as the key contract renegotiation season hots up. Zinc can move in the range of 200-213 levels. Inventories in China had risen in recent weeks despite capacity closures, and if there is no major drawdown on the inventory side, the market will be fast in pricing in some of the disappointment. Lead can move in the range of 150-163 levels in MCX. Nickel may remain in the range of 710-770 levels. The upside in Nickel may be capped amid worries over weak demand from China along with expectation of rise is exports from Indonesia. Aluminium may move in the range of 132-140 levels in MCX. Chinalco, China's biggest state-run aluminium producer is cutting its alumina capacity by 2 million tonnes this winter to comply with pollution-related restrictions on heavy industry. Stocks in LME-approved warehouses of aluminium fell to their lowest since September 2008, down to 1.2 million tonnes, but stocks in Shanghai inched higher this week to a record 666,581 tonnes.
Turmeric futures (Dec) may continue to shed down further for the third consecutive week towards 6700-6600 levels. The counter is not getting any fresh cues from the spot markets as the traders are not getting sufficient upcountry orders so, they are buying very limited quantity. Only medium and poor quality turmeric is arriving for sale & the buyers after examining the samples are quoting decreased price. The sentiments are bearish as adequate stock is available to cater domestic along with export demand and the prospects of same production as last year. Also, there is selling pressure in the spot markets because farmers, stockiest wants to liquidate the stock before the new crop hits the market. Jeera futures (Dec) is likely to take support near 18755 levels & trade with an upside bias. The market participants are optimistic as stocks of jeera are very low & it is estimated that there is approximately 7-8 lakh bags stock available in the spot markets as compared to 10-12 lakh bags (55Kg each) during same period of time in the last year. However, there would also be cautiousness as the sowing has started and further trend will depends on whether the sowing this year increases or decreases this season. Coriander futures (Dec) will possibly trade sideways to down in the range of 4900-5200 levels due to mixed fundamentals. Firstly, ample stocks are available in the market against muted domestic and sluggish export demand. On the contrary, sowing has started in producing belts of Madhya Pradesh, Gujarat and Rajasthan and the area is expected to decline this year due to lower prices. Cardamom futures (Dec) may trade higher & test 1040-1065 levels, taking support near 980 levels. During this time of year in winters, rise in demand for this aromatic spice against drop in arrivals may add to the upside momentum.
BASE METALS
11
TECHNICAL RECOMMENDATIONS
COMMODITY
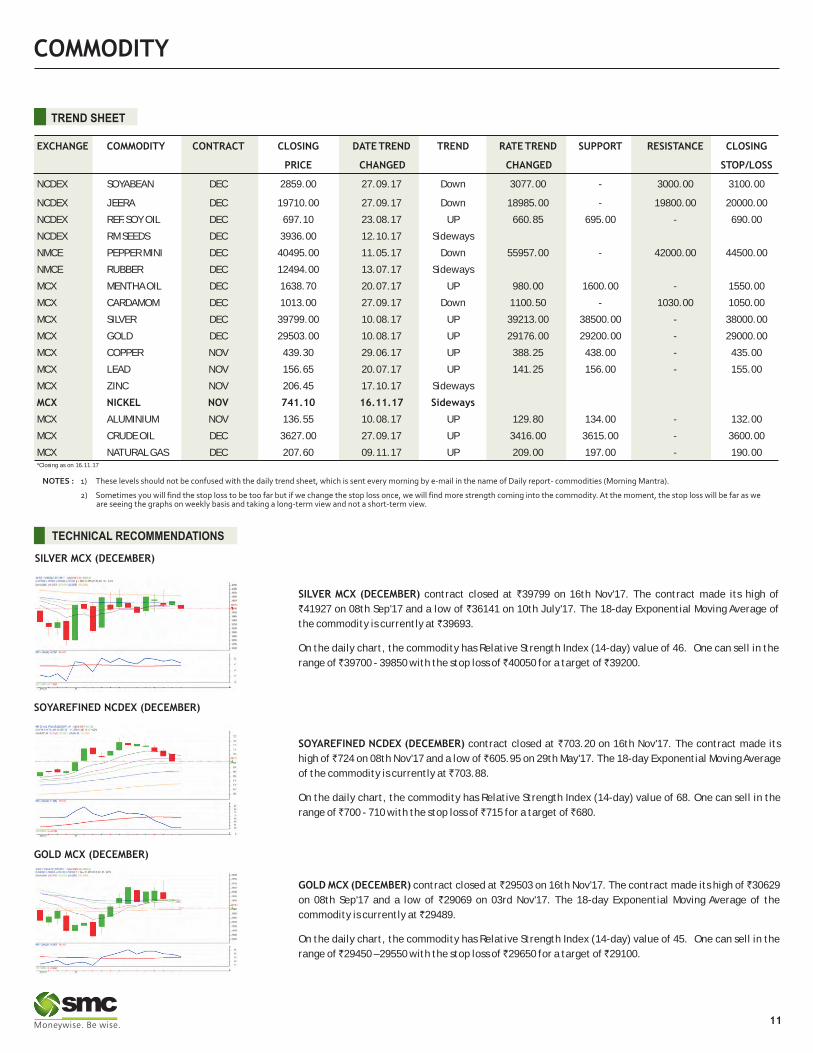
SILVER MCX (DECEMBER) contract closed at `39799 on 16th Nov'17. The contract made its high of
`41927 on 08th Sep'17 and a low of `36141 on 10th July'17. The 18-day Exponential Moving Average of
the commodity is currently at ̀ 39693.
On the daily chart, the commodity has Relative Strength Index (14-day) value of 46. One can sell in the
range of ̀ 39700 - 39850 with the stop loss of ̀ 40050 for a target of ̀ 39200.
SOYAREFINED NCDEX (DECEMBER) contract closed at 703.20 on 16th Nov'17. The contract made its
high of ̀ 724 on 08th Nov'17 and a low of ̀ 605.95 on 29th May'17. The 18-day Exponential Moving Average
of the commodity is currently at ̀ 703.88.
On the daily chart, the commodity has Relative Strength Index (14-day) value of 68. One can sell in the
range of ̀ 700 - 710 with the stop loss of ̀ 715 for a target of ̀ 680.
`
GOLD MCX (DECEMBER) contract closed at 29503 on 16th Nov'17. The contract made its high of 30629
on 08th Sep'17 and a low of `29069 on 03rd Nov'17. The 18-day Exponential Moving Average of the
commodity is currently at ̀ 29489.
On the daily chart, the commodity has Relative Strength Index (14-day) value of 45. One can sell in the
range of ̀ 29450 – 29550 with the stop loss of ̀ 29650 for a target of ̀ 29100.
` `
SILVER MCX (DECEMBER)
SOYAREFINED NCDEX (DECEMBER)
GOLD MCX (DECEMBER)
NOTES : 1) These levels should not be confused with the daily trend sheet, which is sent every morning by e-mail in the name of Daily report- commodities (Morning Mantra).
2) Sometimes you will find the stop loss to be too far but if we change the stop loss once, we will find more strength coming into the commodity. At the moment, the stop loss will be far as we are seeing the graphs on weekly basis and taking a long-term view and not a short-term view.
EXCHANGE COMMODITY CONTRACT CLOSING DATE TREND TREND RATE TREND SUPPORT RESISTANCE CLOSING
PRICE CHANGED CHANGED STOP/LOSS
NCDEX SOYABEAN DEC 2859.00 27.09.17 Down 3077.00 - 3000.00 3100.00
NCDEX JEERA DEC 19710.00 27.09.17 Down 18985.00 - 19800.00 20000.00
NCDEX REF.SOY OIL DEC 697.10 23.08.17 UP 660.85 695.00 - 690.00
NCDEX RM SEEDS DEC 3936.00 12.10.17 Sideways
NMCE PEPPER MINI DEC 40495.00 11.05.17 Down 55957.00 - 42000.00 44500.00
NMCE RUBBER DEC 12494.00 13.07.17 Sideways
MCX MENTHA OIL DEC 1638.70 20.07.17 UP 980.00 1600.00 - 1550.00
MCX CARDAMOM DEC 1013.00 27.09.17 Down 1100.50 - 1030.00 1050.00
MCX SILVER DEC 39799.00 10.08.17 UP 39213.00 38500.00 - 38000.00
MCX GOLD DEC 29503.00 10.08.17 UP 29176.00 29200.00 - 29000.00
MCX COPPER NOV 439.30 29.06.17 UP 388.25 438.00 - 435.00
MCX LEAD NOV 156.65 20.07.17 UP 141.25 156.00 - 155.00
MCX ZINC NOV 206.45 17.10.17 Sideways
MCX NICKEL NOV 741.10 16.11.17 Sideways
MCX ALUMINIUM NOV 136.55 10.08.17 UP 129.80 134.00 - 132.00
MCX CRUDE OIL DEC 3627.00 27.09.17 UP 3416.00 3615.00 - 3600.00
MCX NATURAL GAS DEC 207.60 09.11.17 UP 209.00 197.00 - 190.00
TREND SHEET
*Closing as on 16.11.17
COMMODITY
NEWS DIGEST
Bullion counter traded on a volatile path as stronger local currency capped the upside while weaker greenback supported its prices. Bullions remained in a tight range amid expectations of U.S. interest rate hike next month. Republican U.S. lawmakers last week took an important step toward the biggest tax code overhaul since the 1980s as the House of Representatives approved a broad package of tax cuts sought by President Donald Trump. Cleveland Fed President Loretta Mester stated that she feels inflation is poised to pick up, clearing the way for the Fed to continue its gradual process of raising interest rates. Base metal pack also tumbled lower on weak China data, therefore copper dropped below 440, nickel dropped below 750 and lead fell below 157. Copper and most of the other base metal prices fell last week on persistent worries over Chinese demand, but losses in aluminium were tempered by expectations that a crackdown on polluting industry in China will cut supply. Copper inventories in LME registered warehouses fell by 3,900 tonnes to 251,550 tonnes, continuing a steady decline to the lowest since mid-September. Zinc and copper output in China in October jumped to its highest in almost three years. Zinc production rose 3.8 percent year on year to 577,000 tonnes and copper was up 6.3 percent at 781,000 tonnes. In energy pack, crude and natural gas fell lower as fall in global demand prompted profit booking as higher levels. Increased concerns about growth in U.S. production and inventories, despite the expectations that major world producers will extend a supply-cut deal later this month. Oil prices have slipped from the two-year highs by both crude benchmarks on signs that U.S. supply is rising and could potentially undermine OPEC's efforts to tighten the market. The market has been bolstered of late by funds extending long positions on a bullish outlook for the commodity due to tightening supply worldwide. Expectations that the Organization of the Petroleum Exporting Countries will agree to extend their supply cut pact with other major world producers in Vienna on Nov. 30 has offset some of the recent pressure on prices.
Last week agro commodities went on a roller coaster ride owing to the volatility in the Rupee. The Indian Rupee strengthened surged almost 1 % to 64.79 against the US dollar after credit rating agency Moody's Investors Services upgraded the nation's sovereign ratings to “Baa2” from its lowest investment grade and changed the outlook on the rating to stable from positive. The export related commodities such as cardamom, cotton & jeera cheered the most on the national bourse. Apart from demand, the supply constraint also acted as a catalyst & added flare to their respective prices. On the contrary, the edible oil prices were seen cooling off as the market talks of hike in import duty was getting discounted. The government action of doubling the import duty of wheat to 20%, helped the grain prices to stabilize.
WEEKLY COMMENTARY
COMMODITY UNIT 09.11.17 16.11.17 DIFFERENCEQTY. QTY.
BARLEY MT 10 10 0
CASTOR SEED MT 25035 27161 2126
CHANA MT 190 319 129
CORIANDER NEW MT 4241 5418 1177
GUARGUM MT 18721 20092 1371
GUARSEED MT 17581 19817 2236
JEERA NEW MT 4811 4574 -237
PEPPER MT 30 30 0
RM SEED MT 1626 2947 1321
SOYBEAN MT 70646 97520 26874
TURMERIC MT 706 991 285
WHEAT MT 6169 7632 1463
COMMODITY UNIT 09.11.17 15.11.17 DIFFERENCE
QTY. QTY.
CARDAMOM MT 3.70 3.70 0.00
GOLD KGS 53.00 53.00 0.00
GOLD MINI KGS 65.50 65.20 -0.30
GOLD GUINEA KGS 7.68 7.68 0.00
MENTHA OIL KGS 1549490.25 1579897.85 30407.60
SILVER (30 KG Bar) KGS 36131.55 36653.49 521.94
·Dugald River zinc mine in the Australian state of
Queensland made its maiden shipment of
concentrates earlier this month.
·U.S. industrial production recorded its biggest
increase in six months in October as the drag from
hurricane-related disruptions unwound.
·A unit of Chinese Aluminium Company Chinalco
plans to start producing bauxite in the West African
nation of Guinea this year or early 2018.
·US retail sales rose 0.2% m/m against expectations
of a 0.1% increase.
·The Cabinet Committee on Economic Affairs lifted
all restrictions on export of pulses.
·India's soybean carry-over stocks estimate as on Oct
1 has been revised lower to 1.39 million tons from
1.59 million tons. - Soybean Processors Association
of India.
·MCX has decided to impose Tender Period Margin in
Mentha Oil, beginning from November 20, 2017 on
an incremental basis of 3% aggregating to 15% in
November 2017 expiry contract.
·The CAI has estimated cotton crop for the 2017-18
season at 375.00 lakh bales of 170 kgs each which is
higher by 37.75 lakh bales compared to the previous
year's crop of 337.25 lakh bales.
WEEKLY STOCK POSITIONS IN WAREHOUSE (MCX)
12
WEEKLY STOCK POSITIONS IN WAREHOUSE (NCDEX)
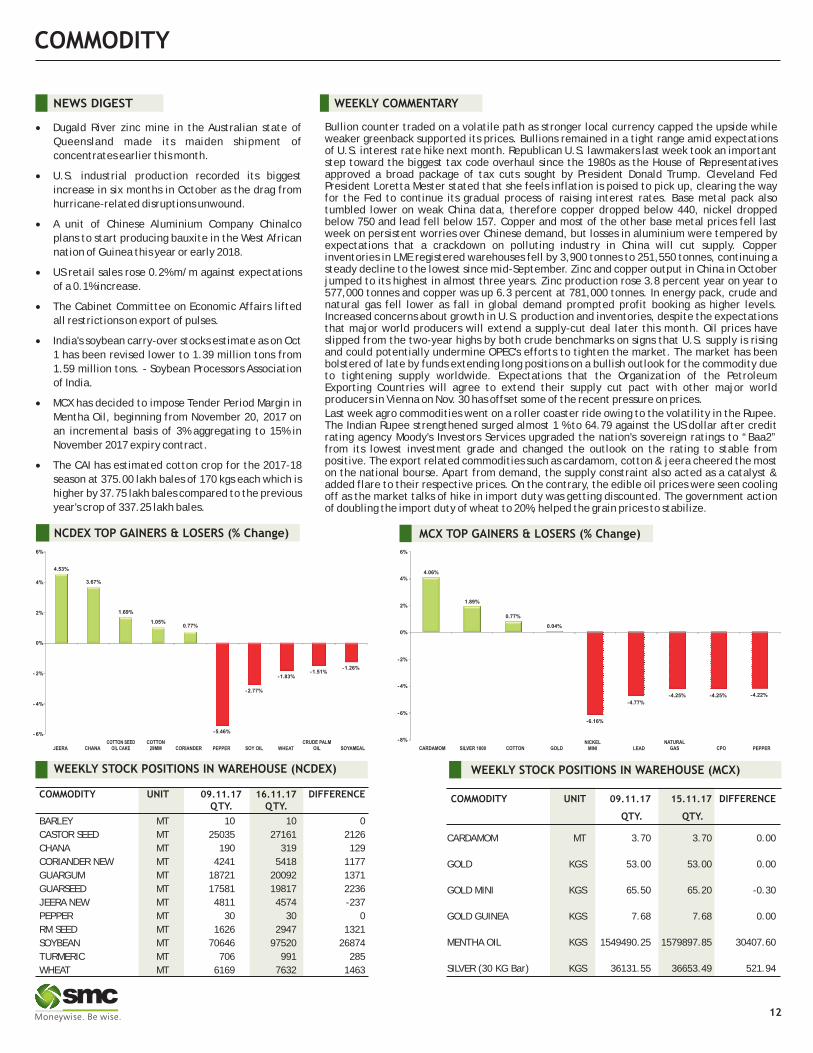
NCDEX TOP GAINERS & LOSERS (% Change) MCX TOP GAINERS & LOSERS (% Change)
4.53%
3.67%
1.69%
1.05%0.77%
-5.46%
-2.77%
-1.83%-1.51%
-1.26%
- 6%
- 4%
- 2%
0%
2%
4%
6%
JEERA CHANACOTTON SEED
OIL CAKECOTTON
29MM CORIANDER PEPPER SOY OIL WHEATCRUDE PALM
OIL SOYAMEAL
-6.16%
-4.77%
-4.25% -4.25% -4.22%
-8%
-6%
-4%
-2%
0%
2%
4%
6%
CARDAMOM
4.06%
1.89%
0.77%
0.04%
SILVER 1000 COTTON GOLDNICKEL
MINI LEADNATURAL
GAS CPO PEPPER
COMMODITY
COMMODITY EXCHANGE CONTRACT 10 16.11.17 CHANGE%
ALUMINIUM LME CASH 2090.00 2106.00 0.77
COPPER LME CASH 6797.00 6764.00 -0.49
LEAD LME CASH 2547.00 2424.00 -4.83
NICKEL LME CASH 12285.00 11570.00 -5.82
ZINC LME CASH 3289.50 3206.00 -2.54
GOLD COMEX DEC 1274.20 1278.20 0.31
SILVER COMEX DEC 16.87 17.07 1.19
LIGHT CRUDE OIL NYMEX DEC 56.74 55.14 -2.82
NATURAL GAS NYMEX DEC 3.21 3.05 -4.98
.11.17
PRICES OF METALS IN LME/ COMEX/ NYMEX (in US $)
WEEKLY STOCK POSITIONS IN LME (IN TONNES)
COMMODITY STOCK POSITION STOCK POSITION DIFFERENCE
09.11.17 16.11.17
ALUMINIUM 1177300 1165825 -11475
COPPER 263425 255450 -7975
NICKEL 380628 382650 2022
LEAD 146775 145925 -850
ZINC 241575 232100 -9475
INTERNATIONAL COMMODITY PRICES
COMMODITY EXCHANGE CONTRACT UNIT 10.11.17 16.11.17 CHANGE(%)
Soybean CBOT JAN Dollars Per Bushel 9.87 9.72 -1.52
Soy oil CBOT DEC Cents per Pound 34.81 34.43 -1.09
CPO BMD FEB MYR per MT 2797.00 2738.00 -2.11
Sugar LIFFE DEC 10 cents per MT 396.20 393.90 -0.58
13
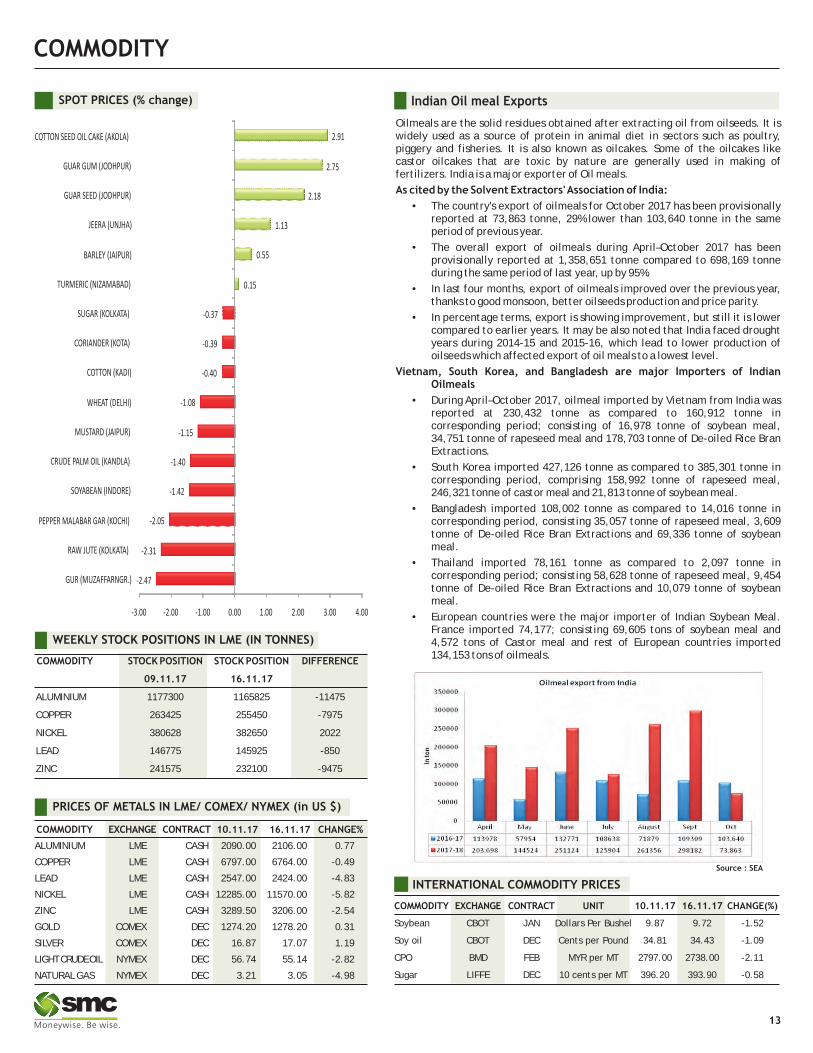
SPOT PRICES (% change) Indian Oil meal Exports
Oilmeals are the solid residues obtained after extracting oil from oilseeds. It is widely used as a source of protein in animal diet in sectors such as poultry, piggery and fisheries. It is also known as oilcakes. Some of the oilcakes like castor oilcakes that are toxic by nature are generally used in making of fertilizers. India is a major exporter of Oil meals.
As cited by the Solvent Extractors' Association of India:
• The country's export of oilmeals for October 2017 has been provisionally reported at 73,863 tonne, 29% lower than 103,640 tonne in the same period of previous year.
• The overall export of oilmeals during April–October 2017 has been provisionally reported at 1,358,651 tonne compared to 698,169 tonne during the same period of last year, up by 95%.
• In last four months, export of oilmeals improved over the previous year, thanks to good monsoon, better oilseeds production and price parity.
• In percentage terms, export is showing improvement, but still it is lower compared to earlier years. It may be also noted that India faced drought years during 2014-15 and 2015-16, which lead to lower production of oilseeds which affected export of oil meals to a lowest level.
Vietnam, South Korea, and Bangladesh are major Importers of Indian Oilmeals
• During April–October 2017, oilmeal imported by Vietnam from India was reported at 230,432 tonne as compared to 160,912 tonne in corresponding period; consisting of 16,978 tonne of soybean meal, 34,751 tonne of rapeseed meal and 178,703 tonne of De-oiled Rice Bran Extractions.
• South Korea imported 427,126 tonne as compared to 385,301 tonne in corresponding period, comprising 158,992 tonne of rapeseed meal, 246,321 tonne of castor meal and 21,813 tonne of soybean meal.
• Bangladesh imported 108,002 tonne as compared to 14,016 tonne in corresponding period, consisting 35,057 tonne of rapeseed meal, 3,609 tonne of De-oiled Rice Bran Extractions and 69,336 tonne of soybean meal.
• Thailand imported 78,161 tonne as compared to 2,097 tonne in corresponding period; consisting 58,628 tonne of rapeseed meal, 9,454 tonne of De-oiled Rice Bran Extractions and 10,079 tonne of soybean meal.
• European countries were the major importer of Indian Soybean Meal. France imported 74,177; consisting 69,605 tons of soybean meal and 4,572 tons of Castor meal and rest of European countries imported 134,153 tons of oilmeals.
-2.47
-2.31
-2.05
-1.42
-1.40
-1.15
-1.08
-0.40
-0.39
-0.37
0.15
0.55
1.13
2.18
2.75
2.91
-3.00 -2.00 -1.00 0.00 1.00 2.00 3.00 4.00
GUR (MUZAFFARNGR.)
RAW JUTE (KOLKATA)
PEPPER MALABAR GAR (KOCHI)
SOYABEAN (INDORE)
CRUDE PALM OIL (KANDLA)
MUSTARD (JAIPUR)
WHEAT (DELHI)
COTTON (KADI)
CORIANDER (KOTA)
SUGAR (KOLKATA)
TURMERIC (NIZAMABAD)
BARLEY (JAIPUR)
JEERA (UNJHA)
GUAR SEED (JODHPUR)
GUAR GUM (JODHPUR)
COTTON SEED OIL CAKE (AKOLA)
Source : SEA

CURRENCY
Currency Table
Currency Pair Open High Low Close
USD/INR 65.47 65.68 65.22 65.38
EUR/INR 76.43 77.47 76.24 76.92
GBP/INR 85.91 86.34 85.68 86.26
JPY/INR 57.62 58.02 57.54 57.75
News Flows of last week
14th Nov UK Inflation remained steady st 3%
14th Nov Japan GDP expands 0.3% in third Quarter
15th Nov UK Jobless rate steady at 42-Year low
15th Nov U.S. Retail Sales unexpectedly rise 0.2% in October
16th Nov U.S. Weekly Jobless claims unexpectedly climb To 249,000
16th Nov U.S. Industrial Production climbed 0.9% in October, more than
expected
EUR/INR (NOV) contract closed at 76.92 on 16th November'17. The contract made its high of 77.47 on 15th November'17 and a low of 76.24 on 13th November'17 (Weekly Basis). The 14-day Exponential Moving Average of the EUR/INR is currently at 76.35.
On the daily chart, EUR/INR has Relative Strength Index (14-day) value of 57.94.One can buy above 77.00 for a target of 78.00 with the stop loss of 76.50.
(* NSE Currency future, Source: Spider, Open: Monday 9.00 AM IST, Close: Thursday (5.00 PM IST)
Market Stance
Indian rupee remained highly volatile in the week gone by tracking mixed
fundamentals. The beginning of a week was on a fragile note as local unit
crumbled amid sustained demand for the US currency. Re-emergence of Fed
rate hike worries alongside aggressive hedging strategy adopted by importers
in the wake of implied currency volatility and ahead of CPI and WPI inflation
data release predominantly kept forex market undertone shaky. However, as
the week passed, some good news came out of the bag in later part as
international rating agency Moody's Investors Service upgraded India's local
and foreign currency issuer ratings to Baa2 from Baa3 and changed the outlook
to stable from positive. The rating upgrade comes after a gap of 13 years -
Moody's had last upgraded India's rating to 'Baa3' in 2004. In 2015, the rating
outlook was changed to 'positive' from 'stable'.
EUR/INR
USD/INR (NOV) contract closed at 65.38 on 16th November'17. The contract made its high of 65.68 on 14th November'17 and a low of 65.22 on 16th November'17 (Weekly Basis). The 14-day Exponential Moving Average of the USD/INR is currently at 65.22.
On the daily chart, the USD/INR has Relative Strength Index (14-day) value of 57.58. One can sell below 65.00 for the target of 64.40 with the stop loss of 65.30
GBP/INR (NOV) contract closed at 86.26 on 16th November'17. The contract made its high of 86.34 on 15th November'17 and a low of 85.68 on 13th November'17 (Weekly Basis). The 14-day Exponential Moving Average of the GBP/INR is currently at 85.82.
On the daily chart, GBP/INR has Relative Strength Index (14-day) value of 55.27. One can buy above 86.35 for a target of 87.35 with the stop loss of 85.85.
JPY/INR (NOV) contract closed at 57.75 on 16th November'17. The contract made its high of 58.02 on 15th November'17 and a low of 57.54 on 13th November'17 (Weekly Basis). The 14-day Exponential Moving Average of the JPY/INR is currently at 57.52.
On the daily chart, JPY/INR has Relative Strength Index (14-day) value of 53.58. One can buy above 58.00 for a target of 59.00 with the stop loss of 57.50
USD/INRTechnical Recommendation
Economic gauge for the next week
Date Currency Event Previous
21st Nov GBP Public Sector Net Borrowing 5.32621st Nov GBP Inflation Report Hearings22nd Nov EUR Non-monetary policy's ECB meeting22nd Nov USD Initial Jobless Claims 24922nd Nov USD Continuing Jobless Claims 1.8622nd Nov USD Durable Goods Orders 2.222nd Nov USD FOMC Minutes23rd Nov EUR Markit PMI Composite 5623rd Nov EUR Markit Manufacturing PMI 58.523rd Nov EUR Markit Services PMI 5523rd Nov GBP Gross Domestic Product (QoQ) 0.423rd Nov EUR ECB Monetary Policy Meeting Accounts24th Nov USD Markit Manufacturing PMI 54.624th Nov USD Markit Services PMI 55.3
GBP/INR JPY/INR
14

IPO
IPO NEWS
Auto component maker Sandhar Technologies plans Rs 400-crore IPO
Auto component manufacturer Sandhar Technologies plans to float an initial public offering this financial year to raise Rs 400-crore. The Gurugram-based company has appointed Axis Capital and ICICI Securities as merchant bankers to advise it on its plans to list on the stock exchanges though it could not be independently confirmed. The IPO will mostly comprise issue of fresh shares with Gaurav Dalmia-promoted GTI Capital, which is a minority shareholder in the company, likely to use the opportunity for an exit. Dalmia is a director on the board of the company. Sandhar makes door handles for cars, wheel rims, locking systems, vision systems, clutch assemblies, brake panels and many other products auto products. The company, promoted by Chairman DN Davar and his family, counts Honda Cars as one of its biggest customers. The list includes Suzuki, Yamaha, Bosch, Korea's Doosan and Hyundai Construction Equipment with TVS, Hero Group and BEML figuring among the local clients.
PE-backed Seven Islands Shipping gets SEBI nod for IPO
India's third-largest liquid seaborne logistics company Seven Islands Shipping Ltd, which counts private equity firm Wayzata Investment Partners among its backers, has received the SEBI nod to float IPO. Mumbai-based Seven Islands, which received regulatory approval on 10 November, is the 40th company to receive SEBI's approval for a public listing this year. It filed its draft prospectus with SEBI on 29 September. The public issue will comprise a fresh issue of shares worth Rs 200 crore, besides a secondary market sale of shares worth Rs 250 crore by Wayzata and the company's promoters, according to the draft prospectus. Edelweiss is the sole merchant banker managing the IPO. The company transports crude oil and related products such as white oils, black oils, and lube oils, apart from liquid chemicals. All its 12 vessels are registered in India, and operate as Indian-owned vessels. As opposed to Indian-owned but foreign-flagged vessels, these have the first right of refusal in any tender by an Indian company for transposition of oil and other liquids.
Galaxy Surfactants files IPO papers with Sebi
Speciality chemicals manufacturer Galaxy Surfactants has filed draft papers with markets regulator to raise an estimated Rs 1,000 crore through an initial public offer. During the initial share sale, as many as 307 shareholders will sell 63,31,674 shares of the company, according to the draft red herring prospectus (DRHP )filed with Sebi. According to merchant banking sources, the initial public offer (IPO) is expected to fetch Rs 1,000 crore. "The objects of the offer are to achieve the benefits of listing the equity shares on the stock exchanges and the sale of equity shares by the selling shareholders. "Further, the company expects that listing of the equity shares will enhance its visibility and brand image and provide liquidity to its existing shareholders," the draft papers stated. ICICI Securities, Edelweiss Financial Services and JM Financial Institutional Securities will manage the company's public issue. The company's equity shares are proposed to be listed on the BSE and the NSE.
Ahmedabad-based Silver Touch Technologies' SME IPO to raise ?40.22 cr
City-based technology provider, Silver Touch Technologies Limited will make a public offer on the SME platform to raise ? 40.22 crore. The company proposes to come with a SME IPO on NSE Emerge platform offering 33.24 lakh shares having face value of ?10 at a premium of ?111 per share. Minimum lot size for bidding is 1,000 equity shares. The issue opens on November 20, and closes on November 23. Founded in 1995, the company has four promoters and provides IT services including Software Services, System Integration, e-Governance Solutions, SAP Solutions, Enterprise Mobile Applications in India and abroad. The company has presence in Mumbai, Delhi, Bengaluru, Kolkata and some other cities in India, with robust international presence in North America, France and the United Kingdom.
Khadim India makes tepid debut, lists at 3% discount to issue price
Footwear retailer Khadim India saw a muted debut, as the scrip got listed at Rs 727 on BSE, down 3.07 per cent over its issue price of Rs 750. The Rs 543-crore initial public offer (IPO), which was sold in Rs 745-750 price band from November 2 to November 6, was subscribed last 1.90 times. At the issue price, the stock valued at 43.8 times FY17 earnings and 2.2 times market cap to sales ratio. The company would be utilising the net IPO proceeds towards payment of loans and general corporate purposes. The asset-light company has 853 branded exclusive retail stores in 23 states and one Union Territory. These include 150 stores in metros and mini-metros, 109 in tier-I cities, 124 in tier-II and 446 in tier-III towns. The retail business revenue accounts for 70 per cent of total revenues, while the rest comes from various multi branded outlets (MBOs) it runs through its distribution network. The footwear company has positioned itself as an affordable brand so far is mainly into eastern India. The company intends to promote premiumisation of its sub-brands. So far, it has two manufacturing plants in West Bengal, but it outsources 85.6 per cent of its production. The domestic footwear market in India is projected to grow at a CAGR of 15 per cent to reach $12.6 billion by FY20 from $ 7.2 billion in Fy16.
HDFC Standard Life Insurance debuts with 8% premium at Rs 313 per share
HDFC Standard Life Insurance Company shares listed with 8 percent premium on the National Stock Exchange. The share price opened at Rs 313 per share against issue price of Rs 290. This is the third life insurance company getting listed on exchanges, after ICICI Prudential Life and SBI Life. The public issue of the subsidiary of housing finance major HDFC was oversubscribed 4.90 times during November 7-9, 2017. The price band for the issue was Rs 275-290 per share. The Rs 8,695-crore public issue comprised sale of 19,12,46,050 equity shares (representing 9.55 percent of paid-up equity capital), by HDFC and up to 10,85,81,768 shares (5.42 percent) holding by Standard Life Mauritius.
*Closing price as on 16-11-2017
Company Sector M.Cap (In Rs Cr.) Issue Size (in Rs Cr.) List Date Issue Price List Price Last Price %Gain/Loss (from Issue price)
Khadim India Ltd Footwear 1242.29 544.00 43053.00 750.00 727.00 691.50 -7.80
New India Assurance Co. Ltd. Insurance 56341.00 9600.00 13-Nov-17 800.00 748.90 683.75 -14.53
Mahindra Logistics Limited Logistics 2948.12 830.00 10-Nov-17 429.00 432.00 414.40 -3.40
Reliance Nippon Life Insurance 16649.46 1542.00 6-Nov-17 252.00 294.00 272.05 7.96
General Insurance General Insurance 70325.12 11373.00 25-Oct-17 912.00 850.00 801.70 -12.09
Indian Energy Exchange Power Trading 4581.29 1000.00 23-Oct-17 1650.00 1500.00 1510.55 -8.45
MAS Financial Services Financial Services 3222.60 460.00 18-Oct-17 459.00 660.00 589.55 28.44
Godrej Agrovet Agri Business 10221.69 1157.00 16-Oct-17 460.00 621.00 532.30 15.72
Prataap Snacks Limited FMCG 1179.85 482.00 5-Oct-17 938.00 1250.00 2767.11 195.00
SBI Life Insurance Company Insurance 64970.00 8400.00 3-Oct-17 700.00 733.30 649.70 -7.19
*
IPO TRACKER
15
16
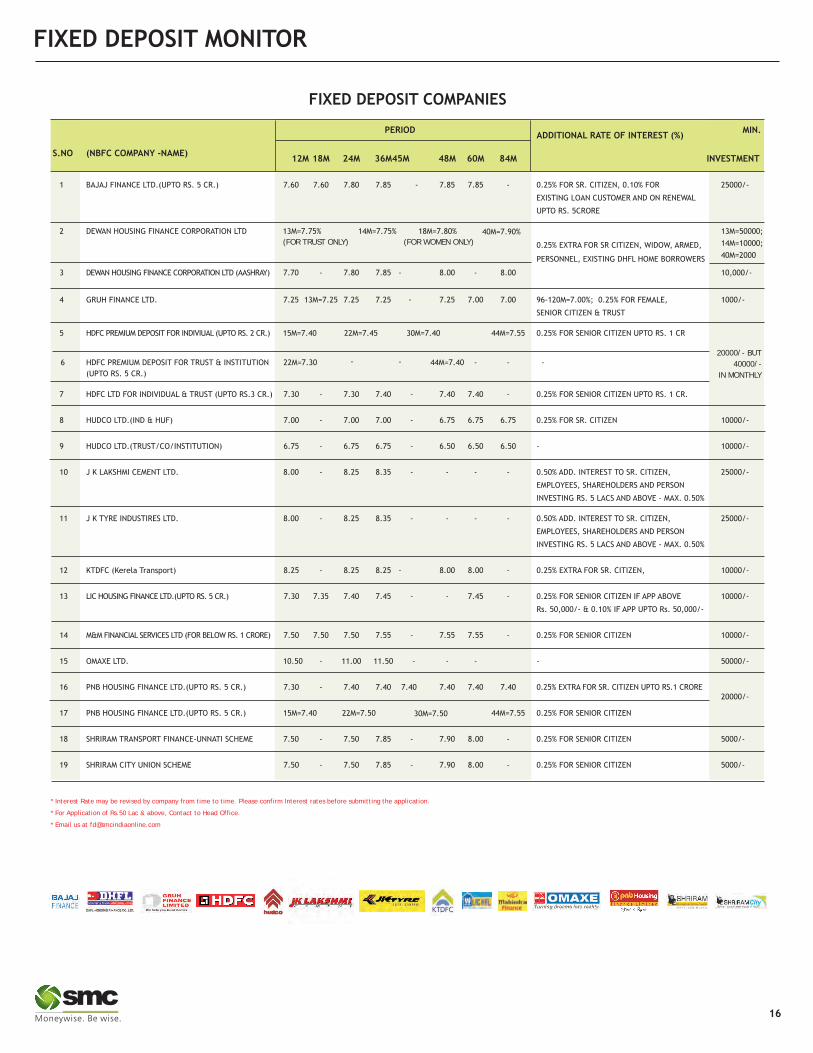
FIXED DEPOSIT MONITOR
* Interest Rate may be revised by company from time to time. Please confirm Interest rates before submitting the application.
* For Application of Rs.50 Lac & above, Contact to Head Office.
* Email us at [email protected]
FIXED DEPOSIT COMPANIES
(FOR TRUST ONLY) (FOR WOMEN ONLY)
20000/- BUT
40000/-
IN MONTHLY
INDUSTRY & FUND UPDATE
MUTUAL FUND
Inflows in equity mutual funds surge to Rs 2.86 lakh crore Equity mutual funds registered a staggering inflow of Rs 2.86 lakh crore in the past 11 months bolstered by the ban on high value currency notes, latest industry data showed. According to the Association of Mutual Funds in India (Amfi) data, equity funds received an inflow of Rs 2.86 lakh crore from November 2016 to October 2017. Prior to that, such funds had registered flows of Rs 1.5 lakh crore between October 2016 and December 2015. Overall, the asset base of the mutual fund industry, comprising 42 players, reached an all-time high of Rs 21.41 lakh crore in October-end, while that of equity AUM was over Rs 6.32 lakh crore.
Top 10 AMCs' assets swell 37% in FY17, profit grows 21% The asset base of top 10 mutual funds rose sharply by 37 per cent in 2016-17 while their profits grew 21 per cent, leaving room for better operating leverage to kick in for most players. Among the top players, profitability declined for Kotak Mahindra Mutual Fund , IDFC Mutual Fund and DSP BlackRock Mutual Fund, but they witnessed robust growth ranging 16-64 per cent in their asset base. This indicates that operating leverage is yet to kick in for most mutual fund players. HDFC AMC emerged as the most profitable fund house in the country during the past fiscal. It reported a 13 per cent rise in its PBT at Rs 800 crore and its AUM climbed 35 per cent to Rs 2.37 lakh crore. This is followed by ICICI Prudential Mutual Fund, which posted a profit of Rs 735 crore, a jump of 47 per cent from the preceding fiscal. Its AUM went up by 38 per cent to Rs 2.43 lakh crore. Reliance Mutual Fund recorded a 19 per cent increase in its PBT at Rs 592.3 crore while the asset base rose 33 per cent to Rs 2.11 lakh crore. Aditya Birla AMC profit grew just 5 per cent to Rs 335 crore. However, it witnessed a jump of 43 per cent in its AUM to Rs 1.95 lakh crore. SBI Mutual Fund's PBT spurted by 31 per cent to Rs 330 crore while its AUM went up by 47 per cent to Rs 1.57 lakh crore. Notably, DSP BlackRock Mutual Fund recorded the highest growth in AUM, but showed up a negative profitability. Its asset base surged by a steep 64 per cent to Rs 64,177 crore at the end of March this year while its PBT declined 2 per cent to Rs 119.6 crore in 2016-17. Further, Kotak Mahindra's PBT fell by 19 per cent to Rs 58.6 crore while the asset base swelled by 58 per cent to Rs 92,216 crore. Profit before tax of IDFC Mutual Fund dropped by 14 per cent to Rs 140 crore while its AUM climbed by 16 per cent to Rs 60,636 crore.
ICICI Prudential Mutual Fund seeks SEBI approval for 10-year ELSS fundICICI Prudential Mutual Fund has filed an offer document with the Securities and Exchange Board of India seeking approval to launch a 10-year close-ended fund, according to a draft offer document on SEBI website. The scheme called, ICICI Prudential Long Term Wealth Enhancement Fund, will deploy at least 80 percent of its corpus in equities, cumulative convertible preference shares and fully convertible debentures and bonds of companies. It also has the provision to invest up to 20 percent of its assets in debt and money market instruments. ELSS schemes can be used to save income tax of up to Rs 1.5 lakh under Sector 80C of the Income Tax Act.
HDFC MF launches housing opportunities fundHDFC Asset Management Company has announced the launch of a housing opportunities fund, first of its kind fund scheme dedicated to housing and allied businesses in the country. The close-ended thematic equity fund aims to provide long-term capital appreciation by investing majorly in equity and equity-related instruments of entities engaged in and/or expected to benefit from growth in housing and its allied business activities, the AMC said in a statement. The fund will be open for subscription from November 16 and closes on November 30. The minimum amount an investor can park in this fund is Rs 5,000 . The new fund will deploy at least 80 per cent of its corpus in equity and equity-related instruments of entities in housing and its allied business activities and the rest in corporate debt.
DSP BlackRock AMC's new fund opens from November 17DSP BlackRock Investment Managers will be launching ACE (analysts' conviction equalised) fund - series 1, which is a multi-cap fund. The close-ended equity scheme will invest across large caps, mid and small cap stocks and is based on the belief that a consistent investment process precedes strong performance, the AMC said in a statement. The scheme will avoid sector and stock allocation bias as it aims to protect the portfolio against falling markets through put options at a reasonable price. The fund will open for subscription from November 17, and close on December 1.
Birla Sun Life files for corporate bond fundBirla Sun Life Mutual Fund has filed offer documents with Sebi to launch Birla Sun Life Corporate Bond Fund, an open-ended income scheme. The new fund offer price is Rs 10 per unit. The fund house aims to generate returns by predominantly investing in a portfolio of corporate debt securities. The scheme offers both growth and dividend (payout & reinvestment) options under both regular plan and direct plan. The minimum application amount will be Rs 5,000 and in multiples of Re 1 thereafter. The scheme aims to raise Rs 10 crore during the NFO period. The scheme shall invest 50-100% in corporate debt securities excluding government securities and state developmental loans and up to 50% in money market instruments. The scheme shall not invest in government securities and state developmental loans but may invest in money market instruments including T-bills, repo, and reverse repos & CBLO within the limits mentioned in asset allocation pattern. The scheme may also invest up to 50 per cent of the net assets in securitised debt instruments except foreign securitised debt.
NEW FUND OFFER
Scheme Name Indiabulls Tax Savings Fund - Regular Plan (G)
Fund Type Open-Ended
Fund Class Growth
Opens on 21-Sep-2017
Closes on 20-Dec-2017
Investment Objective To generate long-term capital appreciation from a diversified portfolio of predominantly equity and equity-related Securities.
Min. Investment Rs. 5000
Fund Manager Malay Shah / Sumit Bhatnagar
Scheme Name UTI Long Term Advantage Fund - Series VI - Regular Plan (G)
Fund Type Close Ended
Fund Class Growth
Opens on 05-Oct-2017
Closes on 05-Jan-2018
Investment Objective The investment objective of the scheme is to provide medium to long term capital appreciation along with income tax benefit.
Min. Investment Rs. 500
Fund Manager Lalit Nambiar
17

Note: Indicative corpus are including Growth & Dividend option. The above mentioned data is on the basis of 16/11/2017Beta, Sharpe and Standard Deviation are calculated on the basis of period: 1 year, frequency: Weekly Friday, RF: 7%
MUTUAL FUND Performance Charts
Returns (%) Risk Market Cap (%)
Scheme Name NAV Launch QAAUM 3M 6M 1Y 3Y Since Std.Dev Beta Jenson LARGE MID SMALL DEBT &
(`) Date (` Cr.) Launch CAP CAP CAP OTHER
Principal Tax Savings Fund 212.80 31-Mar-1996 345.00 10.49 12.67 41.54 15.09 17.38 116.10 1.09 7.88 52.83 39.09 4.76 3.32
IDFC Tax Advantage (ELSS) Fund - Reg - G 55.44 26-Dec-2008 661.74 6.69 11.75 40.91 15.97 21.23 99.00 0.87 6.62 46.91 31.67 16.82 4.60
Mirae Asset Tax Saver Fund - Reg - G 16.14 28-Dec-2015 526.46 6.30 11.62 39.54 N.A 28.85 101.16 0.94 11.60 64.22 30.47 4.21 1.10
Reliance Tax Saver (ELSS) Fund - G 65.67 21-Sep-2005 8960.11 9.05 14.01 36.95 12.92 16.74 117.24 1.08 4.94 58.16 29.67 10.34 1.83
Aditya Birla Sun Life Tax Relief 96 - G 30.38 06-Mar-2008 3761.41 8.66 12.27 36.48 16.41 12.13 92.11 0.84 5.93 38.47 60.45 0.14 0.94
Aditya Birla Sun Life Tax Plan - Growth 38.06 03-Oct-2006 576.94 8.62 12.07 35.83 15.75 12.76 90.38 0.82 5.62 37.88 60.16 0.14 1.83
HSBC Tax Saver Equity Fund - Growth 37.43 05-Jan-2007 185.72 4.64 5.87 35.36 12.80 12.91 106.54 1.01 4.41 54.43 30.83 11.79 2.95
TAX Fund Due to their inherent long term nature, the following 3 categories have been sorted on the basis of 1 year returns
Returns (%) Risk Market Cap (%)
Scheme Name NAV Launch QAAUM 3M 6M 1Y 3Y Since Std.Dev Beta Jenson LARGE MID SMALL DEBT &
(`) Date (` Cr.) Launch CAP CAP CAP OTHER
L&T Emerging Businesses Fund - Reg - G 26.72 12-May-2014 1503.08 10.07 13.60 54.87 25.63 32.23 112.15 0.85 16.28 N.A 58.71 28.46 12.82
Reliance Small Cap Fund - Growth 42.64 16-Sep-2010 4301.13 12.18 12.43 49.28 22.47 22.41 124.34 0.94 11.12 5.10 37.09 49.88 7.93
IDFC Sterling Equity Fund - Reg - G 54.36 07-Mar-2008 1598.83 7.41 11.44 47.70 16.87 19.07 113.61 0.91 9.47 20.05 53.86 20.02 6.06
L&T Midcap Fund - Reg - Growth 143.65 09-Aug-2004 1146.75 8.82 11.76 47.09 21.97 22.22 103.47 0.80 12.41 23.02 54.39 7.72 14.87
HDFC Small Cap Fund - Growth 41.93 03-Apr-2008 1228.28 13.96 12.96 46.11 19.30 16.05 112.80 0.93 10.26 1.50 53.99 32.61 11.89
IDFC Focused Equity Fund - Reg - G 38.23 16-Mar-2006 335.06 4.92 14.99 45.69 11.70 12.17 97.37 0.90 7.54 50.78 26.10 7.25 15.86
Aditya Birla Sun Life Pure Value Fund - G 62.67 27-Mar-2008 1540.35 11.16 13.70 45.48 19.88 20.95 123.77 1.01 11.33 21.37 62.13 9.73 6.77
EQUITY (Diversified) Due to their inherent long term nature, the following 3 categories have been sorted on the basis of 1 year returns
Annualised
Returns (%) RiskAverage Yield till
Scheme Name NAV Launch QAAUM Since Std. SharpeMaturity (Years) Maturity
1W 2W 1M 6M 1Y 3Y(`) Date (`Cr.) Launch Dev.
BOI AXA Corporate Credit Spectrum F - Reg - G 12.95 27-Feb-2015 1245.09 -0.72 2.94 4.72 8.93 8.87 N.A 9.97 7.68 0.37 1.99 10.21
Franklin India Income Opportunities F - G 20.13 11-Dec-2009 3149.77 -1.68 1.59 4.75 8.96 8.79 9.08 9.22 12.91 0.10 2.23 9.63
Baroda Pioneer Credit Opportunities F - Reg - G 13.17 23-Jan-2015 828.18 -3.56 -0.49 3.01 7.98 8.11 N.A 10.27 8.45 0.31 3.13 8.22
Franklin India IBA - Growth 59.81 23-Jun-1997 969.78 -5.73 -0.49 3.63 7.90 7.87 8.83 9.16 11.96 0.10 2.47 8.96
Aditya Birla Sun Life Corporate Bond F - Reg - G 12.64 17-Apr-2015 3296.88 -4.74 -0.66 3.06 8.26 7.71 N.A 9.48 11.34 0.20 2.34 8.89
Edelweiss Corporate Debt Oppor. F - Reg - G 13.15 22-Sep-2014 254.68 -9.42 -4.41 0.27 8.06 7.30 8.52 9.08 8.62 0.12 4.50 8.00
Invesco India Medium Term Bond Fund - G 1733.19 30-Dec-2010 1242.19 2.05 3.51 4.63 7.03 7.25 8.40 8.32 3.30 0.33 0.96 7.64
INCOME FUND
Returns (%) Risk Average Yield tillScheme Name NAV Launch QAAUM Since Std. Sharpe Maturity (Years) Maturity
1W 2W 1M 6M 1Y 3Y(`) Date (`Cr.) Launch Dev.
Franklin India STIP - Growth 3581.20 31-Jan-2002 8574.52 -5.19 -0.32 3.93 9.06 8.96 9.01 8.41 12.87 0.10 2.33 9.64
L&T Short Term Income Fund - Reg - G 18.30 04-Dec-2010 840.20 -0.80 2.01 4.19 8.04 8.18 9.20 9.07 6.47 0.29 1.57 8.23
Aditya Birla Sun Life Medium Term Plan - Reg - G 21.52 25-Mar-2009 11101.30 -6.36 -2.12 2.26 7.97 6.95 9.55 9.26 13.39 0.14 3.34 8.64
Kotak Flexi Debt Scheme - Reg - G 21.98 27-May-2008 1371.85 -13.46 -6.21 -0.21 7.49 5.06 9.37 8.66 20.77 0.12 3.89 7.70
Aditya Birla Sun Life Short Term Oppor. F - Reg - G 28.38 24-Apr-2003 5775.86 -6.28 -1.81 1.37 7.36 5.38 8.80 7.42 14.81 0.10 2.93 7.71
DHFL Pramerica Short Maturity Fund - G 31.20 21-Jan-2003 1839.87 -6.88 -2.17 2.53 7.29 7.03 8.71 7.97 8.36 0.17 2.56 7.91
DSP BlackRock Banking & PSU Debt F - Reg - G 14.45 14-Sep-2013 1893.64 -9.40 -3.93 0.14 7.20 5.45 8.61 9.21 12.44 0.10 3.03 7.04
SHORT TERM FUND Due to their inherent short term nature, Short term funds have been sorted on the basis of 6month returns
Annualised
Returns (%) Risk Market Cap (%)
Scheme Name NAV Launch QAAUM 3M 6M 1Y 3Y Since Std.Dev Jenson LARGE MID SMALL DEBT &
(`) Date (` Cr.) Launch CAP CAP CAP OTHER
Reliance RSF - Balanced - Growth 54.00 08-Jun-2005 8133.18 2.97 9.27 25.66 12.35 14.51 78.45 2.71 59.14 11.14 1.49 28.23
Mirae Asset Prudence Fund - Reg - G 13.43 29-Jul-2015 701.41 3.47 8.40 24.63 N.A 13.67 76.26 3.85 64.89 8.79 0.95 25.36
HDFC Prudence Fund - Growth 516.91 01-Feb-1994 29593.40 6.46 7.67 24.24 11.23 19.33 98.28 2.87 53.72 12.93 6.35 26.99
L&T India Prudence Fund - Reg - Growth 25.69 07-Feb-2011 6154.21 2.28 5.13 23.98 13.20 14.94 71.80 2.40 48.36 20.34 2.53 28.77
ICICI Prudential Balanced - Growth 127.09 03-Nov-1999 17222.40 5.15 8.32 23.14 13.10 15.13 75.17 5.09 52.20 11.54 0.99 35.27
HDFC Balanced Fund - Growth 147.38 11-Sep-2000 14268.40 3.65 7.85 23.10 12.96 16.94 74.89 3.80 45.62 20.00 1.94 32.44
UTI Balanced Fund - Growth 167.69 20-Jan-1995 3316.86 4.11 6.32 22.04 10.38 16.11 73.03 3.03 43.42 18.15 6.73 31.70
BALANCED
18


