Embed Size (px)
Citation preview

i
WISCONSIN INTERNATIONAL UNIVERSITY COLLEGE
AN ASSESSMENT ON THE PERFORMANCE OF ALUWORKS LIMITED USING
FINANCIAL RATIOS FROM 2014 – 2016.
(A CASE STUDY OF ALUWORKS LIMITED GHANA)
BY
AGBO JOSHUA FORSON
(WIUC/03/5796)
&
MICHAEL ALIMO
(WIUC/03/6022)
A research work submitted to the Department of Business Studies of the
Faculty of Banking and Finance, Wisconsin International University College,
in the partial fulfillment of the requirements for award of Bachelor of Arts
Business Studies Degree in Banking and Finance.
JUNE, 2018

ii
DECLARATION
We hereby declare that this project work is the result of our own original research and that no part
of it has been presented for another degree in this university or elsewhere.
................................................. ..…………………………………….
AGBO JOSHUA FORSON (WIUC/03/5796) DATE
(STUDENT)
……………………………… ……………………………………….
MICHAEL ALIMO (WIUC/03/6022) DATE
(STUDENT)
Supervisor’s Declaration
I hereby declare that the preparation and presentation of the project work were supervised in
accordance with the guidelines on the supervision of the project work laid down by Wisconsin
International University College.
Supervisor’s Signature: …………………………. Date: ………………………
Name: Mr. Elias Megbetor

iii
ACKNOWLEDGMENT
First, we would like to thank our supervisor Mr. Elias Megbetor for his unreserved supervision
which led to the completion of this paper. In addition, our thanks go to the management and staff
members of Aluworks Limited especially to Wallace Dankwah, Human Resource Manager, for his
support to provide data for the study. Last but not least, we warmly acknowledged the contribution
of the late James Oblie for his effort to bring this study into reality.

iv
DEDICATION
We dedicate this project to our parents because they are the reason why we strived to make this
work a success.

v
ABSTRACT
This study attempts to look at the usage of financial ratios to assess the performance of
Aluworks Limited. The objectives of this study are to determine the performance of the company
with respect to profitability, liquidity and efficiency. The method employed involved the
conducting of interviews with management and some key employees. The financial statements
were used to compute the categories of ratios, analysed and presented. The key findings the study
revealed include the following; Inconsistency in the performance of Aluworks under the
profitability ratios, liquidity and especially for the return on capital employed. It also showed that
the company had a poor creditor’s collection period. The study brought to light that the company
was not liquid when comparing the current ratio performance to the standard current ratio.
Lastly, the interviews revealed that the company’s cost of sales and expenses were more than the
revenue generated.

vi
TABLE OF CONTENTS
DECLARATION .......................................................................................................................................... ii
ACKNOWLEDGMENT .............................................................................................................................. iii
DEDICATION ............................................................................................................................................. iv
ABSTRACT .................................................................................................................................................. v
CHAPTER ONE ........................................................................................................................................... 1
1.1 Introduction ............................................................................................................................................. 1
1.2 Statement of the Problem ........................................................................................................................ 1
1.3 Objective of the Study ............................................................................................................................ 2
General Objectives ........................................................................................................................................ 2
The Specific Objectives are: ......................................................................................................................... 2
1.4 Research Questions ................................................................................................................................. 2
1.5 Significance of the Study ........................................................................................................................ 2
1.6 Definition of Terms ................................................................................................................................. 3
1.8 Limitation of the Study ........................................................................................................................... 3
1.9 Organization of the Study ....................................................................................................................... 4
CHAPTER TWO .......................................................................................................................................... 5
LITERATURE REVIEW ............................................................................................................................. 5
2.0 Introduction ............................................................................................................................................. 5
2.1 Theoretical Review ................................................................................................................................. 5
2.1.1 Definition of Financial Ratios .............................................................................................................. 5
2.1.2 Ratio classification and analysis .......................................................................................................... 6
2.1.2.1 Activity ratios .................................................................................................................................... 6
2.1.2.2 Liquidity Ratios ................................................................................................................................ 7
2.1.2.3 Cash flow ratios ................................................................................................................................ 7
2.1.2.4 Debt/leverage ratios .......................................................................................................................... 8
2.1.2.5 Profitability ratios ............................................................................................................................. 9
2.2 Empirical Review of Literature............................................................................................................... 9
CHAPTER THREE .................................................................................................................................... 14
METHODOLOGY ..................................................................................................................................... 14
3.1 Introduction ........................................................................................................................................... 14
3.2 Research Design .................................................................................................................................... 14
3.3 Population ............................................................................................................................................. 14

vii
3.4 Sample size ........................................................................................................................................... 15
3.4.2 Primary Sources of Data .................................................................................................................... 15
3.4.3 Secondary source Data ....................................................................................................................... 16
3.5 Technique of Selection ......................................................................................................................... 16
3.6 Data collection Instrument .................................................................................................................... 16
3.7 Data Collection Procedure .................................................................................................................... 16
3.8 Data Analysis ........................................................................................................................................ 17
3.8.1 Profitability ratio ................................................................................................................................ 17
3.8.2 Efficiency ratio ................................................................................................................................... 17
CHAPTER 4 ............................................................................................................................................... 19
DATA ANALYSIS, RESULTS AND DISCUSSIONS ............................................................................. 19
4.0 Introduction ........................................................................................................................................... 19
4.1 Performance of Aluworks limited with respect to profitability. ........................................................... 19
4.2 Performance of Aluworks Limited with respect to efficiency. ............................................................. 22
4.3 Performance of Aluworks Limited with respect to Liquidity. .............................................................. 27
CHAPTER 5 ............................................................................................................................................... 29
SUMMARY, CONCLUSIONS AND RECOMMENDATIONS ............................................................... 29
5.1 Introduction ........................................................................................................................................... 29
5.2 Summary of Findings ............................................................................................................................ 29
5.3 Conclusion ............................................................................................................................................ 30
5.4 Recommendations ................................................................................................................................. 30
REFERENCES ........................................................................................................................................... 32
APPENDIX ................................................................................................................................................. 34

viii

1
CHAPTER ONE
An Assessment On the Performance of AluWorks Limited Using Financial Ratios From
2014-2016
1.1 Introduction
Measuring the performance of firms helps in assessing, evaluating and forecasting on what to do
next in the nearby future. (American Institute of Certified Public Accountant, 1994). Assessing a
firm’s performance using financial ratios has been a traditional yet powerful tool for
decision-makers, including business analysts, creditors, investors, and financial managers.
Financial ratio analysis can help stakeholders analyze the financial health of a company. Using
these financial ratios, comparisons can be made across companies within an industry, between
industries, or within a firm itself. Such a tool can also be used to compare the relative performance
of different size companies. Accounting and finance textbooks generally organize financial ratios
into classes including liquidity, profitability, long-term solvency, and asset utilization or turnover
ratios. Liquidity ratios evaluate the ability of a company to pay a short-term debt, whereas
long-term solvency ratios investigate how risky an investment in the firm could be for creditors.
Profitability ratios examine the profit-generating ability of a firm based on sales, equity, and
assets. Asset utilization or turnover ratios measure how successfully the company generates
revenues by utilizing assets, collecting receivables, and selling its inventories.
1.2 Statement of the Problem
Most organizations and businesses have some knowledge about how financial ratios are applied,
analyzed and translated. Despite companies putting in a lot of promising investments, the
ineffective application of financial ratios by some companies has led to the failure of their
investments. (Adegoke, 2007). Ratio analysis is a useful management tool that improves the

2
understanding of financial results and trends over time, and provides key indicators of
organizational performance. However, the ineffective use of financial ratios affects the company
in terms of assessing whether the company is performing well or not. As a result of this
phenomenon, this study focused on assessing the performance of AluWorks Ghana Limited using
financial ratios, analyzing and interpreting them.
1.3 Objective of the Study
General Objectives
The general objective of the study is to assess the performance of AluWorks Limited a 3year
audited financial statement.
The Specific Objectives are:
To evaluate the profitability performance of AluWorks Limited through the profit and
loss statement.
To evaluate the efficiency ratio of AluWorks limited in the course of the study.
To evaluate the performance of AluWorks Limited in relation to liquidity ratio.
1.4 Research Questions
What is the performance of AluWorks Limited in the terms of profitability ratio?
What is the performance of AluWorks Limited in terms of efficiency ratio?
What is the performance of AluWorks Limited in terms of liquidity ratio?
1.5 Significance of the Study
The importance of the study is to improve the financial performance of AluWorks Limited by
3
assessing their financial statements over a 3-year period. Furthermore, the findings from this study
will help us make relevant suggestions and recommendations that have the potential to improve
the performance of AluWorks. Financial ratios help the management in understanding the past and
present financial state of the company. These also provide a useful idea about the existing strength
and weaknesses of the company over a specific period of time. This knowledge is vital for the
management to plan and forecast the future of the company. Finally, applying financial ratios
properly helps to provide adequate information on efficiency and profitability of the company.
1.6 Definition of Terms
Financial ratios: A financial ratio is a relative magnitude of two selected numerical values
taken from an enterprise's financial statements.
Profitability ratio: It is the ratio that focuses on the profitability of the firm. Profit margins
measure performance with relations to sales. In other words, it indicates how well a firm is
performing in terms of its ability to generate profit.
Efficiency ratio: This measurement of how well a company can manage income and
expenses.
Liquidity ratio: It is the ratio that measures a firm's ability to meet its short-term financial
obligations on time.
Leverage ratio: this measures the relative contributions of stockholders and creditors and
of the firm's ability to pay financing charges.
1.8 Limitation of the Study
The study is expected to experience certain challenges in achieving its aims and objectives. This

4
includes limited time within which the study may be completed. The researcher will try as much as
possible to work within the specified time frame. Information on the financial report, books and
materials will be hard to get and the information may not be sufficient. The researcher will try as
much as possible to get all the information on the company's website.
1.9 Organization of the Study
This study is structured into five chapters.
Chapter one gives a brief description of the subject of study. It starts by presenting the background
of the study. It continues by providing the statement of the problem of the study, the aims and
objectives, research questions, definitions of the key concepts, the significance of the study, the
limitations of the study and finally, the structure of the study.
Chapter two discusses the theoretical positioning of the study as well as empirical studies on the
subject matter. The focus will be on theories and concepts on the subject matter.
Chapter three presents the study’s methodology and discusses the procedures used to obtain the
data, the reason for using the methods, the validity of the study, sampling procedures and
procedures for analyzing data. It will also provide statistical analysis of the study of findings.
Chapter four will focus on the analysis and discussions of the overall data gathered on the study
and the presentation of results.
Finally, chapter five will include discussions on the findings, conclusions and recommendations.

5
CHAPTER TWO
LITERATURE REVIEW
2.0 Introduction
This chapter reviews the theoretical and empirical literature relating to financial ratios.
2.1 Theoretical Review
'A financial ratio is a two or more line items from financial statements joined by a mathematical
operation. (Bailey 2012). Financial statements are the balance sheet, the income statement, the
statement of retained earnings and the statement of cash flow.
Financial statement analysis allows analysts to identify trends by comparing ratios across multiple
time periods and statement types. These statements allow analysts to measure liquidity,
profitability, company-wide efficiency and cash flow. There are three main types of financial
statements: the balance sheet, income statement and cash flow statement. Ratios are extracted from
financial statements to enable analysts to assess the strengths and weaknesses of a company.
The balance sheet is a snapshot in time of the company's assets, liabilities and shareholders' equity.
Analysts use the balance sheet to analyze trends in assets and debts. The income statement begins
with sales and ends with net income. It also provides analysts with gross profit, operating profit
and net profit. Each of these is divided by sales to determine gross profit margin, operating profit
margin and net profit margin. The cash flow statement provides an overview of the company's cash
flows from operating activities, investing activities and financing activities.
2.1.1 Definition of Financial Ratios
The quantitative relation between two amounts showing the number of times one value contains or
is contained within the other. (Patrick 2006)
6
2.1.2 Ratio classification and analysis
Financial ratios are generally classified into the categories discussed below:
2.1.2.1 Activity ratios
Activity / Turnover Ratios are a set of financial ratios used to measure the efficiency of various
operations of a business. Activity ratios measure the efficiency of the firm in using its resources/
assets. Those Ratios include:
• Accounts receivable turnover which is equal to net credit sales/average accounts
receivable.
• Accounts receivable period (the number of days’ purchases in receivables) which is equal
to 360 days/accounts receivables turnover.
• Inventory turnover which is equal to Cost of goods sold/ average inventory.
• A number of days inventory which is equal to (inventory/cost of goods sold) *360.
• Accounts payable turnover which is equal to the cost of goods sold/average accounts
payable.
• Accounts payable period (the number of days’ purchases is payables) which is equal to 360
days/accounts payable turnover.
• Assets turnover which is equal to net sales/ average total assets (Delta, 2006:64).
Delta (2006) says that in the absence of information on whether sales or purchase are made on
credit or cash, an assumption can be made that all sales and purchases are on credit basis.
7
2.1.2.2 Liquidity Ratios
Liquidity ratio refers to the ratio between the liquid assets and the liabilities of a bank or other
institution. This includes:
• The current ratio is an indicator of a firm's ability to meet short-term financial obligations.
It is the ratio of a current asset to current liabilities. Though every industry has a range of
acceptable current ratios, a ratio of 2:1 is considered desirable in most sectors. Since
inventory is included in the current asset, acid test ratio is a more suitable measure where
salability of inventory is questionable. The current ratio is equal to current assets/current
liabilities.
• Quick (acid-test) ratio is a key measure of a firm's liquidity. It answers the question " can
this firm meet its current obligations from its liquid asset if suddenly all sales stop?".
Usually, an acid test ratio of 1.0 or higher is considered satisfactory by lenders and
investors. Acid test ratio is equal to (current assets - inventory)/current liabilities.
2.1.2.3 Cash flow ratios
Cash flow ratio is a measure of how well current liabilities are covered by the cash flow generated
from a company's operations. The operating cash flow ratio can gauge a company's liquidity in the
short term. Cash flow ratio is a measure of how well current liabilities are covered by the cash flow
generated from a company's operations. The operating cash flow ratio can gauge a company's
liquidity in the short term. This includes:
• Cash flow to average total current liabilities;

8
• Cash flow and bank to total assets;
• Cash flow and bank to current liability;
• Cash flows from operating activities/operating income;
• Cash flows from operating activities/net income;
• Cash flow return on assets which is equal to (Cash flows from operating activities +
interest paid + taxes paid)/average total assets; and
• Cash flow return on equity which is equal to (Cash flows from operating activities -
preferred dividends paid)/average common stockholders' equity (Delta Publishing,
2006:117).
2.1.2.4 Debt/leverage ratios
A leverage ratio is any kind of financial ratio that indicates the level of debt incurred by a business
entity against several other accounts in its balance sheet, income statement, or cash flow statement.
• Debt ratio which is equal to average total liabilities/average total assets.
• Debt to equity ratio which is equal to total liabilities/stockholders' equity.
• Equity to total assets which is equal to shareholders' equity/total assets.
• Times interest earned which is equal to income before interest and taxes (EBIT)/interest
expense (Delta Publishing, 2006:76).

9
2.1.2.5 Profitability ratios
Profitability ratios are a class of financial metrics that are used to assess a business's ability to
generate earnings compared to its expenses and other relevant costs incurred during a specific
period of time. These ratios include:
• Gross profit margin is a measure of a company's profitability that is expressed as a
percentage of gross profit. It is calculated by dividing gross profit by revenue which is
equal to gross profit/net sales.
• Net operating income which is equal to operating income/net sales.
• Return on total assets (ROA) which is equal to net income/average total assets.
• Return on equity (ROE) which is equal to net income/shareholders’ equity.
• Return on investment (ROI) which is equal to net income/average total assets.
Earnings per share (EPS) which is equal to net income available to common
shareholders/weighted average number of common share outstanding (Delta Publishing, 2006:84).
2.2 Empirical Review of Literature
Adegoke in the year 2007 conducted a research in Nigeria about the relationship between financial
ratios and corporate profitability. The researcher applied financial ratio analysis to assess the
performance of some firms in Nigeria. The researcher found out that some promising investment
in Nigeria has turned out to be a failed investment due to the lack of inadequate use of financial
ratios. He also found out that in developing countries like Nigeria, few studies have been carried
out with respect to the corporate profitability of the Oil and Gas Industry.

10
Fraser & Ormiston in the year 2004 conducted a research in Texas USA on a measure of short-run
solvency. The researcher applied financial ratios to determine the short run solvency of the
company. The researcher found out that the available cash resources came primarily from cash or
the conversion of a current asset to cash. Fraser & Ormiston defined current ratio as the ability of a
firm to meets it debts requirement as they come due.
Clausen in the year 2009 conducted a research in Kenyatta University Cisco Networking Academy
Kenya, about the profitability ratio analysis of income statement and balance sheet. He applied
financial ratios as a measure of assessing university’s financial statement. He found out that both
the income statement and balance sheet are two important reports that can be used to assess the
performance of the firm considering profitability, activity ratio, ROE and ROA. He also indicated
that income statement shows the net profit of the company by subtracting expenses from gross
profit (sales – the cost of goods sold). He said that the balance sheet does not report profits alone
but also looks at the relationship between assets and profit.
Capkun et al in the year 2009 conducted a research in Poland to study on the relationship between
inventory performance, both total inventory (INV) and its discrete components (Raw Material
(RMI), Work-in-Process (WIP) & Finished Goods (FGI)) and financial performance of
manufacturing companies. The researchers applied correlation method to know the relationship
between inventory performance and the financial performance of the manufacturing industry. It
was found out that, there was a positive relationship between inventory performance and the
financial performance of the manufacturing industry.
Mohammadzadeh et al in the year 2013 conducted a research in Iran to study the relationship
between the profitability of pharmaceutical companies in Iran and the capital structure. Net profit

11
margin was expressed as an indicator of profitability and capital structure. It was found out that
there was a negative relationship between capital structure and profitability of the company.
Anjum in the year 2013 conducted a research in Pakistan in cement industry to study the
relationship between working capital management and profitability of the cement industry.
Regression analysis was used to determine the relationship between working capital management
and profitability of cement industries. It was found out that, there was an inverse and positive
relationship between working capital management and profitability of cement industry in Pakistan.
Sayeed and Hogue in the year 2009 conducted a research in Bangladesh on the impact of asset and
liability management; a study on the public versus the privately owned commercial banks in
Bangladesh. This study examined how inflation rate, the degree of market concentration could
impact the profitability of selected commercial banks in Bangladesh. The study adopted a
regression model. The regression results showed that the use of total income the dependent
variable for private and public banks was evidenced that asset had a significant contribution to the
total income of private banks.
Dave in the year 2012 conducted a research on the relationship between financial management and
profitability of the Indian Pharma sector for a period of 10years. The study adopted ratio analysis
to establish the link between financial management and profitability of Indian Pharma sector. It
was found out that, Total Asset to Sales Ratio and Creditors Velocity are the core variables
improving the profitability of the company.
Vanitha. S and Selvam. M in the year 2007, conducted a research in India on how a company’s
financial performance can be analyzed through ratios, t-test, mean and standard deviation.
Financial ratios standard deviation, t-test and mean were applied to the study. The findings pointed
12
out that the overall financial performance of merged companies in respect of various variables was
not significantly different from the expectations.
Antoniou et al in the year 2007 conducted a research on the relationship between leverage ratio and
a physical asset on the firm’s performance in Oman. Financial ratios were used to determine the
relationship between leverage ratio and physical asset. The finding pointed out that there was a
positive influence of leverage ratio and physical assets on the firm’s performance. The researchers
also argued that leverage ratio which positively affects firm performance is also influenced by
conditions that are driven by market forces within the business environment.
Amato and Burson in the year 2007 conducted a research on service industries with respect to their
size and profitability. The study was conducted in a Malaysian financial sector on 172 firms. The
study applied financial ratios to do the comparison. The findings pointed out that regardless of the
size of firms, it can still attain higher profit.
Jonsson in the year 2007 conducted a research in Iceland on the relationship between size and
profitability of the firms operating in Iceland. Financial ratios were used for the study to determine
the relationship between profitability and size of the firm. The findings pointed out that, larger
firms have a higher profitability as compared to smaller firms.
Manyo et al in the year 2013, conducted a research in Nigeria on the effect of the number of days’
account receivables on return on asset of some selected Nigerian firms from 2000-2009 by the use
of regression analysis. From the study, it was found out that the days’ accounts receivable had a
negative relationship with the profitability which was measured by the return on assets. The study
concluded that profitability increased with a decrease in day’s accounts receivable.

13
Gill, Biger and Mathur in the year 2010, conducted a research in the USA on the relationship
between working capital management and the profitability of 88 companies listed on the New
York Stock Exchange from 2005-2007. The study applied regression analysis for the study. The
findings pointed out a strong association between the cash conversion cycle and profitability,
hence concluding that profits can be boosted by properly handling the cash conversion cycle and
optimizing debtors’ level.

14
CHAPTER THREE
METHODOLOGY
3.1 Introduction
This chapter provides an account of how the research was designed and conducted. This study
seeks to evaluate the performance of Aluworks Limited using financial ratios. This chapter
discusses the research design, the population of the study, sample size, sample techniques,
procedure of data collection, data reliability and finally, data analysis.
3.2 Research Design
In order to evaluate the performance of Aluworks Limited, quantitative research was adopted for
the study. Quantitative research attempts to establish why it is that way or how it came to be. The
purpose of this research design is to assess Aluworks performance with respect to profitability,
efficiency, liquidity and also take action to improve future performance in an essential element of
quality management. The study also adopted quantitative research which seeks to emphasize
objective measurement and analysis of numerical data collected.
3.3 Population
A study population is the entire mass of observations, which is the parent group from which a
sample is to be formed (Singh, 2006). Korb in the year 2012 defined a population as a group of
people that the researcher wants to draw a conclusion on once the research study is finished. The
average population for the study was eight (8) employees. Asiamah et al in the year 2017 indicated
that, more often than not, the general population included people who are not eligible to be a part
of the population because they do not possess certain characteristics which are in the researcher’s
interest. In this regards, certain criteria were set to scrutinize the population to get a desirable
population. The researcher’s criteria index included:
15
The individual must be a recognized staff of Aluworks Limited
The individual must be a permanent worker
The individual must be an administrative staff who has worked with the company for
relatively a longtime.
3.4 Sample size
Sample size is the act of choosing the number of observations or replicates to include in a
statistical sample. The sample selected were three of the population size. In the sample design, the
researcher used purposive sampling where there were defined characteristics of the persons to be
included in the sample. These were those dealing in financial and strategic management areas and
how financial planning can help in improving financial performance. For this purpose, the
population had predetermined characteristics. The three (3) respondents had more knowledge
about the performance of the company.
3.4.1 Sources of Data
The study used both primary and secondary data.
3.4.2 Primary Sources of Data
Primary data was used for study. Primary data refers to the firsthand collection of data for a
particular purpose. The data was collected through interviews from employees of Aluworks
Limited, Tema.
16
3.4.3 Secondary source Data
Secondary data refers to data that was collected by someone other than the user. Data was
collected from the company’s website in the form of financial report and annual report from 2014
to 2016.
3.5 Technique of Selection
The technique adopted for the selection was a purposive sampling. The reason for this technique is
that the respondents had more knowledge pertaining to the company’s performance and were in
the best position to clarify issues pertaining to the company’s performance.
3.6 Data collection Instrument
McNamara in the year 1999 defined interviews as a qualitative research technique which involves
conducting intensive individual interviews with a small number of respondents to explore their
perspectives on a particular area. Interviews were picked as information gathering methods in light
of current circumstances. Interviews serves as a means of verifying information obtained through
application form and test. The interview questions designed by the researcher were open ended
questions. The questions were to seek respondent view on the performance of Aluworks Limited.
The researcher gave the respondent the opportunity to express themselves without interruptions
and to clarify all information asked on the subject matter.
3.7 Data Collection Procedure
This sub-section of the methodology explains how data was collected for the study. Central to the
data collection aspect of research design, secondary data were also collected such the company’s
financial statement and annual report from 2013 to 2016. The method that was adopted for the

17
collection of secondary data was through Aluworks Limited Website. Prior to the data collection,
the researchers sought permission to carry out the research from Aluworks Limited. An
introductory letter from the Department of banking and finance under the Faculty of Business
Studies would be sent to Aluworks limited, Tema indicating that the research is for academic
purposes only. Upon approval, the researcher was given the green light to conduct the interviews
and issues that needed clarifications were discussed dispassionately and reached a conclusion.
3.8 Data Analysis
Data analysis is a procedure of assessing, purifying, changing, and demonstrating information with
the objective of finding valuable data, proposing conclusions, and supporting basic leadership. In
this study, data was analyzed and shown in a tabular form to ease contrasting and to appreciate the
findings from the study. Data was analyzed using financial ratio. Financial ratios are relationships
determined from a company’s financial information and used for comparison purposes. Some of
the ratios used for the study included profitability ratio, net profit margin ratio, efficiency ratio,
and liquidity ratio.
3.8.1 Profitability ratio
The profitability ratio consisted of gross profit margin and net profit margin. Gross profit margin is
calculated as gross profit/sales*100. The net profit margin is calculated as profit before interest
and tax/sales*100.
3.8.2 Efficiency ratio
Efficiency ratio is typically used to analyze how well a company uses its assets and liabilities
internally. An efficiency ratio can calculate the turnover of receivables, the repayment of
18
liabilities, the quantity and usage of equity, and the general use of inventory and machinery. This
ratio can also be used to track and analyze the performance of companies.
An efficiency ratio measures a company's ability to use its assets to generate income. For example,
an efficiency ratio often looks at aspects of the company, such as the time it takes to collect cash
from customers or the amount of time it takes to convert inventory to cash. This makes efficiency
ratios important, because an improvement in the efficiency ratios usually translates to improved
profitability.
These ratios can be compared to peers in the same industry and can identify businesses that are
better managed relative to the others. Some common efficiency ratios are accounts receivable
turnover, fixed asset turnover, sales to inventory, sales to net working capital, accounts payable to
sales and stock turnover ratio.
It is calculated as a company’s Expenses / Revenue. However, interest expense is not included in
this formula.

19
CHAPTER 4
DATA ANALYSIS, RESULTS AND DISCUSSIONS
4.0 Introduction
Under this section the researchers presented and analyzed the data which have been gathered from
the company’s secondary and primary data sources. Hence the data presented here have been
presented in the form of tables (as per annexed) and figures, they are expressed in percentages. The
data which have been presented and analyzed on the figures have also been interpreted in words
for answering the research questions. The researcher applied selected financial ratios from a
framework of different researchers of various studies related with financial performance
evaluation of a company.
4.1 Performance of Aluworks limited with respect to profitability.
Table 1. Computation of Profitability Ratio Result from 2014-2016
Source: Field survey 2018
Gross profit margin measures a company’s profitability that is expressed as a percentage of gross
profit. It is calculated by dividing gross profit by revenue.
From the table, the gross profit of Aluworks limited increased by 14.98% in 2014. In the year
2015, it was 12% and then declined in 2016 by 11.88%. From the table above, it can be seen that
Ratios 2014 2015 2016
GROSS PROFIT
MARGIN
14.98% 12% 11.88%
NET PROFIT
MARGIN
-2.1% -0.1% -4.2%

20
Aluworks limited was better off in 2014 than in the previous year (2015 and 2016). This means
that, Aluworks limited had no control over the cost of sales and also, when expenses is more than
sales, it can lead to a decrease in gross profit.it is important to note that more expenses can cause
expenses to go up.
Source: Field survey 2018
The bar graph above depicts a graphical representation of the Gross profit margin of AluWorks
Limited. Gross profit shows how cost was controlled in manufacturing aluminum products. From
2014-2016, the costs of manufacturing these products were not controlled and as result of that,
gross profit declined. In the graphical representation above, gross profit increased in
2014(14.98%) and then declined in 2015(12%) and 2016(11.88%).
From this observation, it means that 2014 recorded the highest gross profit margin of 14.98%,
which tells us that AluWorks Limited had more cash flow to spend in its operations. In 2016, the
14.98%
12% 11.88%
0.00%
2.00%
4.00%
6.00%
8.00%
10.00%
12.00%
14.00%
16.00%
2014 2015 2016
Gross Profit Margin

21
company recorded the worst gross profit margin of 11.88%. This means that the company was
unable to control cost to some degree. The only drag on gross profit margin is the cost of goods
sold.
Net Profit Margin from 2014-2016
Source: Field survey 2018
Net Profit Margin looks at the percentage of revenue left after all expenses have been deducted
from sales. From the table above, Aluworks limited recorded a loss from 2014 to 2016. Thus,
-5.72%, -18.8% and -27.8% respectively. This occurs when cost exceeds revenue. From the report
on Aluworks website, the Company incurred a net loss for the year ended 31 December 2016 of
(GH¢ 19,314,000), (2015: GH¢14,810,000), (2014: GH¢ 4,400,000) and as of that date, its current
liabilities exceeded its current assets by GH¢ 29,182,000 (2015: GH¢ 27,751,000) and (2014:
GH¢27,751,000). From this point of view, Aluworks Limited had continued to make losses
consistently from 2014-2016. This was as a result of Aluworks limited having an overdraft facility
-2.10%
-0.10%
-4.20%
2014 2015 2016
Net Profit Margin
Net Profit Margin

22
of GH¢ 5million with Ecobank Ghana Limited to finance the purchase of raw materials stocks,
spares and other operational tools at an interest rate of 6% per annum and also had an overdraft
facility of GH¢ 2.1 million with Societe Generale Ghana Limited. This overdraft facility was used
to finance working capital. Aluworks limited also obtained a facility of $ 10 million from Social
Security and National Insurance Trust to finance the acquisition of second cold rolling under the
terms of a six-year convertible bond with two years moratorium. Therefore, Aluworks limited has
not been performing well with respect to profitability ratio.
4.2 Performance of Aluworks Limited with respect to efficiency.
Table 2
Source: Field survey 2018
Return on capital employed is a type of measurement where by capital investments made by a
company are then measured concerning profitability as well as their overall efficiency. In other
words, return on capital has to do with efficiency. That is the full utilization of the assets. From the
table, Return on Capital Employed was -2.6%, -0.3% and -3.1% respectively. This indicates that
Efficiency Ratio 2014 2015 2016
Return on Capital
Employed
-2.6% -0.3% -3.1%
Debtors Collection
Period
22 days 25 days 12 days
Creditors Collection
Period
119 days 125 days 142 days
Asset Turnover 0.53times 0.58 times 0.35times
23
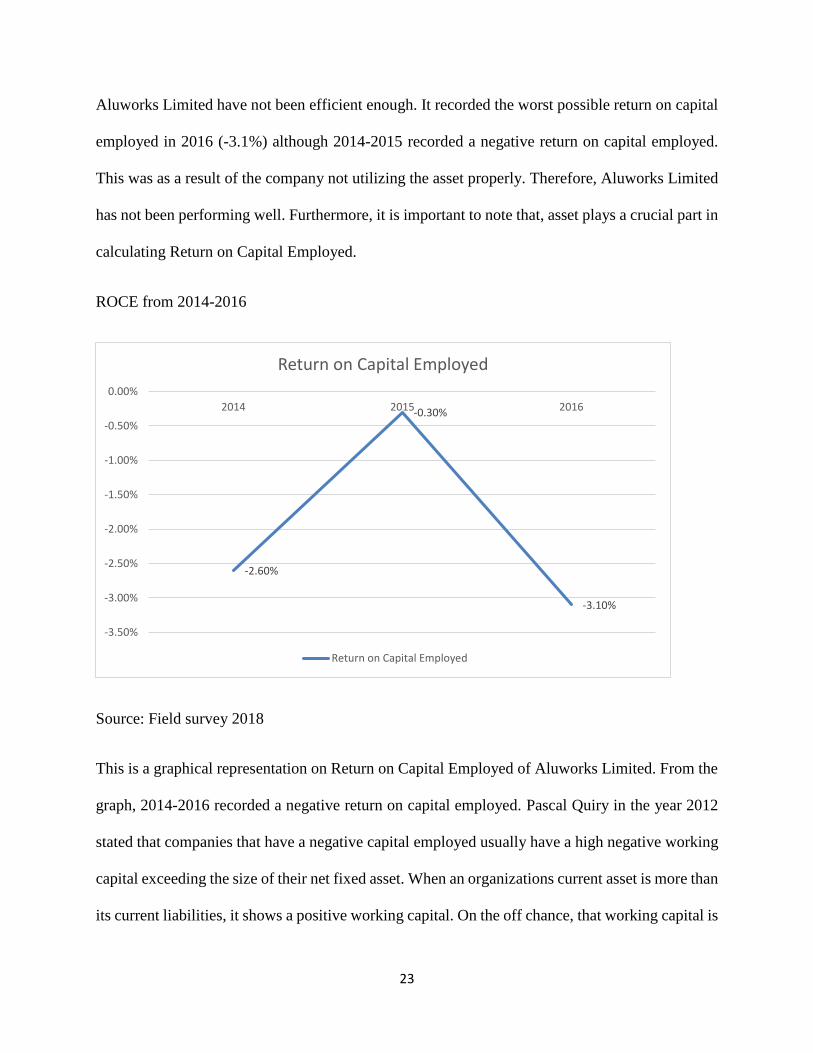
Aluworks Limited have not been efficient enough. It recorded the worst possible return on capital
employed in 2016 (-3.1%) although 2014-2015 recorded a negative return on capital employed.
This was as a result of the company not utilizing the asset properly. Therefore, Aluworks Limited
has not been performing well. Furthermore, it is important to note that, asset plays a crucial part in
calculating Return on Capital Employed.
ROCE from 2014-2016
Source: Field survey 2018
This is a graphical representation on Return on Capital Employed of Aluworks Limited. From the
graph, 2014-2016 recorded a negative return on capital employed. Pascal Quiry in the year 2012
stated that companies that have a negative capital employed usually have a high negative working
capital exceeding the size of their net fixed asset. When an organizations current asset is more than
its current liabilities, it shows a positive working capital. On the off chance, that working capital is
-2.60%
-0.30%
-3.10%
-3.50%
-3.00%
-2.50%
-2.00%
-1.50%
-1.00%
-0.50%
0.00%
2014 2015 2016
Return on Capital Employed
Return on Capital Employed

24
incidentally negative, it regularly demonstrates that the organization had acquired a huge money
expense or a considerable increment in its records payable because of an extensive buy of items
and administrations from its sellers. In the annual report of Aluworks limited, it stated that its
current asset was less than the current liabilities. In the financial statement of Aluworks limited,
2014’s current asset was less than its current liabilities. Thus, GH¢ 22,626,000 as against GH¢
51,809,000. The same goes for 2015 and 2016 having its current asset less than its liabilities. In the
light of event pertaining to a negative return on capital employed, Aluworks limited performance
has been poor consistently from 2014-2016.
Table 3: Debtor Collection Period from 2014-2016
Source: Field survey 2018
Debtor collection period looks at how organizations are able to collect their debt from people who
owe the company. In other words, it is the period taken by an organization to collects its money
owed to it by its debtors.
The table above shows the performance of Aluworks Limited under the efficiency ratio category.
Debtors ratios showed the following result from 2014-2016; 22, 25 and 12 all in days respectively.
Based on the calculation on debtors’ collection period, Aluworks limited did well in collecting
their debt on time. In the year 2016, its debtors’ collection period was 12 days, which means that
the company has been making sure that debt owed is paid back on time. With respect to 2014 and
2015, debtors’ collection period was poor as against 2016. This indicates that its debtors’
collection policy has improved. In the annual report pertaining to credit risk, the company
Debtor Collection Period 2014 2015 2016
Days 22 25 12

25
established a credit policy under which a new customer is assessed before credit is issued to the
customer. The company generally trades with pre-defined and selected customers. Credit exposure
on trade receivable is covered by guarantee from well-established banks. Therefore, from this
observation, Aluworks limited has a good credit policy.
Table 4: Creditors Collection Period from 2014-2016
Source: Field Survey 2018
Creditors’ collection period is an indication on how a company is able to pay off its debt. It
actually gives information about the payment habit of a company and whether the company is
taking full advantage of paying off its debt. The table above shows the performance of Aluworks
Limited under the efficiency ratio category. Creditor’s collection period showed the following
result from 201-2016; 119, 125 and 142 all in days respectively. Based on the calculation con
creditors’ collection period, Aluworks limited did not perform well as expected of them. In the
year 2014, the company used 119 days to pay off its debt and used 125 days to pay off its debt. In
the year 2016, the company used 142 days to pay off its debt. This means that, the company has not
been performing well lately.
Creditors Collection Period 2014 2015 2016
Days 119 125 142

26
Table 5: Total Asset Turnover from 2014-2016
Total Asset
Turnover
2014 2015 2016
Number of times 0.53 0.58 0.35
Source: Field survey 2018
Total asset turnover indicates how a firm is in utilizing its assets and in generation of sales revenue.
In other words, it shows how many times the company is able to sell of its assets to meet their debt.
Total asset turnover is calculated sales/total asset. It can often be used as an indicator of efficiency
when a company is deploying it asset in generating sales. With respect to Total Asset Turnover, a
higher ratio is considered desirable, but what is considered high in one industry may be low for
another. Total Asset Turnover is equal to sales divided by total asset. From the table above, figure
4.2.3, Total Asset Turnover ratio were as follows, 0.53, 0.58 and 0.35 all in times.
Based on the analysis above, 2015 recorded the highest turnover ratio and then declined in 2016 by
0.35. There had been a steady increase in asset turnover from 2014-2015 and then declined in 2016
by 0.35 times. This means that, Aluworks Limited turned over their asset 0.35times or one-third
during the year. In other words, for every cedi that was invested in asset, the company generated
GH₵ 0.32 of net sales in 2016. This means that Aluworks Limited was not efficient enough in
utilizing its asset.

27
4.3 Performance of Aluworks Limited with respect to Liquidity.
Table 6: Computation of Liquidity Ratio results from 2014 to 2016
Liquidity Ratios 2014 2015 2016
Current ratio 0.63:1 0.46:1 0.44:1
Acid test 0.22:1 0.13:1 0.07:1
Source: Field survey 2018
Liquidity ratio has to do with the company’s available cash and marketable securities against
outstanding debt. This ratio measures the company’s ability to pay off its short term debts. A
higher ratio indicates a company with a low risk of default. The table above shows the performance
of Aluworks Limited under the liquidity ratio category. Liquidity ratio comprises of current ratio
and acid test. Current ratio is calculated as current asset/current liabilities. From the table above,
Aluworks limited can meet its short term financial obligations as and when they fall due from 2014
to 2016 are as follows; 0.63, 0.46 and 0.44. Though every industry has its own range of acceptable
current ratio, a ratio of 2:1 is considered desirable in most sectors. In other words, the company has
a good financial background and below that will mean that the company is in financial crises.
Aluworks limited recorded the highest current ratio of 0.63 and then declined in 2015 and 2016.
This however is below the industry standard and that we can say that Aluworks limited is in
financial crises. Therefore, the company has not been performing well as expected.
Acid test ratio measures the firm’s liquidity and it answers the question” can this firm meets its
current obligations from its asset if suddenly all sales stop?” Acid test is calculated as current
asset –inventory/current liabilities. From the table above, acid test was as follows; 0.22, 0.13 and
0.07 all in tines. From this analysis, 2014 had the highest acid test ratio and then declined in 2015
and 2016 respectively. Usually an acid test ratio of 1.0 is considered desirable by lenders and

28
investors. Therefore, the company’s acid test ratio is less than the industry standard. Therefore,
Aluworks limited has not been performing well in meeting its current obligation if suddenly
all-sales stops.

29
CHAPTER 5
SUMMARY, CONCLUSIONS AND RECOMMENDATIONS
5.1 Introduction
This chapter covers the summary of the findings, the conclusions and recommendations that were
made by the researchers.
5.2 Summary of Findings
It was found out that there was no consistency in the performance of the company under the
profitability ratio. Table 1 shows, for example that the profitability of the company in 2014 was
14.93% which was then decreased to 12% in 2015, and lastly, decreased to 11.88% in 2016.This
shows inconsistency in the profitability level of the company. This was as a result of a decline in
operating profit and a decline in sales. From 2014-2016 sales declined and there was an operating
loss. However, it’s possible to increase your sales revenues and suffer a profit decrease.
1. The efficiency ratio from table 2 revealed a good debtor’s collection period. According to
the annual report Aluworks limited had a credit collection policy to which credit is given to
the consumer. The company established a credit policy under which a new customer is
assessed before credit is issued to the customer. The company generally trades with
pre-defined and selected customers.
2. The study showed that the performance of Aluworks limited under the efficiency ratio,
revealed a poor creditors collection period. It is poor when the company delays in paying of
their debt. That is to say that Aluworks limited have not been paying of their debt on time.
3. It was found out that, with respect to total asset turnover, there has been a steady increase
from 2014-2015 and then later declined in 2016. This means that for every cedi that was
invested in asset, the company generated GH₵ 0.53 of net sales in 2014, 0.58 in 2015 and
30
0.35 in 2016. This means that Aluworks Limited was not efficient enough in utilizing its
asset.
4. It was found out that the current ratio of Aluworks Limited was less than one. This was
below industry level. The industry standard for current ratio is one (1). This was as a
result of liabilities exceeding total current asset.
5. It was found out that return on capital employed for 2014 which was -2.6% decreased and
increased to -0.3% in 2015 and later on decreased to -3.1% in 2016. This shows
inconsistency in the return on capital employed.
6. It was found out that Acid test ratio of Aluworks Limited was also less than one, which
means that the company do not have enough liquid asset to pay their current liabilities and
should be treated with caution. Therefore, the company’s current asset is highly dependent
on inventory.
5.3 Conclusion
Based on the discoveries of the investigation it can be inferred that financial ratios can help
organizations to decide their financial strength. It can likewise push investors and forthcoming
investors or prospective shareholders to settle on cool headed choices to hold shares, buy more
share or to sell off the shares. In addition to that, it likewise indicates how management are
performing based on the investors or speculators inputs.
5.4 Recommendations
From the findings and conclusions, it can be recommended that, much effort should be put in by
management towards its to continue to have either constant increase in their performance under the
31
profitability ratio, liquidity ratio, and efficiency ratio especially for return on capital employed
(ROCE).
Secondly, the company should come up with a policy to tackle the problem of creditor’s collection
period. As such, the company should pay off their debt on time in order to build a good repute for
the company. This will give the company a good name and will turn increase efficiency.
Thirdly, it is recommended that the company can improve its asset turnover by focusing on
increasing revenue. Also, obsolete and unused assets should be liquidated. This means that, assets
that are not used frequently should be analyzed to see whether there is a sense in retaining those
assets.
It is also recommended that the company should assess their overhead cost and see if there are any
opportunities to decrease overhead cost such as rent, indirect cost, indirect labor etc. Decreasing
overhead cost can have a direct impact on profitability.
32
REFERENCES
Adegoke. (2007). Innovation types and innovation management practices in service companies",
International Journal of Operations & Production Management, Vol. 27 Issue: 6,
pp.564-587.
Amato, L. H. (2007). The effects of firm size on profit rates in the financial services. Journal of
Economics and Economic Education Research, Vol. 8, Issue 1, pp. 67 – 81.
Antoniou A, G. Y. (2008). The Determinants of Capital Structure: Capital Market Oriented versus
Bank Oriented Institutions.
Capkun, V. A. (2009). On the relationship between inventory and financial performance in
manufacturing companies. International Journal of Operations & Production
Management, 29(8): 789-806.
Dave, A. (2012). . Financial management as a determinant of profitability: A study of Indian
pharma sector. South Asian Journal of Management, 19(1): . 124.
Frase, L. &. (2004). Understanding Financial Statements. New Jersey: Pearson Prentice Hall.
Gill, A. N. (2010). The Relationship between Working Capital Management and Profitability:
Evidence from the United States. Business Economics Journal.
James, C. (2009). Accounting 101 – Income Statement: Financial Reporting and Analysis of Profit
and Loss”, Journal of income statement.
James, C. (2009). Accounting 101 – Financial Statement Analysis in Accounting: Liquidity Ratio
Analysis Balance Sheet Assets and Liabilities”, Journal of financial statement.
Lee, S. (2008). Ownership Structure and Financial Performance: Evidence from Panel Data of
South Korea. Corporate Ownership and Control, 6(2), 1-30.
Manyo. (2010). The effect of accounts receivable on return on assets of selected Nigerian firms.
International Journal of Current Research Vol. 5, Issue, 12, pp.3767-3772.
Rehman MU, A. N. (2013). Determination of the Impact of Working Capital Management on
Profitability: An Empirical Study from the Cement Sector in Pakistan. Asian Economic and
Financial Review3 (3): 319-332.
Sayeed. M. A. and Hogue, M. S. (2009). Impact of Assets and Liability Management on
Profitability: A Study of Public vs Private Commercial Bank in Bangladesh.

33
Vanitha, S. a. (2007). Financial Performance of Indian Manufacturing Companies during Pre and
Post Merger “International Research Journal of Finance and Economics, Page
No12:7-35.
34
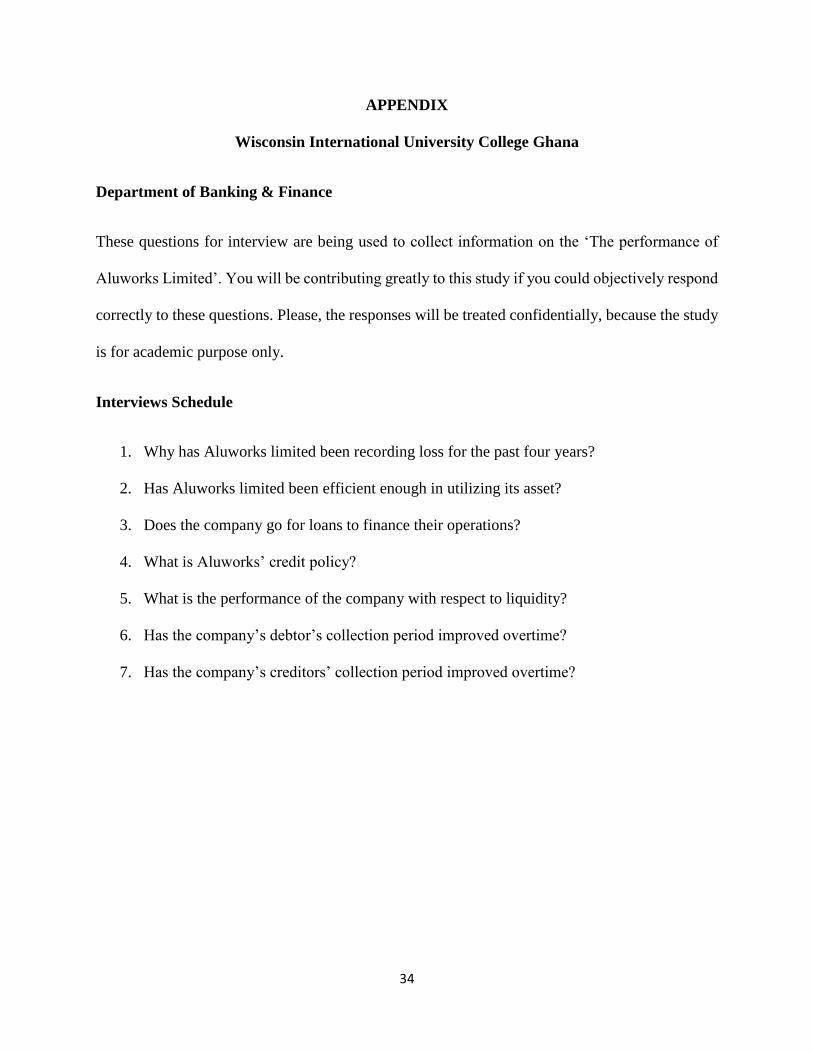
APPENDIX
Wisconsin International University College Ghana
Department of Banking & Finance
These questions for interview are being used to collect information on the ‘The performance of
Aluworks Limited’. You will be contributing greatly to this study if you could objectively respond
correctly to these questions. Please, the responses will be treated confidentially, because the study
is for academic purpose only.
Interviews Schedule
1. Why has Aluworks limited been recording loss for the past four years?
2. Has Aluworks limited been efficient enough in utilizing its asset?
3. Does the company go for loans to finance their operations?
4. What is Aluworks’ credit policy?
5. What is the performance of the company with respect to liquidity?
6. Has the company’s debtor’s collection period improved overtime?
7. Has the company’s creditors’ collection period improved overtime?

35