Embed Size (px)
Citation preview
Security Labs, Angelos Stavrou
Wireshark Lab.
Wireshark Tutorial
INTRODUCTION The purpose of this document is to introduce the packet sniffer Wireshark. Wireshark would be used for the lab experiments. This document introduces the basic operation of a packet sniffer, installation, and a test run of Wireshark. Wireshark, a network analysis tool formerly known as Ethereal, captures packets in real time and display them in human-readable format. Wireshark includes filters, color-coding, and other features that let you dig deep into network traffic and inspect individual packets.
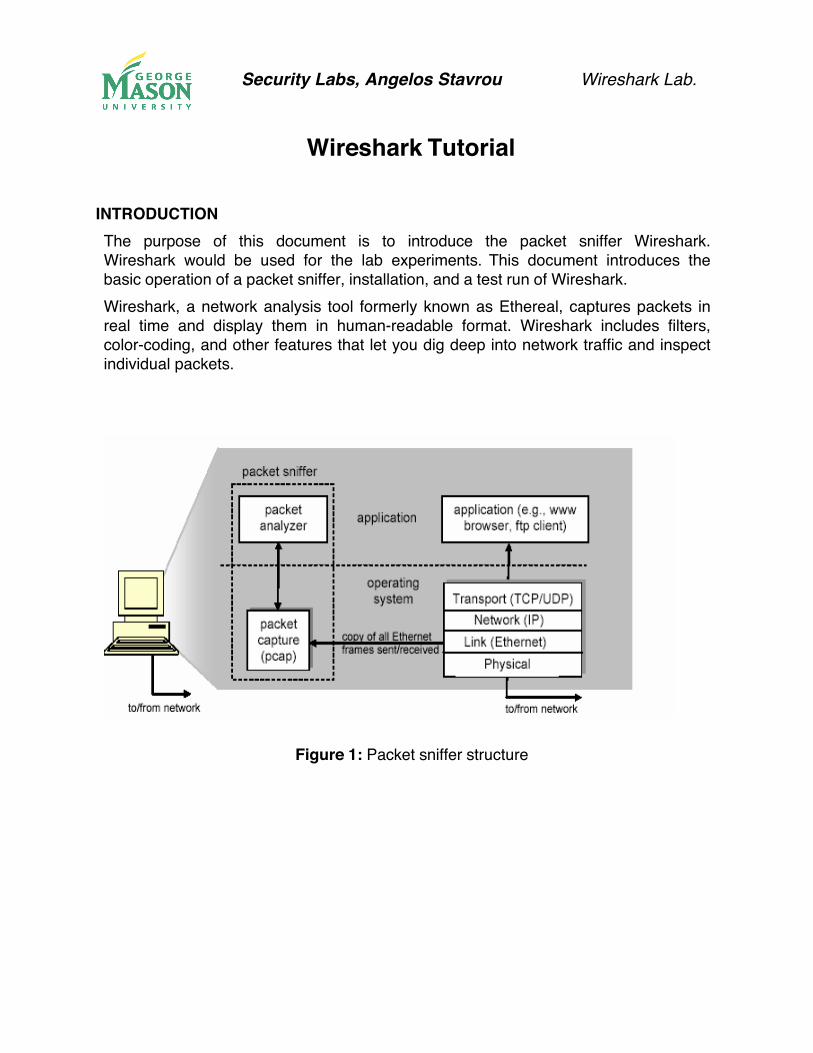
Figure 1: Packet sniffer structure
Security Labs, Angelos Stavrou
Wireshark Lab.
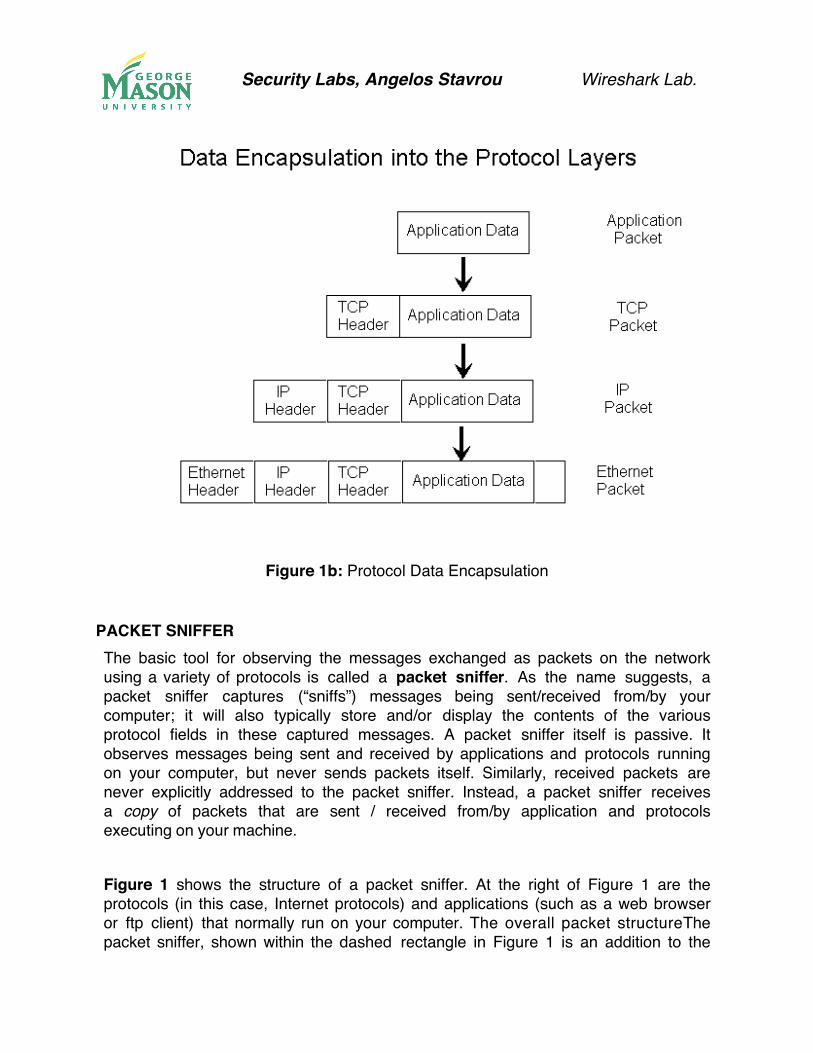
Figure 1b: Protocol Data Encapsulation
PACKET SNIFFER The basic tool for observing the messages exchanged as packets on the network using a variety of protocols is called a packet sniffer. As the name suggests, a packet sniffer captures (“sniffs”) messages being sent/received from/by your computer; it will also typically store and/or display the contents of the various protocol fields in these captured messages. A packet sniffer itself is passive. It observes messages being sent and received by applications and protocols running on your computer, but never sends packets itself. Similarly, received packets are never explicitly addressed to the packet sniffer. Instead, a packet sniffer receives a copy of packets that are sent / received from/by application and protocols executing on your machine.
Figure 1 shows the structure of a packet sniffer. At the right of Figure 1 are the protocols (in this case, Internet protocols) and applications (such as a web browser or ftp client) that normally run on your computer. The overall packet structureThe packet sniffer, shown within the dashed rectangle in Figure 1 is an addition to the

Security Labs, Angelos Stavrou
Wireshark Lab.
usual software in your computer, and consists of two parts. The packet capture library receives a copy of every link-layer frame that is sent from or received by your computer. Messages exchanged by higher layer protocols such as HTTP, FTP, TCP, UDP, DNS, or IP all are eventually encapsulated in link-layer frames that are transmitted over physical media such as an Ethernet cable. In Figure 1, the assumed physical media is an Ethernet, and so all upper-layer protocols are eventually encapsulated within an Ethernet frame. Capturing all link-layer frames thus gives you access to all messages sent/received from/by all protocols and applications executing in your computer.
The second component of a packet sniffer is the packet analyzer, which displays the contents of all fields within a protocol message. In order to do so, the packet analyzer must “understand” the structure of all messages exchanged by protocols. For example, suppose we are interested in displaying the various fields in messages exchanged by the HTTP protocol in Figure 1. The packet analyzer understands the format of Ethernet frames, and so can identify the IP datagram within an Ethernet frame. It also understands the IP datagram format, so that it can extract the TCP segment within the IP datagram. Finally, it understands the TCP segment structure, so it can extract the HTTP message contained in the TCP segment. Finally, it understands the HTTP protocol and so, for example, knows that the first bytes of an HTTP message will contain the string “GET,” “POST,” or “HEAD”.
We will be using the Wireshark packet sniffer [http://www.wireshark.org/] for these labs, allowing us to display the contents of messages being sent/received from/by protocols at different levels of the protocol stack. (Technically speaking, Wireshark is a packet analyzer that uses a packet capture library in your computer). Wireshark is a free network protocol analyzer that runs on Windows, Linux/Unix, and Mac computers. It’s an ideal packet analyzer for our labs – it is stable, has a large user base and well-documented support that includes a user-guide: http://www.wireshark.org/docs/wsug_html_chunked/), a set of well crafted man pages at (http://www.wireshark.org/docs/man-pages/), and a list of very detailed FAQ (http://www.wireshark.org/faq.html), rich functionality that includes the capability to analyze hundreds of protocols, and a well-designed user interface. It operates in computers using Ethernet, Token-Ring, FDDI, serial (PPP and SLIP), 802.11 wireless LANs, and ATM connections (if the OS on which it's running allows Wireshark to do so).

Security Labs, Angelos Stavrou
Wireshark Lab.
Getting Wireshark
Wireshark can be installed in any operating system, just go to
https://www.wireshark.org/download.html
Figure 2: Wireshark Download Page.
You can download the version of wireshark that matches your operating system.

Security Labs, Angelos Stavrou
Wireshark Lab.
Running Wireshark
When you run the Wireshark program, the Wireshark graphical user interface shown in Figure 2 will de displayed. Initially, no data will be displayed in the various windows.
For Mac OSX users, you need to have XQuartz or X11 installed for Wireshark to work!!! Also, the first time you open Wireshark, it will take several seconds to start so be patient.
Figure 3: Initial screen for Wireshark.

Security Labs, Angelos Stavrou
Wireshark Lab.
You will need to select one of the Wireshark interfaces, if you are using your laptop connected over the WiFi, then you need to select the WiFi interface. If you are at a server, you need to select the Ethernet interface being used. In general, you can select any interface but that does not mean that traffic will flow through that interface. The network interfaces (i.e., the physical connections) that your computer has to the network are shown. The attached snapshot was taken from my computer. You may not see the exact same entries when you perform a capture in the 237 Lab. You will notice that eth0 and eth1 will be displayed. Click “Start” for interface eth0. Packet capture will now begin - all packets being sent / received from/by your computer are now being captured by Wireshark! After you select the interface, you should cick on “START”. If everything goes well, you should get a view similar to Figure 2. WIRESHARK USER INTERFACE
Figure 4a: Wireshark Graphical User Interface for Windows OS.

Security Labs, Angelos Stavrou
Wireshark Lab.
Figure 4b: Wireshark Graphical User Interface for Mac OSX.
The Wireshark interface has five major components:
!! The command menus are standard pulldown menus located at the top of the window. Of interest to us now are the File and Capture menus. The File menu allows you to save captured packet data or open a file containing previously captured packet data, and exit the Wireshark application. The Capture menu allows you to begin packet capture.
!! The packet-listing window displays a one-line summary for each packet
captured, including the packet number (assigned by Wireshark; this is not a packet number contained in any protocol’s header), the time at which the packet was captured, the packet’s source and destination addresses, the protocol type, and protocol-specific information contained in the packet. The packet listing can be sorted according to any of these categories by clicking on a column

Security Labs, Angelos Stavrou
Wireshark Lab.
name. The protocol type field lists the highest-level protocol that sent or received this packet, i.e., the protocol that is the source or ultimate sink for this packet.
!! The packet-header details window provides details about the packet
selected (highlighted) in the packet-listing window. (To select a packet in the packet-listing window, place the cursor over the packet’s one-line summary in the packet-listing window and click with the left mouse button.). These details include information about the Ethernet frame and IP datagram that contains this packet. The amount of Ethernet and IP-layer detail displayed can be expanded or minimized by clicking on the right-pointing or down-pointing arrowhead to the left of the Ethernet frame or IP datagram line in the packet details window. If the packet has been carried over TCP or UDP, TCP or UDP details will also be displayed, which can similarly be expanded or minimized. Finally, details about the highest-level protocol that sent or received this packet are also provided.
!! The packet-contents window displays the entire contents of the captured
frame, in both ASCII and hexadecimal format.
!! Towards the top of the Wireshark graphical user interface, is the packet display filter field, into which a protocol name or other information can be entered in order to filter the information displayed in the packet-listing window (and hence the packet-header and packet-contents windows). In the example below, we’ll use the packet-display filter field to have Wireshark hide (not display) packets except those that correspond to HTTP messages.

Security Labs, Angelos Stavrou
Wireshark Lab.
Capturing Packets After downloading and installing Wireshark, you can launch it and click the name of an interface under Interface List to start capturing packets on that interface. For example, if you want to capture traffic on the wireless network, click your wireless interface. You can configure advanced features by clicking Capture Options, but this isn’t necessary for now. Test Run The best way to learn about any new piece of software is to try it out!
Do the following
1.! Start up your favorite web browser.
2.! Start up the Wireshark software. You will initially see a window similar to that
shown in Figure 3. You need to select an interface and press Start.
3.! After your browser has displayed the http://www.gmu.edu page, stop Wireshark packet capture by selecting stop in the Wireshark capture window. This will cause the Wireshark capture window to disappear and the main Wireshark window to display all packets captured since you began packet capture see image below:

Security Labs, Angelos Stavrou
Wireshark Lab.
4.! Color Coding: You’ll probably see packets highlighted in green, blue, and black.
Wireshark uses colors to help you identify the types of traffic at a glance. By default, green is TCP traffic, dark blue is DNS traffic, light blue is UDP traffic, and black identifies TCP packets with problems — for example, they could have been delivered out-of-order.
Inspecting Packets To inspect packets, click on one of the packets and go to the bottom pane:
Notice that although there is a lot of interesting information, the view of the packet is not very easy to read.

Security Labs, Angelos Stavrou
Wireshark Lab.
Inspecting Packet Flows (Network Connections)
5.! You now have live packet data that contains all protocol messages exchanged
between your computer and other network entities! However, as you will notice the HTTP messages are not clearly shown because there are many other packets included in the packet capture. Even though the only action you took was to open your browser, there are many other programs in your computer that communicate via the network in the background. To filter the connections to the ones we want to focus on, we have to use the filtering functionality of Wireshark by typing “http” in the filtering field as shown below:
Notice that we now view only the packets that are of protocol HTTP. However, we also still do not have the exact communication we want to focus on because using HTTP as a filter is not descriptive enough to allow us to find our connection to http://www.gmu.edu. We need to be more precise if we want to capture the correct set of packets. 6.! One potential filter that comes to mind is to type the destination host
(www.gmu.edu) directly in the filter area. Unfortunately, this will end up bringing up an error (see screenshot below) and will not work because Wireshark does not have the ability to discern which protocol fields you need to match.

Security Labs, Angelos Stavrou
Wireshark Lab.
7.! To further filter packets in Wireshark, we need to use a more precise filter. By
setting the http.host==www.gmu.edu, we are restricting the view to packets that have as an http host the www.gmu.edu website. Notice that we need two equal signs to perform the match “==” not just one!

Security Labs, Angelos Stavrou
Wireshark Lab.
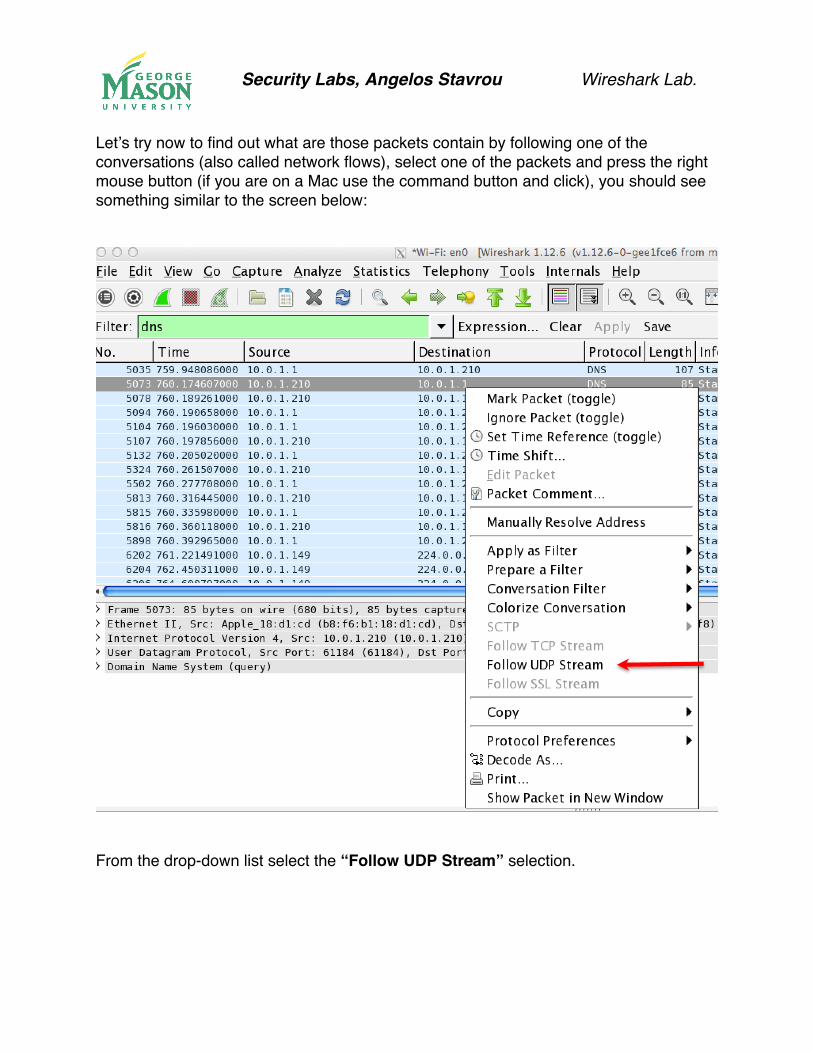
8.! Let’s try another protocol, for instance DNS, type DNS to the filter area:
Do you notice that the packets are colored differently?
Security Labs, Angelos Stavrou
Wireshark Lab.
Let’s try now to find out what are those packets contain by following one of the conversations (also called network flows), select one of the packets and press the right mouse button (if you are on a Mac use the command button and click), you should see something similar to the screen below:
From the drop-down list select the “Follow UDP Stream” selection.

Security Labs, Angelos Stavrou
Wireshark Lab.
You should be able to get something similar to the screen below:
If we close this window and change the filter back to “http.host==www.gmu.edu” and then follow a packet from the list of packets that match that filter, we should get the something similar to the screens in the next page:

Security Labs, Angelos Stavrou
Wireshark Lab.

Security Labs, Angelos Stavrou
Wireshark Lab.
If you close the window, notice that the filter based on the flow is stil there:
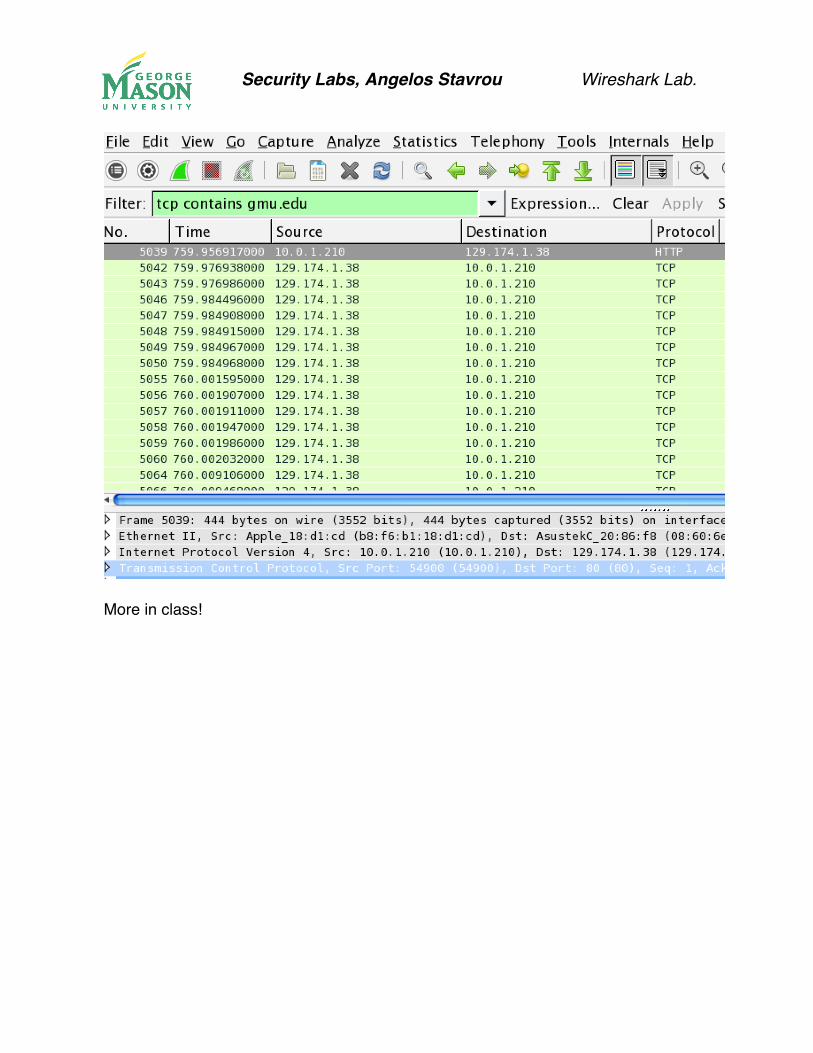
Besides streams we can also use the keyword “contains” to allow some freedom for searching. Let’s see how:

Security Labs, Angelos Stavrou
Wireshark Lab.
Also, we can use “contains” with other protocols!
Security Labs, Angelos Stavrou
Wireshark Lab.
More in class!


![Filtraggio e censura dei servizi Internet Un’analisi sul ... Tesi.pdf · 1.2.1Wireshark, packet sniffer Wireshark[2] è un software open source multipiattaforma, con molteplici](https://img.dokumen.tips/doc/110x75/5e9b39395c04386c0863b18f/filtraggio-e-censura-dei-servizi-internet-unaanalisi-sul-tesipdf-121wireshark.jpg)


