Embed Size (px)
Citation preview

Wireless Trace Analysis
Suyong Lee and Renata AryantiAdvisor: Prof. Suman Banerjee
With assistance of : Vladimir Brik and Michael Blodget
Fall 2007

What we are doing …
Analyzing the wireless traffic traces in Helen C. White College Library building, located in 600 N. Park St, Madison, WI.
1. Contention 2. APs’ Popularity and Traffic Distribution Among APs 3. Mobility Pattern 3. Users’ Connection Trend (length and number of APs the
user usually connect in a day) 4. Data Rate Distribution 5. Download VS Upload Stream 6. Traffic Distribution Among APs 7. Control Packet Distribution
HCW AP location

Network Usage
• Of all the wireless traces collected in HCW College Library:– 86% is using UW-Net-
Helen-C-White network
– 6% is using other UW network, such as: Memorial Union, Memorial Library, Science Hall, or Water Science network.
– 8% are using foreign network.
Contention
We will show the number of nodes connected on each AP over time. Each color on the diagram represent different APs.
The data is taken from the AP logs on May 15th – 17th, 2007. This is the final exam week of Spring 2007 term.
The busiest time (when many nodes are connected) for 1st – 3rd floor is shown to be evening, around 7pm – 1am.
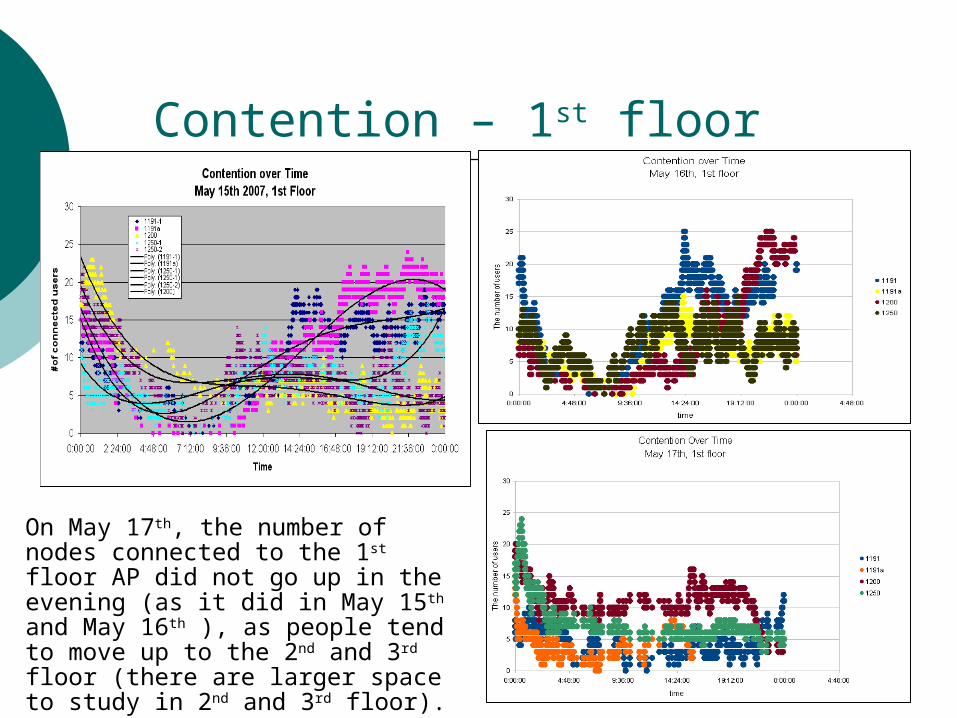
Contention – 1st floor
On May 17th, the number of nodes connected to the 1st floor AP did not go up in the evening (as it did in May 15th and May 16th ), as people tend to move up to the 2nd and 3rd floor (there are larger space to study in 2nd and 3rd floor).

Contention – 2nd floor

Contention – 3rd floor

Contention – 4th floor
The busiest time in 4th floor tends to be in the afternoon, between 9am – 3pm. The 4th floor is used as offices, so most nodes are connected during business hour.

AP Popularity -- Association, Disassociation, MaxRetries, and Roaming
• May 15th, 2007• In the first and
second floor, the users are not distributed very well among AP.
• In the third to fifth floor, the distribution of the users among AP are better. 1st Floor: 1200 is the least popular AP
2nd Floor: 2191a is extremely popular and 2257 is the least popular
6th and 7th floor: only 1 AP is dominant on each floor.
Association, Disassociation, MaxRetries, and Roaming (Continue)
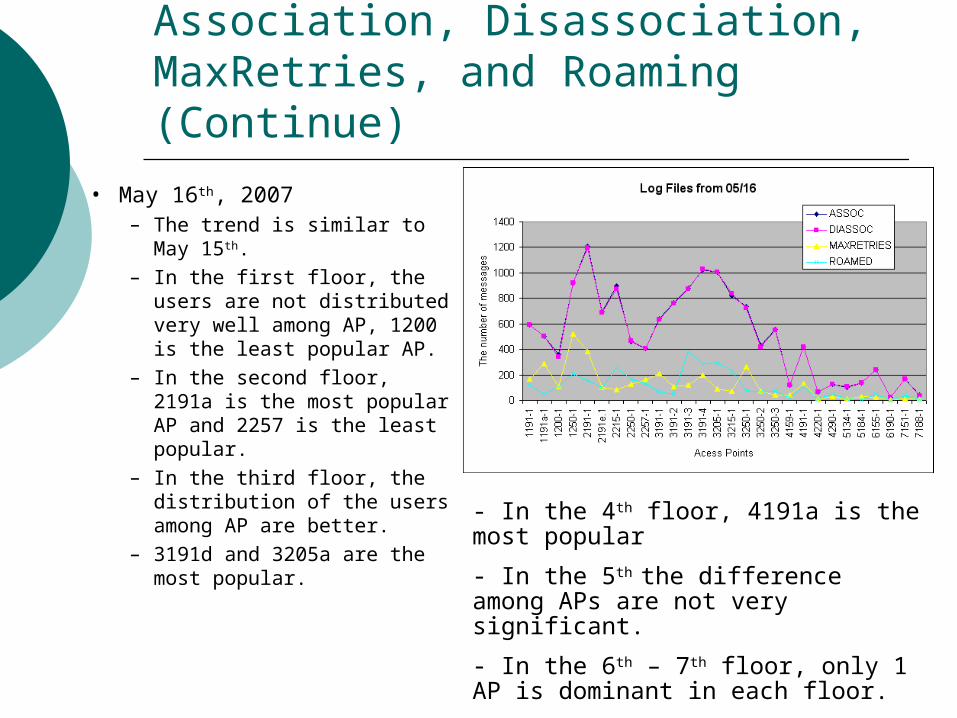
• May 16th, 2007– The trend is similar to May
15th.
– In the first floor, the users are not distributed very well among AP, 1200 is the least popular AP.
– In the second floor, 2191a is the most popular AP and 2257 is the least popular.
– In the third floor, the distribution of the users among AP are better.
– 3191d and 3205a are the most popular.
- In the 4th floor, 4191a is the most popular
- In the 5th the difference among APs are not very significant.
- In the 6th – 7th floor, only 1 AP is dominant in each floor.

Association, Disassociation, MaxRetries, and Roaming (Continue)
• May 17th, 2007
• We have slightly different trend of AP popularity on the 1st – 3rd floor.
1st floor :
- 1200 is no longer the least popular
- 1250 is the most popular
2nd floor:
- 2215 is the most popular, instead of 2191a as in the previous 2 days.
3rd floor: 3205 and 3215 are the most popular
4th – 7th floor: only 1 AP is dominant on each floor.

Traffic Distribution between APs
The traffic go pass each APs
Mobility
Analyze the prevalence of each user.
Prevalence : the fraction of length each user connected on each AP compared to the whole connection time to the whole network.

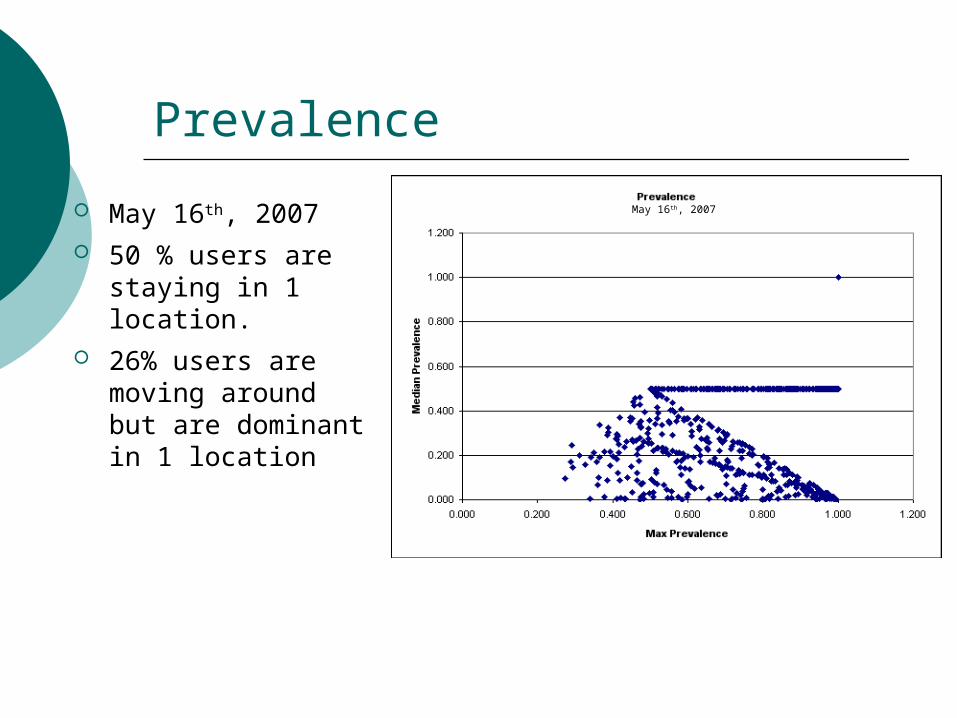
Prevalence
May 15th, 2007 40.2 % users are
staying in 1 location. 36% users are
moving around but are dominant in 1 location
(0.8 < max prevalence > 1)
May 15th, 2007
Prevalence
May 16th, 2007 May 16th, 2007 50 % users are
staying in 1 location.
26% users are moving around but are dominant in 1 location

Prevalence
May 17th, 2007 May 17th, 2007 61 % users are
staying in 1 location.
16 % users are moving around but are dominant in 1 location
Users’ Connection Pattern
The data is taken from the AP logs May 15th – may 17th 2007.
We are looking at these trends: How long each user connected to the
network every day. How many APs the users usually
connected to in a day.
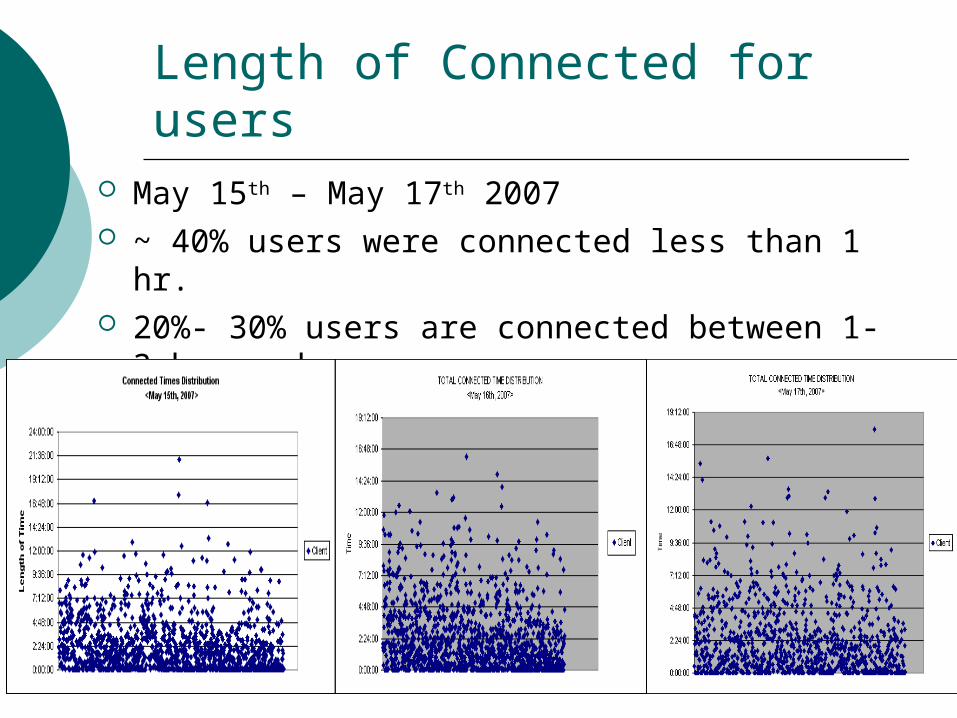
Length of Connected for users May 15th – May 17th 2007 ~ 40% users were connected less than 1 hr.
20%- 30% users are connected between 1-3 hrs a day.
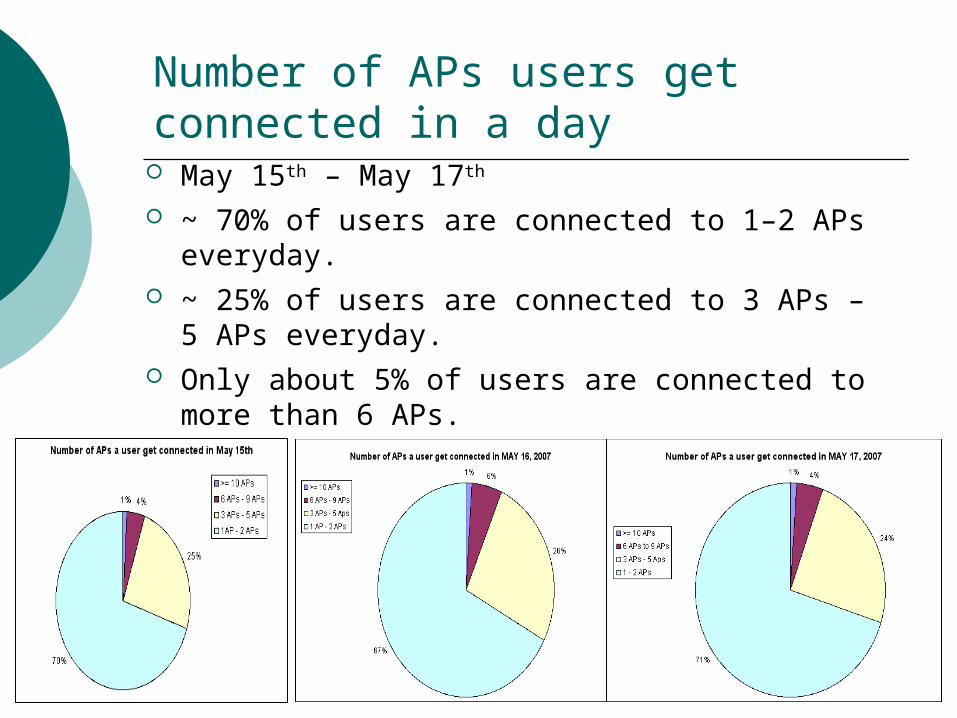
Number of APs users get connected in a day
May 15th – May 17th
~ 70% of users are connected to 1–2 APs everyday.
~ 25% of users are connected to 3 APs – 5 APs everyday.
Only about 5% of users are connected to more than 6 APs.
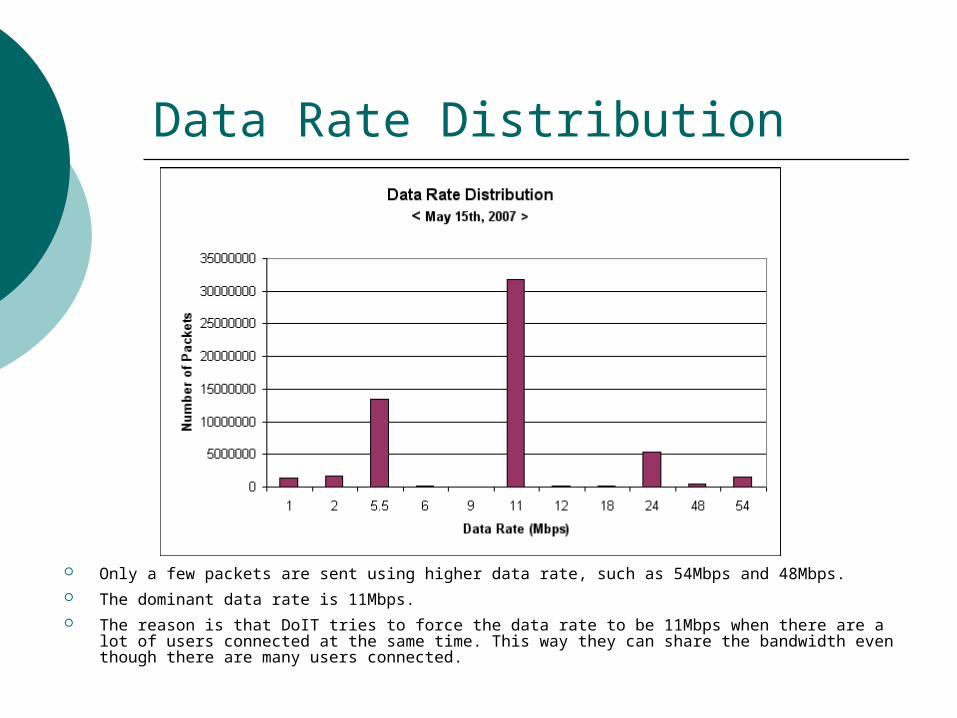
Data Rate Distribution
Only a few packets are sent using higher data rate, such as 54Mbps and 48Mbps. The dominant data rate is 11Mbps. The reason is that DoIT tries to force the data rate to be 11Mbps when there are a lot of users
connected at the same time. This way they can share the bandwidth even though there are many users connected.

Download VS Upload Stream
Analyze the download VS upload stream for each AP.

Control Packet Traffic Distribution
CTS is dominating the control packet sent through the network.
CTS >> RTS
- END -
Thank you !!

![Publisher - CMFRI Repositoryeprints.cmfri.org.in/9658/1/IJMS_2013[1].pdfP.R. Jayachandran, S. Bijoy Nandan, ... Andi Rezky Puspita Ayu ... Noverita Dian Takarina, Sharfina Tammy Aryanti,](https://img.dokumen.tips/doc/110x75/5aa4e8187f8b9a1d728c777b/publisher-cmfri-1pdfpr-jayachandran-s-bijoy-nandan-andi-rezky-puspita.jpg)