Embed Size (px)
Citation preview
1
Wireless Internet Code
NETWORK: AVCCODE: B0850965C7

2
Chair’s Welcome
John Higgins CBE,Director General, Intellect
Keynote Address
Jon Fredrik Baksaas,President and CEO,Telenor

3
Jon Fredrik BaksaasPresident and CEO
Keynote address
FT World Telecoms Conference, London, 3rd November 2008
Home and away | Long-term commitment
2007Exit Austria
1994Russia
2000ThailandMalaysia Denmark
Exit IrelandExit Germany
2006Serbia
1998Ukraine
GermanyRussia (VIP)
1996Austria
Bangladesh
1993Hungary
1997Greece
2005SwedenPakistan
2004Exit Greece
1995Ireland
Montenegro
2008India
Coming out of the 1987
financial crisis
Financial crisis (Russia, Asia..)
Present crisis
dotcom crash/UMTS
licensing
• 12 mobile markets at present with 159 million subscriptions• Expected service launch in India mid 2009• More than 15 years in CEE and 12 years in Asia

4
Source: Markets with highest number of net additions, reported and calculated data (Wireless Intelligence, 30.10.08)
Number of net mobile additions Q308
Market penetration Q208
Rank
72 %
84 %
91 %
67 %
125 %
27 %
124 %
41 %
55 %
57 %
88 %
51 %
72 %
26 %
44 %
2,314,960Philippines15
2,364,136Turkey14
2,630,294Thailand13
2,872,984Mexico12
3,177,721Germany11
3,341,965Bangladesh10
3,721,134Russian Federation9
3,874,825Nigeria8
3,906,242Iran7
4,161,447Vietnam6
5,843,062USA5
5,929,503Pakistan4
5,977,965Brazil3
22,072,094India2
25,697,739China1
Present position | In high growth markets
Financial services
Innovation | In all markets
Insurance
Community services
Health services
M2M
Mobile services play a wider role in low income countries than in high income countries
5
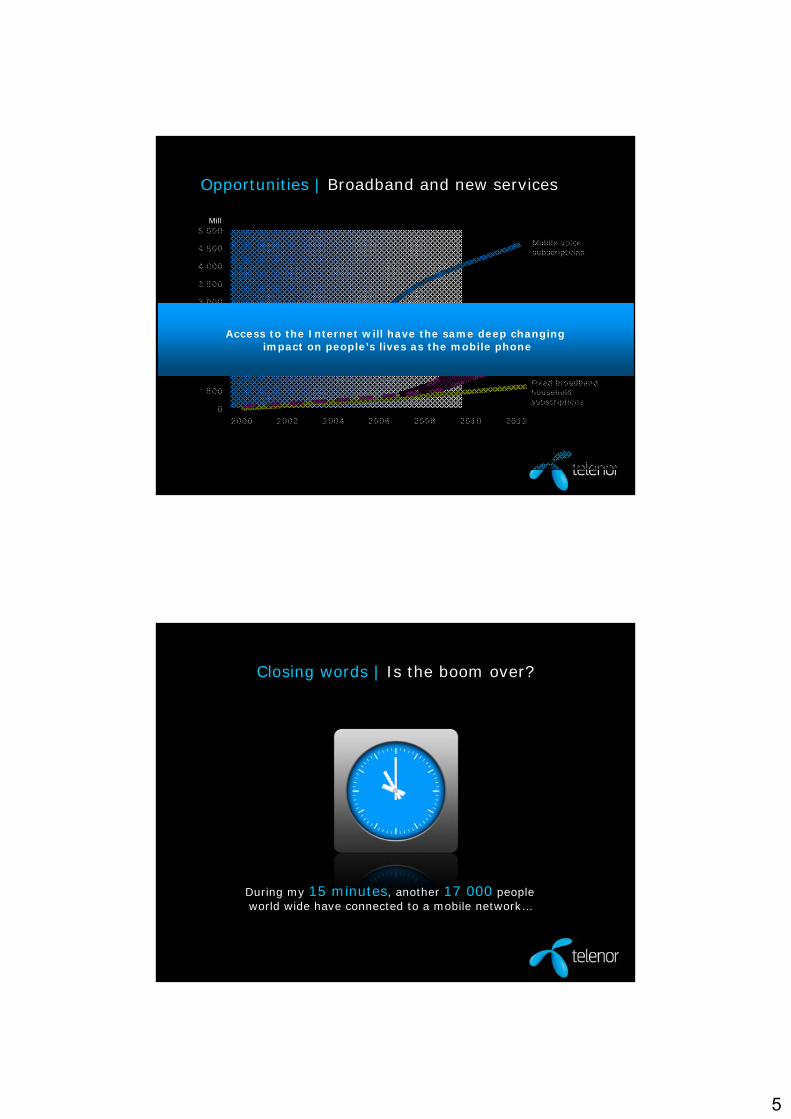
Opportunities | Broadband and new services
0
500
1 000
1 500
2 000
2 500
3 000
3 500
4 000
4 500
5 000
2000 2002 2004 2006 2008 2010 2012
Mill
?Total internet subscriptions
Mobile voice subscriptions
Fixed broadband household subscriptions
Mobile
Inte
rnet
Pers
onal
Inte
rnet
Access to the Internet will have the same deep changing impact on people’s lives as the mobile phone
During my 15 minutes, another 17 000 people world wide have connected to a mobile network…
Closing words | Is the boom over?
6
Emerging Markets – Is The Boom Over Or Is It Just Beginning?Doug Richard, Founder, Cambridge Angels, and Chairman & CEO,
Trutap
Michael O'Brien, Director and Senior Analyst, Standard and Poor’s
Carlos Winzer, SVP and Senior Analyst for the Telecoms Sector, Moody’s Investors Service
Bashar Arafeh, COO East Africa Region, Zain
Rating ConsiderationsFor a Home and Away Strategy
Carlos WinzerSenior Vice President
Presentation at
FT World Telecoms Conference
3 November 2008
Presentation at
FT World Telecoms Conference
3 November 2008

7
Home and Away common strategy
Maintain a strong position in the domestic market, despite of a challenging environment in both segments
Focus on broadband
Strict cost control
Growth from existing international operations
Seek for opportunities in emerging markets
Increasing contribution from international diversification
Criteria to identify an opportunity in an emerging market:
1) High growth potential
2) Forward looking telecom policy
3) Investment friendly climate
4) Regulation that permits an acceptable ROR on investment.
5) Acceptable political and economic situation
In Moody's experience, penetration grows faster than
expected, number of subscribers is very high, but Arpu is
lower than planned and capex higher.

8
Options companies have
Stand still and continue to search for attractive opportunities (Belgacom).
Try to acquire an existing company with broad emerging market exposure (FT/TeliaSonera).
Acquire a target company in emerging markets.
Acquire a license and start from scrach
For those already exposed, continue to enhancethe footprint through either bolt-on acquisitions, adjacent ones or in different and non relatedmarkets.
International Diversification Increasingly in Focus
Substantial investments in the past
Contributor to revenue growth
Risk profile is greaterRevenue and cash flow mix changing
Increasing contribution from international diversification
Revenues split
0.0%
25.0%
50.0%
75.0%
100.0%
Telenor
TEF DT FTOTE
Magya
r
Belgac
om
Domestic International

9
What to look for when an acquisition is proposed
Is a consistent strategy being followed ?
Is the price “fair” ?
Funding structure
Liquidity and refinancing strategy. Change in ownershipcovenants. Recourse Vs Non recourse debt of target
Shareholder agreements/dividend policy
Integration risk/Synergies
Corporate structure and cash up-streaming mechanism
Growth potential in emerging marketsWireless Penetration Comparison with China
41.4%
20.3%
0.0%
10.0%
20.0%
30.0%
40.0%
50.0%
1990 1991 1992 1993 1994 1995 1996 1997 1998 1999 2000 2001 2002 2003 2004 2005 2006 2007 2008
China IndiaWireless Penetration
Subscriber Addition Comparison (1)
0.41.5 1.7
2.8
5.45.44.7 5.2 5.5
4.95.6
7.2
0.4 0.81.5
3.24.3
2.2 1.70.5 0.5 1
1.6 1.7 1.21.8
0.2
6.9
0
2
4
6
8
10
2001 2002 2003 2004 2005 2006 2007
Net
Add
s- S
ubs
(mm
)
India China Rusia Brazil
Source: NL Research, Global Wireless Matrix 24 Dec 2007(1) Average net adds per month
Subscriber Addition Growth has accelerated in last 2 years

10
Growth potential in emerging markets
Sub Sahara African subscribers will reach 400 million by 2017; Penetration 45%+
0
50
100
150
200
250
300
350
400
450
2006 2007 2008e 2009e 2010e 2012e 2017e
Mob
ile S
ubsc
riber
s (m
m)
0.00%
5.00%
10.00%
15.00%
20.00%
25.00%
30.00%
35.00%
40.00%
45.00%
50.00%
Pene
tratio
n(%
)
Source: Morgan Stanley Research
The Challenge is to increase ARPU in low GDP regions
0
10
20
30
40
50
60
US South Africa Brazil Russia China India
CY03 CY04 CY05 CY06 CY07
India has the lowest ARPU among Large Telecom MarketsARPU inMill $
Source:NL Research, Global Gíreles Matriz 24 Dec 2007

11
In Summary
Since 1993 we have seen a wave of feverish expansion into the emerging markets.
Companies are benefiting today from that international diversification.
Further acquisitions are expected.
Emerging markets continue to show growth and opportunities remain.
Key to balance shareholder remuneration, creditorprotection and strategyc M&A.
Valuations today range from 7x to 13x Ebitda.
Q&A

12
Bashar T. ArafehCOO Zain Group for East Africa region
FT World Telecoms Conference, 3&4 November 2008
Emerging Markets – Is The Boom Over Or Is It Just Beginning?
FT World Telecoms Conference | 3&4 November 2008| Zain Limited © | FT World Telecoms Conference | 3&4 November 200824
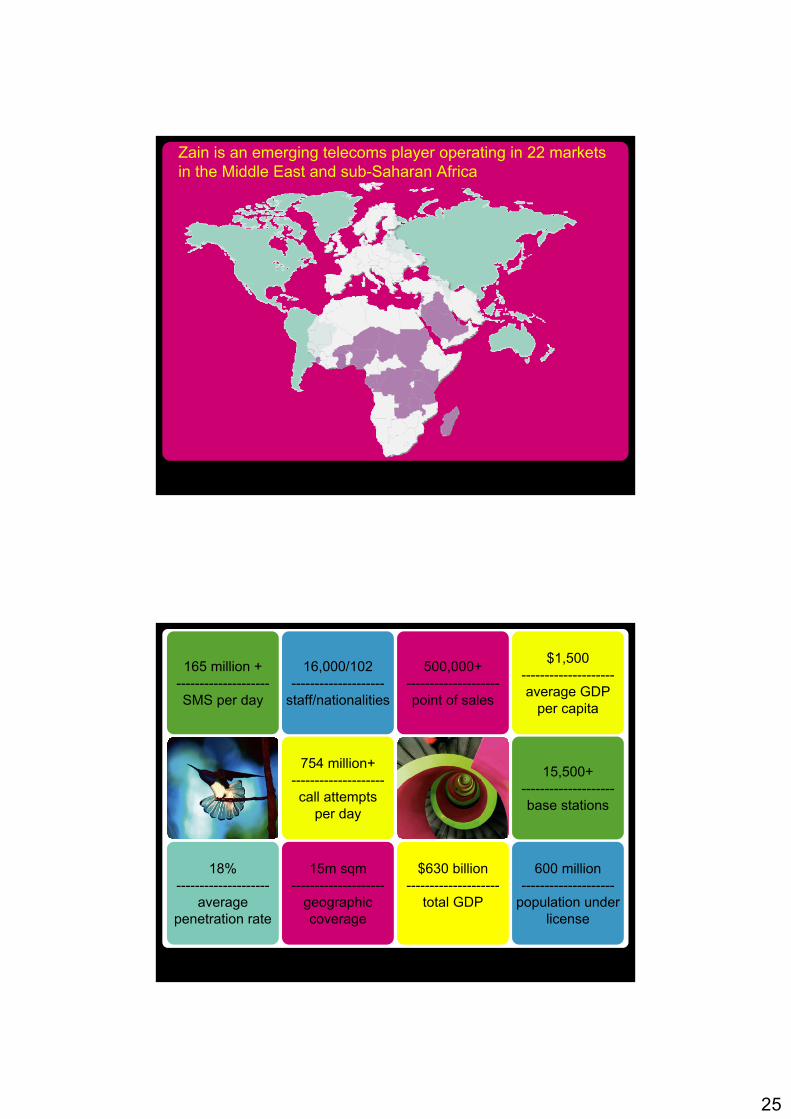
Zain is an emerging telecoms player operating in 22
markets in the Middle East and sub-Saharan
Africa
Introduction to Zain Group and Zain’s 2008 performance
50.7 (+58%)
6.7 (+26%)
2.8 (+19%)
Customers (Million)
Revenues (USD Billion)
EBITDA (US$ Billion)
Group results (year ending June 2008)
Source: Zain investor relations

13
FT World Telecoms Conference | 3&4 November 2008| Zain Limited © | FT World Telecoms Conference | 3&4 November 200825
• Zain (formerly MTC) started off in 1983 in Kuwait as the region’s first mobile operator
• Thanks to its 3 x 3 x 3 strategy, Zain evolved from a national player into MEA player in only 4 years
• Today Zain is present in 22 countries– 7 operations in the Middle
East– 15 operations in Africa– Population under license: 546
M
Zain’s historical growth based on the 3 x 3 x 3 strategy
FT World Telecoms Conference | 3&4 November 2008| Zain Limited © | FT World Telecoms Conference | 3&4 November 200826
Spearheading Zain’s future growth: ACE strategy
• Accelerate growth in all operations
• Consolidate existing assets through
– Group-wide synergies
– Performance improvements
• Expand into adjacent markets
• Expand into adjacent businesses
Accelerate Consolidate Expand
Become one of the top 10 mobile and lifestyle operators of the world by 2011

14
FT World Telecoms Conference | 3&4 November 2008| Zain Limited © | FT World Telecoms Conference | 3&4 November 200827
Asia1,250M 46%
Australia20M 104%
Source: Euromonitor and Informa (WCIS); Delta Partners analysisNote: Mobile penetration is weighted average
“Emerging markets”“Growing markets”“Saturated markets”
Population
2007
Penetration
Africa features with China and India among the world’s most attractive markets in terms of room for growth…
Africa
964M 27%
India
1,140M 19%
China
1,322M 41%
Russia142M 122%
Europe667M 111%
North America335M 62%
South America573M 66%
East Africa
130M 20%
FT World Telecoms Conference | 3&4 November 2008| Zain Limited © | FT World Telecoms Conference | 3&4 November 200828
… in terms of speed of growth, Africa’s is expected to continue growing at a fast pace
36
260
440
2002 2007 2012E
Source: Informa (WCIS)
2002 2007 2012E
4%
+650%
27%
+70%
41%
Mobile subscriber (M) and penetration (%) growth

15
FT World Telecoms Conference | 3&4 November 2008| Zain Limited © | FT World Telecoms Conference | 3&4 November 200829
African players will have to face many challenges - the overall challenge being to grow profitably
Growth
MoUs and ARPU decrease
• Untapped market potential growth will be driven by low income segments
I • More players to enter (Indian, European operators)
• Further push from fixed wireless solutions
• Player take-over/M&A
Competition increase
Price drops & margin erosion
II
Addressablemarket saturation
Churn increase
• Even assuming more moderate growth rates, saturation of the addressable market could soon be reality
III
Profitable growth
Today
FT World Telecoms Conference | 3&4 November 2008| Zain Limited © | FT World Telecoms Conference | 3&4 November 200830
So far, other players have been implementing tactical bits & pieces to address the immediate challenge to grow…
ULCH and micro-
financing initiatives
(cost of entry reduction)
FMCGdistribution
model(to push numeric
distribution)
Payphones
(entry product for rural areas)
Validity for life,per second billing, price adjustments
(cost of ownership reduction)
Network expansion into
rural areas(e.g. via low cost hybrid solutions)
Electronic Recharge Vouchers(to add flexibility,
reduce logistics and cost)
Promotional activities
(create customer
excitement)

16
FT World Telecoms Conference | 3&4 November 2008| Zain Limited © | FT World Telecoms Conference | 3&4 November 200831
Pan-regional governance & partnerships
Corporate social responsibility
… while Zain has focused on building a sustainable emerging market business model to achieve profitable growth
Focus on loyalty and retention
One brand and one experience Seamless cross-border network
Cost (CAPEX and OPEX) synergies
EMERGING MARKET BUSINESS MODEL
leveraging on the pan-regional footprint
Customized value proposition for
low ARPU segment
FT World Telecoms Conference | 3&4 November 2008| Zain Limited © |
Thank you

17
Networking Coffee Break
We will resume at 11:00
Innovation – What Can Emerging Markets Teach Us?Michael Joseph, CEO, Safaricom
Chris Gabriel, Chief Executive, Celtel International
Michael Hecker, VP, Strategy and Corporate Development, Mobile TeleSystems OJSC
Sanjay Gupta, Chief Marketing Officer, Airtel

18
Michael Joseph
CEO Safaricom Limited
3rd November 2008
Emerging Markets; Emerging Markets;
KenyaKenya
* Source of Data: EIU Country Report Feb 2008
GDP Growth Rate …
GD
P G
row
th
6.3%
4.1%
6.1%5.7%5.1%
2.9%
1.2%1.2%
0.00%
1.00%
2.00%
3.00%
4.00%
5.00%
6.00%
7.00%
2000/1 2001/2 2002/3 2003/4 2004/5 2005/6 2006/7 2007/8
Official GDP excludes the Informal Sector – which is a large % of the Economy

19
+370%+97%
+77%
+64%
+57%
+54%
+68%
+32%
2,513,154
3,944,007
6,081,950
10,231,554
13,500,565
1,528,420864,347
439,78493,4750
2,000,000
4,000,000
6,000,000
8,000,000
10,000,000
12,000,000
14,000,000
16,000,000
2000/1 2001/2 2002/3 2003/4 2004/5 2005/6 2006/7 20007/8 20008/9
Num
ber o
f Sub
scrib
ers
Subscriber Growth Rate…
* Source of Data: EIU Country Report Feb 2008
Year
Rural Expansion … Revenue Growth
0
500
1,000
1,500
2,000
2,500
2000/1 2001/2 2002/3 2003/4 2004/5 2005/6 2006/7 20007/8 20008/9
Site
s
0
10,000
20,000
30,000
40,000
50,000
60,000
70,000
80,000
Rev
enueSites Ongoing Revenue
Expansion to Rural Areas hasResulted in Revenue Growth
20
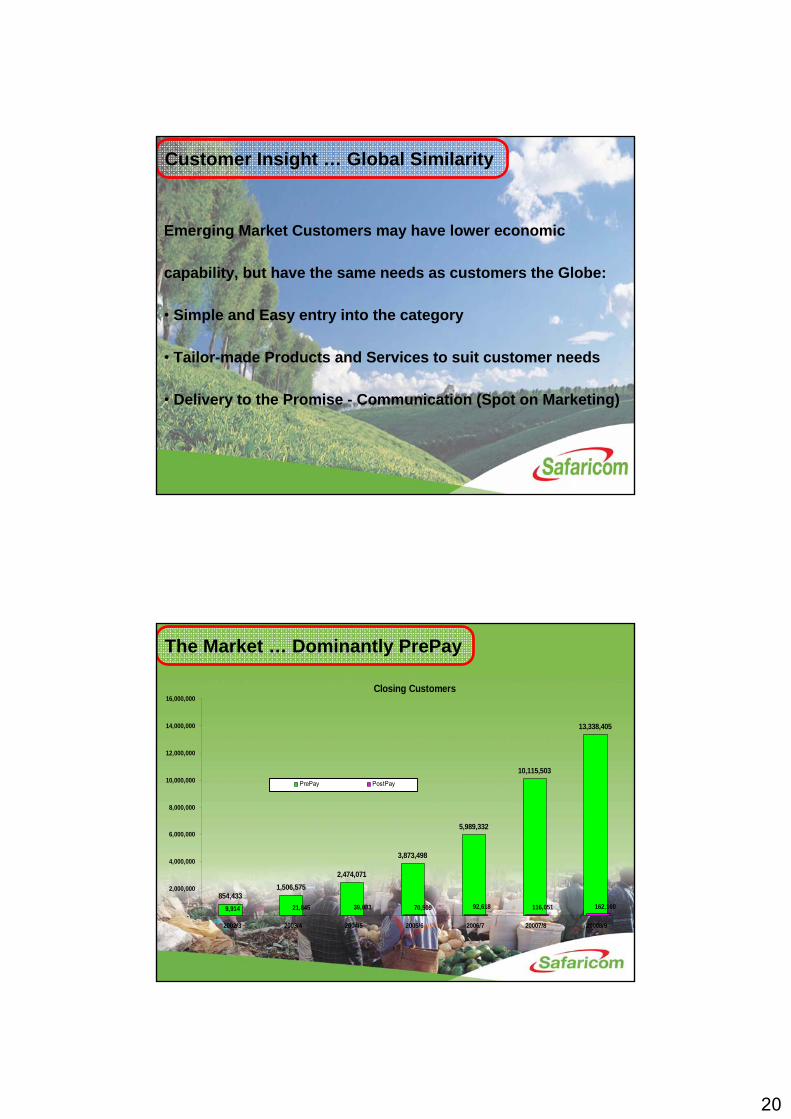
Customer Insight … Global Similarity
Emerging Market Customers may have lower economic
capability, but have the same needs as customers the Globe:
• Simple and Easy entry into the category
• Tailor-made Products and Services to suit customer needs
• Delivery to the Promise - Communication (Spot on Marketing)
Closing Customers
854,4331,506,575
2,474,071
3,873,498
5,989,332
10,115,503
13,338,405
9,914 162,160116,05192,61870,50939,08321,845-
2,000,000
4,000,000
6,000,000
8,000,000
10,000,000
12,000,000
14,000,000
16,000,000
2002/3 2003/4 2004/5 2005/6 2006/7 20007/8 20008/9
PrePay PostPay
The Market … Dominantly PrePay

21
0.1%
0.2%
1%
6%
7%
11%
22%
52%
74% of top-ups are in low denomination
Cards
Top-Up … Lower Entry Point
6.25
3.125
0.25
MPESA
SAMBAZA
12.5
1.25
0.625
USD
Total
12,785,843
1,628,359
1,671,962
2,563,012
1,395,034
1,810,282
3,717,194
Key No of Subs
Revenue … Spend Bands
<0.0125
0.0125 - 1.25
1.26 - 2.50
2.5 - 6.26
6.26 - 12.5
>12.5
29%
14%
11%
20%
13%
13%
19%
% Revenue
14%
NA
1%
3%
62%USD

22
• We have over 3800 Prepay customers to date • Affordable device – BlackBerry 7130: Distribution expansion and sales through dealers
Launch of PrePay BlackBerry Performance
Tailor-Made Products … To Customer needs
0100020003000400050006000700080009000
Dec-07 Jan-08 Feb-08 Mar-08 Apr-08 May-08 Jun-08 Jul-08 Aug-08 Sep-08
Cumulative Device Sales
Cumulative APN activations
Embracing New Technology….
Distinct Data Users
337,068
1,046,083
200,000
400,000
600,000
800,000
1,000,000
1,200,000
Aug
-07
Sep-
07
Oct
-07
Nov
-07
Dec
-07
Jan-
08
Feb-
08
Mar
-08
Apr
-08
May
-08
Jun-
08
Jul-0
8
Aug
-08
Sep-
08
Launch of 3G

23
*Source – Finaccess national survey 2006
Kenya’s Mobile Market Banked Population
Only 19% of Kenyans have bank accounts but many more have access to a mobile phone … the gap is widening
M-PESA …. Fulfilling a Need
45%
27%
27%
No Access Friend/Family Own
81%
19%
Unbanked Banked
M-PESA … Fulfilling a Need4.1 Million Subscribers registered as at September 30th
Average of 10,000 new registrations per day
0
500,000
1,000,000
1,500,000
2,000,000
2,500,000
3,000,000
3,500,000
4,000,000
4,500,000
Jul-0
7
Aug
-07
Sep-
07
Oct
-07
Nov
-07
Dec
-07
Jan-
08
Feb-
08
Mar
-08
Apr
-08
May
-08
Jun-
08
Jul-0
8
Aug
-08
Sep-
08

24
Thank YouThank You
Zain: Strategies For Emerging Markets
Chris GabrielChief Executive Zain Africa
A wonderful world
FT World Telecoms ConferenceLondonNovember 3, 2008
25
Zain is an emerging telecoms player operating in 22 markets in the Middle East and sub-Saharan Africa
$1,500--------------------average GDP
per capita
500,000+--------------------point of sales
16,000/102--------------------
staff/nationalities
165 million +--------------------SMS per day
15,500+--------------------base stations
754 million+--------------------call attempts
per day
600 million--------------------
population under license
$630 billion--------------------
total GDP
15m sqm--------------------
geographic coverage
18%--------------------
average penetration rate

26
Changecontent and/or context?
• Historical context• Industry perception and forecasting as recently as 2005 was based
on two major fallacies and led to severe underestimation of market potential
• Assumptions regarding size of addressable market • The equity of mobile calls in developing countries
• The African and Indian market experiences confirmed our thoughts
Identifying untapped potential in developing countries

27
History of the telecom industry• Monopoly
• State Controlled
• Heavily Regulated
• Engineering-led utility
• Zero Marketing
• What Brand?!!!
• Command & Control
• Captive Customer
Build ScaleBuild Scale
Strategy
Leverage very high growth market
Leverage very high growth market
Create a global brand
Create a global brand

28
The fury of execution:1.Managing strategic challenges when
solidifying competitive position
2.Leveraging size and diversity
3.Building strategic capabilities
4.Balancing financial profitability & growth – lower ARPU/rural penetration
The fury of execution:5.Operationalizing synergies
6. Leveraging emerging technologies
7. Alternative energy sources
8. Building the learning capability
9. Vitalizing the role of domestic/local operations and actively creating & executing the vision

29
IntroducingOne Network
Telecom service of the year
CommsMEA award &
Global Telecom Business Award
2008
September 27, 2006
One Network was introduced in East Africa
Kenya Tanzania Uganda
One Network expanded to
June 08, 2007
DRC Congo B Gabon
One Network roll-out expanded service to
End 2007 and 2008
SudanMalawiChad Burkina FasoNigerNigeria
One Network roll-out
Pha
se 1
Pha
se 2
Pha
se 3
Bahrain Iraq Jordan Saudi Arabia

30
Introducing Me2U
60
Send virtual money to
Friends and family
Send money from Me2U
money account to bank account Deposit cash
Receive virtual money
Pay bills, pay for
goods and services
Send money from your bank
account to Me2U Money account
Top up yours or someone else
airtime account
Withdraw cash
Me2U

31
61
Secure Secure
–– No need to carry cash No need to carry cash
–– Safe way send money to friends and family Safe way send money to friends and family
–– Password is needed for each transactionPassword is needed for each transaction
–– State of the art security applicationState of the art security application
Convenient Convenient -- available to you 24/7available to you 24/7
Simple Me2U style menuSimple Me2U style menu
Easily accessible from your phone menuEasily accessible from your phone menu
Me2U
Global Brand = Global Company
Why the Zain brand?

32
PassionBrandspreach a better world
“making life better”
“A wonderful world”
Giving Back to the community
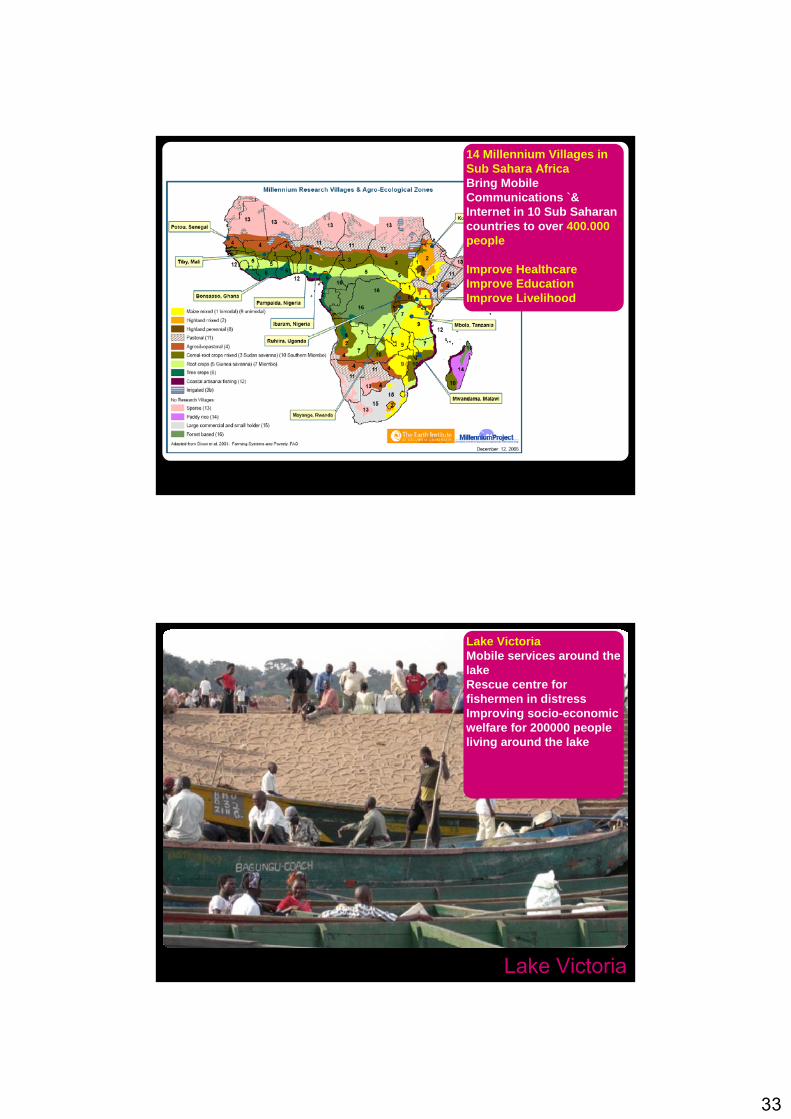
33
14 Millennium Villages in Sub Sahara AfricaBring Mobile Communications `& Internet in 10 Sub Saharan countries to over 400.000 people
Improve HealthcareImprove EducationImprove Livelihood
Lake Victoria
Lake VictoriaMobile services around the lakeRescue centre for fishermen in distressImproving socio-economic welfare for 200000 people living around the lake

34
Zain challenge and aspirationThe first Middle Eastern - African company to be global
The first telecom company to join the top 100 brands in the world.
Thank youFor more information please contact:
Christopher A. GabrielChief ExecutiveZain Africa

35
MTS Group – Strategy Forward
Financial Times World Telecoms Conference November 03/04 2008, The Landmark, London
Dr. Michael Hecker, VP Strategy and Corporate Development, MTS Group
Safe harbor
Some of the information in this presentation may contain projections or other forward-looking statements regarding
future events or the future financial performance of MTS, as defined in the safe harbor provisions of the U.S. Private
Securities Litigation Reform Act of 1995. You can identify forward looking statements by terms such as “expect,”
“believe,” “anticipate,” “estimate,” “intend,” “will,” “could,” “may” or “might” the negative of such terms or other similar
expressions. We wish to caution you that these statements are only predictions and that actual events or results may
differ materially. We do not intend to update these statements to reflect events and circumstances occurring after the
date hereof or to reflect the occurrence of unanticipated events. We refer you to the documents MTS files from time to
time with the U.S. Securities and Exchange Commission, specifically, the Company’s most recent Form 20-F. These
documents contain and identify important factors, including those contained in the section captioned “Risk Factors,”
that could cause the actual results to differ materially from those contained in our projections or forward-looking
statements, including, among others, potential fluctuations in quarterly results, our competitive environment,
dependence on new service development and tariff structures; rapid technological and market change, acquisition
strategy, risks associated with telecommunications infrastructure, risks associated with operating in Russia and the
CIS, volat i l i ty of stock pr ice, f inancia l r isk management, and fu ture growth subject to r isks.

36
MTS Group Overview - Facts & Figures
Total Subscribers 1,38 mlnMarket share 74%Market place 1 Revenue (only 3Q, 4Q) $ 67 mlnOIBDA 56,5%
Total Subscribers 0,36 mlnMarket share 88%Market place (revenue) 1 Revenue $ 168 mlnRevenue growth (vs. 2006) +58%OIBDA 55,5%
Total Subscribers 2,8 mlnMarket share 54%Market place 1 Revenue $ 248 mlnRevenue growth (vs. 2006) +66%OIBDA (2007) 63,5%
Total Subscribers 57,43 mlnMarket share 33%Market place (revenue) 1Revenue $ 6181 mlnRevenue growth (vs. 2006) +29%OIBDA 2007 51,0%
Total Subscribers 3,8 mlnMarket share 53%Market place (subscribers) 1
Total Subscribers 20,0 mlnMarket share 36%Market place (revenue) 2 Revenue $ 1608 mlnRevenue growth (vs. 2006) +6%OIBDA 48,6%
MTS Armenia, 2007
MTS Turkmenistan, 2007
MTS Uzbekistan, 2007
MTS Russia, 2007MTS Belarus (49%), 2007MTS Ukraine, 2007
RUSSIABELARUS
UZBEKISTAN
TURKMENISTAN
UKRAINE
ARMENIA
MTS is the leading mobile operator group in the CIS
MTS Revenue in 2007 $8,25 bln. 2008 forecast*
• Revenue Growth > 25%
• OIBDA > 50%
* - in local currencies Source: MTS
74,9%
Russia19,5%
Ukraine
3,0%
Uzbekistan
2,0%
Turkmenistan
0,8%
Armenia
MTS 3+2 Group Strategy: Growth + Efficiency
EFFICIENCY
GROWTH
Delivering best customer experience
Expansion in CIS and Developing Markets
Cost efficiency
Driving data &content services
MTS Group development
Delivering superior quality at all touch points
Increasing customer lifetime value
Driving demand stimulation
Market consolidation in existing CIS presence
Enlarging CIS footprint
Realizing growth opportunities outside CIS
Continuous cost & process efficiency focus
Exploiting synergies within CIS operations
Optimal technology solutions
Compelling Internet user experience
Innovative services & attractive content portfolio
Broad and rapid infrastructure deployment (3G)
Efficient Group organization and processes
Build-up of best-in-class workforce andcapabilities and attractive corporate culture
Active corporate and social responsibility
1
3
2
+1
+2
+
Leading communi-
cation brand in CIS
Exceptional shareholder
returns
Source: MTS

37
MTS Growth Strategy: “Waves of Growth”:
2002 2006 2010 2014
Single-Digit Growth
Double-Digit Growth
Wave 1:Subscriber growth
Wave 2:ARPU growth*
Wave 3:Multiple growth components
Network coverage Usage stimulation Data & Content services
Distribution roll-out Brand Mobile BB infrastruct. (3G/4G)
Acquisition campaigns Quality M&A in/outside CIS
Key Growthdrivers
Data & Content
M&A in CIS
M&A outside CIS
.. = Focus of this presentation
* esp. Russia and UkraineSource: MTS
-13%
2%12%
23%33%
44%50%55%
73%
93%
405%
<30
147%
30 -60
60 -100
100 -150
150 -200
200 -250
250 -300
300 -400
400 -600
600 -800
800 -1000
>1000
MOU growth rate*
Fixed subs groups with MOUin April 2007 in range of :
11 12 13 13 10 7 6 8 9 4Share of subs in the group
among all subs % 2 4
Key growth segments: today’s low ARPU subscribers
Mass Market Russia
*Based on large random sample of subs from April 2007 till March 2008
Sustainable demand growth strategy: “Go 600”
Source: MTS

38
MTS Data & Content strategy: “Mobile makes more”
Data
Home Office
Voice
Home Office
Voice + Data + Content
W-Europe
Fixed
Russia& CIS
-
Well-developedofferings
Low-developedofferings
Mobile
Home + Office + On the move
Capturing, Substitution &
Completionby mobile
Source: MTS
In the future mobile BB will play a similar strong role that mobile voice has taken in the CIS in the past
Aggressive Mobile Broadband infrastructure roll-out at MTS
Network deployment to stimulate demand, drive data and content usage and increase overall customer lifetime value
2010
+ 40 cities
20092008
+ 24-27 cities
14 cities
Full commercial HSPA-enabled networks launched:
St. Petersburg, May 2008
Kazan, June 2008
Sochi and Yekaterinburg, July 2008
Nizhny Novgorod, August 2008
Novosibirsk, Norilsk and Vladivostok, September 2008
Add’l 6 cities until the YE 2008
2010: HSPA-enabled networks launched in all regions of Russia
2008: Commercial launch by YE in Tashkent, Uzbekistan
2009: Armenia
2007: CDMA-450 EV-DO Rev A launch in Ukraine
18 cities covered to date
3G Russia
Source: MTS

39
“Red Brothers” – MTS and Vodafone partnership agreement
Increasing performance and innovation from mutual enrichment of two leading operator groups
▪ Advantageous procurement terms
▪ Products, services and devices from Vodafone
exclusive to CIS markets
▪ Joint Product Development
▪ Joint Global Key Account management
▪ Best Practice and Knowledge Sharing
Benefits for MTS
▪ Increased scale from MTS
▪ Joint Global Key Account management
▪ Delivering best customer experience for Vodafone
customers in the CIS
▪ Best practice and Knowledge Sharing
▪ Extension of footprint to cover an additional population of
240 million
Benefits for Vodafone
Source: MTS
Critical success factors for emerging market operators
Management focus on execution
Playing regional differences
Exploiting the Brand Power
Seizing the Mobile BB Opportunity
Benefit from “Lessons learned” in developed markets
Source: MTS

40
Thank you for your attention !
Mobile Services
Innovation – What can Emerging Markets teach us?
41
Mobile Services
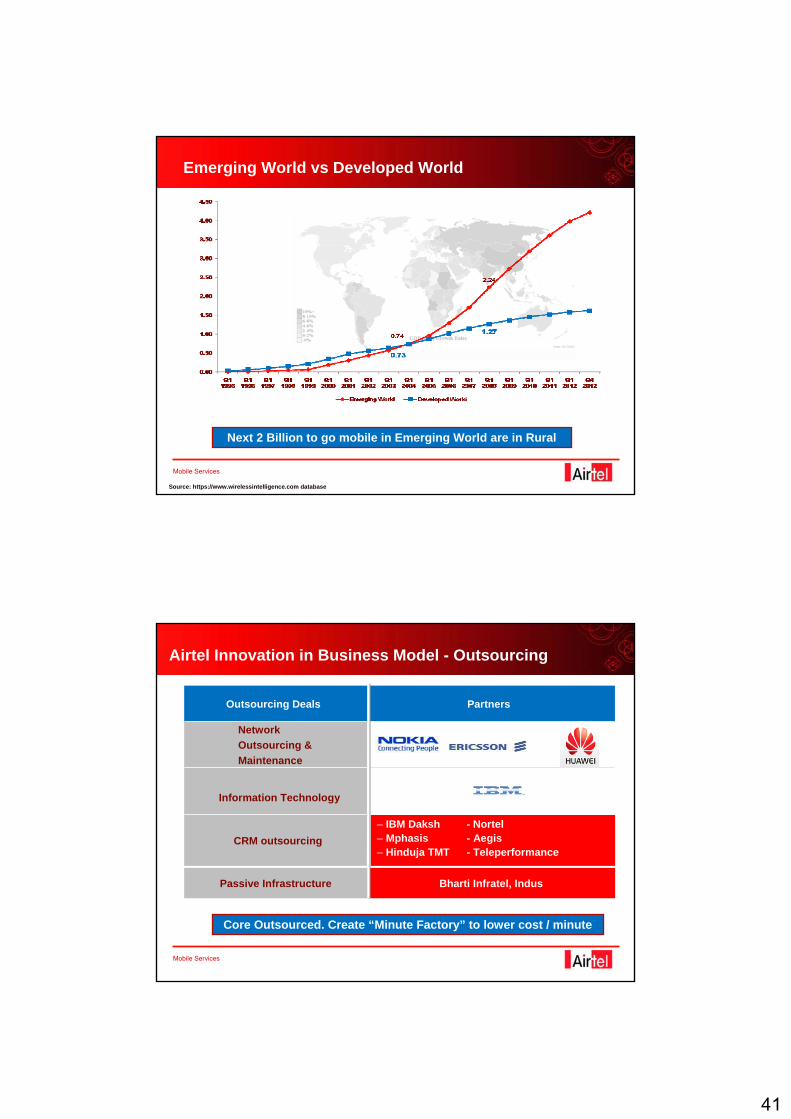
Emerging World vs Developed World
Source: https://www.wirelessintelligence.com database
Next 2 Billion to go mobile in Emerging World are in Rural
Mobile Services
PartnersOutsourcing Deals
– IBM Daksh - Nortel– Mphasis - Aegis– Hinduja TMT - Teleperformance
CRM outsourcing
Information Technology
NetworkOutsourcing &Maintenance
Passive Infrastructure Bharti Infratel, Indus
Airtel Innovation in Business Model - Outsourcing
Core Outsourced. Create “Minute Factory” to lower cost / minute

42
Mobile Services
Creating Profitable Low Cost Business
Reducing Costs. Increasing Penetration. Creating Scale.
Source: https://www.wirelessintelligence.com database
0%
10%
20%
30%
40%
50%
60%
0.00 0.05 0.10 0.15 0.20 0.25 0.30
China Mobile
Bharti Airtel
Celcom Malaysia
AT&T Cingular
TIM Brazil
O2 UK
O2 Germany
NTT DoCoMo
Developed world
Emerging world
EBIT
DA
Mar
gin
(%)
OPEX/Min (USD)
Mobile Services
Pervasiveness
130 Mn TV Sets 40 Mn PCs 300 Mn Mobiles
A Ubiquitous Medium to Reach Out
Source: IRS, TRAI, AUSPI, COAI

43
Mobile Services
Profiling
Customer Location Billing Leg
ARPU Bank Music Movie Games Demogs Insurance
Airtel √ √ √ √ √ √ √ √ √Device Mfr √ √Banks/NBFCs √ √ √ √FMCG
A Smart Medium to Know a Person
Mobile Services
Price
Cost / Transaction Bank Branch $ 1.20
A Cheaper Medium to Sell & Serve
Cost / Transaction Bank ATM $ 0.40
Cost / Transaction Net Banking $ 0.008
Cost / Transaction Mobile $ 0.004

44
Mobile Services
What will Emerging Markets innovate on?
Rural Consumer
Reach, Care & Services
Mobile AdvertisingPervasivenessProfile
Banking & Commerce Education Health
PervasivenessPrice
Will Drive Pervasiveness

45
Mobile Services
Innovation – The Virtuous Cycle
Consumer pocket
50% MobilePenetration
100% MobilePenetration
Innovation Continues...in an EMERGING WAY!!
Cost towards ZERO
Innovation LedNew Business ModelFor Allied IndustriesPays for Next set of Customers going
Mobile
ConsumerPocket
Networking Lunch
We will resume at 14:00
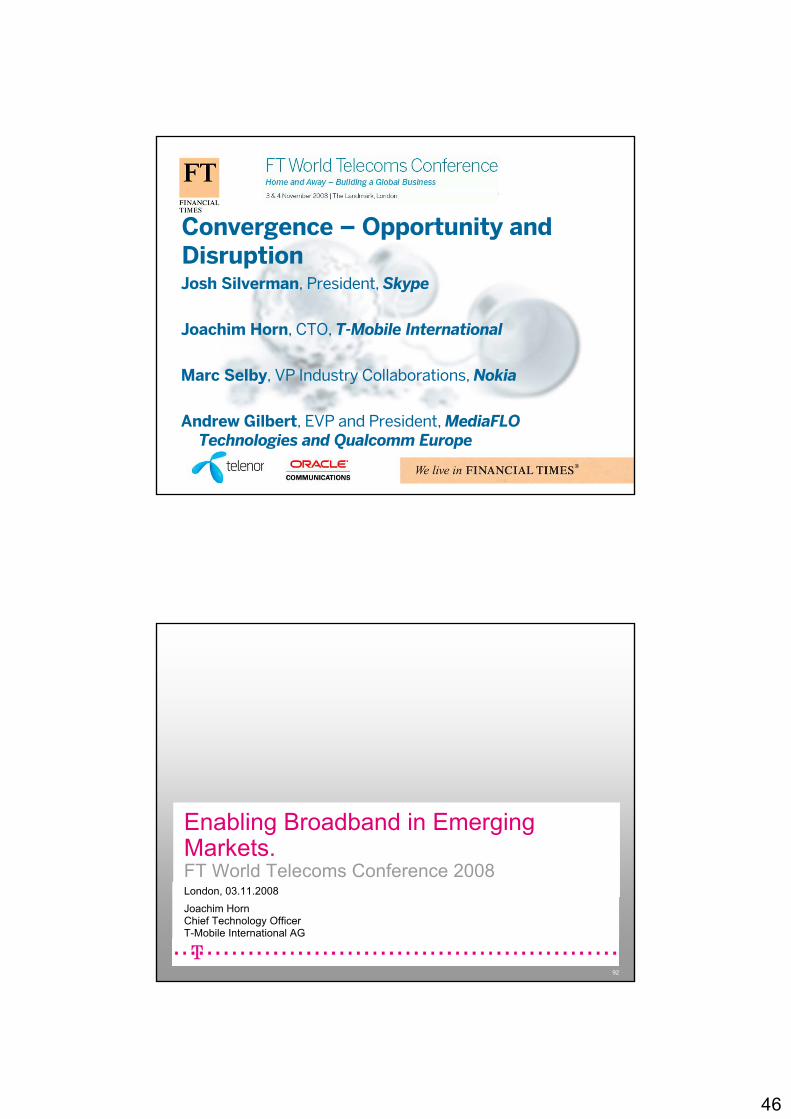
46
Convergence – Opportunity and DisruptionJosh Silverman, President, Skype
Joachim Horn, CTO, T-Mobile International
Marc Selby, VP Industry Collaborations, Nokia
Andrew Gilbert, EVP and President, MediaFLOTechnologies and Qualcomm Europe
92
Enabling Broadband in Emerging Markets.FT World Telecoms Conference 2008London, 03.11.2008 Joachim HornChief Technology OfficerT-Mobile International AG

47
Mobile will bring broadband to emergingmarkets.
0%
40%
60%
80%
100%
Africa & Middle East
Asia Pacific
LatinAmerica
Central & Eastern Europe
North America
Western Europe
Fixed BB subscriber lines / HHMobile BB subscriptions / pop
Source: Pyramid Research
20%
120%
20072007
20132013
Mobile and Fixed Broadband Penetration by Region 2007 & 2013
Mobile drives economic growth in emerging markets.
0%
20%
40%
60%
80%
100%
120%
140%
0 1000 2000 3000 4000 5000 6000 7000 8000 9000
GDP per Capita ($US)
Mob
ile P
enet
ratio
n
Source: Pyramid Research
Mobile Penetration vs. GDP per Capita in Emerging Markets 2007

48
New technologies allow to increase efficiently mobile broadband penetration in emerging markets. Example: Superior Efficiency
Carrier Capacityin Mbit/s
LTE
33
EDGE0.3
UMTS
0.8
HSPA
3
GPRS0.1
WiMAX
11
Increased spectral efficiencySimplified network architecture Re-use of existing assets
Mobile WiMAX TDD mode (10MHz); LTE FDD mode (20MHz paired sp
Example: Green Power
Alternative power … help to provide mobile communication services to people in remote off-grid regions
15000050000 100000
South Asia
East Asia & Pacific
Europe & Central Asia
Latin America & Carribean
Middle East & North Africa
Sub Sahara Africa
Annual Growth in BTS in Developing Regions
2007 - 12
Off-gridOn-grid
Project „Green power for Mobile“
New Services
Affordable devices promote mobile communication and facilitate new services in emerging markets.
“With its ubiquity, relatively low cost and high penetration in nations around the world, mobile phone services have the potential to vastly improve access to funds for people in developing markets”
Low Cost Devices
Availability of low cost devices will drive mobile broadband penetration
ts „3G for all“, „Mass Market 3G Notebooks“, „Mobile Broadband“ Project „Mobile Money Transfer“
Example:
Financial Services

49
Convergence affects the entire value chain.
“Convergence Stack”Our Understanding of Convergence
“Bringing together my communications, information, media and transactions, on any of my devices, in a cost effective way in order to manage and engage in my personal, social and business life anywhere.”
“Create superior user experience & simplicity in a convergent world”
Integrated Tariffs
Technologies & Architectures
Sales Bundles
Products and Applications
Customer Centricity
Devices
Net
wor
k P
rodu
ct s
Sal
es &
Ser
vice
Internet
@ WorkMobiledevice
Photo Music
VideoVoice/
Messaging
Photo Music
Video
Mobiledevice
Laptop
TV
“I can access specific services from many
different devices and screens.”
“I can access all my services from a single
device”
Convergence at the application side enables customers in emerging markets to have access to all services.One service on all screens One screen for all services

50
Performance of NGMN will enable fixed broadband experience on mobile.
Fixed and Mobile CapabilityFixed vs. Mobile Performance
Fixed Mobile
1992 1996 2000 2004 2008…
ISDN ADSL VDSLFTTH
10 Mbit/s
1 Mbit/s
100 kbit/s
10 kbit/s
100 Mbit/s
1 Gbit/s
NGMN3G2G9,6 k
384 k
> 100 M
128 k
50 M
384 k
1988 2012 … 2020
large screen nomadic
small screen on the move
very large screen
@home/ @work
higher bandwidthno mobility
lower bandwidth
high mobility
Co-existenc
e
Fixed
Mobile
Devices BandwidthDemand
Access
Conclusions.
Mobile drives economic growth in emerging markets.Mobile will bring broadband to emerging markets. New efficient technologies and affordable devices allow to increase mobile broadband penetration and facilitate new services in emerging markets.Convergence affects the entire value chain. In emerging markets convergence at the application side enables customers to have access to all services.

51
Thank your for your attention.
Financial Times Emerging Markets November 3rd 2008
102
Current State of the World: Digital Divide Exists
For every 100 people worldwide, only 41 have a mobile phone. Far fewer have Internet access.
41% 15.7%17.4%
Source: World Telecommunication/ICT Indicators Database online 11th edition, 2007. Retrieved November 13, 2007, from http://www.itu.int/ITU-D/ict/statistics/ict/index.html
Global MOBILE Penetration Global INTERNET Penetration
41%
17%

52
Financial Times Emerging Markets November 3rd 2008
103
Why Wireless Connectivity Matters
Mobile Penetration:1% increase 4.7% increase in average per capita income
Internet Penetration:1% increase 10.5% increase in average per capita income
Source: Telecommunications Management Group, Inc (TMG) and ITU World Telecommunications Database Statistics; 2007
Financial Times Emerging Markets November 3rd 2008
104Forecasted to Grow to 1.6 Billion 3G Subscribers by 2012
Source: Wireless Intelligence
3G
Over 3 Billion Cellular Subscribers Including More Than 625 Million 3G Subscribers

53
Financial Times Emerging Markets November 3rd 2008
105
Regional TrendsAsia Pacific & Emerging Markets Forecast to Lead Growth
0
200
400
600
800
1000
1200
1400
1600
2006 2007 2008 2009 2010 2011 2012
North America Latin America Asia Pacific Europe Africa/Middle East
Glo
bal A
nnua
l Han
dset
Sal
es
9741,105
1,2051,291
1,3561,411 1,452
(In m
illio
ns)
Source: Informa Telecoms & Media, October 2007
Financial Times Emerging Markets November 3rd 2008
106106
Rank Operator Country Total Subs (M) QIII Net Adds (M) QII Net Adds (M)(Aug'08) (Jul,Aug) (Apr,May,Jun)
1 China Mobile China 428.9 14.3 22.4 GSM2 China Unicom China 171.8 1.1 3.7 GSM,CDMA 1X3 Bharti India 74.78 5.4 7.4 GSM4 AT&T (Cingular) USA 74.72 1.8 1.5 GSM,WCDMA/HSPA5 Verizon Wireless USA 70.5 1.9 1.5 CDMA 1X,EVDO/RevA6 Mobile TeleSystems Russia 62.2 0.8 1.5 GSM, WCDMA/HSPA7 America Movil - Telcel Mexico 54.5 1.7 1.3 GSM,WCDMA/HSPA,TDMA8 Reliance Comm India 54.3 3.5 5.0 CDMA 1X, GSM9 Telkomsel Indonesia 54.0 1.5 1.1 GSM,WCDMA/HSPA10 NTT DoCoMo Japan 53.8 0.15 0.24 GSM,WCDMA/HSPA,PDC11 Vodafone Essar India 52.8 3.6 5.1 GSM12 Sprint USA USA 51.0 0.07 -0.92 CDMA 1X, EVDO/RevA,IDEN13 Vimpelcom Russia 43.173 0.7 0.4 GSM, WCDMA/HSPA14 BSNL India 43.171 1.2 1.2 GSM, CDMA 1X15 Vivo Brazil Brazil 41.7 1.3 1.1 GSM,WCDMA/HSPA,TDMA,
CDMA 1X,EVDO16 T-Mobile Deutschland Germany 39.4 1.0 1.29 GSM/WCDMA17 Megafon Russia 39.3 1.07 1.21 GSM18 TIM Italy Italy 36.2 0.44 -0.13 GSM/WCDMA19 Vodafone Germany Germany 36.1 0.79 0.88 GSM/WCDMA20 Turkcell Turkey 36.0 0.64 0.3 GSM28 Idea Cellular India 29.3 2.6 3.2 GSM29 Tata India 28.4 2.0 2.0 CDMA 1X
Note:
Source:
Operator ranking is based on total subscriber across all technologies in the country
Wireless Intelligence 25/9/2008, TelecomWatch August 2008, www.Telco.comUS subscriber numbers are esimated based on last quarter announcement by carriers
3G Impact - Global Top 20 Wireless Operators (Aug 2008)

54
Financial Times Emerging Markets November 3rd 2008
107
Russia India
0
5
10
15
20
25
2006 2007 2008 2009 2010 2011
DSL connections (m)3G connections (m)
DSL vs 3G connections
0%
20%
40%
60%
80%
100%
120%
140%
160%
180%
2006 2007 2008 2009 2010 2011
Fixed penetration (%)Wireless penetration (%)
Fixed vs wireless penetration
0
20
40
60
80
100
120
140
160
2006 2007 2008 2009 2010 2011
DSL connections (m)3G connections (m)
DSL vs 3G connections
0%
10%
20%
30%
40%
50%
60%
2006 2007 2008 2009 2010 2011
Fixed penetration (%)Wireless penetration (%)
Fixed vs wireless penetration
Financial Times Emerging Markets November 3rd 2008
108
WCDMA HSPA HSPA+ (HSPA Evolved)
Rel-99 Rel-5 (HSDPA) Rel-6 (HSUPA) Rel-7 Rel-8 Rel-9 & Beyond
1R8 will reach 42 Mbps by combining 2x2 MIMO and HOM (64QAM) in 5MHz, or by utilizing HOM (64QAM) and multi carrier in 10 MHz. 2R9 and beyond may utilize combinations of multi carrier and MIMO to reach 84 Mbps peak rates. Similarly, uplink multi carrier can double the uplink data rates. 3Peak rates for 10 and 20 MHz FDD using 2x2 MIMO, the standard supports 4x4 MIMO enabling peak rates of 278 Mbps. TDD rates are a function of up/downlink asymmetry
Enhanced capacity and data rates
2x data and up to3x voice capacity
Broadbanduploads, QoS
Broadbanddownloads
DL: 384 KbpsUL: 384 Kbps
DL: 1.8 - 14.4 MbpsUL: 384 Kbps
DL: 1.8 - 14.4 MbpsUL: 5.7 Mbps
DL: 28 MbpsUL: 11 Mbps
DL: 42 Mbps1
UL: 11 MbpsDL: 84 Mbps2
UL: 23 Mbps2
2009 2010 2011+20082007
LTE
DL: 71- 143 Mbps3
UL: 37- 75 Mbps3
Complements 3GLeverages wider bandwidth
Rel-8 Rel-9
Wireless Technology Evolution Path

55
Financial Times Emerging Markets November 3rd 2008
109
Enabling New Mobile Internet & Mobile Computing Devices
MARKET OPPORTUNITY FOR POCKET COMPUTINGDEVICES
Pow
erC
onsu
mpt
ion
Dev
ice
Size
Cos
t
MoreFeatures
MoreFeatures
Financial Times Emerging Markets November 3rd 2008
110
Sub $30 CDMA handsets in India
Classic 361Huawei
Classic 203ZTE
Classic 204ZTE Huawei
C2900
Haier2010
HuaweiC2601
56
Financial Times Emerging Markets November 3rd 2008
111
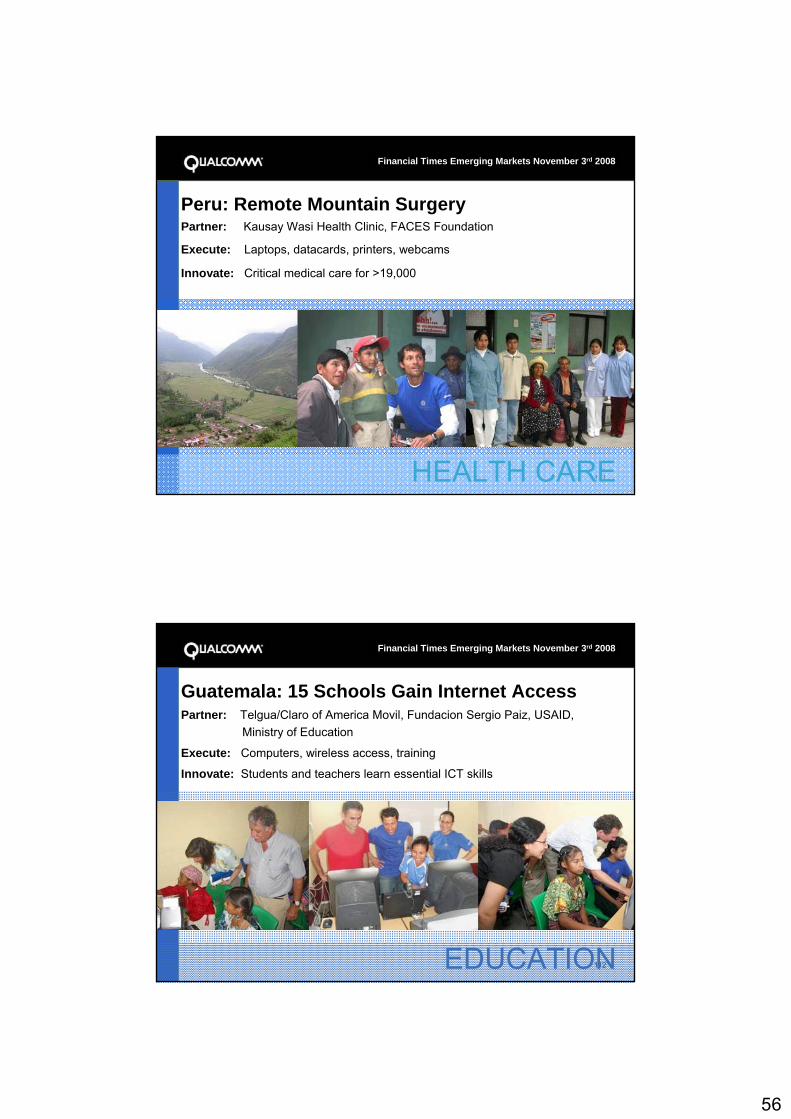
Peru: Remote Mountain SurgeryPartner: Kausay Wasi Health Clinic, FACES Foundation
Execute: Laptops, datacards, printers, webcams
Innovate: Critical medical care for >19,000
HEALTH CARE
Financial Times Emerging Markets November 3rd 2008
112
Guatemala: 15 Schools Gain Internet AccessPartner: Telgua/Claro of America Movil, Fundacion Sergio Paiz, USAID,
Ministry of Education
Execute: Computers, wireless access, training
Innovate: Students and teachers learn essential ICT skills
EDUCATION

57
Financial Times Emerging Markets November 3rd 2008
113ENTREPRENEURSHIP
Sri Lanka: 45 HSDPA Easy Seva CentersPartner: USAID, Dialog Telekom, SSG, NDB, Infoshare, LOLC
Execute: Microfinance loans, business in a box, training
Innovate: Entrepreneurs build businesses providing ICT services in rural
communities
Financial Times Emerging Markets November 3rd 2008
114
Convergence of Devices & Services3G & Beyond 2G 1G
PHONE EVOLUTION
MobileCommunication Information Entertainment / CE Rich
CommunicationUser Generated Content/
Social Networking Computing
+ + + + +
PC EVOLUTION
User Generated Content/ Social
NetworkingComputing Simple
Communication Information EntertainmentRich
Communication
+ + + + +
CONVERGENCEOF DEVICES & SERVICES
Connected ApplicationsRich ContentComputing ApplicationsHigh-Speed Access
Connected DevicesBluetooth HeadsetsMulti-Function CEMobile Computing

58
Financial Times Emerging Markets November 3rd 2008
115
Wireless Reaches the parts that other communication doesn’t!
Networking Coffee Break
We will resume at 15:40

59
Emerging Markets Leadership Panel
Boris Nemsic, CEO, Telekom Austria Group and mobil austria
Kjell Morten Johnsen, Head of Telenor Russia and Snr Vice President, Telenor CEE
Jose Maria Alvarez-Pallete, Managing Director, Telefónica, Latin America
Cenk Serdar, Deputy CEO, Turkcell
Kjell Morten JohnsenSenior Vice President, Central and Eastern Europe
Emerging markets leadership panel
FT World Telecoms Conference, London, 3rd November 2008
60
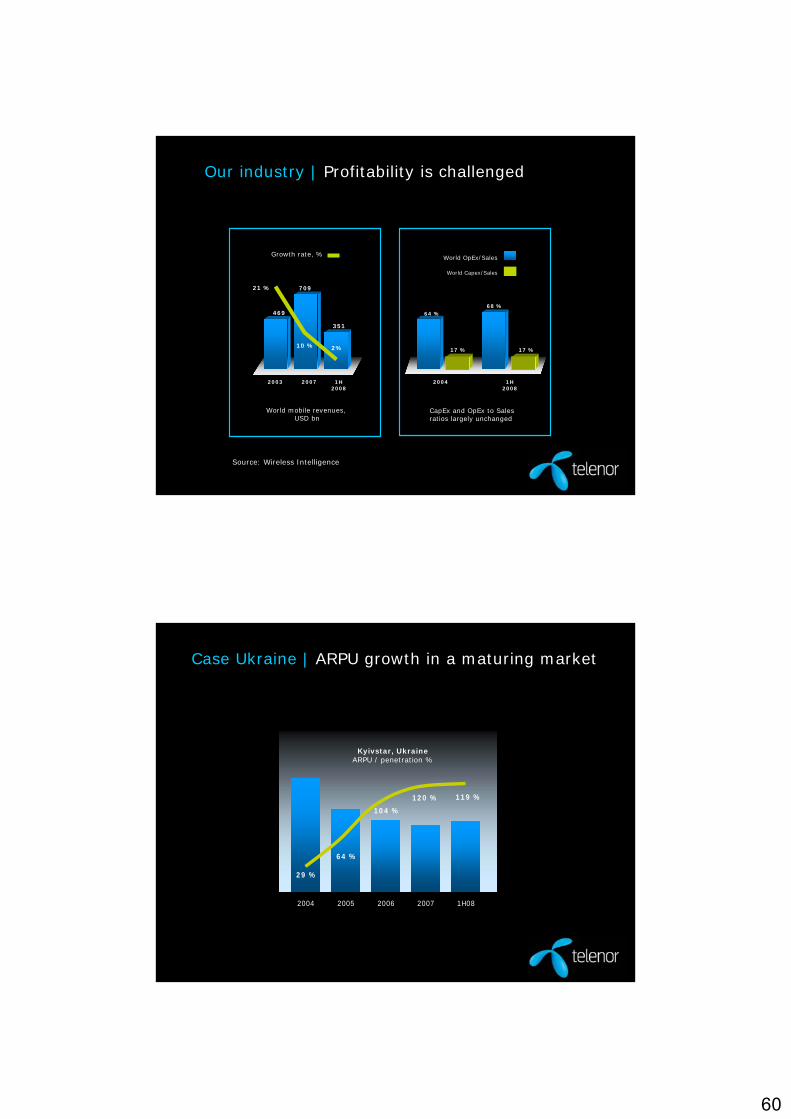
Growth rate, %
CapEx and OpEx to Sales ratios largely unchanged
469
709
2003 2007
21 %
2%
1H 2008
351
10 %
World mobile revenues, USD bn
2004
64 %68 %
1H 2008
17 % 17 %
World OpEx/Sales
World Capex/Sales
Our industry | Profitability is challenged
Source: Wireless Intelligence
Case Ukraine | ARPU growth in a maturing market
119 %
64 %
104 %
120 %
29 %
2004 2005 2006 2007 1H08
Kyivstar, UkraineARPU / penetration %

61
Case Pakistan | Greenfield success
Market share
Ufone
Warid
Mobilink
Zong
0 %
10 %
20 %
30 %
40 %
50 %
60 %
1H05 2H05 1H06 2H06 1H07 2H07 1H08 2H08E
Instaphone
Summary
• Operational efficiency
• Global scale – local drive
• Innovator position
• Deploy Telenor concepts
• Customer experience and brand preference

62
Telefónica Latinoamérica
José María Álvarez-PalleteGeneral Manager, Telefónica LatinoaméricaLondon - November 3, 2008
The Opportunity of Emerging Markets:
Telefónica Latinomérica
FT World Telecoms Conference
Telefónica Latinoamérica
Today Latin America is a young, urban, and multicultural society with great growth potential
México DF POP 23 m
São Paulo POP 19 m
Buenos AiresPOP 15 m
Source: Telefónica
Poverty rate evolution in Latin America (% Pop)
Homes by socioeconomic level
In Brazil, in the next four years, 10% of the current homes (5.5 m) will become middle–upper class
More than 40 million people have escaped poverty since 2003
More than 74 million people have improved their economic status, 3 times above population growth in this period
Maximum level in Social Public Expenditure per capita ($ 850)
6 Cities among 21st Century megalopolis80% of Urban population
Only 8% > 65 years old (2015e)
Río de JaneiroPOP 12 m
LimaPOP 9 m
BogotáPOP 9 m
Source: Banco de Santander; Report:“A emergência da classe média no Brasil”
42,0 39,8 36,5 35,144,0 44,2
2002 2003 2004 2005 2006 2007
42.0 39.8 36.5 35.144.0 44.2
2002 2003 2004 2005 2006 2007
236 MM236 m
196 MM196 m
-7 pp
B
Dec05 Dec10E
A
E
C
D
42% 37%
12%17%
12%
15%17%
23%19%
8%B
05 10E
A
E
C
D
42% 37%
12%17%
12%
15%17%
23%19%
8%

63
Telefónica Latinoamérica
0,0
2,0
4,0
6,0
8,0
10,0
12,0
2006 2007 2008 2009
GDP Latin America100% = € 3,400 bn *
* Source: IMF 2007 78% Regional GDP in Brazil, Mexico, Colombia, Chile and Peru
BBB+
AA
BBB+
A+
BBB+
BBB+
AA
BBB+
A+
BBB+
The region has averaged 5% growth during the past five years, with the region's seven main economies growing at the same time.
Real GDP growth (%)2006 – 2009e
Source:. IMF October 2008 Regional Overview
Despite global economic conditions, the region will keep growing and consolidating international confidence...
>75% of GDP Investment grade
Investment Grade countries in 2008
Latin America average for 2008 at around 4.6%
IMF - World Economic Outlook
Telefónica Latinoamérica
The recent slowdown of the world economy takes place after a solid expansion of economic activity in the region, based on the increasing integration of emerging economies.
The advantageous economic conditions of the past years place the region in a better position to deal with the current situation.
…driven by sound economic policies that will be needed for future challenges
2001 2002 2003 2004 2005 2006 2007 2008
x 3,5 71%58%
45%36%29%25%22%21%
Reserves/External debt Latam*
Higher than Poland (39.3%), Czech Republic (46.6%), Hungary (20.4%)
*Includes: Argentina, Brazil, Chile, Colombia, Venezuela, México and Peru
60%
2000
45%
2007
- 15 pp
Less dependency
on the US
% Exports to the US vstotal
Source: McKinsey
Source: IMF
IMF - World Economic Outlook (WEO)Current Account Balance
The region faces a new environmentFall of commodity pricesDifficult external conditionsInflationary pressures
Source:. IMF October 2008 Regional Overview
-4,0-2,00,02,04,06,08,0
10,012,014,016,0
2006 2007 2008 2009
Argentina Brazil Chile Colombia Mexico Peru Venezuela
64
Telefónica Latinoamérica
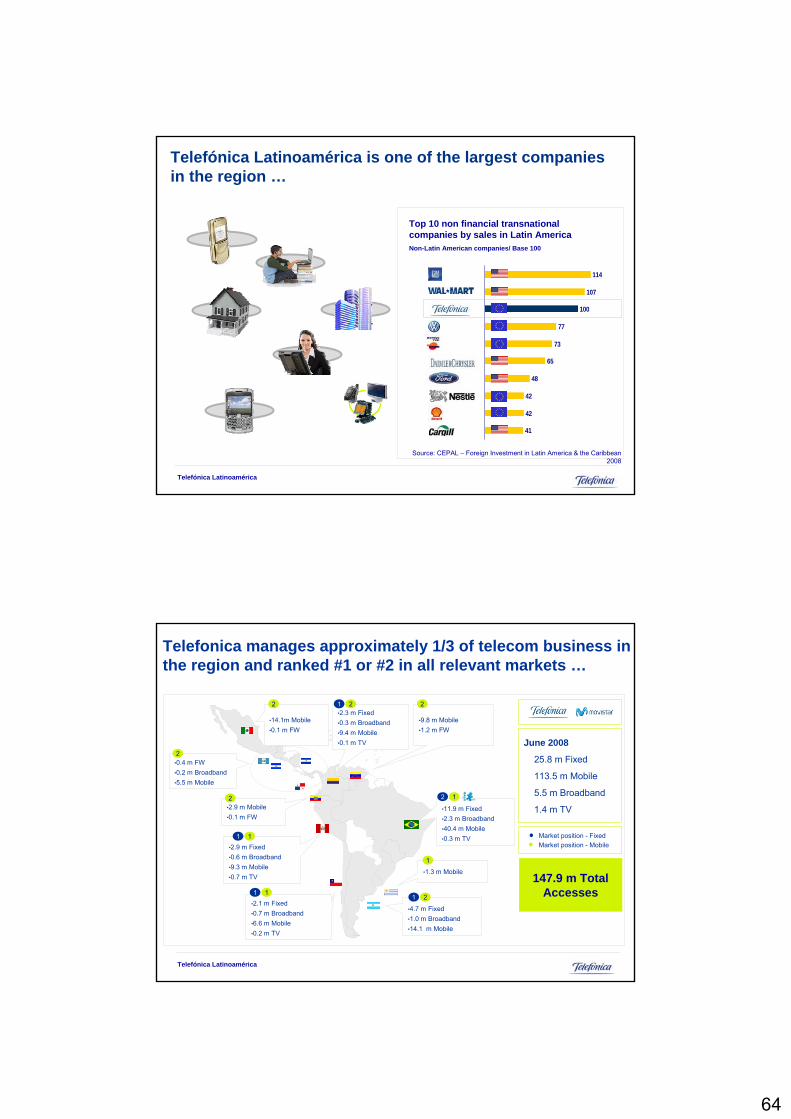
Top 10 non financial transnational companies by sales in Latin America Non-Latin American companies/ Base 100
Source: CEPAL – Foreign Investment in Latin America & the Caribbean 2008
41
42
42
48
65
73
77
100
107
114
Telefónica Latinoamérica is one of the largest companies in the region …
Telefónica Latinoamérica
June 2008
25.8 m Fixed
113.5 m Mobile
5.5 m Broadband
1.4 m TV
Market position - FixedMarket position - Mobile
•1.3 m Mobile
•4.7 m Fixed•1.0 m Broadband•14.1 m Mobile
•2.1 m Fixed•0.7 m Broadband•6.6 m Mobile•0.2 m TV
•2.9 m Fixed•0.6 m Broadband•9.3 m Mobile•0.7 m TV
•14.1m Mobile•0.1 m FW
•2.9 m Mobile•0.1 m FW
•9.8 m Mobile•1.2 m FW
•0.4 m FW•0.2 m Broadband•5.5 m Mobile
•11.9 m Fixed•2.3 m Broadband•40.4 m Mobile•0.3 m TV
•2.3 m Fixed•0.3 m Broadband•9.4 m Mobile•0.1 m TV
2
2 21 2
2
11
1121
1
12
147.9 m Total Accesses
Telefonica manages approximately 1/3 of telecom business in the region and ranked #1 or #2 in all relevant markets …

65
Telefónica Latinoamérica
Dec-98 Dec-99 Dec-00 Dec-01 Dec-02 Dec-03 Dec-04 Dec-05 Dec-06 Dec-07
+4 m +5 m
+10 m+9 m
+27 m
+20 m
+16 m
+19 m
+4 m
Jun-08
+4 m
20 24 2833
4352
79
99
115
134
Dec
+4 m+4 m +5 m+5 m
+10 m+10 m+9 m+9 m
+27 m+27 m
+20 m+20 m
+16 m+16 m
+19 m+19 m
+4 m+4 m
-08
+4 m+14 m
148
Dec-98 Dec-99 Dec-00 Dec-01 Dec-02 Dec-03 Dec-04 Dec-05 Dec-06 Dec-07
+4 m+4 m +5 m+5 m
+10 m+10 m+9 m+9 m
+27 m+27 m
+20 m+20 m
+16 m+16 m
+19 m+19 m
+4 m+4 m
Jun-08
+4 m+4 m
20 24 2833
4352
79
99
115
134
Dec
+4 m+4 m +5 m+5 m
+10 m+10 m+9 m+9 m
+27 m+27 m
+20 m+20 m
+16 m+16 m
+19 m+19 m
+4 m+4 m
-08
+4 m+14 m
148
… thanks to a sustained growth since 1998
Telefónica has reached 150 MM accesses, more than a year
before our commitment for 2009
Telefónica Latinoamérica
With a strong, long-term commitment to the region that also makes us the largest private foreign investor in Latin America
56%24%
7%
6%4% 3%
Latin America
East Europe
Asia (Southeast)
Asia (South)
Middle East & North Africa
Africa Sub-Saharian
FDI in Telecommunications, by region1990-2005 Main investment recipient
(US$ 120bn in the period 1990-2005)
Telecommunications CAPEX in Latin America*1990-2007
Telecommunications CAPEX Aprox. 130 Bn€ for the period 1990-2007
Telefónica has invested around 30% of the total CAPEX in Latam
* Telefónica´s estimations
Telefónica´s investment in Latin America 1990-2007 (m Euros)
Latin America has experienced an important investment flow in the past years
Telefónica has been the leader thanks to our permanent investment commitment, which started more
than 15 years ago
Telefónica has committed infrastructure investments in Latin America of € 14-16,000 m for the period
2007-10
83,24737,643
45,604
FDI Total
83,24737,643
45,604
Infrastructure Total
66
Telefónica Latinoamérica
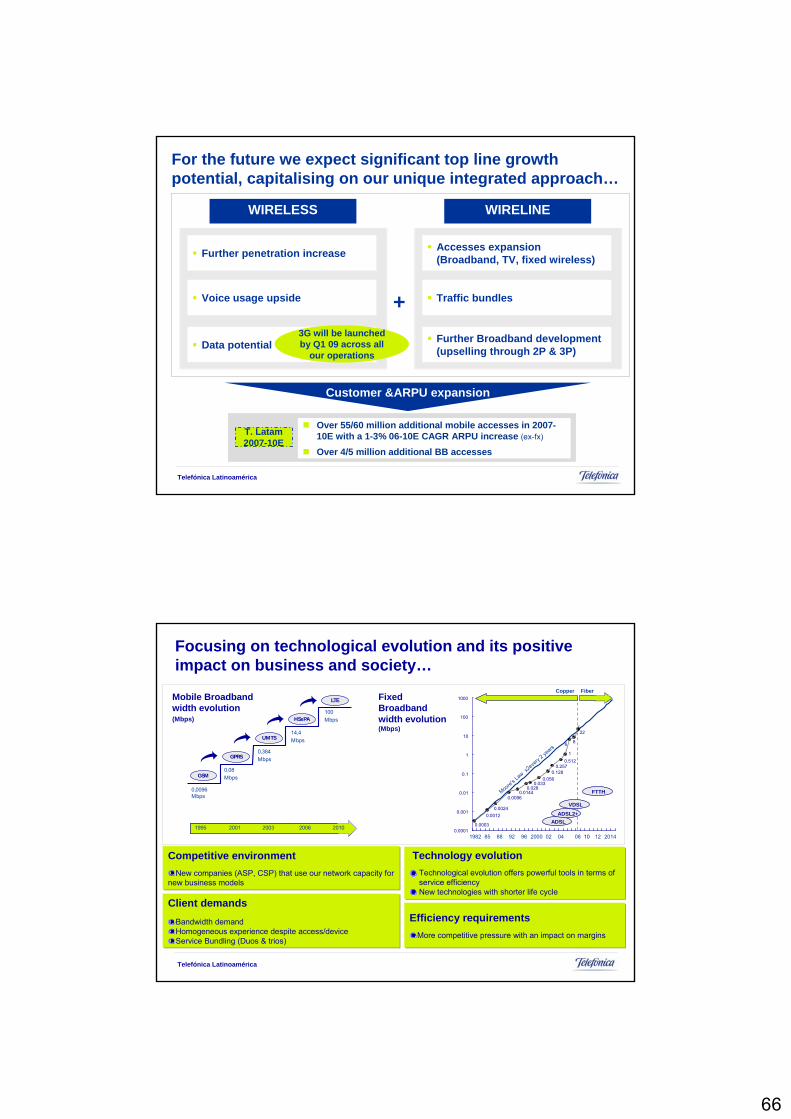
For the future we expect significant top line growth potential, capitalising on our unique integrated approach…
Further penetration increase
Data potential
Voice usage upside
WIRELESS
Accesses expansion (Broadband, TV, fixed wireless)
Further Broadband development (upselling through 2P & 3P)
Traffic bundles+
WIRELINE
Customer &ARPU expansion
T. Latam2007-10E
Over 55/60 million additional mobile accesses in 2007-10E with a 1-3% 06-10E CAGR ARPU increase (ex-fx)
Over 4/5 million additional BB accesses
3G will be launched by Q1 09 across all
our operations
Telefónica Latinoamérica
Client demandsBandwidth demandHomogeneous experience despite access/deviceService Bundling (Duos & trios)
Competitive environmentNew companies (ASP, CSP) that use our network capacity for
new business models
Efficiency requirementsMore competitive pressure with an impact on margins
Technology evolutionTechnological evolution offers powerful tools in terms of service efficiency New technologies with shorter life cycle
1995 2001 2003 2006 20101995 2001 2003 2006 2010
GSM
GPRS
UMTS
HSxPA
LTE
0,0096 Mbps
0,08Mbps
0,384Mbps
14,4Mbps
100Mbps
Mobile Broadband width evolution(Mbps)
Fixed Broadband width evolution(Mbps)
Focusing on technological evolution and its positive impact on business and society…
1982 85 88 92 96 2000 02 04 10 12 2014
Moore's Law x
2every
2 years
Copper Fiber
ADSLADSL2+
VDSL
FTTH0.033
0.0560.128
0.2570.512
22
0.00240.0012
0.0003
0.0280.0144
0.0096
1
6 8
0.0001
0.001
0.01
0.1
1
10
100
1000
08

67
Telefónica Latinoamérica
Fostering innovation, dedicating resources and promoting new ideas…
Technological innovation– Telefónica Group1
(m Euros)
20072006
4,3844,301
*Source: Annual Corporate Responsibility Report 2007
R&D investment
Equipment 61%
R&D 14%
Acquisition of other knowledge 13%
Design and Planning 10%
Training & Marketing 2%
Telefonica has innovation centers all over the world…
(1) Technological Innovation according to the definition of OECD (&Spanish INE)
>190 international R+D projects in collaboration with 920 institutionsFund dedicated to entrepreneurial initiatives with 18 on-going, including a project in China
Strategic minority participation - Venture Capital
International Remittances
Speedy Zero
Telefónica Latinoamérica
Developing new products and services for the benefit of our customers…
1st Operator to launch digital TV in the region
17%
6%
13%
3 years 1 year 1 year
Spain Czech RepublicChile
Innovative products
VPN VPN Pasarela Residencial“Llena tu casa de
vida”
IP CardSmart TV
Digital TV market share obtained since launch
Tele-presence
Video-surveillance
i-phone launch
throughout the region
October 2008 -Digital TV
launched in Venezuela
68
Telefónica Latinoamérica
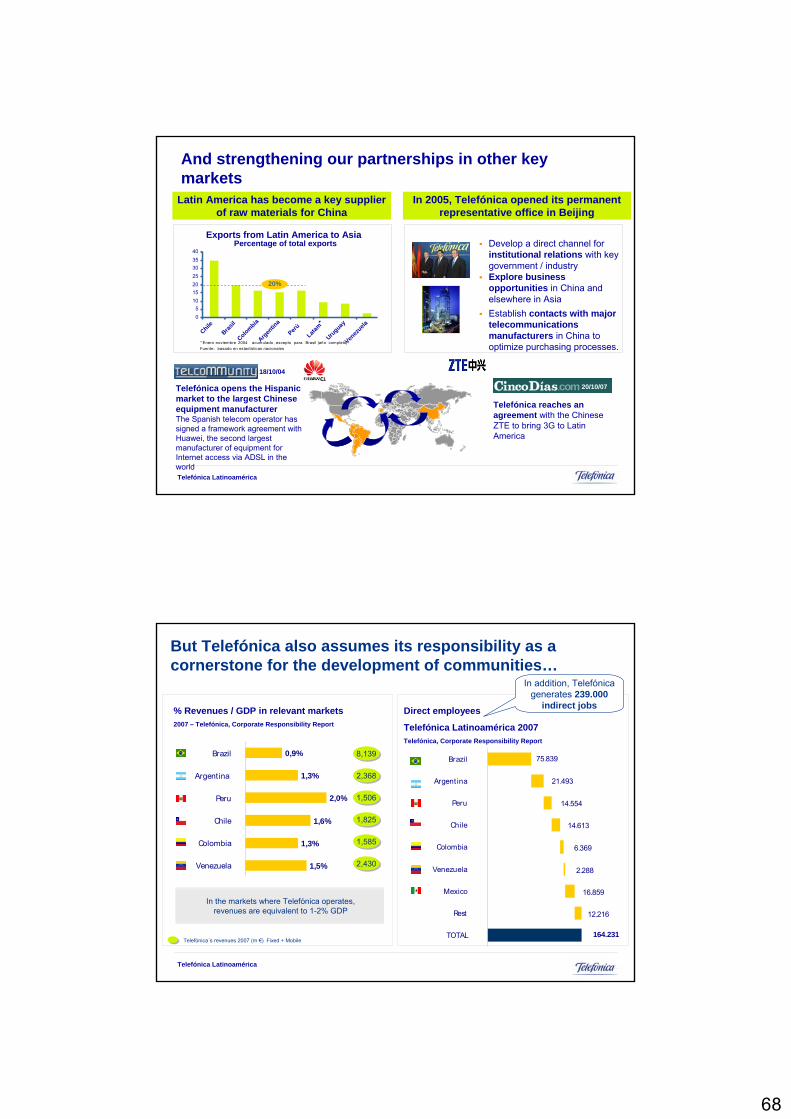
Develop a direct channel for institutional relations with key government / industry Explore business opportunities in China and elsewhere in AsiaEstablish contacts with major telecommunications manufacturers in China to optimize purchasing processes.
Latin America has become a key supplier of raw materials for China
And strengthening our partnerships in other key markets
Exports from Latin America to AsiaPercentage of total exports
05
10152025303540
ChileBras
il
Colombia
Argen
tina
PerúLata
m*
Uruguay
Venez
uela
20%
In 2005, Telefónica opened its permanent representative office in Beijing
* Enero -noviembre 2004 acumulado , excepto para Brasil (año completo)Fuente: basado en estad ísticas nacionales
Telefónica reaches an agreement with the Chinese ZTE to bring 3G to Latin America
20/10/07Telefónica opens the Hispanic market to the largest Chinese equipment manufacturerThe Spanish telecom operator has signed a framework agreement with Huawei, the second largest manufacturer of equipment for Internet access via ADSL in the world
20/10/0718/10/04
Telefónica Latinoamérica
1,5%
1,3%
1,6%
2,0%
1,3%
0,9%
Venezuela
Colombia
Chile
Peru
Argentina
Brazil
% Revenues / GDP in relevant markets 2007 – Telefónica, Corporate Responsibility Report
8,1398,139
1,8251,825
2,3682,368
1,5061,506
1,5851,585
2,4302,430
Telefónica´s revenues 2007 (m €) Fixed + Mobile
But Telefónica also assumes its responsibility as a cornerstone for the development of communities…
Direct employees
Telefónica Latinoamérica 2007Telefónica, Corporate Responsibility Report
164.231
12.216
16.859
2.288
6.369
14.613
14.554
21.493
75.839
TOTAL
Rest
Mexico
Venezuela
Colombia
Chile
Peru
Argent ina
Brazil
In the markets where Telefónica operates, revenues are equivalent to 1-2% GDP
In addition, Telefónica generates 239.000
indirect jobs

69
Telefónica Latinoamérica
… and has brought ICT´s to all of society, proving to be a global leader in corporate responsibility
"INTÉGRAME" recognized by the UN as one of the most important projects
Viernes, 30 de Mayo 2008
We collaborate with more than 400 municipalitiesthroughout the country, from advisory services to the installation of all the telecommunications infrastructure
“We aim at enhancing people’s lives, business performances and the progress of the communities in which we operate, by delivering innovative services based on information and communication technologies.” Spirit of Progress
“Intégrame”
Children
Schools
240
2005 2007 may 08 2008e
>100,000
~1,700
Program launched in collaboration with more than 100
prestigious NGO´s in the region
“CiudadesDigitales”
11,540 52,08273,023
1,1181,531
Telefónica Latinoamérica
1
2
3
4
6
Latin America will still be one of the regions with solid growth potential and it is prepared to deal with the current economic environment.
Latin American society is young, dynamic and has great potential. The region’s significance in the world will increase in the coming years.
Telefónica is proud to lead telecommunications investment in Latin America over the past 18 years, strengthening the sector and bringing our services to all of society.
Telefónica has a significant role in the development of the region, and maintains a strong social and economic commitment with the countries in which operates.
Telefónica is one of the largest companies in Latin America, the leading integrated telecommunications operator in the region, and plays a key role in the Telefónica Group.
Summary
5 In the future, we fill focus on technological evolution, fostering innovation and developing new products and services for the benefit of our customers.

70
Telefónica Latinoamérica
CENK SERDARChief VAS Officer
TURKCELL

71
DemographicsYoung and Growing Population%40 of population is under 22.
Telecom MarketMobile is growingMobile Subs: 63.7mMobile Penetration: 90%Fixed Subs: 17.8mThe world’s highest mobile service taxes!
Population:71 Million
Turkey in a nutshellTurkey in a nutshell
Source: DİA & 3rd party market researches
Recent Developments3G licensing in Q4 2008
MNP implementation in November 2008MVNO licenses in Q1 2009
EconomyStrong Economic Conditions
GDP (2007): $657bGDP per Capita (2007): $9305
CPI % (Oct 2008): 11.13
Turkey
Kazakhstan
Azerbaijan
Georgia
Moldova
Northern Cyprus
Belarus
Ukraine
Turkcell GroupTurkcell Group
*Turkcell is holding a 41.45% stake in Fintur and trough Fintur holds interest in AzerCell, K’Cell, GeoCell and MoldCell. The subscriber number according to our percentage ownership is 48.8 million as of Q2 2008.
Operations in 8 countries
58 M subscribers in total
35.4 M in Turkey
2
3
3
1
1
1
12

72
Turkcell’s Key FiguresTurkcell’s Key Figures
• Europe’s 3rd and the world’s 13th largest operator in terms of subscribers
• Biggest operator in Turkey with 56% market share. ($14.3 ARPU and 83.1 min MoU in 2007)
10%
35%
11%
30%
Revenue ($b)
Net Income ($b)• 25th position in Businessweek Infotech 100 list.
• First and only Turkish company listed in the New York Stock Exchange
• Mobile Payment
• Mobile Signature
• Mobile Education
• Mobile Health
• Mobile Advertising
•Mobile‐ fixed substitution
•Mobile as only access method in certain areas
INCREASE PENETRATION
MOBILE BROADBAND
PLATFORM DEVELOPMENT
GROWTH DRIVERS
•Turkcell footprint countries • Acquisitions in emerging markets
TOTALCOMM.
PROVIDER
• Fixed + Mobile + Internet
Growth will come from four areasGrowth will come from four areas

73
Increase in mobile penetration in footprint countries will drive revenuesIncrease in mobile penetration in footprint countries will drive revenues
Selected Turkcell footprint countries
A sample list of Western European countries
Delta will create significant revenue
stream
Avg: 69%
Avg:132%
Mobile Broadband Is Gaining MomentumMobile Broadband Is Gaining Momentum
•“47% of all broadband subscribers in Europe will access the Internet through mobile networks by 2013”
Mobile‐fixed broadband substitution
Source: Analysys Mason, October 2008 ; McKinsey

74
Total Communication Solution ProviderTotal Communication Solution Provider
Voice, Data, VASPSTN, Fiber, Cable, ADSL, ...
Voice, Data, VAS
GSM, 3G, HSDPA
Software, Hosted Solut
ions
IP, IMS, Seamless NW
FIXED
IT SERVICES
ServicesServices
ConvergedConvergedPlatformPlatform
Voice, Data, Voice, Data, VASVAS
MOBILE
Mobile Games
Mobile Education
Mobile Healthcare
Mobile Internet Telemetry
Applications
Mobile Banking & Payment
Mobile SignatureMobile
Navigation
Mobile Marketing
Creating New Business PlatformsCreating New Business Platforms

75
Example > Mobile SignatureExample > Mobile Signature
• 50K+ users• 2 mn signatures
• 35 applications
• 50K+ users• 2 mn signatures
• 35 applications
Finance Public Sector Corporate
e‐Commerce
Universal Authentication for Digital Transactions!
Mobile Payment
Transportation
Parking
Digital Goods
Service Delivery
• Launched in July 2008• Started with internet players/parking• Launched in July 2008• Started with internet players/parking
Example > Mobile PaymentExample > Mobile PaymentMicropayments charged to your bill

76
Example > Mobile WalletExample > Mobile Wallet
• NFC transactions are predicted to account for 50 per cent of the global mobile payment market by 2013
• Active role in NFC standards and business models
• Largest NFC pilot in the world with 3K access points
• NFC transactions are predicted to account for 50 per cent of the global mobile payment market by 2013
• Active role in NFC standards and business models
• Largest NFC pilot in the world with 3K access points
Touch & Pay
= + +
Credit Card Security / ID Transportation
+
Simcard based NFC!
Example > Mobile MarketingExample > Mobile Marketing
• “Permission Database”: 7.2 mn subscribers
• 100% yoy revenue growth• Leader in MM via Rich and Innovative Services
• 31 different sectors, 154 brands, 323 mobile marketing projects (H1 08)
• Ad‐funded content through sponsorships
• Launched TonlaKazan, the world’s first mobile RBT advertising platform

77
SummarySummary
OpportunitiesOpportunities ThreatsThreats
• Penetration increase through acquisitions in emerging markets
• Mobile Broadband
• Platform Development to gain market share/loyalty
• Total Communication Solution Provider
• Penetration increase through acquisitions in emerging markets
• Mobile Broadband
• Platform Development to gain market share/loyalty
• Total Communication Solution Provider
• Fast decrease in Voice revenue
• New players in town
• Fast decrease in Voice revenue
• New players in town
Growth For Emerging Markets In Short Term: Strong potential for further penetration.In Long Term: Non‐voice business will gain momentum as in WE.
Growth For Emerging Markets In Short Term: Strong potential for further penetration.In Long Term: Non‐voice business will gain momentum as in WE.
THANK YOU . . .
www.turkcell.com.tr

78
Chair’s Closing Remarks
John Higgins CBE,Director General, Intellect
Networking Drinks Reception