Embed Size (px)
DESCRIPTION
Wireless Broadband Census for better network design. Unwired / vividwireles. I no longer works for vividwireless The views or opinions in this presentation do not reflect those of vividwireless or the Seven Network Group. Contact [email protected]. Background. - PowerPoint PPT Presentation
Citation preview

Wireless Broadband
Census for better network design
Unwired / vividwireles
I no longer works for vividwireless
The views or opinions in this presentation do not reflect those of vividwireless or the Seven Network Group.
Contact [email protected]

Background
Unwired In 2004 the worlds largest dedicated consumer wireless broadband network
Launch Covered the Sydney UCL pop 3.6 million and 1.4 million dwellings.

Background
Technology Uses Cisco/Navini technology to deliver speeds up to 1.5Mbps

2004 Launch TV Ad

Uptake
Very strong initial uptake. Retail stock selling out in the first few weeks.
Group 1 People living in ADSL/Cable black spots
Group 2 People whose lifestyle suited wireless broadband
50,000 customers by the end of 2005
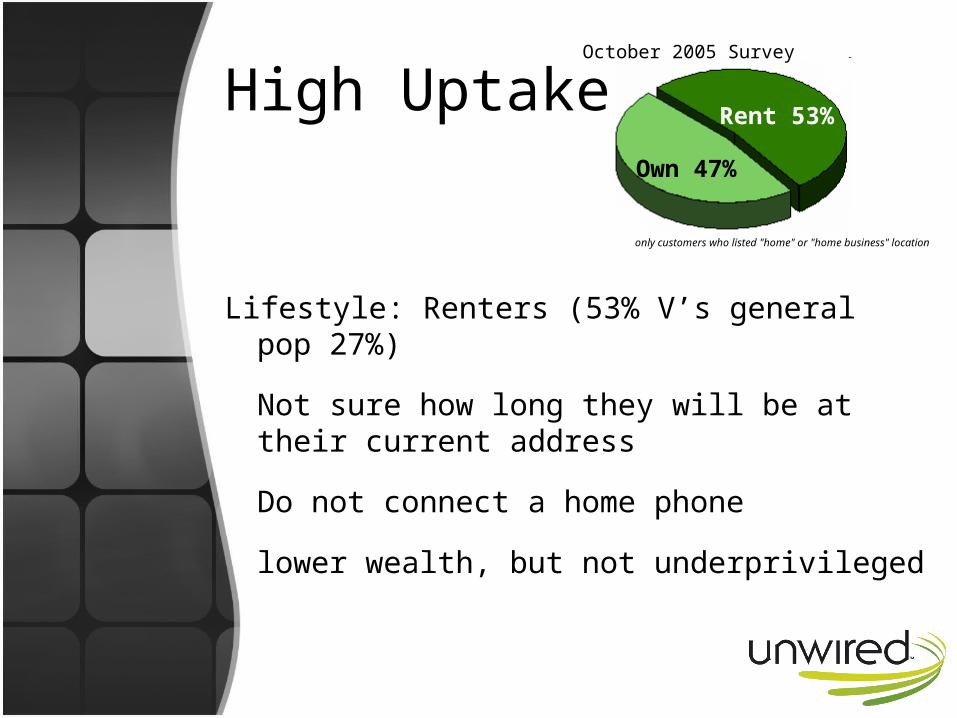
High Uptake
Lifestyle: Renters (53% V’s general pop 27%)
Not sure how long they will be at their current address
Do not connect a home phone
lower wealth, but not underprivileged
Rent 53%
Own 47%
October 2005 Survey
only customers who listed "home" or "home business" location

High UptakeCustomer Surveys:
Which of the following describes your household environment?*
Live in shared household
27%
Live alone18%
Live in family home55%
Age
only customers who listed "home" or "home business" location
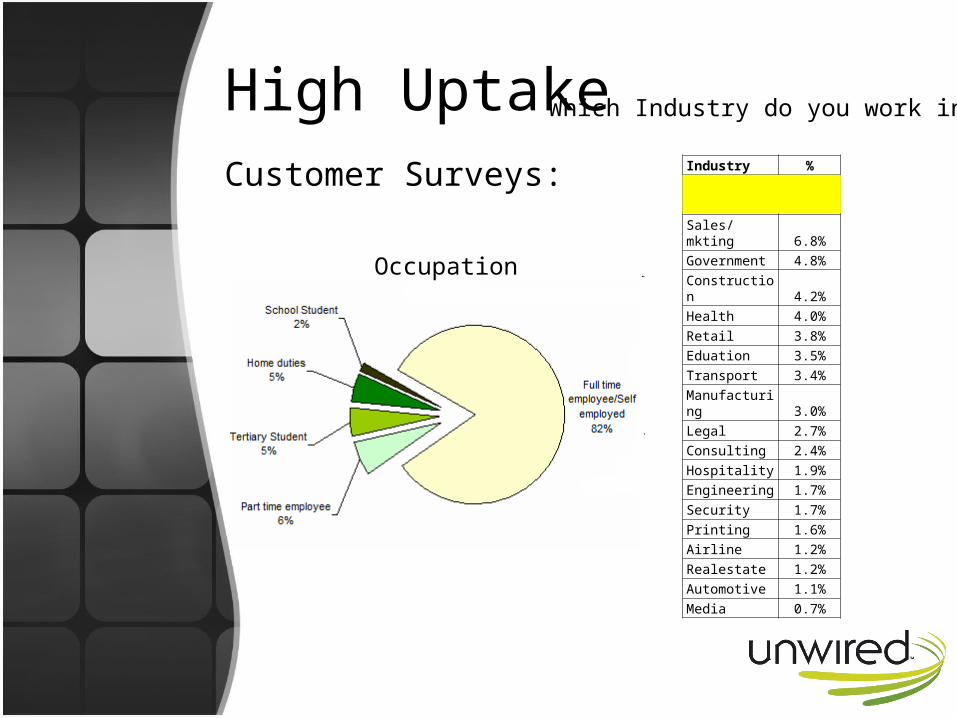
High UptakeCustomer Surveys:
Occupation
Which Industry do you work in?
Industry %IT 30.2%Finance 20.1%Sales/mkting 6.8%Government 4.8%Construction 4.2%Health 4.0%Retail 3.8%Eduation 3.5%Transport 3.4%Manufacturing 3.0%Legal 2.7%Consulting 2.4%Hospitality 1.9%Engineering 1.7%Security 1.7%Printing 1.6%Airline 1.2%Realestate 1.2%Automotive 1.1%Media 0.7%

Customer Map – June 2005Red dots show (can’t get ADSL/Cable)

Customer density with customer points

Customer density

Collection District ScoringCollection District ranking by• The population / area (Density)• The number of dwellings / area (Density)• The proportion of rented dwellings• The proportion of people working in IT• The proportion of people working in Banking/Finance• Income• The proportion of people who had some completed
Tertiary education• Computer ownership *• Had an internet connection *
CD Score
1400204 100%
1401404 98%
1400216 97%
1382814 97%
1410116 97%
1400613 97%
1382003 97%
1382314 97%
1390401 97%
1400915 96%
1251611 96%
1380904 96%
1332903 95%
1400309 95%
1400308 95%
1390507 95%
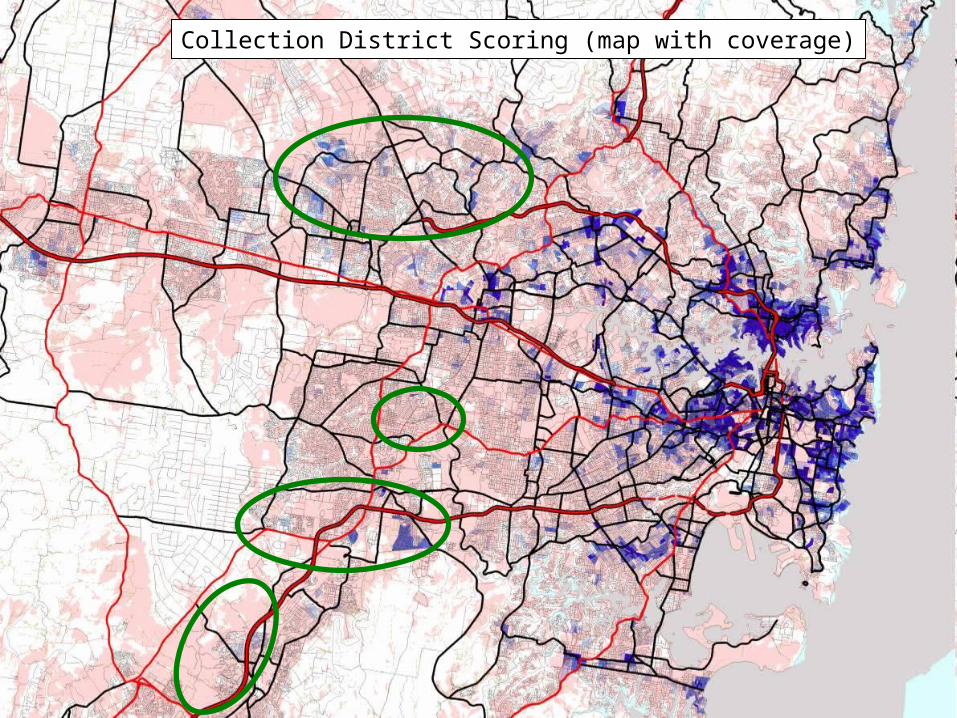
Collection District Scoring (map with coverage)
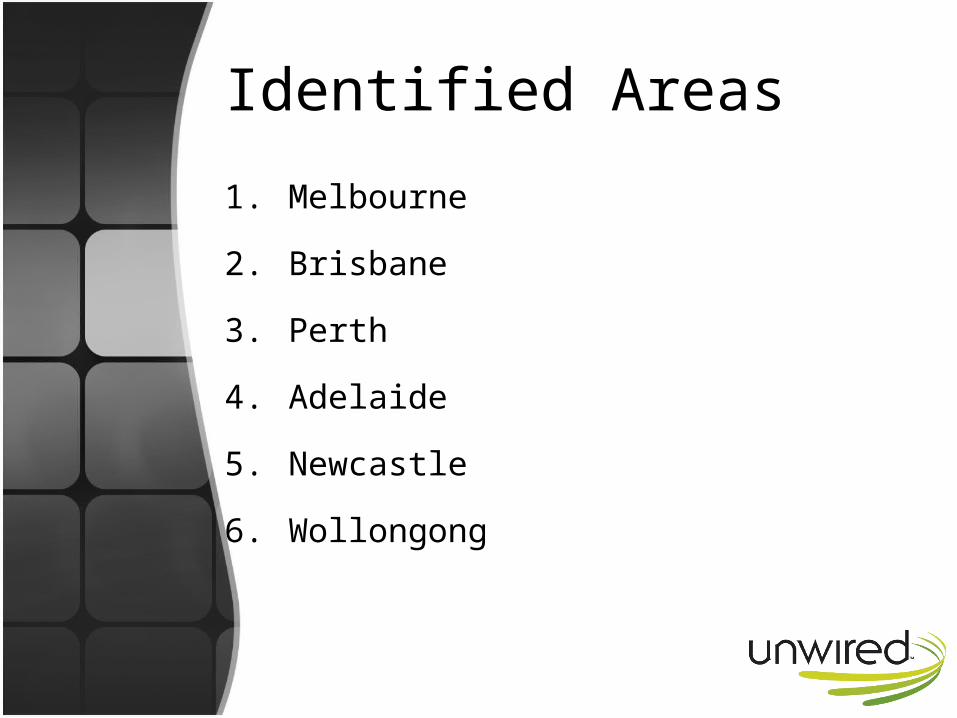
Identified Areas
1. Melbourne
2. Brisbane
3. Perth
4. Adelaide
5. Newcastle
6. Wollongong

BrisbaneHigh ranking Collection Districts (darker = higher ranking)
Brisbane
While Brisbane looked good, it presented a number of challenges
• Hilly terrain
• A good number of high ranking Collection Districts, but they were not concentrated.
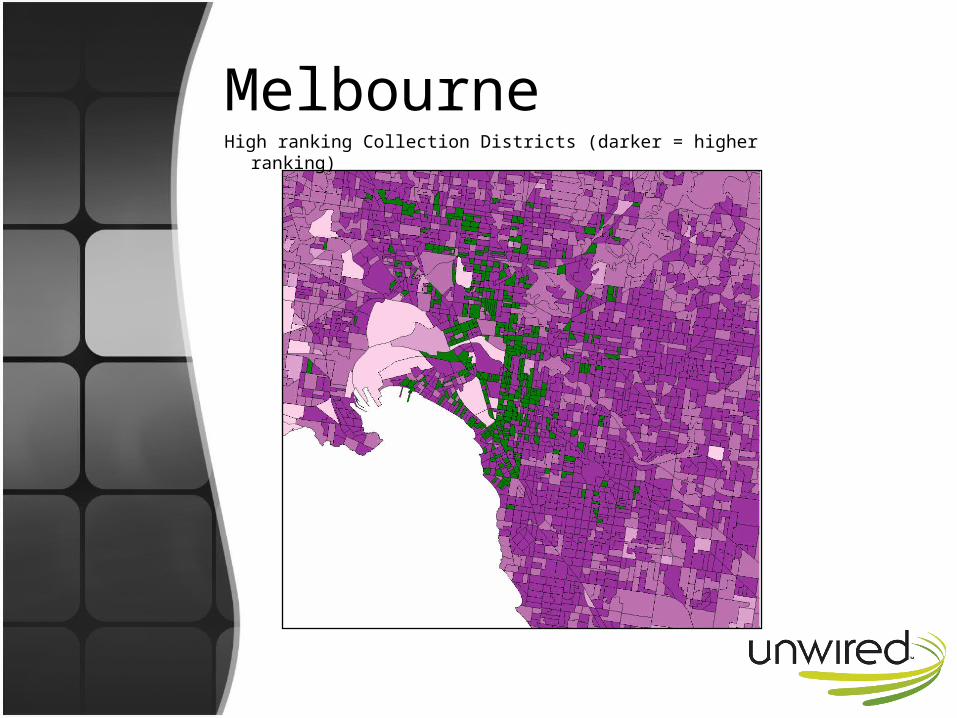
MelbourneHigh ranking Collection Districts (darker = higher ranking)
Melbourne
Selected because of:
• Flat terrain
• A good number of high ranking Collection Districts, concentrated in clusters around
the CBD
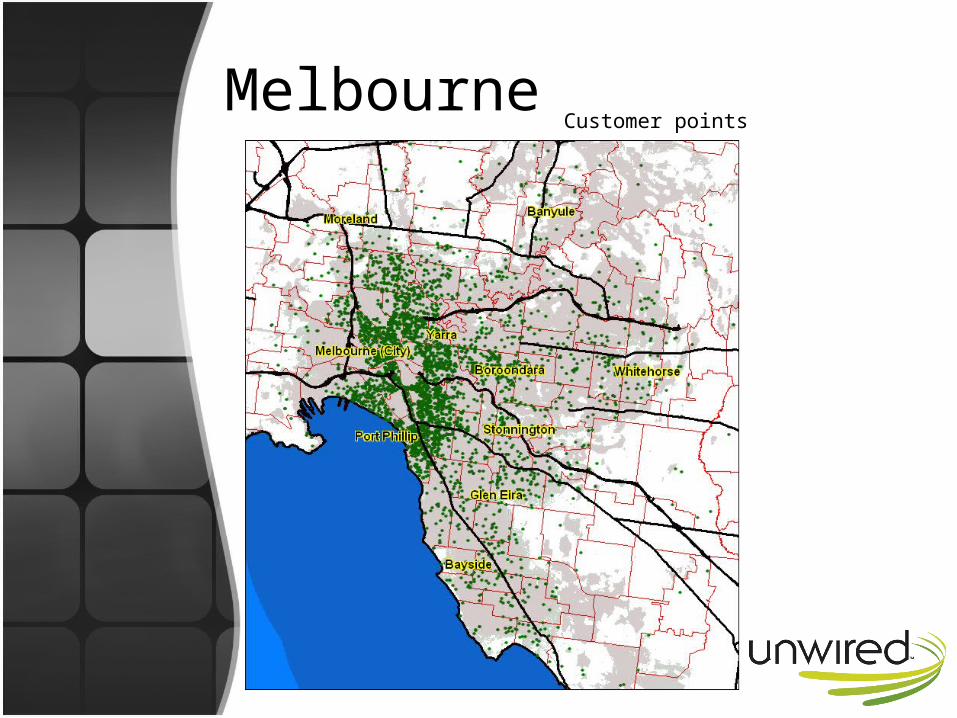
MelbourneCustomer points

Discussion