Embed Size (px)
Citation preview

Clim. Past, 8, 1023–1030, 2012www.clim-past.net/8/1023/2012/doi:10.5194/cp-8-1023-2012© Author(s) 2012. CC Attribution 3.0 License.
Climateof the Past
Winter temperature variations over the middle and lower reachesof the Yangtze River since 1736 AD
Z.-X. Hao1, J.-Y. Zheng1, Q.-S. Ge1, and W.-C. Wang2
1Institute of Geographic Sciences and Natural Resources Research, Chinese Academy of Sciences, Beijing 100101, China2Atmospheric Sciences Research Center, State University of New York at Albany, Albany, New York 12203, USA
Correspondence to:Q.-S. Ge ([email protected])
Received: 16 December 2011 – Published in Clim. Past Discuss.: 4 January 2012Revised: 14 May 2012 – Accepted: 14 May 2012 – Published: 2 June 2012
Abstract. We present statistically reconstructed mean annualwinter (December–February) temperatures from the mid-dle and lower reaches of the Yangtze River (24◦ N–34◦ N,108◦ E–123◦ E within mainland China) extending back to1736. The reconstructions are based on information regard-ing snowfall days from historical documents of the Yu-Xue-Fen-Cun archive recorded during the Qing Dynasty (1644–1911). This information is calibrated with regional wintertemperature series spanning the period from 1951 to 2007.The gap from 1912 to 1950 is filled using early instrumentalobservations. With the reference period of 1951–2007, the18th century was 0.76◦C colder, and the 19th century was1.18◦C colder. However, since the 20th century, the climatehas been in a warming phase, particularly in the last 30 yr,and the mean temperature from 1981 to 2007 was 0.25◦Chigher than that of the reference period of 1951–2007, rep-resenting the highest temperatures of the past 300 yr. Un-certainty existed for the period prior to 1900, and possiblecauses of this uncertainty, such as physical processes in-volved in the interaction between temperature and snowfalldays and changing of observers, are discussed herein.
1 Introduction
Present and future paleoclimate research will focus more onregional climatic and environmental responses to global orhemispheric changes, and increasing spatial coverage of in-dividual datasets will be a major step toward a more appro-priate data basis (PAGES, 2009). The US National ResearchCouncil (2006) called for additional regional precipitationand temperature data to be obtained, which would help to
reduce the uncertainties associated with current reconstruc-tions. Sub-continental seasonal temperature reconstructionis important to detect the influence of climate forcings atregional or local scales (Hegerl et al., 2011).
Temperature reconstruction for Middle and LowerReaches of the Yangtze River (MLRYR, 24◦ N–34◦ N,108◦ E–123◦ E within mainland China) is of great relevancefor at least two reasons. First, winter temperatures in the ML-RYR region are closely correlated with precipitation, but lessvariance in winter temperature is explained by snowfall daysin the most northerly and the most southerly areas of this re-gion (Zhou et al., 1994); second, the greatest variability inthe minimum temperature during the winter occurred in theMLRYR based on the observed data from 1952 to 1995 (Zhaiet al., 1999).
Although multi-proxies, including historical documents,tree-rings, ice cores and sediments, can be used for tem-perature reconstruction, the advantage of documents is thatthey provide high-resolution climate information for East-ern China, while the spatial distribution for most of otherproxies is restricted to Western China (Ge et al., 2010; Shaoet al., 2010). Ge et al. (2003) reconstructed winter half-year temperature series for the MLRYR during the past2000 yr using phenological cold/warm data, although witha rather low time resolution (from 10 to 30 yr). Outsideof China, many great reconstructions extending back 500–1000 yr using historical documents have been developed dur-ing the past few decades. For example, in Japan, summer andwinter temperature variations were reconstructed from sev-eral historical sources, which included cherry-tree floweringdate records, lake freezing date records and weather diaryrecords (Mikami, 2008). The state of the art for historical
Published by Copernicus Publications on behalf of the European Geosciences Union.

1024 Z.-X. Hao et al.: Winter temperature variations over the Yangtze River since 1736 AD
climatology in Europe and the Mediterranean region wascomprehensively reviewed by Brazdil et al. (2005, 2010) andLuterbacher et al. (2006, 2012), and seasonal temperatureswith a high resolution in key climatic periods, i.e., the Me-dieval Warm Anomaly and Little Ice Age, were reconstructedusing information obtained from narrative sources, dairiesand (bio)physical data (dates of river and harbour freezing,cereal and grape harvests), among other sources (e.g., Pfis-ter, 1992; Luterbacher et al., 2004; Xoplaki et al., 2005;Dobrovolny et al., 2010; Leijonhufvud et al., 2010; Moznyet al., 2012).
Here, we present new evidence regarding the number ofsnowfall days obtained from Chinese historical documentsfrom the Yu-Xue-Fen-Cun archive as well as the connectionto seasonal mean winter temperatures (from December tothe next February) and a statistical reconstruction associatedwith the uncertainties in the annual winter temperature dur-ing the past 300 yr over the MLRYR. This study will providea basic dataset for analysing the inter-annual to inter-decadalvariability of temperature changes at the regional scale andevaluate the warming rate since the industrial revolution.
2 Data sources
We choose 24 stations covering Jiangsu, Zhejiang, Anhui,Jiangxi, Hubei and Hunan provinces in the MLRYR region(Fig. 1) for which data are available in both historical and in-strumental periods to reconstruct winter temperature changesduring the past 300 yr. Two types of datasets are used in thisstudy: meteorological observational data and data from Chi-nese historical documents from Eastern China at the Yu-Xue-Fen-Cun archive.
2.1 Meteorological data
China monthly surface climate data from 1951 to 2007 arepublished every year by the Chinese Meteorological Admin-istration (CMA). We extracted daily weather information in-cluding snow, rain or sleet and total precipitation at the 24studied stations (Fig. 1). To obtain the regional winter (De-cember to February) mean temperature over the MLRYR, wedownloaded monthly mean temperature data for 122 stationsfrom the CMA website (http://cdc.cma.gov.cn/) and averagedthem, including data from the above-mentioned 24 stations.The information from the stations from 1996 to 1998 is un-available due to a short observational parameter adjustment.
Meteorological data are available for only a few stationsprior to 1951. To maintain the continuity of the long-term se-ries, we chose five stations, at Shanghai, Wuhan, Hangzhou,Nanjing and Changsha, from long-term instrumental cli-matic datasets published by the Carbon Dioxide Informa-tion Analysis Center, Oak Ridge National Laboratory (avail-able at:http://dss.ucar.edu/datasets/ds578.5/) to reconstructregional temperature change during the period 1906–1950.
24
491
492
493
494
Figure 1 495
496
497
498
499
500
501
502
503
504
505
506
507
508
509
510
511
Fig. 1.Locations of stations (dots) used to reconstruct regional win-ter temperature in this study; the bars indicate the numbers of totalrecords and quantitative records; and the colour of the dots indicatesthe variance in snowfall days explained by the winter temperature.
This dataset was also derived from instrumental measure-ments, and quality assurance checks were performed, includ-ing examining the data for completeness, reasonableness andaccuracy. Based on the description of this dataset, few stationrecords can be considered truly homogeneous. Even the beststations were subjected to minor relocations or changes inobservation times, and many have undoubtedly experiencedlarge increases in urbanization. Fortunately, station historiesare available to assist in proper interpretation of trends orjumps in the data. Thus, relative homogeneity of stationsused was not tested. The five stations present very good spa-tial representativeness for the MLRYR region and capture50–90 % of the variance in the regional winter mean tem-peratures from 1951 to 2007 based on linear regression anal-ysis. However, the measurements at most stations, excludingShanghai, from 1937 to 1945 were missing due to the persis-tent wars. The missing data for each station are filled with theinterpolation values calculated from linear regression modelsshowing the highest correlation coefficients between one sta-tion and its neighbouring station based on observations forthe period 1951–2007.
2.2 Yu-Xue-Fen-Cun archive
The Yu (rainfall)-Xue (snowfall)-Fen (Chinese length unit of0.32 cm, although the scale varied in from the early period ofthe Qing Dynasty to the present)-Cun (3.2 cm) records are akind of memos-to-emperor produced by governmental offi-cers during the Qing Dynasty from 1644 to 1911 recordingrain infiltration depth measurements from the dry-wet soilboundary layer to the ground surface obtained by digginginto the soil with the shovel after rainfall, as well as the snow
Clim. Past, 8, 1023–1030, 2012 www.clim-past.net/8/1023/2012/

Z.-X. Hao et al.: Winter temperature variations over the Yangtze River since 1736 AD 1025
Table 1.Yu-Xue-Fen-Cun information for the MLRYR.
Provinces Periods Years without data
Hubei 1736–1851 1751, 1783, 1788, 1798, 1817, 1819, 1837–1838, 1845
Hunan 1736–1909 1741, 1751, 1778, 1801, 1805, 1808, 1819, 1834, 1837–1838, 1845–1846, 1859, 1863, 1870, 1872–1873, 1881,1883–1884, 1906
Anhui 1736–1852 1751, 1773, 1783, 1801, 1819, 1838, 1845
Jiangxi 1736–1907 1739, 1741, 1751–1752, 1758, 1761, 1771, 1778, 1783,1798, 1801, 1819, 1832–1833, 1837–1838, 1845–1846,1859, 1863, 1870, 1881, 1883
Jiangsu 1736–1846 1751, 1778, 1801, 1819, 1832–1834, 1838, 1845
Zhejiang 1736–1857 1749, 1751, 1778, 1819, 1837–1838, 1844–1845
depth on the surface after snowfall for each precipitationevent, at 273 administrative sites over the whole of China.The Yu-Xue-Fen-Cun archive applied a fixed report format,in which measurements were performed at a fixed site by afixed observer, so it is a systematic and homogeneous archive(Ge et al., 2005). The reliability and accuracy of these histor-ical documents have been discussed in the previous studies(Ge et al., 2005; Wang et al., 2008).
The Yu-Xue-Fen-Cun archive over the MLRYR includesquantitative and qualitative winter weather information(Fig. 1), with the quantitative records occupying over 50 %,approximately 8 pieces of records for each winter in oneprovince. In addition, due to fire, theft and wars, the recordsare missing for several years, representing 8 % of all yearsfrom 1736 to 1852. Only 8 stations in Hunan and Jiangxiprovinces (Nanchang, Jingdezhen, Nancheng and Jian inJiangxi province and Changsha, Changde, Lingling and Zhi-jiang in Hunan province) were involved, for which fineweather archives are available from 1853 to 1905 and 10 %of the total years are missing (see Table 1 for details). Al-though we presented some examples of these historical doc-uments in previous publications (Ge et al., 2005; Wang etal., 2008), two specific records for winter are given hereto show how these data were documented during the QingDynasty. A quantitative example is “Jiangning (today Nan-jing city) received snowfall from YouShi (Chinese ancienttime, 05:00 p.m.–07:00 p.m.) on the 28th day of the twelfthmonth on the third year of the Qianlong Reign to MaoShi(05:00–07:00 a.m.) on the 1st day of the first month on thefourth year of the Qianlong Reign in the lunar calendar(6–8 February 1739 in Gregorian calendar), and the snowdepth on the ground surface reached up to 6-Cun (19.2 cm)”,as reported by Li, Ying who was in charge of silk man-ufacturing in Jiangning city. From this record, informationon the location, date, duration of snowfall and snow depthcan be obtained. Then, we count the number of snow days(3 days in this example) from each record and calculate the
total number for the whole winter. Because different gov-ernmental officers could report the same snowfall informa-tion at the same location, any repeat snow records should bedeleted. An example of a qualitative record is “As reportedby Wang, Youling, General Governor of Zhejiang province,Hangzhou was under sunshine at the beginning of the 11thmonth in the tenth year of the Xianfeng Reign (12–21 De-cember 1860) and received snowfall during the middle andlast ten days of the 11th month (22 December 1860–10 Jan-uary 1861); then, several snow events occurred in the 12thmonth (11 January 1861–9 February 1861)”. These recordsprovide general weather information during the winter andallow cross-checking.
3 Methodology
We first test the relationship between the winter temperatureand the number of snowfall days based on the meteorologi-cal data from the 24 individual stations from 1951 to 2007,then apply a Partial Least Squares (PLS) statistical regressionmodel extending back to 1736 AD.
3.1 Relationship between the winter temperature andsnowfall days at each station
Small snowfall events with total precipitation of less than1 mm, such as those involving very small sleet and granularsnow, can usually be measured with a meteorological instru-ment, but the Yu-Xue-Fen-Cun archive only recorded thoseevents that could be observed visually by people. Thus, be-fore calculating the snowfall days during the observationalperiods, we extract those snowfall events with a total pre-cipitation of greater than 1 mm to maintain the consistencybetween the historical and observational periods. The meanwinter (December–February) temperatures show a signifi-cant (α = 0.01 significance level, sample number≥47, seeTable 2) correlation, ranging from 0.41 to 0.75 with snowfall
www.clim-past.net/8/1023/2012/ Clim. Past, 8, 1023–1030, 2012

1026 Z.-X. Hao et al.: Winter temperature variations over the Yangtze River since 1736 AD
days at each of the 24 stations covering the period from 1951to 2007.
3.2 Regional temperature reconstruction
We first divided the entire time series into three periods onbasis of the available data to reconstruct temperature dur-ing historical times, with the three periods including differentstations, i.e., all 24 stations for the period from 1736–1852, 8stations for the period from 1853–1905, and 5 stations for theperiod from 1906–1950. The observed regional mean win-ter temperature at 122 stations from 1951 to 2007 was usedfor calibration and verification. Snowfall days-winter tem-perature transfer functions for the two periods from 1736–1852 and 1853–1905 were developed using a PLS regres-sion model (Hoskuldsson, 1988; Shen et al., 2006) withMINITAB software. Verification of our reconstruction wasundertaken using the leave-one-out cross-validation method(Michaelsen, 1987). The winter mean temperature time se-ries from 1736 to 1852 and from 1853 to 1905 is, therefore,reconstructed based on the optimal model with the highestpredictedR2 value, and the statistics used in the verificationprocedure are listed in Table 3. The predictors are the num-bers of snowfall days at the 24 stations from 1736 to 1852and at 8 stations from 1853 to 1905, and the predictands arethe mean regional temperature values. The variance in thewinter mean temperature explained by the selected model(component in Table 3) is 67 % for 1736 to 1852 and 54 %for 1853 to 1905.
Observed temperature data from 1906 to 1950 are onlyavailable at Shanghai, Wuhan, Hangzhou, Nanjing andChangsha in the MLRYR region. The transfer function be-tween the winter temperature at an individual station and theregional winter temperature is implemented via the PLS sta-tistical method. The variance in the mean temperature ex-plained by the selected model is 98 %. The full series wasgenerated by combining the reconstructions for the differ-ent periods. Because the reconstruction of regional serieswas produced from different subperiods, the mean value for1853–1905 from 8 stations had to be adjusted to the level ofreconstruction from the 24 stations. For example, we use 8stations and reconstruct the regional temperature for 1853–1905. To combine the different sub-periods, these 8 stationsare also used to reconstruct the temperature for 1736–1852,and we then calculate the mean value of this reconstructionseries. Next, the difference for the period 1736–1852 be-tween the results from the 8 stations and 24 stations is com-pared. If the latter value is higher (lower) than the former,then we subtract (add) the value of this difference from (to)our reconstruction during the period 1853–1905.
4 Results
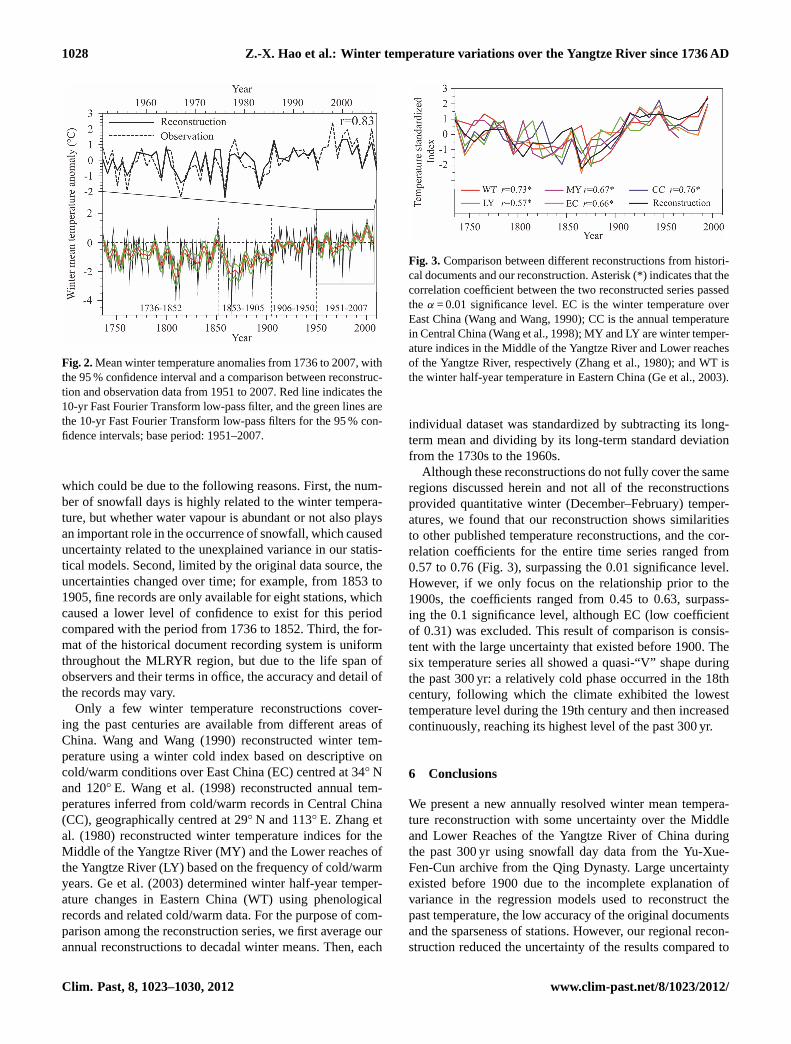
Figure 2 shows the reconstructed mean winter tempera-ture anomaly and its 95 % confidence interval for the past300 yr with an annual resolution as well as a comparisonbetween the reconstructed and observed winter temperaturesfor 1951–2007. It is worth noting that the mean temperatureof the reference period from 1951 to 2007 is 5.25◦C aver-aged over 122 stations in the MLRYR. The characteristicsof the mean winter temperature changes over the past 300 yrcan be highlighted as follows. In the 18th century, the cli-mate is relatively cold, with a mean temperature of−0.76◦C,and no obvious trend existed. In the 19th century, the cli-mate experienced a cooling period, with a mean temperatureof −1.18◦C, including the two coldest winters of the past300 yr, in 1865/1866 and 1809/1810, which were 4.3◦C and3.4◦C colder than the mean temperature for 1951–2007, re-spectively. Since the 20th century, the climate has entered awarming period. During the last three decades, the tempera-ture increased dramatically and the mean temperature from1981 to 2007 was 0.25◦C higher than that of 1951–2007,which reached the highest level of the past 300 yr. Consider-ing the whole time series, the temperature difference betweenthe mildest (2000/2001) and coldest (1865/1866) winter is5.6◦C. On a decadal time scale, the coldest decade was the1860s and the warmest decade was experienced from 1991 to2000. The temperature difference between the warmest andcoldest decade is 4.6◦C.
Moreover, we analysed the changing trend at 30-yr andcentennial time scales to determine how rapidly climatewarming/cooling occurred during the past 300 yr. On a 30-yr time scale, the greatest warming was experienced over theperiod 1886–1915, with a rate of 0.59◦C/10 yr. The strongestcooling trend was detected between 1843 and 1872, with arate of 0.88◦C/10 yr. At a centennial time scale, one rapidcooling trend of−0.7◦C/100 yr occurred from 1736 to 1835,and the strongest warming trend, with a rate of 1.9◦C/100 yr,was observed from 1862 to 1961. The warming rate duringthe 20th century, from 1901 to 2000, was 0.66◦C/100 yr. Be-cause the 100 yr from 1862 to 1961 covered three temper-ature change patterns, i.e., coldest decade (in the Little IceAge) – period of increasing temperatures – warming stage,the trend from a cold spell to a warm peak is steeper thanthat of the 20th century.
5 Discussion
Rather than using a single station to reconstruct regional tem-perature changes, our series employed weather informationfrom multiple stations to reconstruct the mean winter tem-perature over the MLRYR, explaining 54–98 % of instru-mental variance from 1951 to 2007, which reduced the un-certainty of the reconstruction results. However, large uncer-tainties still existed in our reconstruction from 1736 to 1905,
Clim. Past, 8, 1023–1030, 2012 www.clim-past.net/8/1023/2012/

Z.-X. Hao et al.: Winter temperature variations over the Yangtze River since 1736 AD 1027
Table 2.Linear regression relationship between winter temperature changes and snowfall days for 24 stations from 1951 to 2007.
Provinces Stations Location (◦ N, ◦ E) k b0 p R2 N Period
Shanghai 31.17, 121.43 −0.21 5.88 0.0004 0.21 54 1951–2007
JiangsuDongtai 32.87, 120.32 −0.13 3.56 0.0025 0.17 52 1953–2007Nanjing 32.00, 118.80 −0.11 4.27 0.0016 0.18 54 1951–2007
Zhejiang
Hangzhou 30.23, 120.17 −0.16 6.34 <0.0001 0.37 54 1951–2007Dinghai 30.03, 122.10 −0.19 7.43 <0.0001 0.28 50 1955–2007Quzhou 28.97, 118.87 −0.18 7.41 <0.0001 0.49 54 1951–2007Wenzhou 28.03, 120.65 −0.30 9.52 <0.0001 0.43 47 1951–2007
Anhui
Anqing 30.53, 117.05 −0.21 6.31 <0.0001 0.45 54 1951–2007Hefei 31.87, 117.23 −0.19 5.07 <0.0001 0.39 53 1952–2007Huoshan 31.40, 116.32 −0.15 4.84 <0.0001 0.38 51 1954–2007Bangbu 32.95, 117.38 −0.17 3.93 0.001 0.19 54 1951–2007Bozhou 33.87, 115.77 −0.11 2.59 0.0095 0.13 52 1953–2007
Jiangxi
Nanchang 28.60, 115.92 −0.25 7.54 <0.0001 0.56 54 1951–2007Jingdezhen 29.30, 117.20 −0.20 7.16 <0.0001 0.35 53 1952–2007Nancheng 27.58, 116.65 −0.20 7.77 <0.0001 0.26 53 1952–2007Jian 27.12, 114.97 −0.18 8.16 0.0002 0.24 53 1951–2007
Hubei
Wuhan 30.62, 114.13 −0.17 5.87 <0.0001 0.26 54 1951–2007Yichang 30.70, 111.30 −0.19 7.04 <0.0001 0.40 54 1951–2007Enshi 30.27, 109.47 −0.18 6.74 <0.0001 0.40 53 1951–2007Laohekou 32.23, 111.40 −0.13 4.77 0.0002 0.24 54 1951–2007
Hunan
Changsha 28.20, 113.08 −0.18 7.16 <0.0001 0.44 54 1951–2007Changde 29.05, 111.68 −0.21 7.45 <0.0001 0.55 54 1951–2007Lingling 26.23, 111.62 −0.21 8.01 <0.0001 0.35 54 1951–2007Zhijiang 27.45, 109.68 −0.18 6.96 <0.0001 0.35 54 1951–2007
Note: assuming the linear regressiony = kx+ b0, predictor (x) is snowfall days during winter (December to next February), and thedependent variable (y) is temperature in this period; all equations passed the 99 % confidence level;R2 is explained variance, measuringthe proportion of variation accounted for by a mathematical model; andN is the sample number.
Table 3. The selected PLS regression models for the winter temperatures between regions and individual stations and verifications for1736–1852, 1853–1905 and 1906–1950 based on the leave-one-out cross-validation method.
Component Variance SE R2 PRESS PredictedR2
1736–1852
1 0.51 20.68 0.60 23.20 0.54722* 0.67 17.00 0.67 21.85 0.57353 13.68 0.73 22.40 0.56284 10.89 0.79 25.40 0.50425 9.51 0.81 25.07 0.5107
1853–1905
1 0.65 27.36 0.47 30.51 0.40452* 0.77 23.75 0.54 30.08 0.41283 23.57 0.54 31.27 0.38974 23.57 0.54 31.40 0.38715 23.57 0.54 31.48 0.3856
1906–1950
1 0.88 1.80 0.97 1.91 0.96752 0.96 1.55 0.97 1.73 0.97063* 0.99 1.39 0.98 1.69 0.97134 1.38 0.98 1.79 0.96965 1.37 0.98 1.79 0.9695
* The selected model (component) used to reconstruct temperatures; SE indicates standard error; PRESSindicates prediction sum of squares.
www.clim-past.net/8/1023/2012/ Clim. Past, 8, 1023–1030, 2012
1028 Z.-X. Hao et al.: Winter temperature variations over the Yangtze River since 1736 AD
25
512
513
514
Figure 2 515
516
517
518
519
520
521
522
523
524
525
526
527
528
529
530
531
532
533
534
535
536
537
538
539
Fig. 2.Mean winter temperature anomalies from 1736 to 2007, withthe 95 % confidence interval and a comparison between reconstruc-tion and observation data from 1951 to 2007. Red line indicates the10-yr Fast Fourier Transform low-pass filter, and the green lines arethe 10-yr Fast Fourier Transform low-pass filters for the 95 % con-fidence intervals; base period: 1951–2007.
which could be due to the following reasons. First, the num-ber of snowfall days is highly related to the winter tempera-ture, but whether water vapour is abundant or not also playsan important role in the occurrence of snowfall, which causeduncertainty related to the unexplained variance in our statis-tical models. Second, limited by the original data source, theuncertainties changed over time; for example, from 1853 to1905, fine records are only available for eight stations, whichcaused a lower level of confidence to exist for this periodcompared with the period from 1736 to 1852. Third, the for-mat of the historical document recording system is uniformthroughout the MLRYR region, but due to the life span ofobservers and their terms in office, the accuracy and detail ofthe records may vary.
Only a few winter temperature reconstructions cover-ing the past centuries are available from different areas ofChina. Wang and Wang (1990) reconstructed winter tem-perature using a winter cold index based on descriptive oncold/warm conditions over East China (EC) centred at 34◦ Nand 120◦ E. Wang et al. (1998) reconstructed annual tem-peratures inferred from cold/warm records in Central China(CC), geographically centred at 29◦ N and 113◦ E. Zhang etal. (1980) reconstructed winter temperature indices for theMiddle of the Yangtze River (MY) and the Lower reaches ofthe Yangtze River (LY) based on the frequency of cold/warmyears. Ge et al. (2003) determined winter half-year temper-ature changes in Eastern China (WT) using phenologicalrecords and related cold/warm data. For the purpose of com-parison among the reconstruction series, we first average ourannual reconstructions to decadal winter means. Then, each
26
540
541
542
Figure 3 543
544
545
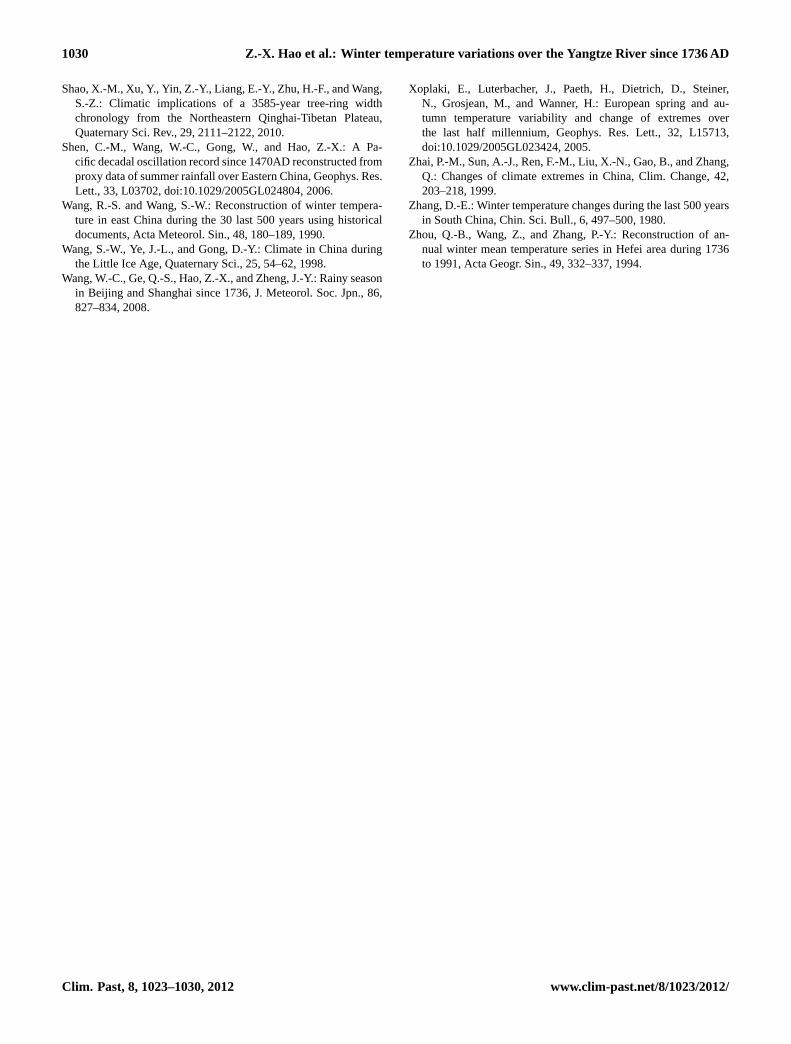
Fig. 3. Comparison between different reconstructions from histori-cal documents and our reconstruction. Asterisk (*) indicates that thecorrelation coefficient between the two reconstructed series passedthe α = 0.01 significance level. EC is the winter temperature overEast China (Wang and Wang, 1990); CC is the annual temperaturein Central China (Wang et al., 1998); MY and LY are winter temper-ature indices in the Middle of the Yangtze River and Lower reachesof the Yangtze River, respectively (Zhang et al., 1980); and WT isthe winter half-year temperature in Eastern China (Ge et al., 2003).
individual dataset was standardized by subtracting its long-term mean and dividing by its long-term standard deviationfrom the 1730s to the 1960s.
Although these reconstructions do not fully cover the sameregions discussed herein and not all of the reconstructionsprovided quantitative winter (December–February) temper-atures, we found that our reconstruction shows similaritiesto other published temperature reconstructions, and the cor-relation coefficients for the entire time series ranged from0.57 to 0.76 (Fig. 3), surpassing the 0.01 significance level.However, if we only focus on the relationship prior to the1900s, the coefficients ranged from 0.45 to 0.63, surpass-ing the 0.1 significance level, although EC (low coefficientof 0.31) was excluded. This result of comparison is consis-tent with the large uncertainty that existed before 1900. Thesix temperature series all showed a quasi-“V” shape duringthe past 300 yr: a relatively cold phase occurred in the 18thcentury, following which the climate exhibited the lowesttemperature level during the 19th century and then increasedcontinuously, reaching its highest level of the past 300 yr.
6 Conclusions
We present a new annually resolved winter mean tempera-ture reconstruction with some uncertainty over the Middleand Lower Reaches of the Yangtze River of China duringthe past 300 yr using snowfall day data from the Yu-Xue-Fen-Cun archive from the Qing Dynasty. Large uncertaintyexisted before 1900 due to the incomplete explanation ofvariance in the regression models used to reconstruct thepast temperature, the low accuracy of the original documentsand the sparseness of stations. However, our regional recon-struction reduced the uncertainty of the results compared to
Clim. Past, 8, 1023–1030, 2012 www.clim-past.net/8/1023/2012/

Z.-X. Hao et al.: Winter temperature variations over the Yangtze River since 1736 AD 1029
using a single station. The overall pattern of winter temper-ature variations during the past 300 yr is shown here. Theclimate in the 18th century was in a relatively cold phase,with a −0.76◦C mean temperature anomaly observed (forthe reference period of 1951–2007). Then, in the 19th cen-tury, the climate enters the coldest period since 1736, show-ing a−1.18◦C mean temperature anomaly, and this centuryhas been recognised by most reconstructions performed forthe Northern hemisphere and China as one of the coldest(Jansen et al., 2007; Ge et al., 2010). Since the 20th cen-tury, the climate has entered a warming period. In particular,the mean temperature from 1981 to 2007 was 0.25◦C higherthan that of 1951–2007, which reached the highest level ofthe past 300 yr. The warming rate during the 20th centuryfrom 1901 to 2000 was 0.66◦C/100 yr, which is lower thanthat from 1862 to 1961, when the rate was 1.89◦C/100 yr.This reconstruction on a decadal time scale is highly consis-tent with other long-term proxy temperature series derivedfrom Chinese historical documents (Zhang, 1980; Wang andWang, 1990; Wang et al., 1998; Ge et al., 2003). All of thecurves indicate a warmer period beginning in the 20th cen-tury and a colder period during the 19th century, which in-dicates that the historical documents can capture informationregarding decadal temperature variations well.
Acknowledgements.We would like to thank Juerg Luterbacher andthree reviewers for constructive comments and kind suggestions.This research was supported by grants (to IGSNRR) from theMinistry of Science and Technology of the people’s republicof China (2010CB950100), the Chinese Academy of Sciences(XDA05080100) and the National Natural Science Foundation ofChina (41071029).
Edited by: J. Luterbacher
References
Brazdil, R., Pfister, C., Wanner, H., Von Storch, H., and Luter-bacher, J.: Historical climatology in Europe – the state of the art,Clim. Change, 70, 363–430, 2005.
Brazdil, R., Dobrovolny, P., Luterbacher, J., Moberg, A., Pfister, C.,Wheeler, D., and Zorita, E.: European climate of the past 500years: new challenges for historical climatology, Clim. Change,101, 7–40, 2010.
Dobrovolny, P., Moberg, A., Brazdil, R., Pfister, C., Glaser, R., Wil-son, R., van Engelen, A., Limanowka, D., Kiss, A., Halıekova,M., Mackova, J., Riemann, D., Luterbacher, J., and Bohm, R.:Monthly and seasonal temperature reconstructions for CentralEurope derived from documentary evidence and instrumentalrecords since AD 1500, Clim. Change, 101, 69–107, 2010.
Ge, Q.-S., Zheng, J.-Y., Fang, X.-Q., Man, Z.-M., Zhang, X.-Q.,Zhang, P.-Y., and Wang, W.-C.: Winter half-year temperature re-construction for the middle and lower reaches of the Yellow Riverand Yangtze River, China, during the past 2000 years, Holocene,13, 933–940, 2003.
Ge, Q.-S., Zheng, J.-Y., Hao, Z.-X., Zhang, P.-Y., and Wang, W.-C.: Reconstruction of historical climate in China: high-resolutionprecipitation data from Qing dynasty archives, B. Am. Meteorol.Soc., 86, 671–679, 2005.
Ge, Q.-S., Zheng, J.-Y., Hao, Z.-X., Shao, X.-M., Wang, W.-C., and Luterbacher, J.: Temperature variation through 2000years in China: An uncertainty analysis of reconstructionand regional difference, Geophys. Res. Lett, 37, L03703,doi:10.1029/2009GL041281, 2010.
Hegerl, G., Luterbacher, J., Gonzalez-Rouco, F. J., Tett, S., Crowley,T., and Xoplaki, E.: Influence of human and natural forcing onEuropean seasonal temperatures, Nat. Geosci., 4, 99–103, 2011.
Hoskuldsson, A.: PLS regression methods, J. Chemometr., 2, 211–228, 1988.
Jansen, E., Overpeck, J., Briffa, K. R., Duplessy, J.-C., Joos, F.,Masson-Delmotte, V., Olago, D., Otto-Bliesner, B., Peltier, W.R., Rahmstorf, S., Ramesh, R., Raynaud, D., Rind, D., Solom-ina, O., Villalba, R., and Zhang, D.: Palaeoclimate, in: Cli-mate Change 2007: The Physical Science Basis. Contributionof Working Group I to the Fourth Assessment Report of the In-tergovernmental Panel on Climate Change, edited by: Solomon,S., Qin, D., Manning, M., Chen, Z., Marquis, M., Averyt, K. B.,Tignor, M., and Miller, H. L., Cambridge University Press, Cam-bridge, United Kingdom and New York, NY, USA, 2007.
Leijonhufvud, L., Wilson, R., Moberg, A., Soderberg, J., Retso,D., and Soderlind, U.: Five centuries of Stockholm winter/springtemperatures reconstructed from documentary evidence and in-strumental observations, Clim. Change, 101, 109–141, 2010.
Luterbacher, J., Dietrich, D., Xoplaki, E., Grosjean, M., and Wan-ner, H.: European seasonal and annual temperature variability,trends and extremes since 1500, Science, 303, 1499–1503, 2004.
Luterbacher, J., Xoplaki, E., Casty, C., and 46 coauthors: Mediter-ranean climate variability over the last centuries: a review, in: TheMediterranean Climate: an overview of the main characteristicsand issues, edited by: Lionello, P., Malanotte-Rizzoli, P., and R.Boscolo, Elsevier, Amsterdam, 27–148, 2006.
Luterbacher, J., Garcıa-Herrera, R., Allan, A. R., and 42 coauthors:A review of 2000 years of paleoclimatic evidence in the Mediter-ranean, in: The Climate of the Mediterranean region: from thepast to the future, edited by: Lionello, P., Elsevier, Amsterdam,The Netherlands, 87–185, 2012.
Michaelsen, J.: Cross-validation in statistical climate forecast mod-els, J. Clim. Appl. Meteorol., 26, 1589–1600, 1987.
Mikami, T.: Climatic variations in Japan reconstructed from histor-ical documents, Weather, 63, 190–193, 2008.
Mozny, M., Brazdil R., Dobrovolny, P., and Trnka, M.: Cerealharvest dates in the Czech Republic between 1501 and 2008as a proxy for March–June temperature reconstruction, Clim.Change, 110, 801–821, 2012.
National Research Council: Surface Temperature Reconstructionsfor the Last 2000 Years, The National Academies Press, Wash-ington, DC, 141 pp., 2006.
PAGES: Science Plan and Implementation Strategy, IGBP ReportNo. 57, IGBP Secretariat, Stockholm, 67 pp., 2009.
Pfister, C.: Monthly temperature and precipitation in central Europe1529–1979: quantifying documentary evidence on weather andits effects, in: Climate since A.D. 1500, edited by: Bradley, R. S.and Jones, P. D., Routledge, New York, 118–142, 1992.
www.clim-past.net/8/1023/2012/ Clim. Past, 8, 1023–1030, 2012
1030 Z.-X. Hao et al.: Winter temperature variations over the Yangtze River since 1736 AD
Shao, X.-M., Xu, Y., Yin, Z.-Y., Liang, E.-Y., Zhu, H.-F., and Wang,S.-Z.: Climatic implications of a 3585-year tree-ring widthchronology from the Northeastern Qinghai-Tibetan Plateau,Quaternary Sci. Rev., 29, 2111–2122, 2010.
Shen, C.-M., Wang, W.-C., Gong, W., and Hao, Z.-X.: A Pa-cific decadal oscillation record since 1470AD reconstructed fromproxy data of summer rainfall over Eastern China, Geophys. Res.Lett., 33, L03702,doi:10.1029/2005GL024804, 2006.
Wang, R.-S. and Wang, S.-W.: Reconstruction of winter tempera-ture in east China during the 30 last 500 years using historicaldocuments, Acta Meteorol. Sin., 48, 180–189, 1990.
Wang, S.-W., Ye, J.-L., and Gong, D.-Y.: Climate in China duringthe Little Ice Age, Quaternary Sci., 25, 54–62, 1998.
Wang, W.-C., Ge, Q.-S., Hao, Z.-X., and Zheng, J.-Y.: Rainy seasonin Beijing and Shanghai since 1736, J. Meteorol. Soc. Jpn., 86,827–834, 2008.
Xoplaki, E., Luterbacher, J., Paeth, H., Dietrich, D., Steiner,N., Grosjean, M., and Wanner, H.: European spring and au-tumn temperature variability and change of extremes overthe last half millennium, Geophys. Res. Lett., 32, L15713,doi:10.1029/2005GL023424, 2005.
Zhai, P.-M., Sun, A.-J., Ren, F.-M., Liu, X.-N., Gao, B., and Zhang,Q.: Changes of climate extremes in China, Clim. Change, 42,203–218, 1999.
Zhang, D.-E.: Winter temperature changes during the last 500 yearsin South China, Chin. Sci. Bull., 6, 497–500, 1980.
Zhou, Q.-B., Wang, Z., and Zhang, P.-Y.: Reconstruction of an-nual winter mean temperature series in Hefei area during 1736to 1991, Acta Geogr. Sin., 49, 332–337, 1994.
Clim. Past, 8, 1023–1030, 2012 www.clim-past.net/8/1023/2012/


