Embed Size (px)
Citation preview

WINTER RANGE FOOD HABITS OF THE NORTH KINGS DEER HERD
Charles J. Evans, Robert D. Haines and David L. Chesemore California State University Fresno, California
Abstract. Tractable deer were used to determine food preferences of mule deer on the winter range of the North Kings deer herd from December 1974 through April 1975. The site used for winter range food preference sampling was located in Haslett Basin, Sierra National Forest. During the study, 33,268 bites were recorded in 10,286 minutes of observation. In the feeding trials, 122 food items, including 117 species of vascular plants were utilized by the tractable deer. Food preferences of the deer varied considerably throughout the season. Browse was the dominant forage choice of the tractable deer in early winter, decreasing in use as grasses and forbs became abundant in late winter. Browse again became the most important component of the diet in late spring when its new growth emerged. Oaks (Quercus Wislizennii and Q. Douglasii) and Mariposa manzanita (Arctostaphylos mariposa) were the most important browse species used by tractable deer. Rusty popcorn flower (Plagiobothr~s nothofulvus) and filarees (Erodium spp.) were the most important forbs ~n the trac~able deer diet while annual bromes (Bromus spp.), creeping spike rush (Helocharis palustris) and sedge (Carex breviligulata) were important grasses and sedges used for food. No significant difference in forage choices between morning and evening sample periods or between sexes was found. Selectivity indices were calculated for important species in the diet. About 75 percent of the important plant species were eaten in proportion greater than their relative abundance. The use of tractable deer appears feasible as a field technique if investigators desire to determine exactly what foods are used or acceptable to deer.
INTRODUCTION
The North Kings deer herd is an important economic, recreational and ecological resource of Fresno county (Fig. 1). This herd of mule deer (Odocoileus hemionus californicus) numbered about 17,000 in 1950 but has declined steadily since then and now numbers about 3,500 animals (Longhurst et al. 1952, Salwasser 1974). Nutritional deficiencies have been suggested as possibly causing the decline of this deer population but insufficient
CAL-NEVA WILDLIFE TRANSACTIONS 1976
2 5

Km ,.--, 1 5
I /
\
\,
l{ings
0 Su.......,.l'en
* Hoslell 8o1in
Courtright Reservoir
Wi•hon Re,•rvoir
\ \ \
'-.
\ -"-} ' l 0 North Kin;•
\ Deer Herd Range \
\ \
\
CROWN UNIT
r·-·-·-... ____ .,.,....1·
,l I
Fig. 1. Location of the range of the North Kings deer herd.
Fig. 2. Location of the winter range study area in Haslett Basin, Sierra National Forest.
2 6 .. ,_

information on the diet of deer within this herd has prevented determination of the validity of this hypothesis.
Previous work on the North Kings winter range provided gener~l information on deer reproductive rates, physical condition and a general overview of diet (Salwasswer 1974, Holl 1975). The diet of deer on the winter range is often composed of high proportions of grasses and forbs. Rumen analysis techniques utilized in previous studies were not always able to identify the herbaceous food items to species. Also, little information was available to relate deer food preferences to forage availaaility. The objectives of this study were to determine the food preferences of mule deer on their winter range and relate these preferences to forage availability.
The Range-Wildlife Research Project of the Pacific Southwest Forest and Range Experiment Station, u. s. Forest Service, located in Fresno, provided financial support for this research through PSW Grant No. 17. California State University, Fresno provided pens, laboratory space and financial assistance for the project.
METHODS
Tractable deer were used to determine food preferences on the winter range of the North Kings deer herd. The deer, obtained as fawns, were raised and trained according to procedures described by Reichert (1972) and Evans et al. (1975). They were reared on the summer range of the North Kings her~in a mixed conifer forest at an elevation of about 2,050 m (Fig. 1).
The use of free-ranging tractable deer to determine forage preference is not a novel idea. It has been used successfully with white-tails (Odocoileus virginianus) in Pennsylvania (Watts 1964, Healy 1967, 1971) and Texas (McMahan 1964); and with mule deer in Colorado (Wallmo et al. 1972) and Arizona (Neff 1974). - -
The sample site used for winter range food preference sampling was located in Haslett Basin, Sierra National Forest. The vegetation on the site was heterogeneous and consisted of an interspersion of grassland, open to dense brush, open woodland composed of digger pine (Pinus sabiniana) and blue oak and scattered seepages (Fig. 2). Topography of the site ranged from almost flat to 30 degree slopes. El.evation of the site varied from 732 to 884 m above sea level. ·
The tractable deer were transported to the sample site .in pairs in an enclosed pickup truck. The deer were released from the truck and allowed to wander at will within the sample area. Feeding trials began in the morning between 0600 and 0800; evening trials began between 1500 and 1600. All trials lasted until the animala ceased feeding. Attempts were made to work all animals an equal number of times. Between trials the animals were kept in a pen near the winter site or in pens on the California State University, Fresno campus and were maintained on a high protein pelleted ration, alfalfa hay and water. Reichert (personal communication) stated that his tractab~e deer fed most avidly when the pelleted ration was fed without limitation.
Bite data, phenological information and weather conditions were recorded with battery operated, hand held, cassette tape recorders. At the beginning of each feeding trial, the observer recorded the date, weather conditions and starting time. At the end of the trial, ending time and weather conditions again were noted.
A bite, the unit of measurement used to quantify food preference, was defined as each discrete removal of part of a plant or, in some cases, removal of the whole plant from the ground (Wallmo et al. 1972). Percent
CAL-NEVA WILDLIFE TRANSACTIONS 1976
2 7

of diet was calculated for each food item by dividing the number of bites for each item by the total. number of bites recorded. Diet composition was calculated for each sampling period, males, females, morning and evening. Spearman's rho, a non-parametric correlation coefficient, ·was used to test for correlat1on between diet preferences of different sexes and evening and morning feeding trials (Sakal and Rholf 1969, Conover 19711. Differences were tested at the .05 significance level. Availability of woody vegetation up to 1.4 m in height was measured by the line intercept method (Canfield 1941, Mueller-Dombois and Ellenberg 1974). Herbaceous vegetation and fallen leaves of browse species were measured by the inclined point frame method (Levy and Madden 1933, Grieg-Smith 1964) with modification similar to those described by Neal et al. (1969). Scientific names of plants follow Lonard and Gould (1974) and Munz (1959, 1968). Plant phenology was recorded on the sample site each time feeding trials were conducted.
Selectivity indices were calculated for species in the diet. Selectivity index = percent in diet/relative abundance. A selectivity index of 1. 0 indicates that a particular species was eaten in proportion equal to its abundance, a value greater than 1.0 indicates the species was eaten in greater proportion than its abundance. A value less than 1.0 indicates that the plant was being eaten less than its relative abundance in the plant community. Other workers also were assigned preference ratings to forage species. Watts (1964) used: preference = feeding minutes/availability and Neff (1974) used: preference = bites x weight per bite/availability.
RESULTS AND DISCUSSION
Between 27 December 1974 and 28 April 1975, 33,268 bites were recorded in 10,286 minutes of observation time. A total of 122 food items including 117 species of vascular plants were utilized by the tractable deer during these feeding trials. Calculations involving availability of vegetation were based on 223 point frames and 1,372 m of line intercept. Summation and interpretation of bite and vegetation data was divided into three discrete time periods based on plant phenology ·and shifts in the diet preferences of the tractable deer. These three periods were: early winter, 27 December to 31 January; late winter, 14 February to 17 March; and spring, 24 March to 28 April.
All species composing more than 1.0 percent of the bites in the diet were used to calculate Spearman's rho values as described by Conover (1971). These tests showed significant correlations of forage choices between the sexes and times of day with the exception of the male and female comparison in early winter. Difference in diet selection between the sexes may be a result of exploratory behavior of the deer in a new vegetation type. Present findings compare with those of Wallmo et al. (1972) in that diet preferences between sexes were not significant-.- Based on these correlation values, the bite data were pooled for feeding times and for sexes.
Seasonal Forage Selection
Early Winter. Browse use was high, comprising almost 90 percent of the diet, at the beginning of this period but declined rapidly to about 30 percent of the diet at the end of the period (Figs. 3 and 4) • Grasses, sedges and forbs were a small portion of the diet at first but steadily increased in importance with time. Only four species of browse composed more than 1. 0 percent of the diet during this period (Table 1). Of these four, interior live oak (Quercus wislizenii) green and dry leaves and blue oak twigs and dry leaves made up just over 50 percent of the diet. Redberry (Rhamnus crocea) made up 3.2 percent of the diet of browse while Mariposa manzanita made up another 1.1 percent of the diet.
CAL-NEVA WILDLIFE TRANSACTIONS 1976
2 8 ......

Important forbs were rusty popcorn flower making up 6.1 percent of the diet, and red-stemmed filaree (Erodium cicutarium), 3.6 percent of the diet (Fig. 4). Annual bromes 7.1 percent, sedge, 6.2 percent, and creeping spike rush, 5.9 percent, were important grasses and sedges.
Dry oak leaves made up 17.1 percent of the diet in early winter. The use of dry oak leafage by deer has been reported by Ferrel and Leach (1950) and Leach and Hiehle (1957). The use of grasses by deer in california has been well documented. Browning and Lauppe (1964) noted that the portion of grass in the diet increased with winter rains. Dixon (1934) reported the use of bromes and annual fescues (Vulpia spp.) and Lassen et al. (1952) found downy brome grass (Bromus .tectorum) to be important deer foods. Rusty popcorn flower was reported by Linsdale and Tomich (1953) to be little used by blacktails (Odocoileus hemionus columbianus) • Salwasser (1974) reported the use of rusty popcorn flower by deer in the North Kings herd. Filaree has been r.eported to be an important deer food by a number of workers (Lassen et al. 1952, Jordan 1967, Salwasser 1974).
Late Winter. Browse use continued to decrease during late winter; only interior live oak and blue oak were important browse species (Figs. 3 and 4) • Forb use continued to increase and reached a peak during the middle of March. Rusty popcorn flower leaves and inflorescences, redstemmed filaree and filaree (Erodium obtusiplicatum) were important forbs in the diet.
Use of grasses and sedges peaked during the middle of February and then declined. Annual bromes, spike rush, pointed rush (Juncus oxymeris), and annual fescues made up the bulk of the grasses and sedges in the diet (Table 1).
Slring. Use of browse species increased during this period and by the end o April constituted almost 80 percent of the diet. The increase in consumption of interior live oak, Mariposa manzanita, chaparral whitethorn (Ceanothus leucodermis), deer weed (Lotus scoparius) and blue oak corresponded to the emergence ofnew growth. Similar findings have been reported by Leach and Hiehle (1957), Browning and Lauppe (1964) and Salwasser (1974). Jordan (1967) considered interior live oak and blue oak to be palatable browse during April and Mariposa manzanita to be moderately palatable. Longhurst et al. (1952) listed interior live oak, blue oak and chaparral whitethorn as-major browse species on the western slope of the Sierra Nevada.
Forbs are still an important part of the diet at this time, ·comprising about 70 percent of t}le diet at the end of March and declining to about 25 percent of the diet at the end of April (Fig. 4). Tractable deer foraging habits did not always allow examination of morphological characters necessary to differentiate between Bromus and Avena, hence annual bromes and wild oats were lumped for analysis.
LOW .use of grasses by our deer in April is understandable as our phenology observations indicate that most grasses were in flower and some were desiccating at this time. Dixon (1934) reported that deer seldom ate grass flowers. Our observations showed many instances of the tractable deer mouthing grass flowers and refusing to eat them.
Selectivity Indices
Selectivity indices for plant species found to be important in our study or considered important by earlier workers (Ferrel and Leach 1960, Jordan 1967, Leach and Hiehle 1957, Longhurst et al. 1952) were calculated for each sampling period. Vegetation data use~for calculating selectivity indices is presented in Tables 2 and 3. The selectivity indices are
CAL-NEVA WILDLIFE TRANSACTIONS 1976
2 9 .....

presented in Table 4. Interior live oak, the most important species in the diet over the entire sampling period always had a selectivity index less than 1.0. In other words, live oak was never eaten in a proportion equal to its relative abundance. Chaparral whitethorn and redberry always had selectivity indices greater than 1.0. Redberry was a fairly constant portion of the diet on the winter range and always was eaten in greater proportion than its availability. Redberry has been considered by Gibbens and Schultz (1963) and Cronemiller and Bartholomew (1950) as being a preferred species. Chaparral whitethorn has been considered by Longhurst et al. (1952) and Dayton (1931) to be an important ~orage. Buck-brush 1Ceanothus cuneatus), considered by Longhurst et al. (1952), Jordan (1967) and Dixon (1931) to be important, never had a selectivity index greater than 0.74. A selectivity index of 1.50 for blue oak in the spring indicated that our deer were selecting for it. Jordan (1967) considered blue oak highly palatable when new growth was emerging. Deer weed is not reported in the literature as being a highly preferred species but the selectivity index for spring is 5.47 and indicates a high level of selectivity by our deer. Mountain mahogany (Cercocarpus betuloides), only a small part of the diet, had.a selectivity index of 2.73 when new growth was available. Bissell and Strong (1955), Cronemiller and Bartholomew (1950) and Jordan (1967) felt that mountain mahogany was a preferred food species for deer.
Important forbs generally h~d a selectivity index greater than 1.0. Rusty popcorn flower leaves were important in early and late winter and had selectivity indices of 1. 54 and 1.15. Rusty popcorn flower inflorescences were important in late winter and spring and had selectivity indices of 8.15 and 4.46. Filaree was important in late winter and spring and was a selected species. But clover (Medicago Qolymorpha) was a small part of the diet, but was preferred at all seasons and was highly preferred during late winter with a selectivity index of 8.42. Foothill pseudobahia, farewell to spring, and gilias were highly preferred at the end of the spring period, even though only making up a small part of the diet.
Annual bromes and fescues, even when important in the diet, had selectivity indices less than 1.0, indicating these species were eaten in proportion less than their relative abundance.
The actual numerical values of selectivity indices are not yet fully understood. A selectivity index of 10.0 may not indicate that a plant is 10 times as preferred as a plant with an index of 1.0. Numerical ratings could be used to group plants into arbitrary preference classes for management purposes and attention placed on management for the plants with highest selectivity indices. Wallrno and Neff (1970) sum up the idea of relative preference as being a complex abstraction that is not completely resolved by these methods.
There are advantages and disadvantages in using tractable.deer in food preference studies. The greatest advantages are that forage selections by deer can be ascertained virtually without error and that large amounts of data can be collected. The actual portion of a plant used and the phenological state of that plant can be determined. comparisons between observers simultaneously counting bites for one deer indicate agreement in observations of 99 percent.
The most important unsolved question is how does hand rearing and maintaining the deer on an artificial ration affect their forage choices? Previous workers felt that forage selection by tractable deer was similar to that of wild deer (Healy 1967, 1971, McMahan 1964, Wallrno and Neff 1970, Wallrno et al. 1972, and watts 1964). More recently, Neff (1974) stated that forage' selected by tractable deer may be more limited than forage selected by a wild deer on a deficient nutritional plane, but that all forage selected by
CAL-NEVA WILDLIFE TRANSACTIONS 1976
3 0

tractable deer would be acceptable to wild deer. More limited species selection by tractable deer could introduce serious bias on habitat thought to be nutritionally deficient. Evidence to compare the forage selections of wild deer and tractable deer is lacking. More research is necessary to document the comparability between wild and tractable deer diets.
Bite data are difficult to use if quantification of intake is a desired research objective. Wallmo et al. (1972) have found that diet composition simulated by hand picked samples did not differ from diet composition as determined by bite counts. Neff (1974) found that weight per bite varied by as much as 1:25 between species. He felt that diet composition as estimated by bites and as estimated by weight were not comparable. In our opinion, weight estimates, or hand simulating bites, is not possible for many species.
As Wallmo and Neff (1970) have indicated, if the research goals are to determine just what foods are eaten by deer, then the bite count technique is valuable. We feel the best way to negate quantification and bias problems may be to maintain the animals in paddocks on native forage and use esophageal cannulation methods to determine forage intake of the tractable deer. Direct comparison of quantified intake and bite counts would then be possible.
LITERATURE CITED
Bissell, B.D. and H. Strong. 1955. browse diet of California deer.
The crude protein variations in the California Fish Game 41(2) :145-155.
Browning, B.M. and E.M. Lauppe. 1964. A deer study in a redwood-Douglas fir forest type. California Fish Game 50(3):132-147.
canfield, R. 1941. Application of the line intercept method in sampling range vegetation. J. Forestry 39(4) :388-394.
Conover, W.J. 1971. Practical nonparametric statistics. John Wiley and Sons, Inc., New York. 462 pp.
cronemiller, F.C. and P.S. Bartholomew. 1950. The california mule deer in chaparral forest. california Fish Game 36(4) :343-365.
Dayton, W.A. 1931. Misc. Publ. 101.
Important western browse plants. 214 pp.
u.s. Dept. Agric.
Dixon, J.S. 1934. A study of the life history and food habits of mule deer in California - Part II: food habits. california Fish Game 20(4) :316-354.
Evans, C.J., R.D. Haines, and D.L. Chesemore. 1975. Deer eat the darndest things. Outdoor California 36(3):1-4.
Ferrel, C.M. and H. Leach. 1950. Food habits of a California deer herd. California Fish Game 36(3):235-240.
Gibbens, R.P. and A.M. Schultz. 1963. Brush manipulation of a winter deer range. California Fish Game 49(2) :95-118.
Greig-Smith, P. 1964. Quantitative plant ecology. 2nd ed. Butterworths, London. 256 pp.
CAL-NEVA WILDLIFE TRANSACTIONS 1976
3 1 .. . ..
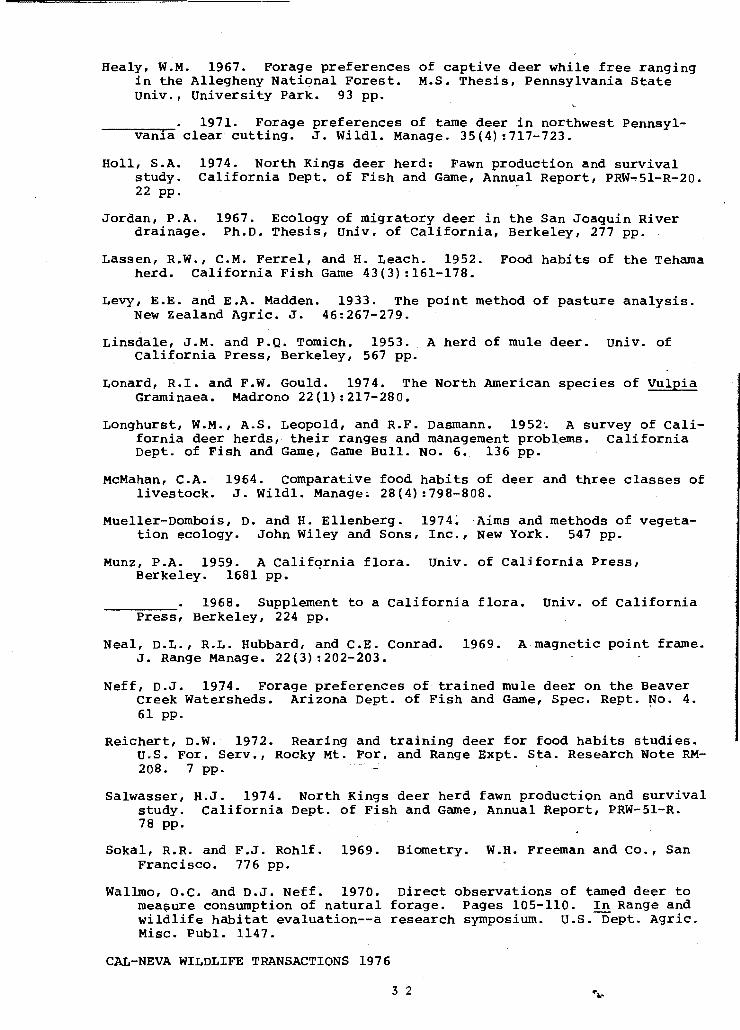
Healy, W.M. 1967. Forage preferences of captive deer while free ranging in the Allegheny Natiqnal Forest. M.S. Thesis, Pennsylvania State Univ., University Park. 93 pp.
. 1971. Forage preferences of tame deer in northwest Pennsyl----~v-a-n~~-a clear cutting. J. Wild!. Manage. 35(4):717-723.
Holl, S.A. study. 22 pp.
1974. North Kings deer herd: Fawn production and survival California Dept. of Fish and Game, Annual Report, PRW~51-R-20.
Jordan, P.A. drainage.
1967. Ecology of migratory deer in the San Joaquin River Ph.D. Thesis, Univ. of California, Berkeley, 277 pp.
Lassen, R.W., C.M. Ferrel, and H. Leach. 1952. Food habits of the Tehama herd. California Fish Game 43(3):161-178.
Levy, E.E. and E.A. Madden. 1933. The point method of pasture analysis. New Zealand Agric. J. 46:267-279.
Linsdale, J.M. and P.Q. Tomich. 1953. A herd of mule deer. Univ. of California Press, Berkeley, 567 pp.
Lonard, R.I. and F.W. Gould. 1974. The North American species of Vulpia Graminaea. Madrono 22(1):217-280.
Longhurst, W.M., A.S. Leopold, and R.F. Dasmann. 1952~ A survey of California deer herds, their ranges and management problems. California Dept. of Fish and Game, Game Bull. No. 6.. 136 pp.
McMahan, C.A. 1964. Comparative food habits of deer and three classes of livestock. J. Wildl. Manage. 28(4):798-808.
Mueller-Dombois, D. and H. Ellenberg. 1974: Aims and methods of vegetation ecology. John Wiley and Sons, Inc., New York. 547 pp.
Munz, P.A. 1959. A California flora. Univ. of California Press, Berkeley. 1681 pp. ·
1968. Supplement to a California flora. Univ. of California Press, Berkeley, 224 pp.
Neal, D.L., R.L. Hubbard, and C.E. Conrad. 1969. A magnetic point frame. J. Range Manage. 22(3) :202-203.
Neff, D.J. 1974. Forage preferences of trained mule deer on the Beaver creek Watersheds. Arizona Dept. of Fish and Game, Spec. Rept. ~o. 4. 61 pp.
Reichert, D.W. 1972. Rearing and training deer for food habits studies. u.s. For. Serv., Rocky Mt. For. and Range Expt. Sta. Research Note RM-208. 7 pp. .
Salwasser, H.J. 1974. North Kings deer herd fawn production and survival study. California Dept. of Fish and Game, Annual Report, PRW-51-R. 78 pp.
Sokal, R.R. and F.J. Rohlf. 1969. Biometry. W.H. Freeman and co., San Francisco. 776 pp.
Wallmo, o.c. and D.J. Neff. 1970. mea~ure consumption of natural wildlife habitat evaluation--a Misc. Publ. 1147.
CAL-NEVA WILDLIFE TRANSACTIONS 1976
Direct observations of tamed deer to forage. Pages 105-110. In Range and research symposium. u.s.-oept. Agric.
3 2 .. ~~..

------~-' W.L. Regelin, and D.W. Reichert. 1972. Forage use by male deer relative to logging in Colorado. J. Wildl. Manage. 36(4) :1025-1036.
Watts, c.R. 1964. Forage preferences of captive deer while ~ree ranging in a mixed oak forest. M.S. Thesis, Pennsylvania State Univ., University Park. 65 pp.
Winter, F.A., G. Ashcraft, and B. Stewart. 1970. North Kings deer herd management plan. u.s. Dept. Agric., For. Serv. 44 pp. (Mimeogr.)
Fig. 3.
J8n 27•31
•Browse
oGresses & Sedges
•Forbs
•
•
Mar Apr 24-28 11-14
Diet of tractable deer-is broken dow~ into three major forage classes, December 1974 to Apr1l 1975.
CAL-NEVA WILDLIFE TRANSACTIONS 1976
3 3 "~~..
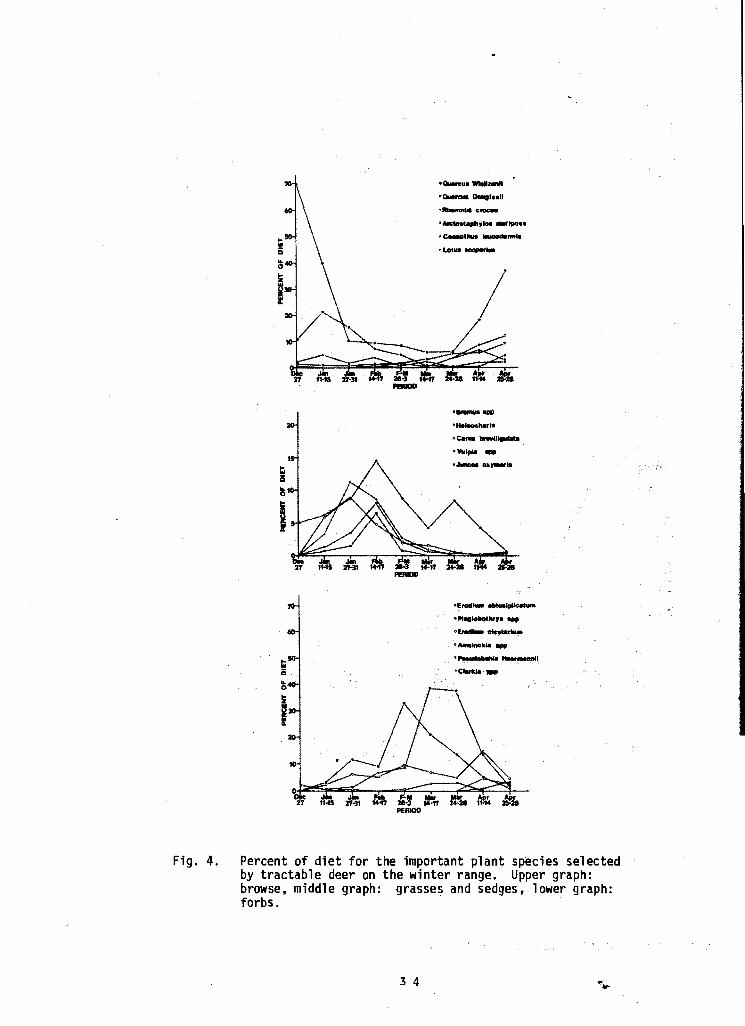
Fig. 4.
I
Iii ii
• Oulrcua Wllllz:.tt
·-Doutlooll
•M:-.....y ......... .,... ••
. ~ .... - ...... ·Lotllo--
·--·-II ·--........ •Vulplo -• JUIICU8 OllYIDifla
•Enid-~
•PIIg-luYI-,---·-lnokla-·---nail. ·CIIJIU&·-
Percent of diet for the important plant species selected by tractable deer on the winter range. Upper graph: browse, middle graph: grasses and sedges, lower graph: forbs.
3 4

' ~-
;.. t, [. Table 1. Diet preferences of tractable deer on winter range in Haslett Basin. 1> [: ;~·
!'
t Early Winter Late Winter Spring Full Season ~'-~-- (27 Dec to 31 Jan) (15 Feb to 17 Mar) (24 Mar to 28 April) (27 Dec to 31 Jan) ~-. ~- Food Item Number Percent Number Percent Number Percent Number Percent
j of bites of diet of bites of diet of bites of djet of bites of diet
l 2,417 32.60 1,118 8.19 2,819 23.11 6,354 19.10
r ' 2,270 30.62 1,087 7.96 2,791 22.88 6,148 18.48
r P1a~iobothrlS 147 1.98 31 0.23 28 Q.23 206 0.62
not ofulvus .. 450 6.07 ' 2,962 21.68 }33 6 •. 01 4,145 12.46 leaves 450 6.07 970 7.10 80 0.66 1,500 4.51
. inflorescences 1,992 14.58 653 .5.35 2,645 7.95
Erodium _ iilrtusi~licatum 83 1.12 ' 2,103 15.39 1,950 15.99 4,136 12.43
~spp. 523 '7 .06 1,333 9.76 492 4.03 2,348 7.06
~ercus Do~1asii 1,321 17.82 648 4.75 290 2.38 2.259 6.79 twigs an leaves 200 2.70 65 0.48 271 2.22 536 1.61
, .<·fallen leaves· 1,121 15.12 583 4.27 19 0.16 1,723 5.18
frodium d cutari.um 266 3.58 1,022 7.48 833 6.83 2,119 6.37
Arctosta(!hll os 1111riposa 80 1.08 165 1.21 1,062 8.70' 1,307 3.93 }-/·
Ceanothus leucodennis . 57 0.77 210 1.54 '908 7.45 1,175 3.53
Heleocharis (!alustris 439 5.92 601 4.40 8 0.07 1,048 3.15
Qrex brevil ig~lata 460 6.21 366 2.68 52 0.43 878 .2.64
Rhamnus crocea 238 3.22 312 2.28 198 1.62 749 2.25
Vu1pia spp. 143 1.93 553 4.05 24 0.20 720 2.16 ' Lotus sCO(!arfus 5 0.07 50 0.37 487 3.99 542 1.63
<'·
' ;)uncus oxymeris 69 0.93 363 2.66 17 0.1.4 449 1.35
~- fseudobahia Heermannii ~
6 0.04 274 2.25 280 0.84
r" Ceanothus cuneatus 62 0,84 139 1.02 60 0.49 261 0.78 ;:;:: ~
Medicago ~1~r2ha 36 0,49 138 1.01 51 0.42 225 0.68
-~spp. 7 0.05 209 1.71 216 0.65
!.!.!k spp. 0.01 6 0.04 169 1.39 176 0.53
Cerocarpus · bituloides 18 0.24 27 0.20 110 0.90 155 0.47
' Other f tetns 743 10.02 1.5~2 11.18 1 ;451 11.92 3,726 11.20
Total 7.412 99.98 13,661 99.98 12,197 100.00 33,268 100.00
3 5
I·.

Table 2. Percent cover of herbaceous plants and fallen leaves on sample site as determined .by point frame sampling.
Early Winter (27 Dec to 31 Jan)
(n • 86)
Food 1tems2 -~
Dry grass 24.61
Bromus sp. 15.58
Vulpia sp. 15.09
Dry herbs 9.18
Quercus Wislizenii (dry) 9.43
Erodium ciculatarium 5.33
Pla~iobothrys not ofulvus (lvs) 3.94
Erodium obtusipl icatum 3.20
Lotus sp. (annuals) 1.31
Quercus Oouglasii (dry) o.g9
Plafiobothrys nothofulvus (hi )
Hedicago polJmgrpha
Clarida sp.
Pseudobahia· Heermanni1
Gilia sp.
Other species
TOTAL
0.41
0.08
10.85
100.00
34.88 2.71
22.09 2.05
21.40 2.18"
13.02 1.49
13.37 2.39
7.56 1.57
5.58 1.48
4.53 1.29
1.86 0. 51
1.40 0.55
0.58 0.38
0.11
15.36
141.74 7.16
Sample Period
Late Winter (15 Feb to .17 Mar)
(n = 60)
Percent Cover1
17.29
17.40
14.90
3.93
0.24
11.32
6.20
11.21
4.29
0-47
1.79
0.12
10.84
100.00
24.17 2.74
24.33 2.99
20.83 2.01
5.50 1.37
0.33 --
15.83 2.62
8.67 1.55
15.67 2.76
6.00 1.26
0.67 0.32
2.50 0.74
0.17
15.16
139.83 5.38
1Rel. =relative cover which is absolute cover/total vegatative cover Abs. =absolute cover, whic~ refers to the total cover along the line.
Spring (24 Mar to 28 Apr11)
(n = 77}
15.02
14.54
9;'25
2.88
0.72
11.30
2.89
10.46
5.65
3.01
1.20
o;36
0.60
(U4
0.12
18.51
100.00
"16.23. 2.09
15.70 1.98
9.99 1.43
' 3.12 0~ 93
0. 78 0.44
12.21 2.02
3.121.16
11.30 2.28
6.10 1.04
3.25 1.00
1.30 0.47
0.39 --
0.65 0.33
0.26
0.13
23.52
108.05. 4:81
21vs = leaves; inf. • inflorescences, those portions of a plant bearing flowers.
3 6

Table 3. Percent cover ofbrowse species estiuted by the line
"'t1'r¢~. ~, oe ~QF~Pf"~H~~d~~ -,: 0 "'" • •
Quercus tbslizei'lii Edodict n ealllOmiea
UJt a1bifrons
· i.n£lorescenees Vulpia .·Spp~
60.19 17.86 8 .. 07 s.oo 1.82 1.62 1.43 1.33 0.69 0.69. 0.69 0.69 0.59 0.54 0.44 0.34
;'e~-
£89':; 15.~7 0-;i. ~,. •r, '~'···· . 1.,!0 o.lf, 0.11 4 •. 67,. '0.'10~
ci • .ts"· Ci~61 0.35
--7,'U:13
1.20
1.54
0.13.
3 7
12.23 3.63 1.64 0.61 0.37 0.33 0.29 0.27 0.14 0.14 0.14 0.14 0.12' . 0.11 0.09 0.07
c, 20.32
0.13 ... 0.58 0..-96 0.32
0.34 9.09 ·o~77 . i.6J 0.40
·().S9. '3.:30 0.54
().56 0~66 1.37
8.42
1.15 ·s~l.s 0.27
1.55 o.os 0. 37 ..
'12:63 .. t:: i:3s 5:78 .:,_
():as 0.60
- l.S3 . ·3.23 n~ss 2~85 1.17
0.23 . 4.46 0~02
•