Embed Size (px)
Citation preview
CSL/ADAS RESEARCH AND DEVELOPMENT
Winter barley: a survey of diseases
- 2002 -
A survey to determine the incidence and severity of winter barley diseases in England and Wales
N V Hardwick & J E Slough Central Science Laboratory, Sand Hutton, York YO41 1LZ
P Gladders
ADAS Boxworth, Boxworth, Cambridge CB3 8NN

ii
CONTENTS Contents Page Abstract ............................................................................................................................iv Executive summary ........................................................................................................viii Economic and policy assessment ...................................................................................xvi Introduction .....................................................................................................................22 Methods...........................................................................................................................22 Results and discussion ....................................................................................................28 National severity of foliar and stem diseases.........................................................28 Regional disease severity.......................................................................................30 Effect of cultivar on diseases .................................................................................32 Fungicide use .........................................................................................................32 Herbicide use .........................................................................................................33 Insecticide use........................................................................................................34 Drilling dates..........................................................................................................35 References and bibliography ...........................................................................................36 Acknowledgements .........................................................................................................36 Appendix Tables of results ..............................................................................................................38 Disease incidence and severity ..............................................................................39 Regional disease incidence and severity................................................................40 Cultivars and disease .............................................................................................43 Previous cropping and disease ...............................................................................45 Effect of sowing date and disease ..........................................................................48 Fungicide use .........................................................................................................49 Seed source and treatment .....................................................................................55 Herbicide use .........................................................................................................56 Growth regulator use..............................................................................................64 Insecticide use........................................................................................................66

iii

iv
Abstract In 2002, 383 randomly selected fields of winter barley were sampled in a disease survey
undertaken jointly by CSL and ADAS. The fields were identified using a farm list
stratified by the area of barley grown in each region and in proportion to the arable size of
holdings. Samples were taken in June when crops were at the watery-ripe to early-milk
stage (GS 71-73).
Overall, total foliar disease levels were higher than those recorded in 2001 with 7.0% of
the area of the top two leaves affected. Leaf blotch remained the most severe and
widespread foliar disease for the fifth successive survey. It was recorded in 93% of crops
and affected on average 2.8% of the area of leaf 2. Although severity of leaf blotch was
lower than for the preceding four years, disease incidence has remained the same since
2000 and was only higher in 1983. Leaf blotch was recorded in every sample in the North
West and South East regions, where its severity was 4.8% and 3.9% of the area of leaf 2
affected respectively. Its incidence did not fall below 85% in any other region. Net blotch
was the second most common disease nationally and was recorded in 51% of crops
sampled. Once again, levels were highest in the South West region with 1.5% of the area
of leaf 2 affected. Brown rust was the second most severe disease, but severity only
reached 0.7% average area of leaf 2 affected. However, in samples from the North East,
brown rust severity on leaf 2 was 1.5%, double the national average. The incidence of
mildew was almost twice that of 2001. However, it was only recorded in 41% of samples,
the second lowest incidence after 2001, and severity was only 0.5% area of leaf 2 affected.
The highest levels were recorded in the North West region with 3.3% of the area of leaf 2
affected. Septoria leaf spot was recorded in every region and averaged 0.1% of the area of
leaf 2 affected. Although yellow rust was nationally only at trace levels, its incidence was
the highest since 1983. The majority of occurrences were on the cultivar Regina. Halo
spot was recorded in the unstratified survey from two samples from Wales.
Eyespot incidence and severity were higher than for 2001, with a frequency of 75% of
samples and an average of 4.5% of stems affected by moderate plus severe symptoms.
Sharp eyespot was recorded more frequently than in any year since 1995, but severity was

v
lower than in 2000 and 1998. Fusarium symptoms were present in 85% of samples, with
moderate and severe levels on 4.1% of stems compared with 2.2% in 2001, 12% in 2000,
4.7% in 1999 and 10.5% in 1998.
Two cultivars, Pearl (35%) and Regina (19%), accounted for 54% of the national samples,
Siberia with 9% was the next most sampled cultivar. This represented an increase for
Pearl and Siberia and a decrease for Regina compared with 2001. Of the most popular
cultivars in the stratified sample, the highest level of leaf blotch was recorded on Regina
and the lowest on Pearl. Damaging eyespot levels were more prevalent on Pearl, Regina
and Antonia than on the other three most popular cultivars.
The percentage of crops sown before the 24 September was the highest since 1998. Only
11% of crops were sown after 14 October compared with 30% in 2001. Generally, total
foliar disease levels (leaf 2) were more severe in crops sown after 14 October and eyespot
more severe in crops sown before 24 September. Eyespot was more severe in crops
following a cereal than in those crops following a non-cereal. The incidence of BYDV
showed no difference between the early sown crops, with 30% of crops affected, and those
sown after 14 October with 29% of crops affected, however, severity was higher in the
later sown crops.
Fungicide sprays were used on 96% of crops. Five per cent were treated with a fungicide
before the end of tillering. Eighty eight per cent received a spray at or around the first
node development stage (GS 31) and 70% at or after flag leaf emergence (GS 37+).
Twenty nine per cent of crops received a single spray, 76% aimed at GS 31. Fifty eight
per cent were sprayed twice, with the majority (91%) at GS 31 with a second spray at or
after GS 37. Nine per cent of crops received three or more fungicide sprays and on
average each crop was sprayed 1.7 times. The most commonly applied fungicide products
were Acanto (184 applications), Amistar (132 applications), Opus (104 applications) and
Unix (103). Overall, the use of strobilurin group fungicides increased, with 86% of crops
having received at least one application compared with 76% in 2001, 74% in 2000, 52% in
1999 and 10% in 1998. The number of different foliar applied fungicide products totalled
64, with twenty four active ingredients. Seventy-six per cent of crops in the survey were
grown from certified seed, and 88% of all crops were known to be grown from fungicide-
vi
treated seed. Details of fungicide, insecticide, herbicide and growth regulator use, broken
down by active ingredient and product, are presented in the report.

vii

viii
Executive summary Disease incidence and severity
1. The combined total foliar disease severity was higher than in 2001, when the lowest ever level was recorded. However, there have only been three surveys with lower severity than 2002 over the last ten years.
2. For the fifth successive year leaf blotch was the most severe foliar disease, affecting on average 1.4% of the flag leaf and 2.8% of the second leaf. The incidence of leaf blotch has remained constant over the last three surveys at 93% of samples affected. It was recorded in all samples from the North West and South East regions where the highest levels were found with 4.8% and 3.9% average area of the second leaf affected respectively.
3. Net blotch was the second most common disease recorded. It was present in 51% of samples compared with 28% in 2001. Disease severity was low, with less than 1.0% average area of leaf 2 affected. Since 1990 there have only been three surveys where levels have been lower. The highest level of net blotch occurred in the South West region with 1.5% of leaf 2 affected, twice the national average.
4. Mildew was present in 41% of crops affecting on average 0.5% of leaf 2. This was the second lowest incidence and severity ever recorded after 2001. The highest levels were recorded in the North West and North East regions, with an average of 3.3% and 1.8% of leaf 2 affected respectively.
5 Brown rust, after leaf blotch, was the second most severe foliar disease surveyed. It was more widespread than in 2001 and was recorded in samples from every region. The highest levels were in samples from the North East and East Midlands regions with 1.5 and 1.1% average area of leaf 2 affected respectively. Nationally, severity was also higher than in 2001 with 0.7% of the area of leaf 2 affected compared with 0.1% in 2001.
6. Leaf spot (Septoria spp.) was the only other disease to affect at least 0.1% area of leaf 2. It was recorded in samples from every region and nationally, incidence was 22% of samples. The highest levels occurred in Wales where the average area of leaf 2 affected was 0.2%.

ix
7. Yellow rust was recorded in 12 survey samples. Although not as numerous as in the early 1980’s, the number of crops affected was still more than three times that found in any year since 1994. All the cases were from samples from the northern regions and the East Midlands.
8. Halo spot (Pseudoseptoria donacis) was only recorded in two unstratified samples from Wales. Nationally, only yellow rust was present in trace amounts.
9. Eyespot was recorded in 75% of samples compared with 46% in 2001. Damaging moderate plus severe eyespot affected 4.5% of stems compared with 1.5% in 2001. However this was low compared with 17.9% in 2000, 9.2% in 1999 and 7.2% in 1998. The highest levels of moderate plus severe symptoms were recorded in the North West and West Midlands regions and the least in the East region.
10. Sharp eyespot was recorded more frequently than in any year since 1995. However, moderate plus severe lesions affected 1.6% of stems, which was lower than in the surveys of 2000 and 1998.
11. Stem base fusarium symptoms were present in 85% of samples compared with 77% in 2001 and 96% in 2000. Thirteen per cent of all stem bases were affected by nodal fusarium symptoms compared with 9% and 28% in the previous two surveys respectively. Internodal fusarium was recorded on 4% of stem bases compared with 5% in 2001. Moderate plus severe fusarium symptoms affected 4% of stems which was almost double the recorded level of 2001.
12. Visible BYDV symptoms were assessed in 25% of fields, twice the recorded level of 2001. Nine per cent of crops had patches of affected plants assessed in situ. This was the highest incidence and severity since the previous high of 1995.
Cultivar effects
13. Pearl, at 35%, was the most frequently sampled cultivar for the first time, whilst 19% samples were Regina. These two cultivars dominated the survey with 54% of crops. This represented an increase for Pearl and a decline for Regina compared with 2001. The next most frequently sampled cultivars were Siberia (9% of crops), Heligan (6%), Jewel (5%) and Antonia (5%). Twenty-six cultivars were sampled in 2002 and three, Diamond, Sumo and Whisper, were encountered for the first time. Pearl was the most popular cultivar in most regions, but Regina predominated in the North East region and Wales and Heligan in the North West region.

x
14. Of the six most popular cultivars in the stratified sample Regina had the highest levels of leaf blotch with an average of 4.8% of leaf 2 affected followed by Jewel with 3%, the lowest levels were recorded on Pearl. Net blotch was most severe on Jewel with 1.4% of leaf 2 affected followed by Siberia with 1.2%. Brown rust levels were highest on Siberia and Heligan with 1.8% and 1.0% of leaf 2 affected respectively. Mildew levels were highest on Heligan with 1.5% average area of leaf 2 affected followed by Regina. Powdery mildew did not exceed 0.2% on any of the other popular cultivars. Overall, Pearl had the least total foliar disease on leaf 2 and Regina was the most severely affected of all six cultivars. Pearl, Regina and Antonia had higher levels of moderate plus severe eyespot symptoms than the other three popular cultivars with close to 4.5% of stems affected.
15. In response to the question “Was disease resistance a factor in selecting this variety?” only 37% of farmers replied that they took this into account compared to 38% in 2001.
Rotational effects
16. Ninety four per cent of crops followed a cereal crop, with 19 sown after winter barley. Leaf blotch was more severe following winter barley than other cereals, a trend seen in previous surveys and every year since 1996. There has been little difference in the severity of eyespot found in this or past surveys between crops sown after barley or those sown after other cereals. However, eyespot was more severe in crops following a cereal than in crops following a non-cereal. The number of crops grown after a non-cereal crop is comparatively low, therefore it was difficult to make meaningful comparisons. Despite this, the last fourteen surveys have indicated that eyespot has been less severe when crops have followed grass.
Drilling date
17. The percentage of crops sown before 24 September (32%) was the highest since 1998, with 78% of these sown between 15 and 23 September. Only 11% of crops were sown after 14 October compared with 30% in 2001. There has been little consistent effect of drilling date on foliar disease levels at assessment from year to year. However, for the past five surveys leaf blotch has been more severe in crops sown before October than in those sown later. In every previous survey, eyespot severity (moderate plus severe categories) has tended to be less damaging in crops sown after 14 October, this trend continued in 2002. Sharp eyespot was also more severe in earlier drilled crops. Stem base fusarium was less severe in crops sown after 14 October and most severe in crops sown before 24 September. There were

xi
no differences in the incidence of BYDV between crops sown before 24 September, with 30% of crops affected, or later sown after 14 October, with 29% of crops affected. However, BYDV was more severe in the later sown crops with 17.6% showing patches of infection in the growing crop compared with 13% in the early sown crops and 6.6% and 5.5% in those sown in the middle range. The high incidence in late sown crops suggests an effect of the mild autumn weather.
Fungicide use
18. Fungicide sprays were used on 96% of crops, with 29% of crops receiving a single application, mostly applied at GS 31. Fifty eight per cent of crops received a two-spray fungicide programme with 91% of these receiving applications at GS 31 followed by a second spray at or after GS 37.
19. Nine per cent of crops received more than two fungicide sprays. Five per cent of crops were sprayed with a fungicide before the end of tillering. Eleven crops remained untreated. On average there were 1.7 fungicide applications per crop, slightly more than the previous highest figure in 1996.
20. Eighty eight per cent of crops were treated with a fungicide at or around GS 31. They were applied either as single products or in combination with other active ingredients. Three per cent of treated crops received applications of MBCs compared with 5% in both 2001 and 2000, 17% in 1999 and 31% in 1998. Products containing a DMI fungicide were used on 63% of crops compared with 68% in 2001, 70% in 2000, 78% in 1999 and 95% in 1998. The use of fungicides from the morpholine group has gradually reduced over the last four years; this year 40% of crops received at least one application at this growth stage compared with 46, 45, 46 and 66% from the previous surveys, respectively. Strobilurin group use has continued to increase at this growth stage. Of crops treated at GS 31, 85% were treated with products from this group, compared with 76% in 2001, 71% in 2000, 47% in 1999 and 5% in 1998. Cyprodinil from the pyrimidine group was applied to 42% of crops treated at GS 31 compared with 45% in 2001, 38% in 2000, 35% in 1999 and 14% in 1998. The most extensively used products at GS 31 were those which contained the active ingredients picoxystrobin, cyprodinil or epoxiconazole. The average doses of product used containing these actives were 0.48, 0.56 and 0.45 respectively of full manufacturers recommended dose.
21. Seventy per cent of crops were sprayed with a fungicide from GS 37 onwards. Seventy five per cent of these had at least one DMI fungicide application, either alone or in combination with other active ingredients. This continued the decline in

xii
the use of fungicides from this group compared with previous surveys: 82, 77, 81, and 95% between 2001 and 1998 respectively. The use of morpholines also fell, only 36% of treated crops had applications compared with 44, 37, 42 and 60% between 2001 and 1998 respectively. MBC use also diminished with only three crops treated at this stage compared with 9% in 2001, 8% in 2000, 20% in 1999 and 32% in 1998. Only strobilurin use increased, 84% of treated crops received at least one application compared with 74% in 2001, 79% in 2000, 52% in 1999 and 11% in 1998. Cyprodinil, from the pyrimidine group was applied to 9% of crops a slight decrease compared with 12% in 2001. The most extensively used products at GS 37 onwards were those which contained the active ingredients azoxystrobin, epoxiconazole and fenpropimorph. The average doses of product used containing these actives were 0.37, 0.35 and 0.40 respectively.
22. Overall, the most popular group of fungicides were the strobilurins. Of all treated crops 90% received at least one spray from this group compared with 79% in 2001. Only four crops received more than two applications. Of the strobilurin treated crops, 41% received a single application with an average dose of product of 0.52. Fifty seven per cent received two applications with 90%, receiving average doses between 0.25 and 0.5, 59% of these had average doses of less than 0.5. The DMI’s were the next largest group with 82% compared with 84% in 2001, followed by the morpholines at 53% (56% in 2001), pyrimidines as cyprodinil at 42% (45%in 2001) and MBCs at 4% (10% in 2001).
23. Eighty per cent of farmers in the stratified sample reported that they were advised to apply a fungicide treatment whilst 37% applied a treatment as an insurance and 17% applied a treatment after seeing the disease themselves. Note, however, that these answers were not mutually exclusive.
24. Sixty-four different fungicide products containing a total of twenty four active ingredients were reported to have been used in the survey on 910 occasions. The most popular products were Acanto used on 184 occasions, followed by Amistar (132), Opus (104) and Unix (103).
Seed source and treatment
25. Seventy six per cent of crops in the survey were grown from certified seed and 24% from farm-saved seed. One crop was sown from a mixture of both. Ninety six per cent of crops were grown from treated seed and 88% were known to have been treated with a fungicide seed treatment. The most popular product was Raxil S (tebuconazole plus triazoxide) used on 58% of the fungicide treated crops. Eight per

xiii
cent of crops were treated with a seed treatment containing imidacloprid for protection against aphid virus vectors.
Herbicide treatment
26. Ninety six per cent of crops were treated with a herbicide. Eleven per cent of crops were grown in fields treated with a herbicide prior to drilling, the majority (97%) being with glyphosate. Eight per cent of crops were treated with a pre-emergence herbicide, this being the only herbicide application for one crop.
27. Despite October 2001 being unsettled and wet, it was also very warm. Over 40% of all post-emergent autumn herbicide applications were made during the month. November was mainly dry and mild and the majority, over 50%, of autumn applications were made. None of the difficulties of the previous autumn were encountered and 83% of crops received an application before the end of December compared with 24% in the 2001 survey, 74% in 2000 and 47% in 1999. Although usage has reduced since 1995, isoproturon was still the most popular active ingredient used and was a component of 59% of known products applied at this time compared with 66, 69, 68 and 74% from 2001–1998 respectively. Diflufenican was the second most used active ingredient in 23% of products, co-formulated isoproturon and diflufenican comprised 15% of known products used post emergence in the autumn.
28. Late winter and spring herbicide treatments were applied to 47% of crops compared with 83%, 50% and 68% in 2001, 2000 and 1999 respectively. Thirteen per cent of crops received a first post-drilling spray in the spring compared with 69% in 2001, 18% in 2000 and 44% in 1999. Fluroxypyr and metsulfuron-methyl were the most popular active ingredients used at this time, included in 23% and 20% of late winter and spring applied products respectively.
Growth regulators
29. Growth regulators were applied to 74% of crops compared with 66% in 2001, 69% in 2000, 67% in 1999 and 66% in 1998. Two crops received autumn applications. The majority of crops (40%) were sprayed in the spring up to GS 30 and 38% received applications between GS 31-35. Of those treated 77% received a single application, 21% received two and 2% received three applications. Eighty per cent of applications contained chlormequat, generally applied before GS 30 or between GS 31 and 35. Of all treated crops, 22% were treated with a growth regulator containing 2-chloroethylphosphonic acid, 80% of these crops had already been treated with

xiv
chlormequat. Thirty nine per cent of treated crops had the active ingredient trinexapac-ethyl applied generally in the spring up to GS 35.
Insecticides
30. Insecticides were applied to 76% of crops compared with 46% in 2001, 75% in 2000, 56% in 1999, 74% in 1998 and 72% in 1997. Seventy three per cent of crops received an autumn treatment compared with 21% in 2001, 69% in 2000 and 44% in 1999. Only 4% of crops received spring treatments compared with 25% in 2001 and 7% in 2000 and seven crops were treated after GS37. Sixty nine per cent of crops received a single application and of these 96% were applied in the autumn and 4% in the spring. Pyrethroids, mainly cypermethrin (61%), were used in 99% of all autumn insecticide treatments. Of those crops treated, only three did not receive a pyrethroid insecticide and only five products were applied from other groups over the whole season. Ninety one per cent (95% in 2001, 96% in 2000, 92% in 1999, 88% in 1998) of treated crops received a single application of insecticide and 8% received two (4% in 2001, 4% in 2000, 7% in 1999, 10% in 1998).

xv

xvi
Economic and policy assessment An estimate of the financial loss to the industry can be obtained by applying the disease/yield loss formulae cited by Cook et al. (1991). The losses due to the uncontrolled winter barley diseases recorded in 2002 were calculated to give a percentage yield loss, the loss in national production and the value of the loss at prices ruling at the time (Table 1). Table 1 National economic losses due to disease Disease % disease Percent
yield loss Production loss
(tonnes)* Value of loss
(£m)† Leaf blotch (leaf 2) 2.8 1.39 42704 2.57 Net blotch (leaf 2) 0.7 0.35 10635 0.64 Yellow rust (leaf 2) trace trace trace trace Brown rust (leaf 2) 0.7 0.26 7990 0.48 Eyespot (mod + severe) 4.5 0.47 14385 0.87 Sharp eyespot (mod + severe) 1.6 0.17 5265 0.38 Total 10.3 2.6 81072 4.95 * = estimated production figures for 2002 – 3,028,000 t † = feed barley at £60.23/t The area of winter barley in 2002 was estimated at 481,000 ha. Using the estimates of Nix (2002) on fungicides costs this equated to £16.8m, and provided an indication of the cost to the industry in attempting to control disease. The cost of pesticide application was estimated at £10/ha by contractor operation (Nix, 2002). With an average of 1.7 applications, the costs over the national area amounted to £8m. The total cost of controlling disease to the farming industry in 2002 was therefore estimated at £24.8m. In spite of this considerable investment a further £5m was lost to disease. Three important features of this survey have been selected for further discussion.. The first issue is the severity of rhynchosporium leaf blotch, the second fungicide use and the third cultivar resistance. Leaf blotch continues to be the dominant disease of winter barley, despite widespread fungicide inputs and the use of resistant cultivars.

xvii
The severity of rhynchosporium leaf blotch has decreased since 2000 (Fig. 2). The fall in 2001 was anticipated, as this was a dry year with weather conditions considered to be unsuitable for the development of the disease. By contrast, the weather conditions in 2002 were wetter and favourable for leaf blotch, but there was not a concomitant increase in the disease.
0
2
4
6
1998 1999 2000 2001 2002
Year
% a
rea
affe
cted
(lea
f 2)
Figure 1 Severity of rhynchosporium leaf blotch, 1998-2002 The change in severity of disease could not be explained by fungicide use alone, as the total number of crops sprayed has remained fairly static over the last five season at between 94 and 96% crops sprayed (Fig. 2). The mean number of applications to the crop has similarly remained fairly static at 1.7 per crops after 1998 at about 46% of the manufactures recommended dose (Fig. 5).
0
25
50
75
100
1998 1999 2000 2001 2002
Year
Total
GS 31
GS 39+
Figure 2 Per cent crops sprayed with a fungicide, 1998-2002

xviii
Since their introduction in 1997 strobilurin fungicides have increased at the expense of the DMI and morpholines fungicides (Figs 3 & 4).
0
25
50
75
100
1998 1999 2000 2001 2002
Year
DMI
Strobilurin
Morpholine
Figure 3 Per cent crop spray with different ais at GS 31
0
25
50
75
100
1998 1999 2000 2001 2002
Year
DMIStrobilurinMorpholine
Figure 4 Per cent crop spray with different ais from GS 35

xix
0
0.5
1
1.5
2
1998 1999 2000 2001 2002
Year
0
15
30
45
60
Figure 5 Number of spray applications and proportion of manufacturers’ recommended
dose.
The percentage of the national crop sown with cultivars with a resistance score of 5 or less for rhynchosporium leaf blotch (considered to be susceptible) has fallen from a peak in 1999 of 32% to 4% in 2002 (Fig. 6). This is encouraging, as it also seems to reflect a change in disease severity, which is not explained by fungicide use. It is also important to have a high proportion of cultivars with a good degree of resistance because less than 40% of farmers take account of it when selecting a cultivar for sowing on their farms (Fig. 7).
0
10
20
30
40
1998 1999 2000 2001 2002Year
% c
rops
sus
cept
ible
to le
af b
lotc
h
Figure 6 Per cent crops with a resistance score for rhynchosporium leaf blotch of 5 and
less

xx
0
10
20
30
40
2001 2002Year
Figure 7 Percentage of farmers responding positively to the question ‘Was disease
resistance a factor in selecting this variety?’
There is evidence from the survey that resistance does play a part in reducing disease levels (Fig. 8).
0
1
2
3
4
5
2001 2002Year
>5
<=5
Figure 8 Effect on disease of cultivar resistance to rhynchosporium leaf blotch.

xxi
The vast majority of farmers rely on advice in reaching their decision on treating crops (Fig. 9).
0
25
50
75
100
Disease
Insurance
Advice
Figure 9 Response to question ‘Have you applied fungicide sprays because, a) You saw a
disease problem yourself, b) the sprays were part of a routine spray programme used whether a disease was present or not as an insurance, or c) You were advised to apply a spray.
Two important policy issues that arise from this year’s survey, a) in order to control disease it is essential to have a choice of cultivars with good disease resistance available and b) if any impact on fungicide use is to be made then it is those who advise farmers who should be targeted with information on disease control. Resistance to the strobilurin fungicides has been detected in Septoria tritici in wheat and is thought to be widespread. The high useage of strobilurin fungicides for disease control in winter barley is of concern. So far, resistance has not been detected in either Rhynchosporium secalis or Pyrenophora teres, although it is present in powdery mildew, and this situation will need careful monitoring and anti-resistance strategies deployed.
22
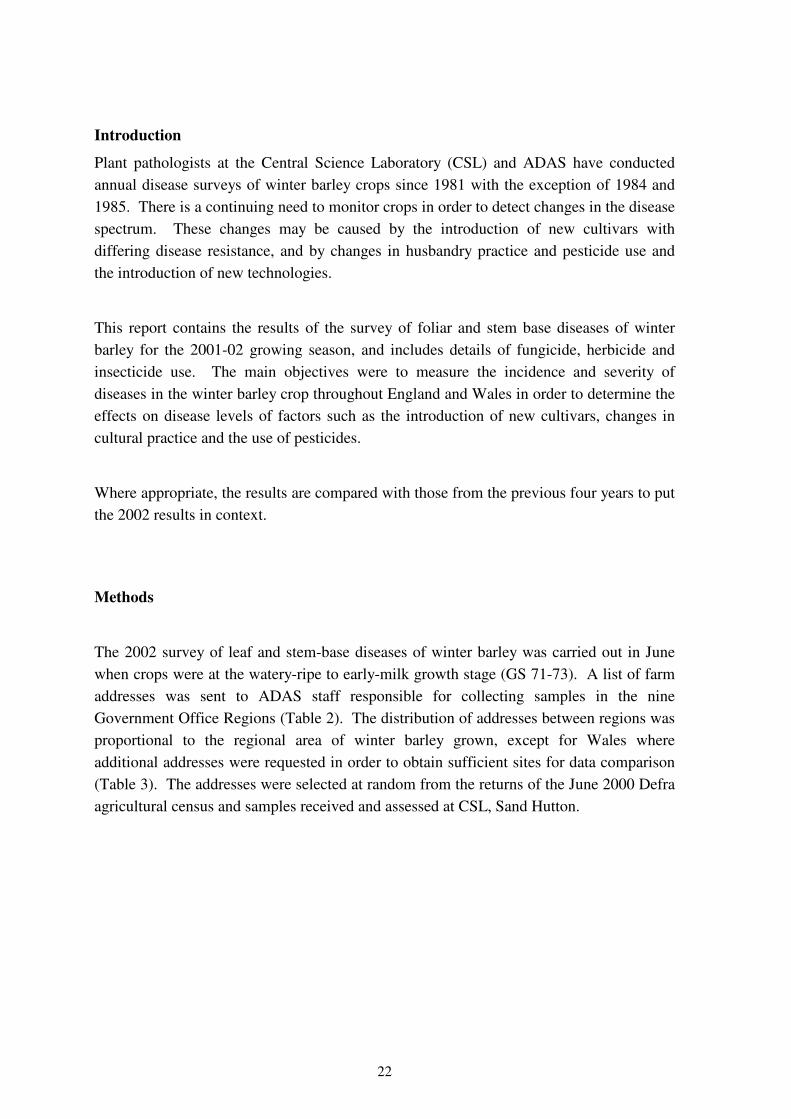
Introduction
Plant pathologists at the Central Science Laboratory (CSL) and ADAS have conducted annual disease surveys of winter barley crops since 1981 with the exception of 1984 and 1985. There is a continuing need to monitor crops in order to detect changes in the disease spectrum. These changes may be caused by the introduction of new cultivars with differing disease resistance, and by changes in husbandry practice and pesticide use and the introduction of new technologies.
This report contains the results of the survey of foliar and stem base diseases of winter barley for the 2001-02 growing season, and includes details of fungicide, herbicide and insecticide use. The main objectives were to measure the incidence and severity of diseases in the winter barley crop throughout England and Wales in order to determine the effects on disease levels of factors such as the introduction of new cultivars, changes in cultural practice and the use of pesticides.
Where appropriate, the results are compared with those from the previous four years to put the 2002 results in context.
Methods
The 2002 survey of leaf and stem-base diseases of winter barley was carried out in June when crops were at the watery-ripe to early-milk growth stage (GS 71-73). A list of farm addresses was sent to ADAS staff responsible for collecting samples in the nine Government Office Regions (Table 2). The distribution of addresses between regions was proportional to the regional area of winter barley grown, except for Wales where additional addresses were requested in order to obtain sufficient sites for data comparison (Table 3). The addresses were selected at random from the returns of the June 2000 Defra agricultural census and samples received and assessed at CSL, Sand Hutton.

23
Table 2. Key to regions referred to in the survey
Code Government Counties ADAS Centre responsible for sampling
Office Region
NE North East Cleveland & Darlington, Durham,
Northumberland, Tyne & Wear,
High Mowthorpe
NW North West Cheshire, Cumbria, Greater Manchester, Lancashire, Merseyside
Wolverhampton
Y&H Yorkshire and the Humber
East Riding & Northern Lincolnshire, North Yorkshire, South Yorkshire, West Yorkshire
High Mowthorpe
EM East Midlands
Derbyshire, Leicestershire, Lincolnshire, Northamptonshire, Nottinghamshire, Rutland
Boxworth, Wolverhampton
WM West Midlands
Hereford & Worcester, Shropshire, Staffordshire, Warwickshire, West Midlands
Wolverhampton
EAST Eastern Cambridgeshire, Bedfordshire, Essex, Hertfordshire, Norfolk, Suffolk
Boxworth
SE South-East Berkshire, Buckinghamshire, Greater London,
Hampshire, Kent, Oxfordshire, Surrey, East Sussex, West Sussex
Mamhead Castle,
SW South-West Cornwall, Devon, Dorset, Gloucestershire, North Somerset & South Gloucestershire, Somerset, Wiltshire
Mamhead Castle
WALES Wales All Welsh Counties Pwllpeiran
NOTE:- All figures for regional areas in the tables are means of the total number of samples assessed from those areas. All national figures are the mean of a stratified sample, within which the number of samples from each region is proportional to the area of winter barley grown in the region.

24
Table 3. Distribution of winter barley in England and Wales and survey sample Government Office Region
Area ADAS Centre responsible
% of Area (2001 census)
No. of samples processed
NE North East High Mowthorpe 6.2 23 NW North West Wolverhampton 3.5 8 Y & H Yorkshire and the
Humber High Mowthorpe 17.1 68
EM East Midlands Wolverhampton, Boxworth
14.4 58
WM West Midlands Wolverhampton 9.5 34 EAST Eastern Boxworth 24.0 87 SE South East Mamhead Castle 9.5 26 SW South West Mamhead Castle 13.1 51 WALES Wales Pwllpeiran 2.7 27(1) Total 100 383 Numbers of unassessable samples are given in brackets The samples processed were taken from 4100 ha of winter barley.
Farms were visited by ADAS staff at around growth stages 71-73, when the dry matter of the grain accumulates rapidly. On each farm, a field was selected at random and a sample of 50 fertile tillers was collected randomly from a diagonal traverse of the field. The samples were packed in polyethylene bags and dispatched immediately to CSL for assessment, followed by a completed questionnaire giving agronomic details such as cultivar, sowing date and previous cropping as well as details of all pesticide applications.
A sub-sample of 25 tillers was assessed on arrival at CSL. Leaf diseases were recorded as the percentage area affected on the flag and second leaves using standard area keys (Anon., 1976). Green leaf area and insect damage were similarly recorded.

25
Eyespot and sharp eyespot
Eyespot and sharp eyespot were recorded as the percentage of tillers affected in three categories:- slight, moderate and severe, after the method of Scott & Hollins (1974) below:
Category Description
slight lesions girdling less than half the circumference of the stem.
moderate lesions girdling more than half the circumference of the stem.
severe lesions girdling more than half the circumference of the stem, and tissue softened so that lodging would readily occur.
Barley yellow dwarf virus
Barley yellow dwarf virus (BYDV) was assessed in the field at the time of sampling using the following key:
Category Description
0 no BYDV seen
1 a scatter of plants showing BYDV symptoms (leaves, especially the flag leaf, a golden/chrome-yellow colour).
2 occasional small patches (less than 5 m across) showing BYDV symptoms.
3 many small or a few large areas affected (1% to 10% of field area affected).
4 many large areas affected (more than 10% of field area affected).

26
Fusarium
The percentage of stems with slight, moderate and severe fusarium symptoms on the nodes and internodes was also recorded using the key shown below:
Category Nodes and/ Internodes or 0 no infection. no infection.
1 staining on one or more nodes but not covering the whole circumference of the stem.
slight streaks on stem base.
2 staining on one or more nodes covering the whole circumference of the stem.
general browning on stem base.
3 one or more nodes rotted - likely to cause lodging.
stem base rotted - likely to cause lodging.
Fungicides
Tables providing information on fungicide use list the products and their principal times of application. In the conclusions the fungicides are grouped according to their mode of action using the following convention:
MBC - any product or mixture containing one or more of the following:
benomyl, carbendazim
DMI - any product or mixture containing one or more of the following:
bromuconazole, cyproconazole, difenoconazole, epoxiconazole, fenbuconazole, flusilazole, flutriafol, fluquinconazole, metconazole, prochloraz, propiconazole, tebuconazole, tetraconazole, triadimefon, triadimenol
Morpholine - any product or mixture containing one or more of the following:
fenpropidin, fenpropimorph, tridemorph, spiroxamine
Strobilurin - any product or mixture containing one or more of the following:
azoxystrobin, kresoxim-methyl, picoxystrobin, pyraclostrobin, trifloxystrobin

27

28
Results and discussion
Detailed data for 2002 are presented in tables in the Appendix (pages 39-67) and without comment. Selected data for the key diseases and agronomic factors are presented in the following histograms, together with data from the previous four years to set the current results in context. The term disease incidence means either the percentage of crops or stems affected; whereas disease severity refers to the percentage area of leaf or stems covered by disease symptoms. Values of <0.05% are recorded as trace (tr). Data have not been subjected to statistical analysis. A total of 383 samples were received and processed at CSL. The size of the stratified sample used to calculate national means was 312. National severity of foliar and stem disease
Although levels were lower than in 2001 leaf blotch (Rhynchosporium secalis) was for the fifth consecutive year the major foliar disease. No other disease exceeded levels of 0.7% average area leaf 2 affected. Brown rust (Puccinia hordei) was the second most severe disease followed by net blotch (Pyrenophora teres) and mildew (Blumeria graminis) (Fig. 2).
0
1
2
3
4
5
6
1998 1999 2000 2001 2002
Year
Mildew
Net blotch
Leaf blotch
Brown rust
Fig. 2 National foliar disease levels (mean % area leaf 2 affected)

29
Eyespot (Tapesia spp; anamorph Pseudocercosporella herpotrichoides) was more severe than in 2001. Since 1990, levels were only less damaging in 1990 and 2001. The combined incidences of moderate and severe lesions was 4.5% stems affected compared with 1.5% in 2001 (Fig. 3).
0
2
4
6
8
10
12
14
16
18
1998 1999 2000 2001 2002
Year
Slight
Moderate
Severe
Fig. 3 National levels of eyespot (mean % stems affected) The mean level of moderate and severe sharp eyespot (Rhizoctonia cerealis), at 1.6% of stems affected, was higher than in 2001. Severe lesions were more apparent than in recent surveys (Fig. 4).
0
0.5
1
1.5
2
2.5
3
1998 1999 2000 2001 2002
Year
% s
tem
s af
fect
ed
SlightModerateSevere
Fig. 4 National levels of sharp eyespot (mean % stems affected)

30
The proportion of crops with visible BYDV symptoms was higher than in any survey since 1995 with 25% of crops displaying symptoms. Patches of BYDV were recorded in 9% of crops (Fig. 5).
02468
1012141618
1998 1999 2000 2001 2002
Year
% c
rops
aff
ecte
d
1234
Fig. 5 National levels of BYDV (% crops in each category, see p 25) Regional disease severity The highest levels of mildew were recorded in the northern regions. Net blotch was most severe in the South West (1.5% average area leaf 2 affected). The severity of brown rust was highest in the North East and East Midlands regions, affecting on average 1.5 and 1.1% of the area of leaf 2. Leaf blotch was most severe in the North West, South East, Wales and South West regions and least severe in Eastern region (Fig. 6). Leaf blotch affected all samples from the North West and South East regions and did not fall below 85% in any of the other regions.
0
1
2
3
4
5
6
NE NW Y&H EM WM EAST SE SW WALES
Region
% le
af a
rea
affe
cted
MildewNet blotchLeaf blotchBrown rust
Fig. 6 Regional foliar diseases levels (mean % area leaf 2)

31
The lowest levels of damaging eyespot (moderate + severe symptoms) were recorded in the East and the highest levels in samples from the North West and West Midlands regions. Severe eyespot was not recorded in samples from East, South East or South West regions (Fig. 7).
0
2
4
6
8
10
12
14
16
18
20
NE NW Y&H EM WM EAST SE SW WALES
Region
Slight
Moderate
Severe
Fig. 7 Regional eyespot levels (mean % stems affected) Levels of sharp eyespot were highest in the North West and Wales and lowest in the Eastern regions (Fig. 8).
0
0.5
1
1.5
2
2.5
3
3.5
4
4.5
5
NE NW Y&H EM WM EAST SE SW WALES
Region
Slight
Moderate
Severe
Fig. 8 Regional levels of sharp eyespot (mean % stems affected)

32
Effect of cultivar on disease severity
Two cultivars Pearl and Regina dominated the national sample with 35% and 19% respectively, next came Siberia with 9%. Of the six most popular cultivars in the stratified sample, the highest level of leaf blotch was recorded on Regina with an average of 4.8% of the area of leaf 2 affected and the lowest on Pearl with 1.6%. Brown rust was most severe on Siberia, affecting 1.8% average area of leaf 2. The highest net blotch levels were found on Jewel with 1.4% average area of leaf 2 affected and the highest mildew levels of 1.5% were recorded Heligan (Fig. 9).
0
1
2
3
4
5
6
Pearl Regina Siberia Heligan Jewel Antonia
Cultivar
Mildew
Net blotch
Leaf blotch
Brown rust
Fig. 9 Foliar diseases on main cultivars (mean % area leaf 2)
Fungicide use
Eighty eight per cent of crops received fungicide applications aimed at GS 31 (Fig. 10). Crops received on average 1.7 fungicide applications, slightly more than in any previous survey. Twenty nine per cent of crops received a single spray and 58% were sprayed twice, mainly at GS 31, with the second spray at or after GS 37.

33
0
20
40
60
80
100
1998 1999 2000 2001 2002
Year
Autumn
GS 31
GS 37 +
Fig. 10 Per cent crops sprayed in autumn or early spring (< GS 29), at GS 31 and at GS 37
onwards Herbicide use
Autumn applied post emergence applications dominated herbicide usage (Fig. 11). The main active ingredients used in the autumn were isoproturon and diflufenican used on 91% and 46% of crops treated at this time respectively. Fluroxypyr and metsulfuron-methyl were used on 35% and 30% of crops treated in the spring respectively. Sixteen per cent of farmers intended to use a pre-harvest glyphosate spray on their crops, continuing the upward trend seen since 1996.
0
20
40
60
80
100
1998 1999 2000 2001 2002
Year
Pre-drilling
Pre-emergence
Post-em (a)
Post-em (s)
Pre-harvest glyphosate
(Post-em (a) - post-emergence in the autumn, Post-em (s) - post-emergence in the spring)
Fig. 11 Timing of herbicide applications (% crops sprayed)

34
Insecticide use
Seventy six per cent of crops were treated with an insecticide, the highest figure since 1996. The percentage crops sprayed in the autumn increased compared with 2001, mainly due to warmer and dryer weather conditions conducive to earlier drilling and increased insect activity. The majority of crops receiving autumn applications were treated with a pyrethroid insecticide (Fig. 12).
0
20
40
60
80
1998 1999 2000 2001 2002
Year
% c
rops
spr
ayed
AutumnSpringSummer
Fig. 12 Percentage crops treated with an insecticide in autumn, spring or summer There were indications of a slight reduction in the incidence of BYDV symptoms in crops which received a pyrethroid spray in the autumn (23.7% for treated crops compared with 27.3% for untreated). Patches of BYDV were seen less often in treated crops (Fig. 13).
0
2
4
6
8
10
12
14
16
18
1 2 3 4
Category
Unsprayed
Sprayed
Fig. 13 Effect of pyrethroids applied in the autumn on BYDV

35
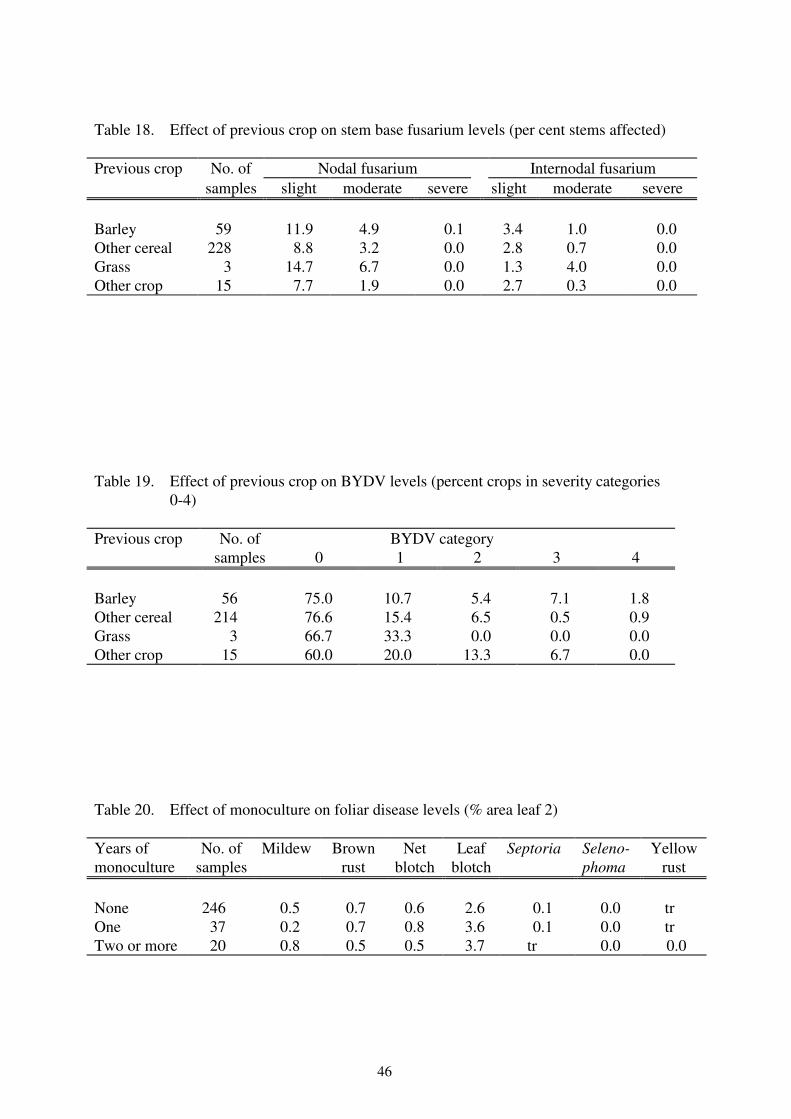
Previous cropping
Higher levels of powdery mildew and brown rust occurred in crops following grass than a cereal or other crop. More eyespot and sharp eyespot was found following a crop other than grass or cereal.
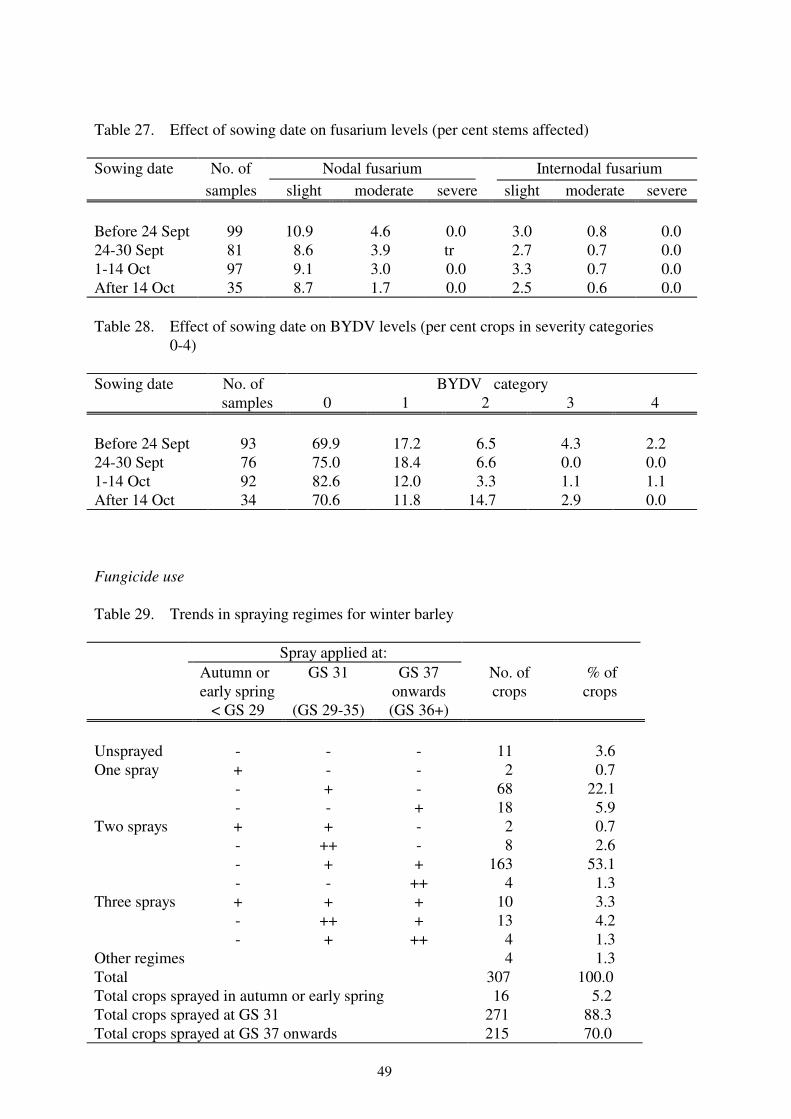
Sowning dates The majority of crops were sown before 1 October, reversing the trend of the last two surveys. The highest percentage of crops were sown before 24 September (Fig. 14). Brown rust was most severe in crops sown before 24 September and powdery mildew was most severe in crops sown after 14 October. Both eyespot and fusarium were most prevalent in crops sown before the 24 September.
0
5
10
15
20
25
30
35
40
45
50
1996 1997 1998 1999 2000 2001 2002
Year
< 24 Sep
24-30 Sep
1-14 Oct
> 14 Oct
Fig. 14 Sowing dates of survey crops (%)
36
References and bibliography
Anonymous, 1976. Manual of plant growth stages and disease assessment keys. Harpenden, Central Science Laboratory, MAFF.
Anonymous, 1981-83, 1986-2001. Survey of winter barley diseases in England and Wales. Internal reports, Harpenden, Central Science Laboratory and ADAS, MAFF, DEFRA
Cook RJ, Polley RW, Thomas MR, 1991. Disease-induced losses in winter wheat in England and Wales 1985-1989. Crop Protection 10, 504-508.
King JE, 1972. Surveys of foliar diseases of spring barley in England and Wales, 1967-70. Plant Pathology 21, 23-35.
King JE 1977. Surveys of foliar diseases of spring barley in England and Wales, 1972-75. Plant Pathology 26, 21-29.
Nix J, 2002. Farm management pocket book. Wye, UK: Wye College Press.
Polley RW, King JE, Jenkins JEE, 1993. Surveys of diseases of spring barley in England and Wales, 1976-1980. Annals of Applied Biology 123, 271-285.
Polley RW, Thomas MR, Slough JE, Bradshaw NL, 1993. Surveys of diseases of winter barley in England and Wales, 1981-1991. Annals of Applied Biology 123, 287-307.
Scott PR, Hollins TW, 1974. Effects of eyespot on the yield of winter wheat. Annals of Applied Biology 78, 269-279.
Acknowledgements
We are grateful to the many farmers who co-operated in this survey by allowing samples of their barley crops to be taken, and by providing details of their cultural operations and pesticide use. We also thank ADAS colleagues for the collection of samples and obtaining the field information, and the staff of the Central Science Laboratory for undertaking the disease assessments and data processing. Financial support for this work from Defra is gratefully acknowledged.

37

38
APPENDIX
Tables of results

39
Tables of results Disease incidence and severity Table 1. Incidence of foliar diseases (per cent samples affected) Region No. of Powdery Brown Net Leaf Septoria Seleno Yellow samples mildew rust blotch blotch -phoma rust NE 23 34.8 34.8 39.1 95.7 17.4 0.0 21.7 NW 8 62.5 50.0 50.0 100.0 25.0 0.0 25.0 Y & H 68 51.5 41.2 47.1 86.8 13.2 0.0 4.4 EM 58 31.0 60.3 37.9 93.1 22.4 0.0 3.4 WM 34 44.1 38.2 58.8 97.1 20.6 0.0 0.0 EAST 87 54.0 31.0 55.2 85.1 20.7 0.0 0.0 SE 26 15.4 34.6 57.7 100.0 11.5 0.0 0.0 SW 51 23.5 37.3 49.0 98.0 37.3 0.0 0.0 WALES 27 40.7 29.6 59.3 92.6 44.4 7.4 0.0 National 312 41.0 39.4 50.6 92.6 22.1 0.0 3.2 (stratified) Table 2. National foliar disease levels (per cent leaf area affected) Leaf 1 Leaf 2 Powdery mildew 0.2 0.5 Brown rust 0.4 0.7 Net blotch 0.3 0.7 Rhynchosporium 1.4 2.8 Septoria tr 0.1 Selenophoma 0.0 0.0 Yellow rust tr tr Insect damage 0.4 0.4 Green leaf area 84.5 71.4 tr = trace < 0.05% applies to all tables

40
Table 3. National stem base disease levels (per cent stems affected)
Slight Moderate Severe Eyespot 9.2 4.4 0.1 Sharp eyespot 2.2 1.2 0.4 Nodal Fusarium 9.5 3.6 tr Internodal Fusarium 3.0 0.7 0.0 All Fusarium 11.3 4.1 tr Table 4. National BYDV levels BYDV category
Total with
BYDV 0 1 2 3 4 Number of crops (2001) 237 27 3 3 0 33 Percent of total (2001) 87.8 10.0 1.1 1.1 0.0 12.2 Number of crops (2002) 222 45 19 6 3 73 Percent of total (2002) 75.3 15.3 6.4 2.0 1.0 24.7 Regional disease incidence and seventy Table 5. Incidence of stem base diseases and insect damage (per cent samples affected) Region No. of Insect Eyespot Sharp Fusarium samples damage eyespot NE 23 82.6 73.9 43.5 78.3 NW 8 75.0 75.0 87.5 87.5 Y & H 68 86.8 79.4 36.8 91.2 EM 58 91.4 75.9 39.7 84.5 WM 34 88.2 91.2 50.0 85.3 EAST 87 90.8 63.2 27.6 81.6 SE 26 88.5 80.8 34.6 92.3 SW 51 82.4 72.5 56.9 78.4 WALES 27 85.2 85.2 44.4 81.5 National 312 87.8 75.3 42.0 84.9 (stratified)

41
Table 6. Regional foliar disease levels (per cent area leaf 2 affected) Region No. of Powdery Brown Net Leaf Septoria Seleno Yellow samples mildew rust blotch blotch -phoma rust NE 23 1.8 1.5 0.2 3.1 tr 0.0 tr NW 8 3.3 0.3 0.9 4.8 tr 0.0 0.0 Y & H 68 0.6 0.9 0.5 2.7 tr 0.0 tr EM 58 0.4 1.1 0.5 1.6 0.1 0.0 tr WM 34 0.3 1.0 0.8 3.5 0.1 0.0 0.0 EAST 87 0.1 0.4 0.3 1.5 tr 0.0 0.0 SE 26 tr 0.3 0.4 3.9 tr 0.0 0.0 SW 51 0.2 0.5 1.5 3.7 0.1 0.0 0.0 WALES 27 0.1 0.1 0.4 3.8 0.2 tr 0.0 National 312 0.5 0.7 0.7 2.8 0.1 0.0 tr (stratified) Table 7. Regional and national eyespot levels (per cent stems affected) Region No. of Eyespot samples slight moderate severe NE 23 10.1 5.4 0.2 NW 8 18.5 12.5 0.5 Y & H 68 11.0 4.4 0.2 EM 58 6.8 3.4 0.3 WM 34 12.7 10.4 0.2 EAST 87 6.7 2.4 0.0 SE 26 8.0 2.9 0.0 SW 51 10.1 3.5 0.0 WALES 27 12.6 5.0 0.3 National 312 9.2 4.4 0.1 (stratified)

42
Table 8. Regional and national sharp eyespot levels (per cent stems affected) Region No. of samples Sharp eyespot slight moderate severe NE 23 1.0 1.2 0.2 NW 8 4.5 3.0 1.0 Y & H 68 2.2 0.6 0.5 EM 58 2.7 1.6 0.4 WM 34 2.2 1.8 0.1 EAST 87 1.4 0.4 0.2 SE 26 1.8 0.8 0.2 SW 51 3.0 1.3 0.9 WALES 27 2.4 2.4 0.1 National 312 2.2 1.2 0.4 (stratified) Table 9. Regional and national stem base fusarium levels (per cent stems affected). Region No of Nodal fusarium Internodal fusarium Samples slight moderate severe slight moderate severe NE 23 7.0 2.1 0.0 3.0 0.3 0.0 NW 8 6.0 1.0 0.0 2.5 0.0 0.0 Y & H 68 10.9 4.8 0.0 3.5 1.5 0.0 EM 58 8.6 3.9 0.0 3.2 0.6 0.0 WM 34 11.2 3.5 0.0 2.9 0.1 0.0 EAST 87 10.2 4.0 tr 3.2 1.0 0.0 SE 26 9.7 4.2 0.0 2.3 1.2 0.0 SW 51 8.4 2.4 0.0 2.5 0.5 0.0 WALES 27 8.1 1.9 0.0 3.1 0.3 0.0 National 312 9.5 3.6 tr 3.0 0.7 0.0 (stratified)

43
Cultivars and disease Table 10. Distribution of cultivars between regions (number of samples) Region Cultivar Pearl Regina Siberia Heligan Jewel Antonia Other NE 4 11 1 1 0 0 5 NW 1 1 1 3 0 0 2 Y & H 19 12 9 8 3 1 15 EM 19 11 7 4 2 1 14 WM 12 10 2 3 3 0 4 EAST 48 13 6 1 3 1 14 SE 11 3 4 1 2 3 2 SW 16 5 3 1 5 10 9 WALES 3 6 3 1 1 2 6 National % 35 19 9 6 5 5 20 (stratified) Table 11. Foliar disease levels for the main cultivars sampled (% area leaf 2) Cultivar No. of
samples Mildew Brown
rust Net
blotch Leaf
blotch Septoria Seleno -
phoma Yellow
rust Pearl 110 0.1 0.6 0.5 1.6 0.1 0.0 tr Regina 59 0.9 0.1 0.9 4.8 tr 0.0 tr Siberia 29 0.1 1.8 1.2 1.6 0.2 0.0 tr Heligan 20 1.5 1.0 0.8 2.8 tr 0.0 0.0 Jewel 17 0.2 0.3 1.4 3.0 0.1 0.0 0.0 Antonia 16 0.1 0.1 0.1 2.9 0.2 0.0 0.0

44
Table 12. Eyespot levels for the main cultivars (per cent stems affected) Cultivar No. of Eyespot samples slight moderate severe Pearl 110 8.6 4.6 0.1 Regina 59 9.8 4.5 0.1 Siberia 29 6.6 3.4 0.0 Heligan 20 9.4 2.6 0.4 Jewel 17 10.8 2.8 0.0 Antonia 16 8.3 4.5 0.0 Table 13. Sharp eyespot levels on the main cultivars (per cent stems affected) Cultivar No. of Sharp eyespot samples slight moderate severe Pearl 110 2.1 1.2 0.5 Regina 59 3.0 1.3 0.3 Siberia 29 1.2 0.4 0.1 Heligan 20 2.4 1.8 0.8 Jewel 17 2.1 1.2 0.9 Antonia 16 3.3 1.0 0.0 Table 14. Stem base fusarium levels on the main cultivars (per cent stems affected) Cultivar No. of
samples Nodal fusarium
Internodal fusarium
slight moderate severe slight moderate severe Pearl 110 8.9 2.8 0.0 3.2 0.7 0.0 Regina 59 10.2 3.9 0.0 2.8 0.9 0.0 Siberia 29 8.1 7.0 0.0 4.3 0.8 0.0 Heligan 20 16.6 7.0 0.0 4.4 1.2 0.0 Jewel 17 8.0 1.2 0.0 1.4 0.5 0.0 Antonia 16 7.3 3.3 0.0 2.3 0.0 0.0
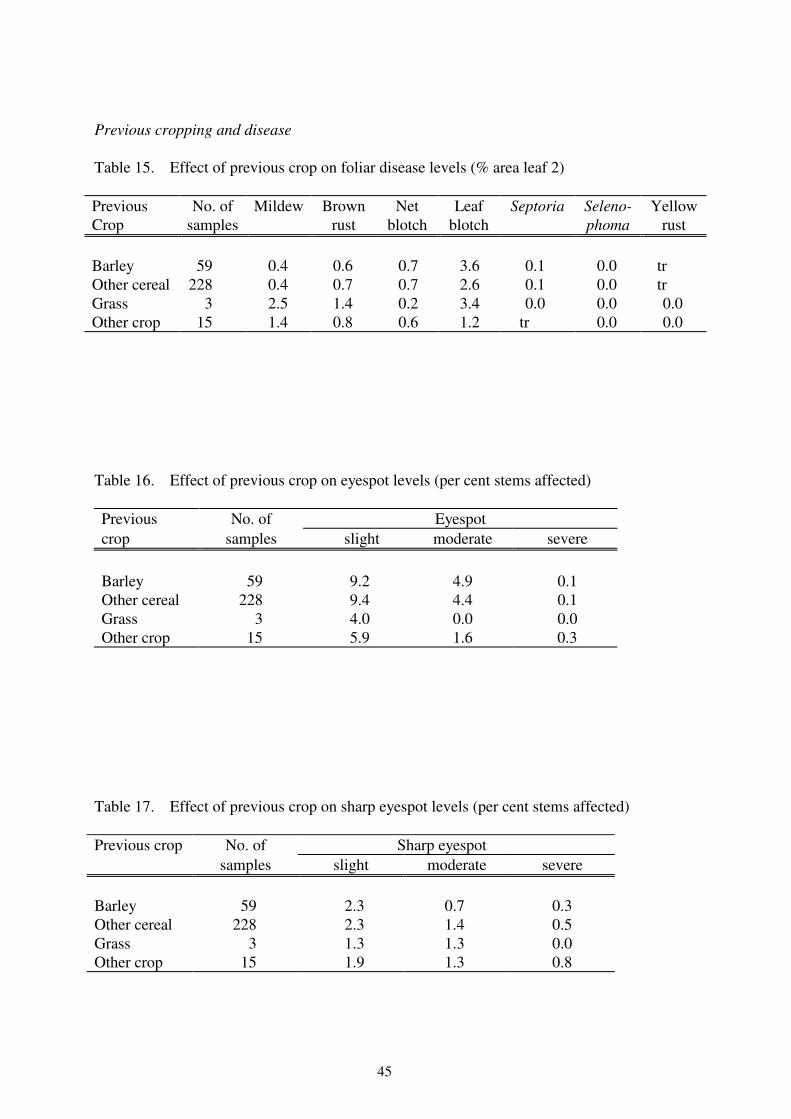
45
Previous cropping and disease Table 15. Effect of previous crop on foliar disease levels (% area leaf 2) Previous Crop
No. of samples
Mildew Brown rust
Net blotch
Leaf blotch
Septoria Seleno-phoma
Yellow rust
Barley 59 0.4 0.6 0.7 3.6 0.1 0.0 tr Other cereal 228 0.4 0.7 0.7 2.6 0.1 0.0 tr Grass 3 2.5 1.4 0.2 3.4 0.0 0.0 0.0 Other crop 15 1.4 0.8 0.6 1.2 tr 0.0 0.0 Table 16. Effect of previous crop on eyespot levels (per cent stems affected) Previous No. of Eyespot crop samples slight moderate severe Barley 59 9.2 4.9 0.1 Other cereal 228 9.4 4.4 0.1 Grass 3 4.0 0.0 0.0 Other crop 15 5.9 1.6 0.3
Table 17. Effect of previous crop on sharp eyespot levels (per cent stems affected) Previous crop No. of Sharp eyespot
samples slight moderate severe Barley 59 2.3 0.7 0.3 Other cereal 228 2.3 1.4 0.5 Grass 3 1.3 1.3 0.0 Other crop 15 1.9 1.3 0.8
46
Table 18. Effect of previous crop on stem base fusarium levels (per cent stems affected) Previous crop No. of Nodal fusarium Internodal fusarium samples slight moderate severe slight moderate severe Barley 59 11.9 4.9 0.1 3.4 1.0 0.0 Other cereal 228 8.8 3.2 0.0 2.8 0.7 0.0 Grass 3 14.7 6.7 0.0 1.3 4.0 0.0 Other crop 15 7.7 1.9 0.0 2.7 0.3 0.0
Table 19. Effect of previous crop on BYDV levels (percent crops in severity categories
0-4) Previous crop No. of BYDV category
samples 0 1 2 3 4 Barley 56 75.0 10.7 5.4 7.1 1.8 Other cereal 214 76.6 15.4 6.5 0.5 0.9 Grass 3 66.7 33.3 0.0 0.0 0.0 Other crop 15 60.0 20.0 13.3 6.7 0.0 Table 20. Effect of monoculture on foliar disease levels (% area leaf 2) Years of monoculture
No. of samples
Mildew Brown rust
Net blotch
Leaf blotch
Septoria Seleno-phoma
Yellow rust
None 246 0.5 0.7 0.6 2.6 0.1 0.0 tr One 37 0.2 0.7 0.8 3.6 0.1 0.0 tr Two or more 20 0.8 0.5 0.5 3.7 tr 0.0 0.0

47
Table 21. Effect of monoculture on eyespot levels (% stems affected) Years of No. of Eyespot monoculture samples slight moderate severe None 246 9.1 4.1 0.1 One 37 9.3 5.3 0.1 Two or more 20 9.6 4.6 0.0 Table 22. Effect of monoculture on sharp eyespot levels (% stems affected) Years of No. of Sharp eyespot monoculture samples slight moderate severe None 246 2.2 1.4 0.5 One 37 2.7 0.8 0.5 Two or more 20 1.8 0.6 0.0 Table 23. Effect of monoculture on stem base fusarium levels (% stems affected) Years of No. of Nodal fusarium Internodal fusarium monoculture samples slight moderate severe slight moderate severe None 246 8.8 3.2 0.0 2.7 0.7 0.0 One 37 11.7 4.3 0.0 3.9 1.1 0.0 Two or more 20 13.2 6.6 0.2 2.4 1.0 0.0

48
Effect of sowing date and disease Table 24. Effect of sowing date on foliar disease levels (% area leaf 2) Sowing No. of Mildew Brown Net Leaf Septoria Seleno Yellow date samples rust blotch blotch -phoma rust Before 24 Sep 99 0.2 1.2 0.5 2.9 tr 0.0 tr 24-30 Sep 81 0.2 0.7 0.7 3.0 0.1 0.0 tr 1-14 Oct 97 0.5 0.1 0.9 2.1 0.1 0.0 tr After 14 Oct 35 1.8 0.5 0.6 3.7 tr 0.0 0.0 Table 25. Effect of sowing date on eyespot levels (per cent stems affected) Sowing No. of Eyespot date samples slight moderate severe Before 24 Sept 99 12.2 6.2 0.2 24-30 Sept 81 8.7 4.0 0.0 1-14 Oct 97 8.2 4.0 0.1 After 14 Oct 35 4.9 1.0 0.0 Table 26. Effect of sowing date on sharp eyespot levels (per cent stems affected) Sowing date No. of Sharp eyespot samples slight moderate severe Before 24 Sept 99 2.5 1.5 0.7 24-30 Sept 81 2.4 1.4 0.4 1-14 Oct 97 1.8 0.7 0.2 After 14 Oct 35 2.2 1.4 0.5
49
Table 27. Effect of sowing date on fusarium levels (per cent stems affected) Sowing date No. of Nodal fusarium Internodal fusarium samples slight moderate severe slight moderate severe Before 24 Sept 99 10.9 4.6 0.0 3.0 0.8 0.0 24-30 Sept 81 8.6 3.9 tr 2.7 0.7 0.0 1-14 Oct 97 9.1 3.0 0.0 3.3 0.7 0.0 After 14 Oct 35 8.7 1.7 0.0 2.5 0.6 0.0 Table 28. Effect of sowing date on BYDV levels (per cent crops in severity categories 0-4) Sowing date No. of BYDV category
samples 0 1 2 3 4 Before 24 Sept 93 69.9 17.2 6.5 4.3 2.2 24-30 Sept 76 75.0 18.4 6.6 0.0 0.0 1-14 Oct 92 82.6 12.0 3.3 1.1 1.1 After 14 Oct 34 70.6 11.8 14.7 2.9 0.0 Fungicide use Table 29. Trends in spraying regimes for winter barley
Spray applied at: Autumn or
early spring GS 31
GS 37
onwards No. of crops
% of crops
< GS 29 (GS 29-35) (GS 36+) Unsprayed - - - 11 3.6 One spray + - - 2 0.7 - + - 68 22.1 - - + 18 5.9 Two sprays + + - 2 0.7 - ++ - 8 2.6 - + + 163 53.1 - - ++ 4 1.3 Three sprays + + + 10 3.3 - ++ + 13 4.2 - + ++ 4 1.3 Other regimes 4 1.3 Total 307 100.0 Total crops sprayed in autumn or early spring 16 5.2 Total crops sprayed at GS 31 271 88.3 Total crops sprayed at GS 37 onwards 215 70.0

50
Table 30. Fungicide use: recorded occasions when fungicides were applied at GS 31 Spray timing Fungicide Active ingredient 1st 2nd 3 or
more Acanto picoxystrobin 114 19 1 Amistar azoxystrobin 34 5 0 Amistar Pro azoxystrobin/fenpropimorph 19 0 0 Apres quinoxyfen 1 0 0 BAS 493F epoxiconazole/fenpropimorph/kresoxim-methyl 5 0 0 Bavistin FL carbendazim 1 0 0 Belvedere fenpropimorph/propiconazole 1 0 0 Bumper 250 EC propiconazole 3 1 0 Bumper P prochloraz/propiconazole 2 0 0 Carbendazim carbendazim 1 0 0 Charisma famoxadone/flusilazole 10 1 0 Colstar fenpropimorph/flusilazole 14 1 0 Contrast carbendazim/flusilazole 1 0 0 Corbel fenpropimorph 13 2 0 Eclipse epoxiconazole/fenpropimorph 17 1 0 Eminent tetraconazole 1 0 0 Ensign fenpropimorph/kresoxim-methyl 2 0 0 Epic epoxiconazole 4 0 0 Fenpropimorph fenpropimorph 1 0 0 Foil fluquinconazole/prochloraz 3 0 0 Folicur tebuconazole 3 0 0 Fortress quinoxyfen 1 0 0 Granit bromuconazole 1 0 0 Hispor 45 WP carbendazim/propiconazole 1 0 0 Landmark epoxiconazole/kresoxim-methyl 5 0 0 Lyric flusilazole 4 1 0 ME2 After quinoxyfen 1 0 0 Mantra epoxiconazole/fenpropimorph/kresoxim-methyl 15 1 0 Mastiff epoxiconazole/fenpropimorph/kresoxim-methyl 1 0 0 Medley famoxadone/flusilazole 1 0 0 Menara cyproconazole/propiconazole 3 0 0 Mistral fenpropimorph 1 1 0 Monicle fenpropidin/tebuconazole 3 0 0 Neon spiroxamine 2 0 0 Opera epoxiconazole/pyraclostrobin 1 0 0 Opus epoxiconazole 31 9 0 Opus Team epoxiconazole/fenpropimorph 3 0 1

51
Table 30 (cont). Fungicide use: recorded occasions when fungicides were applied at GS 31
Spray Timing Fungicide Active ingredient 1st 2nd 3 or
more Orka fenpropimorph/quinoxyfen 1 0 0 Pluton fenpropimorph/flusilazole 3 0 0 Poraz prochloraz 3 1 0 Prochloraz prochloraz 1 0 0 Prophet fenpropidin/propiconazole 1 0 0 Punch C carbendazim/flusilazole 4 0 0 Radius cyproconazole/cyprodinil 20 3 0 Sphere cyproconazole/trifloxystrobin 2 0 0 Standon Azoxystrobin azoxystrobin 1 0 0 Swift SC trifloxystrobin 8 0 0 Tern fenpropidin 1 0 0 Torch spiroxamine 1 0 0 Twist trifloxystrobin 2 2 0 Unix cyprodinil 77 14 0 Vivid pyraclostrobin 1 0 0 Zenon spiroxamine 0 2 0 Unspecified fungicides 2 0 0 Total 452 64 2

52
Table 31. Fungicide use: recorded occasions when fungicide groups were applied at GS 31 Spray timing Fungicide group 1st 2nd 3 or
more Amine 3 2 0 Benzimidazole 2 0 0 Benzimidazole/conazole 6 0 0 Conazole 47 11 0 Conazole/conazole 3 0 0 Conazole/imidazole 3 0 0 Conazole/morpholine 20 1 1 Conazole/morpholine/strobilurin 21 1 0 Conazole/pyrimidine 20 3 0 Conazole/strobilurin 8 0 0 Imidazole 4 1 0 Imidazole/conazole 2 0 0 Morpholine 15 3 0 Morpholine/conazole 18 1 0 Morpholine/quinoline 1 0 0 Morpholine/strobilurin 2 0 0 Oxazolidinedione/conazole 11 1 0 Piperidine 1 0 0 Piperidine/conazole 4 0 0 Pyrimidine 77 14 0 Quinoline 3 0 0 Strobilurin 160 26 1 Strobilurin/morpholine 19 0 0 Unspecified 2 0 0 Total 452 64 2

53
Table 32. Fungicide use: recorded occasions when fungicides were applied at GS 37 onwards Spray timing Fungicide Active ingredient 1st 2nd 3 or
more Acanto picoxystrobin 1 39 8 Amistar azoxystrobin 8 72 13 Amistar Pro azoxystrobin/fenpropimorph 1 18 0 BAS 493F epoxiconazole/fenpropimorph/kresoxim-methyl 1 0 0 Boscor fenpropidin/fenpropimorph 0 1 0 Bumper 250 EC propiconazole 0 1 1 Caddy 240 EC cyproconazole 0 1 0 Capitan 40 flusilazole 0 1 0 Caramba metconazole 0 6 3 Charisma famoxadone/flusilazole 1 2 1 Cleancrop EPX epoxiconazole 0 2 0 Colstar fenpropimorph/flusilazole 3 9 2 Contrast carbendazim/flusilazole 1 1 0 Corbel fenpropimorph 1 12 0 Eclipse epoxiconazole/fenpropimorph 2 6 0 Ensign fenpropimorph/kresoxim-methyl 1 1 0 Epic epoxiconazole 0 8 0 Folicur tebuconazole 0 2 3 Fortress quinoxyfen 0 0 1 Genie flusilazole 0 2 0 Granit bromuconazole 1 0 0 Landmark epoxiconazole/kresoxim-methyl 0 3 2 Lyric flusilazole 0 1 0 Mantra epoxiconazole/fenpropimorph/kresoxim-methyl 0 10 2 Medley famoxadone/flusilazole 1 0 0 Menara cyproconazole/propiconazole 0 0 1 Mirage 40 EC prochloraz 0 1 0 Mistral fenpropimorph 0 1 0 Monicle fenpropidin/tebuconazole 0 2 0 Opera epoxiconazole/pyraclostrobin 1 0 0 Opus epoxiconazole 1 52 9 Opus Team epoxiconazole/fenpropimorph 1 3 0 Prophet fenpropidin/propiconazole 0 1 0 Punch C carbendazim/flusilazole 0 1 0 Radius cyproconazole/cyprodinil 2 9 1 Sanction flusilazole 0 4 0 Silvacur tebuconazole/triadimenol 0 0 1 Sphere cyproconazole/trifloxystrobin 0 1 0 Swift SC trifloxystrobin 0 3 0 Torch spiroxamine 2 1 0 Tucana pyraclostrobin 0 2 1

54
Table 32 (cont). Fungicide use: recorded occasions when fungicides were applied at GS 37 onwards
Spray timing Fungicide Active ingredient 1st 2nd 3 or
more Unix cyprodinil 2 6 1 Veto F tebuconazole/triadimenol 0 1 0 Zenon spiroxamine 0 1 1 Unspecified fungicides 0 2 0 Total 31 289 51 Table 33. Fungicide use: recorded occasions when fungicide group were applied at GS
37 onwards Spray timing Fungicide group 1st 2nd 3rd or
more Amine 2 2 1 Benzimidazole/conazole 1 2 0 Conazole 2 81 17 Conazole/conazole 0 0 1 Conazole/morpholine 3 9 0 Conazole/morpholine/strobilurin 1 10 2 Conazole/pyrimidine 2 9 1 Conazole/strobilurin 1 4 2 Imidazole 0 1 0 Morpholine 1 13 0 Morpholine/conazole 3 9 2 Morpholine/strobilurin 1 1 0 Oxazolidinedione/conazole 2 2 1 Piperidine/conazole 0 3 0 Piperidine/morpholine 0 1 0 Pyrimidine 2 6 1 Quinoline 0 0 1 Strobilurin 9 116 22 Strobilurin/morpholine 1 18 0 Unspecified 0 2 0 Total 31 289 51

55
Seed source and treatments Table 34. Seed origin Seed % of crops Not treated Treated All crops Certified 0.9 (2) 99.1 (222) 75.4 (224) Farm saved 15.1 (11) 86.1 (62) 24.6 (73) Total 4.4 (13) 95.6 (284) 100.0 (297) Number of crops in parentheses. Table 35. Frequency of use of seed treatments Seed treatment Active ingredients No. of
crops % crops
Anchor ST carboxin/thiram 20 6.7 Baytan fuberidazole/triadimenol 15 5.0 Baytan Secur fuberidazole/imidacloprid/triadimenol 3 1.0 Beret Gold fludioxonil 18 6.0 Ferrax ethirimol/flutriafol/thiabendazole 9 3.0 Latitude silthiofam 1 0.3 Panoctine guazatine 5 1.7 Panoctine Plus guazatine/imazalil 2 0.7 Ravine guazatine 4 1.3 Raxil tebuconazole 2 0.7 Raxil S tebuconazole/triazoxide 152 51.0 Raxil Secur imidacloprid/tebuconazole/triazoxide 21 7.0 Robust imazalil/triticonazole 8 2.7 Sibutol bitertanol/fuberidazole 1 0.3 Sibutol Secur bitertanol/fuberidazole/imidacloprid 1 0.3 Sphinx imazalil 3 1.0 Unknown brands 23 7.7 Untreated 13 4.4

56
Herbicide use Table 36. Summary of herbicide use in winter barley
Spray applied at: Pre-
drilling Pre-
emergence Autumn Spring
(1st spray) Spring
(2nd spray) No. of
crops
% of crops
Unsprayed - - - - - 11 3.6 One spray - - + - - 120 38.8
- - - + - 23 7.4 Two sprays + - + - - 11 3.6
- + + - - 9 2.9 - - ++ - - 5 1.6 - - + + - 69 22.3 - - - + + 12 3.9
Three sprays + + + - - 4 1.3 + - + + - 6 1.9 - + + + - 5 1.6 - - ++ + - 3 1.0 - - + + + 13 4.2 Four sprays + + + + - 3 1.0 + - + + + 3 1.0 Other regimes 12 3.9 Total 309 100 Total number of crops treated pre-drilling 33 10.7 Total number of crops treated pre-emergence 24 7.8 Total number of crops treated in the autumn (post emergence) 256 82.8 Total number of crops treated in the spring (post emergence) 146 47.2 Total number of crops treated with a pre-harvest glyphosate (intended) 1048 15.5

57
Table 37. Herbicide usage: recorded occasions when herbicides were applied as pre-emergence sprays. Herbicide Number of sprays Atlas Fieldgard 1 Avadex BW Granular 1 Avadex Excel 15G 13 Claymore 1 Crystal 2 Ice 1 Isotop SC + Treflan 1 Prebane 2 Tolugan 700 + Trifluralin 1 Treflan 1 Total 24

58
Table 38. Herbicide use: recorded occasions when herbicides were applied in the autumn Herbicide Active ingredient Number of
applications Aligran WDG isoproturon 4 Alpha Briotril 24/16 bromoxynil/ioxynil 1 Alpha Chlortoluron 500 chlorotoluron 1 Alpha Protugan Plus isoproturon/simazine 3 Ardent diflufenican/trifluralin 14 Arelon 2 isoproturon 5 Arelon 500 isoproturon 10 Atlas Fieldgard isoproturon 2 Atol chlorotoluron 1 Autumn Kite isoproturon/trifluralin 2 Avadex BW Granular tri-allate 1 Avadex Excel 15G tri-allate 4 Bacara diflufenican/flurtamone 12 Barclay Guideline 500 isoproturon 2 Bison isoproturon 1 Bison 83 WG isoproturon 3 Bolero diflufenican/terbuthylazine 1 CMPP mecoprop 2 Capture bromoxynil/diflufenican/ioxynil 1 Chlorotoluron chlorotoluron 2 Claymore pendimethalin 2 Clayton Fenican 625 diflufenican/isoproturon 2 Compitox Extra mecoprop 1 Compitox Plus mecoprop-p 4 Cordelia isoproturon 5 Corniche diclofop-methyl/fenoxaprop-p-ethyl 8 Crystal flufenacet/pendimethalin 1 Dagger imazamethabenz-methyl 2 Diflufenican/isoproturon diflufenican/isoproturon 1 Duplosan 500 mecoprop-p 1 Duplosan KV mecoprop-p 3 Duplosan New System CMPP
mecoprop-p 1
Encore isoproturon/pendimethalin 7 Fieldgard isoproturon 4 Foundation dicamba/mecoprop-p 2 Graduate diflufenican/flurtamone 7 Grasp tralkoxydim 2 Grenadier diflufenican/isoproturon 2 Harlequin 500 SC isoproturon/simazine 7 Headland Swift dicamba/mecoprop-p 1 IPU isoproturon 110

59
Table 38. (cont) Herbicide use: recorded occasions when herbicides were applied in the autumn
Herbicide Active ingredient Number of
applications Ingot diflufenican/flurtamone/isoproturon 8 Inter-Pendimethalin pendimethalin 1 Isoguard isoproturon 3 Isoproturon isoproturon 3 Javelin diflufenican/isoproturon 11 Javelin Gold diflufenican/isoproturon 16 Jolt isoproturon/pendimethalin 1 MSS Optica mecoprop-p 2 Merit pendimethalin/simazine 6 Optica mecoprop-p 1 Panther diflufenican/isoproturon 42 Picomax pendimethalin/picolinafen 4 Picona pendimethalin/picolinafen 5 Picopro pendimethalin/picolinafen 4 Plinth pendimethalin 3 Protugan isoproturon 4 Quantum tribenuron-methyl 2 Quantum 75 DF tribenuron-methyl 1 Stomp 400 SC pendimethalin 48 Stomp Pico pendimethalin/picolinafen 8 Tigress Ultra diclofop-methyl/fenoxaprop-p-ethyl 14 Tolkan Liquid isoproturon 16 Tolugan 700 chlorotoluron 8 Tolugan Extra chlorotoluron/isoproturon 7 Treflan trifluralin 11 Triflur trifluralin 1 Trifluralin trifluralin 9 Trooper flufenacet/pendimethalin 2 Trump isoproturon/pendimethalin 15 Unspecified herbicides 7 Total 508

60
Table 39. Herbicide use: recorded occasions when herbicides were applied in the autumn Active ingredient No. of applications Bromoxynil/diflufenican/ioxynil 1 Bromoxynil/ioxynil 1 Chlorotoluron 12 Chlorotoluron/isoproturon 7 Dicamba/mecoprop-P 3 Diclofop-methyl/fenoxaprop-P-ethyl 22 Diflufenican/flurtamone 19 Diflufenican/flurtamone/isoproturon 8 Diflufenican/isoproturon 74 Diflufenican/terbuthylazine 1 Diflufenican/trifluralin 14 Flufenacet/pendimethalin 3 Imazamethabenz-methyl 2 Isoproturon 172 Isoproturon/pendimethalin 23 Isoproturon/simazine 10 Isoproturon/trifluralin 2 Mecoprop 3 Mecoprop-P 12 Pendimethalin 54 Pendimethalin/picolinafen 21 Pendimethalin/simazine 6 Tralkoxydim 2 Tri-allate 5 Tribenuron-methyl 3 Trifluralin 21 Unspecified herbicides 7 Total 508

61
Table 40. Herbicide use: recorded occasions when herbicides were applied in the spring Herbicide Active ingredient No. of
applications Aligran WDG isoproturon 1 Ally metsulfuron-methyl 28 Arelon 2 isoproturon 2 Aurora carfentrazone-ethyl 1 Avenge 2 difenzoquat 2 Banco bifenox/isoproturon 2 Biplay PX metsulfuron-methyl/tribenuron-methyl 3 Boxer florasulam 6 CMPP mecoprop 2 Capture bromoxynil/diflufenican/ioxynil 2 Chekker amidosulfuron/iodosulfuron-methyl-
sodium 1
Clayton Siptu 50 FL isoproturon 1 Commando flamprop-m-isopropyl 1 Compitox Plus mecoprop-p 2 Cordelia isoproturon 1 Corniche diclofop-methyl/fenoxaprop-p-ethyl 6 DP 911 PX metsulfuron-methyl/tribenuron-methyl 4 DP 911 WSB metsulfuron-methyl/tribenuron-methyl 1 Dagger imazamethabenz-methyl 2 Druid amidosulfuron 2 Duplosan 500 mecoprop-p 1 Duplosan KV mecoprop-p 6 EF1166 fluroxypyr/metosulam 1 Eagle amidosulfuron 12 Finish PX metsulfuron-methyl/thifensulfuron-methyl 3 Grasp tralkoxydim 35 Greencrop Reaper fluroxypyr 1 Greencrop Reaper 2 fluroxypyr 1 IPU isoproturon 11 Ingot diflufenican/flurtamone/isoproturon 3 Javelin diflufenican/isoproturon 1 Javelin Gold diflufenican/isoproturon 2 Jubilee metsulfuron-methyl 2 Jubilee 20 DF metsulfuron-methyl 1 Lorate 20 DF metsulfuron-methyl 2 Mecoprop-P mecoprop-p 1 Optica mecoprop-p 2 Oxytril CM bromoxynil/ioxynil 1 Panther diflufenican/isoproturon 1 Platform S carfentrazone-ethyl/mecoprop-p 1 Pursuit amidosulfuron 1

62
Table 40 (cont). Herbicide use: recorded occasions when herbicides were applied in the spring
Herbicide Active ingredient No. of
applications Quantum tribenuron-methyl 1 Quantum 75 DF tribenuron-methyl 2 Starane 2 fluroxypyr 41 Starane 2 (05496) fluroxypyr 2 Starane Gold florasulam/fluroxypyr 1 Starane XL florasulam/fluroxypyr 1 Tigress Ultra diclofop-methyl/fenoxaprop-p-ethyl 12 Tomahawk fluroxypyr 3 Unspecified herbicides 3 Total 225

63
Table 41. Herbicide use: recorded occasions when herbicides were applied in the spring Active ingredient No. of applications Amidosulfuron 15 Amidosulfuron/iodosulfuron-methyl-sodium 1 Bifenox/isoproturon 2 Bromoxynil/diflufenican/ioxynil 2 Bromoxynil/ioxynil 1 Carfentrazone-ethyl 1 Carfentrazone-ethyl/mecoprop-P 1 Diclofop-methyl/fenoxaprop-P-ethyl 18 Difenzoquat 2 Diflufenican/flurtamone/isoproturon 3 Diflufenican/isoproturon 4 Flamprop-M-isopropyl 1 Florasulam 6 Florasulam/fluroxypyr 2 Fluroxypyr 48 Fluroxypyr/metosulam 1 Imazamethabenz-methyl 2 Isoproturon 16 Mecoprop 2 Mecoprop-P 12 Metsulfuron-methyl 33 Metsulfuron-methyl/thifensulfuron-methyl 3 Metsulfuron-methyl/tribenuron-methyl 8 Tralkoxydim 35 Tribenuron-methyl 3 Unspecified herbicides 3 Total 225

64
Growth regulator use Table 42. Summary of growth regulator use in winter barley Spray applied at: autumn spring spring summer <1/1/02 (to GS 30) (GS 31 GS 35) (GS 36 +) No. of % of crops crops Unsprayed - - - - 79 25.6 One spray - + - - 83 26.9 - - + - 86 27.9 - - - + 7 2.3 Two sprays - + + - 14 4.5 - + - + 19 6.2 - - + + 12 3.9 Three sprays - + + + 3 1.0 Other regimes 5 1.6 Total 308 100.0 Total crops sprayed in autumn 2 0.6 Total crops sprayed in spring to GS 30 122 39.6 Total crops sprayed in spring from GS 31-35 117 38.0 Total crops sprayed in summer GS 36+
42 13.6

65
Table 43. Growth regulators applied to winter barley during the growing season Growth regulator Active ingredient Autumn Spring Spring Summer (<1/1/02) (to GS 30) (GS 31-35) (GS 36+)
Adjust chlormequat 0 4 5 0 Atlas Quintacel chlormequat 0 0 2 0 BASF 3C Chlormequat 720 chlormequat 0 3 0 0 Barclay Holdup chlormequat 0 4 1 0 Barclay Holdup 640 chlormequat 0 1 0 0 Barleyquat B chlormequat 1 7 2 0 Belcocel chlormequat 0 4 1 0 CCC chlormequat 0 2 2 0 CCC 70% chlormequat 0 3 1 0 Cerone 2-chloroethylphosphonic acid 0 0 0 5 3C Chlormequat chlormequat 0 5 4 0 Chlormequat chlormequat 0 52 38 3 Chlormequat 70% chlormequat 0 11 6 0 Chlormequat 700 chlormequat 1 3 3 0 Chlormequat 72 chlormequat 0 7 6 0 Clayton Manquat chlormequat 0 1 0 0 Cyclade chlormequat chloride/
2-chloroethylphosphonic acid /mepiquat chloride
0 0 4 4
Hive chlormequat 0 1 2 0 Manipulator chlormequat 0 6 4 0 Moddus trinexapac-ethyl 0 34 55 1 New 5C Cycocel chlormequat/choline chloride 0 6 9 1 Quadrangle Chlormequat 700
chlormequat 0 0 1 0
Satellite chlormequat/ 2-chloroethylphosphonic acid /imazaquin
0 0 1 0
Stabilan 700 chlormequat 0 1 0 0 Strate chlormequat/
2-chloroethylphosphonic acid 0 0 0 1
Stronghold chlormequat chloride/ mepiquat chloride
0 0 1 0
Sypex chlormequat/ 2-chloroethylphosphonic acid
0 0 1 3
Terpal 2-chloroethylphosphonic acid/ mepiquat
0 0 7 26
Upgrade chlormequat/ 2-chloroethylphosphonic acid
0 1 0 0
Unspecified growth regulator 0 1 0 0 Total of products applied 2 157 156 44

66
Table 44. Growth regulator use Active ingredient No. of applications 2-chloroethylphosphonic acid 5 2-chloroethylphosphonic acid/mepiquat 33 Chlormequat 198 Chlormequat chloride/2-chloroethylphosphonic acid/ mepiquat chloride
8
Chlormequat chloride/mepiquat chloride 1 Chlormequat/2-chloroethylphosphonic acid 6 Chlormequat/2-chloroethylphosphonic acid/imazaquin 1 Chlormequat/choline chloride 16 Trinexapac-ethyl 90 Unspecified growth regulator 1 Total 359 Insecticide use Table 45. Summary of post emergence insecticide use in winter barley Spray applied at: autumn spring summer <1/1/02 (to GS 37) (GS 38 +) No. of % of crops crops Unsprayed - - - 73 23.7 One spray + - - 204 66.2 - + - 8 2.6 Two sprays ++ - - 12 3.9 + + - 3 1.0 + - + 6 2.0 Other regimes 2 0.6 Total 308 100.0 Total crops sprayed in autumn 226 73.4 Total crops sprayed in spring 11 3.6 Total crops sprayed in summer
7 2.3

67
Table 46. Insecticides applied to winter barley during the growing season Insecticide Active ingredient Autumn Spring Summer (<1/1/02) (to GS 37) (GS 38+) Aphox pirimicarb 0 1 0 Arrivo cypermethrin 3 1 0 Barclay Pirimisect pirimicarb 1 0 0 CYREN chlorpyrifos 0 1 0 Chlorpyrifos chlorpyrifos 1 0 0 Cleancrop Acymet alpha-cypermethrin 4 0 1 Cleancrop Pyrimet cypermethrin 1 0 0 Contest alpha-cypermethrin 1 0 0 Cyperguard 100 EC cypermethrin 2 0 0 Cyperkill 10 cypermethrin 4 0 1 Cypermethrin cypermethrin 70 1 0 Decis deltamethrin 1 0 0 Dimethoate dimethoate 0 0 1 Fernpath Banjo cypermethrin 10 2 0 Fury 10 EW zeta-cypermethrin 8 0 1 Hallmark lambda-cyhalothrin 17 0 2 Hallmark With Zeon Technology
lambda-cyhalothrin 10 0 1
IT Cyper cypermethrin 3 0 0 MCC 25 EC cypermethrin 1 0 0 Minuet EW zeta-cypermethrin 6 0 0 Pearl Micro deltamethrin 4 1 0 Permasect C cypermethrin 22 1 0 Starion bifenthrin 3 0 0 Sumi-Alpha esfenvalerate 39 0 0 Toppel 10 cypermethrin 27 3 0 Unspecified insecticide 1 0 0 Total 239 11 7 Table 47. The effect of Pyrethroids applied in the Autumn on levels of BYDV at
sampling (per cent crops in severity categories 0-4) Insecticide group No. of BYDV category crops 0 1 2 3 4 Pyrethroids (+/- others) 211 76.3 15.2 5.7 2.4 0.5 Unsprayed in autumn 77 72.7 15.6 9.1 1.3 1.3 © CSL Crown Copyright