Embed Size (px)
Citation preview

W I N D O W S O N W A S T E
✂
✔
➜
An Elementary, Interdisciplinary, Environmental Studies Activity Guidebookabout Solid Waste and Environmental Issues
★
H E L P C O N T E N T S
1Help Contents Back
▼
▼
1© Ohio Department of Natural Resources Help Contents Back
▼
▼
Bob Taft, Governor • Samuel W. Speck, Director

WIN
DO
WS
ON
WAS
TE2
2© Ohio Department of Natural Resources
Help Contents Back
▼
▼
Help Contents Back
▼
▼
2
How to Obtain Windows on WasteWindows on Waste is made available to educators in Ohio through in-service or partnership programs
sponsored by the Ohio Division of Recycling and Litter Prevention and its local community affiliates. In somesituations print copies of Windows on Waste are made available.
Interested parties should contact their local recycling and litter prevention program or:
Education SpecialistOhio Department of Natural Resources
Division of Recycling and Litter Prevention1889 Fountain Square Court, Bldg. F-2
Columbus, OH 43224
www.ohiodnr.com/recycling
(614) 265-6333
© 1999, Ohio Department of Natural Resources
Educators are encouraged to print and photocopy pages from this CD for the non-commercialpurpose of educational advancement. Any other use or reproduction requires the
written consent of the Ohio Department of Natural Resources,Division of Recycling and Litter Prevention.
Permission has been granted to use the following material included in this CD ROM:
● Lesson V, p. 23: Food Web of the Compost Pile, Browning-Ferris Industries, © 1990
● Lesson V, pp. 26-27, 32: Selections from Worms Eat Our Garbage: Classroom Activities for a BetterEnvironment, Mary Appelhof, © Flower Press, 1993
● Lesson VIII, pp. 21-22: Statistics adapted from the Mineral Information Institute
● Lesson XIII, pp. 16-18: Throw-Away Societies, adapted from A-Way With Waste, Washington StateDepartment of Ecology
Equal Opportunity Employer-M/F/H
Ohio Department of NaturaL ResourcesDivision of Recycling and Litter Prevention

WIN
DO
WS
ON
WAS
TE3
3© Ohio Department of Natural Resources
Help Contents Back
▼
▼
Help Contents Back
▼
▼
WIN
DO
WS
ON
WAS
TECover (p 1)
How to Obtain Windows On Waste (p 2)
Acknowledgements (pp 4-5)
Publicity Flyers (pp 6-7)
Windows on Waste: Designed for Quality Education
Attention: Teachers and Environmental Educators!
Bibliography (p 8)
Help (p 9)
How to Use Windows On Waste (pp 10-13)
Environmental Studies Learning Concepts (pp 14-15)
Curriculum Reference Index (pp 16-23)
Ohio Proficiency Test Learning Outcomes – Grades four and six
Science Outcomes (pp 17-19)
Citizenship Outcomes (pp 19-21)
Mathematics Outcomes (pp 21-22)
Reading and Writing Outcomes (pp 22-23)
School and Community Engagement Index (pp24-25)
LESSON INDEX:
Lesson I– Trashology 101 (pp 26-51)
Activity 1– The Keys to Garbage (pp 30-35)
Activity 2– Garbage Data Pie (pp 36-47)
Activity 3– It Takes a Big Hole (pp 48-51)
Lesson II– Garbage Goods (pp 52-81)
Activity 1– Econo-Community (pp 57-65)
Activity 2– Business Boxes (pp 66-74)
Activity 3– Enterprising Recycling (pp 75-81)
Lesson III– The Paper Factory (pp 82-103)
Activity 1– Papermaking (pp 86-93)
Activity 2– What Sort ofTrash is This Anyway? (pp 94-97)
Activity 3– The Paper Company (pp 98-103)
Lesson IV– This is Your Lifecycle! (pp 104-142)
Activity 1– Lifecycle Bingo (pp 107-124)
Activity 2– Lifecycle Hopscotch (pp 125-142)
Lesson V– Natures’s Way With Waste (pp 144-179)
Activity 1– The Great Cycle (pp 152-158)
Activity 2– Bio-What? That’s Biodegradation! (pp 159-162)
Activity 3– Compost Critters (pp 163-169)
Activity 4– Meet the YIMBYs (pp 170-174)
Activity 5– Compost Jars (pp 175-179)
Lesson VI– Separation Mania (pp 180-187)
Activity – Separation Mania (pp 183-187)
Lesson VII- Techno-Fill (pp 188-208)
Activity 1– Landfill Lingo (pp 193-197)
Activity 2– Does Your Soil Leak? (pp 198-201)
Activity 3– Finer Liner (pp 202-203)
Activity 4– Life…Without Pollution Prevention (pp 204-208)
Lesson VIII– Resource Expeditions (pp 210-231)
Activity 1– Show ’Em Sherlock (pp 213-226)
Activity 2– Mining and Recycling (pp 227-231)
Lesson IX– Going Global (pp 232-245)
Activity 1– From Ohio to the World…From the World to Ohio (pp 236-237)
Activity 2– I Need This…Do You Have Some? (pp 238-240)
Activity 3– Trash Around the World (pp 241-245)
Lesson X–Paying the Pollution Piper (pp 246-260)
Activity 1– The “Costly” Thing (pp 250-255)
Activity 2– Pollution on the Move (pp 256-260)
Lesson XI– Home, Safe Home (pp 262-274)
Activity – Home, Safe Home (pp 264-274)
Lesson XII– The Trouble with Litter (pp 276-300)
Activity 1– Fishing for Litter Habits (pp 279-284)
Activity 2– A Lot of Litter (pp 285-292)
Activity 3– Don’t Step on Litter (pp 293-300)
Lesson XIII– Trash Makes History (pp 302-318)
Activity 1– Everybody is an Expert (pp 306-312)
Activity 2– Secrets in a Garbage Can (pp 313-314)
Activity 3– Throwaway Societies (pp 315-318)
Lesson XIV– Journey of a Garbage Bill (pp 320-335)
Activity – Journey of a Garbage Bill (pp 323-335)
CONTENTS
initiating the print function, otherwise the entire text will print.When printing, be sure to select page numbers before

WIN
DO
WS
ON
WAS
TE4
© Ohio Department of Natural Resources
Help Contents Back
▼
▼
Help Contents Back
▼
▼
4
4
Project Director, Dave Landis, Ohio Department ofNatural Resources, Division of Recycling and LitterPrevention
Project Manager, Katherine K. Armfelt, Ohio Departmentof Natural Resources, Division of Recycling and LitterPrevention
Project Editor, Heidi Hetzel-Evans, Ohio Department ofNatural Resources, Division of Recycling and LitterPrevention
Special thanks to Jenni Worster, Tom Davis, PaulBaldridge and Arley Owens for administrative support –Ohio Department of Natural Resources, Division ofRecycling and Litter Prevention
Project Consultants
DRLP Regional Environmental Education LeadershipRepresentatives: Gabriele Beck, Erie-Huron CAC; PattyBratton, Lancaster/Fairfield County Community Action;Margaret Esser Losik, Portage County SWMD; DellaEwalt, Middletown Clean Community; Marti KolbConner, Newark Litter Prevention and Recycling; ChristineMcCauley, ParkWorks Cleveland; Joanne Mudra, RichlandCounty Regional Solid Waste Management Authority;Paulie Shaffer, Wood County SWMD
The following educators provided valuable insight andadvice during development: Ethel Briggs, Mid-OhioEducational Service Center; Diane Cantrell, OhioDepartment of Natural Resources; Gayle Gerard, DelawareCity Schools; John Hug, retired, Ohio Department ofEducation; Beverly J. Klimp, Stow-Munroe Falls Schools;John Larabee, Lancaster City Schools; Nancy Mills, Mid-Ohio Educational Service Center; Sandy Murphy, SuffieldElementary School; Kathy Thomas, Columbus PublicSchools
Others ConsultedJerald Bannister, Owens-Brockway Corporation; SueBennett, Wyandot County SWMD; Herb Broda, OhioEnvironmental Education Council of Ohio; DanielleBruning, Liberty Union-Thurston Middle School; MikeCanfield, Ohio Township Association; Jessi Crook, OhioCouncil for the Social Studies; Pete Dobrozsi, Mead
Corporation; Leslie Dybiec, Ohio Energy Project; LynnGetter, Keep Middletown Beautiful (KMB) and KMBEducation Task Force; Cynthia Gillen, Pickaway CountyCommunity Action; Mary Lee Hahn, Ohio Council ofTeachers of English Language Arts; Douglas Haskell, TheGreater Cincinnati Center for Economic Education; PaulaHermes, Bowling Green City Schools; Beth deMaille,Pickaway County Community Action; Jill Johnston-Carter,Marion County Litter Prevention and Recycling; William J.Lambert, retired, Ohio University, Lancaster Branch; JudiMannion, Ross County Litter Control and Recycling;Barbara McGinty, Litter Prevention and Recycling, City ofLakewood; Caren G. Owens, Portage County SWMD; IldiPallos, Ohio Environmental Protection Agency; Patty Rice,Cuyahoga County SWMD; Laura Rowell, MeadCorporation; Robin Smith, Ohio EPA; Cheri Stentz, KeepCincinnati Beautiful; Amy Stone, Wood County, OSUExtension; Bill Weightman, Steel Recycling Institute
Lesson DevelopersLesson I: Trashology 101 – Dave Landis, OhioDepartment of Natural Resources; Della Ewalt, KeepMiddletown Beautiful; Paulie Shaffer, Wood CountySWMD
Lesson II: Garbage Goods – Dave Landis, OhioDepartment of Natural Resources
Lesson III: The Paper Factory – Joanne Mudra, RichlandCounty Solid Waste Authority; Nancy Mills, Mid-OhioEducational Service Center
Lesson IV: This is Your Lifecycle! – Katherine K. Armfelt,Ohio Department of Natural Resources
Lesson V: Nature’s Way With Waste – Paulie Shaffer,Wood County SWMD
Lesson VI: Separation Mania – Belinda Bankes, OhioEnergy Project
Lesson VII: Techno-Fill – Patty Bratton, Lancaster/Fairfield County Community Action
Lesson VIII: Resource Expeditions – Margaret EsserLosik, Portage County SWMD
Lesson IX: Going Global – Gabriele Beck, Erie-HuronCAC
ACKNOWLEDGEMENTS

WIN
DO
WS
ON
WAS
TE
© Ohio Department of Natural Resources
Help Contents Back
▼
▼
Help Contents Back
▼
▼
5
5
Lesson X: Paying the Pollution Piper – ChristineMcCauley, ParkWorks Cleveland
Lesson XI: Home, Safe Home – Marti Kolb Conner, Cityof Newark Litter Prevention and Recycling
Lesson XII: The Trouble with Litter – Beverly Klimp,Riverview Elementary School (Stow-Munroe FallsSchools, Summit County)
Lesson XIII: Trash Makes History – Della Ewalt, KeepMiddletown Beautiful
Lesson XIV: Journey of a Garbage Bill – Dave Landis,Ohio Department of Natural Resources
Lesson Testers
Doreen Annable, Creekview Elementary; Jo Ashworth,Monroe Elementary; Laura Baker, (Marion City Schools);David Brown, Woodland Elementary (Perrysburg CitySchools); Bonny Calderwood, Liberty Union-ThurstonElementary (Fairfield County); Jill Johnston-Carter,Marion County Recycling and Litter Prevention; TrishaDodge, Big Walnut Elementary; Jean Engle, BataviaElementary (Ohio Energy Project, Southwest Region); PatEvans, Amanda Elementary (Middletown/MonroeSchools); Brenda Gehm, Monroe Elementary; Gail Gerard,Conger Elementary (Delaware City Schools); Peggy J.Glick, Grover Hill Elementary (Wayne-Trace Local SchoolDistrict); Caryl Hall, Mayfield Elementary(Middletown/Monroe Schools); Teresa Hancock,Brookside Elementary (Worthington City Schools); KayHelm, Amanda Elementary (Fairfield County); DianneKehl, Bellville Elementary (Clear Fork Schools); JudiMannion, Ross County Litter Control and RecyclingProgram; Carol Meyer, Bellville Elementary (Clear ForkSchools); Pat Lansinger Moore, Brimfield Elementary(Field Local Schools, Portage County); Dave McDonough,Batavia Elementary (Ohio Energy Project, SouthwestRegion); Sandy Murphy, Suffield Elementary (Field LocalSchools); Katie Neu (student teacher), MonroeElementary; Caren G. Owens, Portage County Solid WasteManagement District; Petra Putnam, BrooksideElementary (Worthington City Schools); Marilyn Temple,Rosedale Elementary (Middletown/Monroe Schools);Maria Losik Walls, Burton Elementary (Geauga County);Debbie Wolman, Creekview Elementary; Jenifer Way-Young, Delaware County Health Department; JeanZiogas, Unioto Schools (Ross County)

WIN
DO
WS
ON
WAS
TE
6© Ohio Department of Natural Resources
Help Contents Back
▼
▼
Help Contents Back
▼
▼
6
Ohio Competency-Based Educational StandardsThe lessons that have been developed according to Ohio Competency-Based Educational Standardsidentified in the Model Competency-Based Education Programs for science, social studies, mathemat-ics and language arts. This has been accomplished by developing learning activities that:
● meet instructional and performance objectives identified in the state model courses of study;
● conform with select State Proficiency Test Learning Outcomes; and
● provide assessment related to these outcomes.
Environmental EducationThe lessons that have been developed in accordance with the recommendations of environmental edu-cators. The learning activities:
● are based on learning concepts identified by the North American Association for EnvironmentalEducation;
● include attributes identified in Ohio’s Strategic Plan for Environmental Education (Ohio EE 2000)such as problem-solving processes; critical thinking in relation to complex issues; the need to inter-relate knowledge, attitudes and skills; and the exploration of options as part of decision-making; and
● include attributes of national reform movements in education as identified by the EnvironmentalEducation Council of Ohio.
A Work in ProgressWindows on Waste is a work in progress. Achieving the standards set by the educational programsidentified above is a complex and on-going concern for all environmental educators in Ohio. Localschool districts are invited to use this guidebook to provide professional development opportunities forteachers. We invite all users of the lessons in this guidebook to send their comments and evaluations tothe Ohio Department of Natural Resources, Division of Recycling and Litter Prevention. Evaluations ofall materials may be based on standards and models identified in the bibliography.
WINDOWS ON WASTE…Designed for Quality Education
Windows on Waste is an interdisciplinary, environmental studies resource for elementaryteachers and other environmental educators. It endeavors to meet the needs of compe-tency-based education and constructivist approaches to teaching and learning. The
lessons are grounded in general environmental studies concepts as applied to solid waste manage-ment issues, with particular emphasis upon recycling and litter prevention. The lessons alsoaddress many important educational concerns in Ohio.

WIN
DO
WS
ON
WAS
TE7
© Ohio Department of Natural Resources
Help Contents Back
▼
▼
Help Contents Back
▼
▼
7
7
Attention: Teachers and Environmental Educators
W I N D O W S O N W A ST E✔ Improve student understanding of the 4th and 6th grade
Proficiency Test Learning Outcomes in:
✔ Engage students in real world issues about the environment by emphasizing solid waste issues, recycling andlitter prevention
✔ Promote learner-centered education by using environmental inquiries and community action opportunities
✔ Evaluate student performance on 4th and 6th gradeProficiency Test Learning Outcomes using traditional and alternative forms of assessment, many of which replicate actualproficiency test questions
✔ Help make the environment a better place by promoting student involvement at:
• home• school• neighborhoods
• consumer markets• industrial plants• local government
• natural resource operations
• solid waste facilities
science • citizenship • mathematics • reading and writing
Windows on Waste contains a hands-on, minds-on activities, developed by the OhioDepartment of Natural Resources. It can be used to explore specific subjects and learning outcomesor to create a thematic interdisciplinary issues-based approach to teaching and learning.

WIN
DO
WS
ON
WAS
TE
© Ohio Department of Natural Resources
Help Contents Back
▼
▼
Help Contents Back
▼
▼
8
8
Ohio’s Model Competency-Based Programs
Model Competency-Based Language Arts Program.Columbus, Ohio: State Board of Education, 1992.
Model Competency-Based Mathematics Program.Columbus, Ohio: State Board of Education, 1990.
Science: Ohio’s Model Competency-Based Program.Columbus, Ohio: State Board of Education, 1994.
Social Studies: Ohio’s Model Competency-Based Program.Columbus, Ohio: State Board of Education, 1994.
Assessment Related to Model Competency-Based Programs
Competency-Based Education Assessment Series (“Off-yearAssessment”) for Ohio’s Model Competency-Based ScienceProgram, 1998; Social Studies Program, 1997; MathematicsProgram, 1997; Language Arts Program, 1995. Columbus,Ohio: State Board of Education.
Ohio Fourth-grade Proficiency Tests: A Resource Manual forTeachers of Fourth Grade and Ohio Sixth-grade ProficiencyTests: A Resource Manual for Teachers of Sixth Grade.Columbus, Ohio: Ohio Department of Education, 1996.
Ohio Proficiency Tests for Grade 4: Practice Test Manual andOhio Proficiency Tests for Grade 6: Practice Test Manual.Columbus, Ohio: Ohio Department of Education, 1995.
Ohio Proficiency Tests for Grade 4: Practice Test and OhioProficiency Tests for Grade 6: Practice Test. Columbus, Ohio:Ohio Department of Education, 1995.
Environmental Studies Education
Closing the Achievement Gap: Using the Environment as anIntegrating Context for Learning. Gerald A. Leiberman andLinda L. Hoody. State Education and EnvironmentRoundtable, 1998.
Essential Learnings in Environmental Education: A DataBase for Building Activities and Programs. North AmericanAssociation for Environmental Education, 1990.
Integrating Environmental Education and Science: Using andDeveloping Learning Episodes. Environmental EducationCouncil of Ohio, 1994.
Ohio EE 2000: A Strategic Plan for Environmental Educationin Ohio, DRAFT. Environmental Education Council ofOhio, Ohio Alliance for the Environment, et. al., 1998.
Solid Waste Management/Recycling andLitter Prevention
Ohio Revised Code: Recycling, Waste Reduction and LitterPrevention Laws. Ohio Department of Natural Resources,Division of Recycling and Litter Prevention, 1999.
State Solid Waste Management Plan 1995. OhioEnvironmental Protection Agency.
BIBLIOGRAPHYThe following documents provided the foundation for development of the lessons in Windows on Waste. Their use is recommended to evaluate the lessons for future issues.

WIN
DO
WS
ON
WAS
TE9
9© Ohio Department of Natural Resources
Help Contents Back
▼
▼
Help Contents Back
▼
▼
Using Bookmarks
The contents of Windows on Waste are shown as bookmarks in the bookmark pane. Clicking a bookmark will takeyou to that part of the text. To view additional parts, click the plus sign next to a title. The title will expand to showthe parts it contains. As you view the contents in the document pane, the bookmark will be highlighted in thebookmark pane to help you easily identify where you are in the document.
The bookmarks for activities also contain dropdown lists of handouts included in each activity.
Navagation Bar
Document Pane
Using the Navigation Bar
A navigation bar is provided at both the top and bottom of each page. Click Help to return to thisguide. Click Contents to view the Table of Contents.
The navigation bar also provides the Next Page and the Previous Page navigation arrows before and after thepage number to allow you to navigate through the pages one at a time. Click Back to view the prior screen.
All lessons, activities, and introductory sections of the text can be accessed from the Contents page. The Contentspage also includes page numbers for printing select portions of the text. When printing, be sure to select page numbers before initiating the print function, otherwise the entire text will print.
Help
▼
▼

WIN
DO
WS
ON
WAS
TE
© Ohio Department of Natural Resources
Help Contents Back
▼
▼
Help Contents Back
▼
▼
10
10
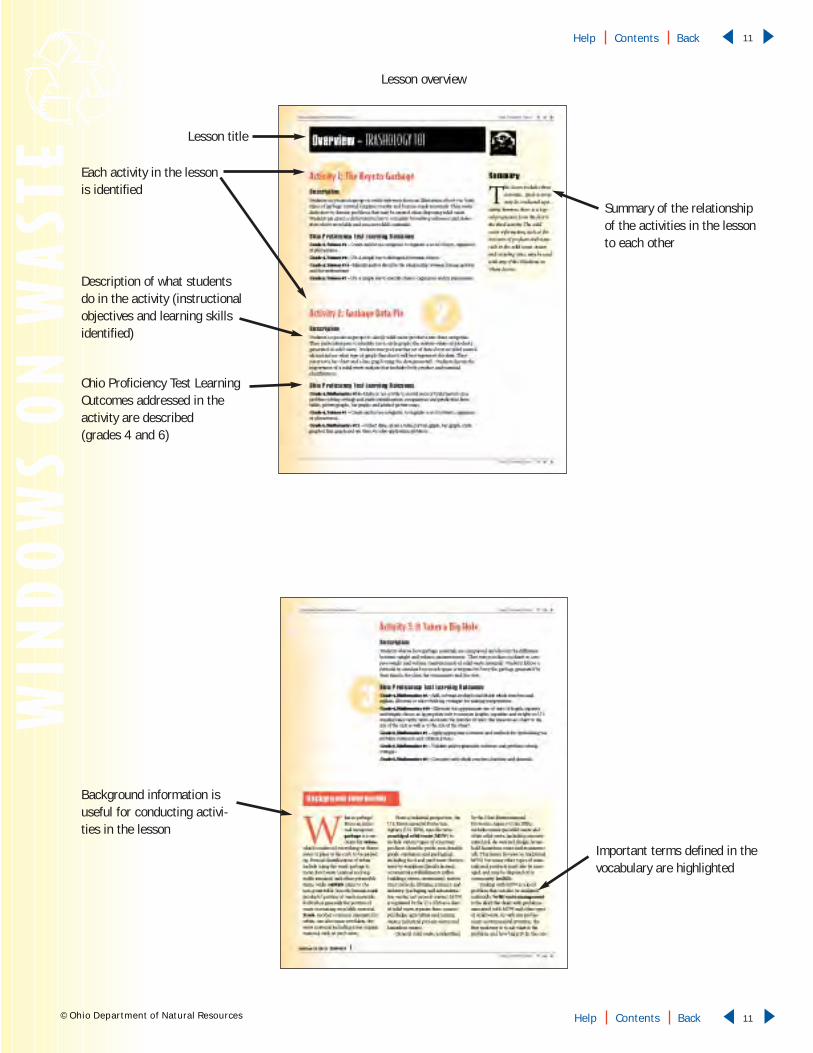
First page of each lesson
Lesson title
Environmental concerns addressedin the activity or activities of thelesson. The first part identifiesgeneral environmental studiesthemes; the second part identifiessolid waste management themes.
Definitions of important termsused in the lesson
How to Find Information About the LessonEach Lesson is self-contained with one or more activities.Prior to the individual activity descriptions is a description of the lesson and activities included in it.
Navagation bar
Navagation bar
Identifies what pages to printwhen printing entire Lessonand Activities.
How to Identify Activities that Meet Specific Needs:● If you want to identify activities that meet specific Ohio Proficiency Test Learning
Outcomes in science, social studies, mathematics and language arts:Refer to the Curriculum Reference Index
● If you want to identify activities that relate to specific environmental studies issues:Refer to the Environmental Studies Learning Concepts
Read more details about each of these concepts in the Environmental Studies Learning Conceptdescription on the first page of each lesson. The first part of the description explains generalenvironmental studies concepts related to energy, resources, land use and/or pollution and thelast part of the description explains the solid waste and recycling concepts.
● If you want to identify activities related to home, school and/or community action,including potential field trip opportunities:Refer to the School and Community Engagement Index
● If you want to identify learner centered inquiry approaches to education:Refer to the Inquiries (sidebar questions) at the beginning of each activity description in eachlesson and have students conduct their own research and inquiries using the activity for back-ground information or to investigate specific aspects of the inquiries.
How to Use WINDOWS ON WASTE
WIN
DO
WS
ON
WAS
TE
© Ohio Department of Natural Resources
Help Contents Back
▼
▼
Help Contents Back
▼
▼
11
11
Summary of the relationshipof the activities in the lessonto each other
Background information isuseful for conducting activi-ties in the lesson
Important terms defined in thevocabulary are highlighted
Ohio Proficiency Test LearningOutcomes addressed in theactivity are described (grades 4 and 6)
Description of what studentsdo in the activity (instructionalobjectives and learning skillsidentified)
Each activity in the lessonis identified
Lesson title
Lesson overview

WIN
DO
WS
ON
WAS
TE
© Ohio Department of Natural Resources
Help Contents Back
▼
▼
Help Contents Back
▼
▼
12
12
How to Find Information about Each Activity
First page of each activity
Lesson title
Inquiry prompts for engagingstudents in the activity or inlearner-centered independentdiscovery
Traditional subject matter ofactivity identified
Learning outcomes addressedby the activity are identified
Activity title
Performance objectives met byconducting the activity
Step-by-step method for conducting the activity
Lesson title and page number usingRoman numeral of the lesson andArabic numerals inclusive throughoutthe entire lesson
Copyright credit on bottom ofeach page in the text
Answers to questions on handouts
Answers to questions posed insteps of the activity
Methods of assessing studentperformance objectives and proficiency test learning outcomes for the activity
List of handouts in the activity
List of materials required forthe activity

WIN
DO
WS
ON
WAS
TE
© Ohio Department of Natural Resources
Help Contents Back
▼
▼
Help Contents Back
▼
▼
13
13
Handout pages for a specific activity are providedat the end of that activity
Some pages are for students to actively engage in the lesson
Some pages contain information for teachers and/or students

WIN
DO
WS
ON
WAS
TE14
14© Ohio Department of Natural Resources
Help Contents Back
▼
▼
Help Contents Back
▼
▼
14
14
WINDOWS ON WASTE
Environmental Studies Learning ConceptsThe 14 “windows on waste,” each representing a separate lesson in this CD, are based on 14 environmental studies learning
concepts. Each learning concept, or window, is composed of a general environmental studies concept (the top window-
pane) and a specific environmental studies concept about solid waste and recycling (the bottom windowpane). The lesson
number is identified on the window ledge of each window. Each lesson may contain one or more activities exploring the
learning concept.
LAND USE AND COMMUNITY RESOURCES
Defining, quantifying andclassifying the elements of
problematic issues
SOLID WASTE ANALYSIS
Defining and quantifyingsolid waste, recoverable
materials and land disposal
L E S S O N I
MARKET SYSTEM ECONOMICS
How businesses producegoods and services using
natural resources
THE BUSINESS OF RECYCLING
Managing a recycling centerand the economic incentives
to use recycled materials
L E S S O N I I
INDUSTRIAL PRODUCTION
PROCESSES
How energy and resourcesare used to make consumer
goods
PRODUCING WITH RECYCLEDMATERIALS
Reducing the use of energyand resources in production
processes
L E S S O N I I I
CYCLES IN NATURE
Biochemical nutrient andenergy flows in ecosystems
COMPOSTING
Solid waste reductionprocess and soil quality
enhancement
L E S S O N V
LIFECYCLE ANALYSIS
Production decisions andenvironmental impacts:
energy, resources, pollution
ENVIRONMENTAL BENEFITS OF RECYCLING
Saving energy, resourcesand land space, and reducing
pollution
L E S S O N I V

WIN
DO
WS
ON
WAS
TE
© Ohio Department of Natural Resources
Help Contents Back
▼
▼
Help Contents Back
▼
▼
15
15
INDUSTRIAL TECHNOLOGY
Machines and processes thatmake work more efficient
SOLID WASTE MANAGEMENT TECHNOLOGY
Collection, containment,compacting and sorting for
recycling and disposal
POLLUTION CONTROL TECH-NOLOGY
Machines, materials andprocesses that reduce or
prevent pollution
SOLID WASTE DISPOSALTECHNOLOGY
Pollution control at landfillsand incinerators
L E S S O N V I I
NATURAL RESOURCES
Demand for and acquisitionof renewable and non-
renewable resources
REDUCE AND RECYCLE
Natural resource conserva-tion and pollution reduction
L E S S O N V I I I
GOVERNMENT AND CITIZENSHIP
Democratic decision-making about
environmental issues
SOLID WASTE ISSUES
Legislation and policy making and interest groups
and citizens
L E S S O N X I V
HISTORY AND CULTURE
Environmental history andcultural comparisons
HISTORY OF SOLID WASTE
Past events and socio-cultural solid waste
management practices
L E S S O N X I I I
IRRITATING POLLUTION
Pollutants and the senses(sights, sounds, odors, touch
and taste)
LITTER
Misplaced solid waste:sources, effects, solutions
L E S S O N X I I
HAZARDOUS MATERIALS
Potential environmental andhealth risks from chemicals
and materials
WASTE STREAM HAZARDS
Household hazardous materials and consumer
choices
L E S S O N X I
ENVIRONMENTAL POLLUTION
Sources, pathways andeffects of natural and
human-made pollutants
RECYCLING AND POLLUTION
Reducing pollution in thestages of production
L E S S O N X
INTERNATIONAL AFFAIRS
Global resource distribu-tion, management and trade
GLOBAL SOLID WASTE MAN-AGEMENT
International recycling andcomparative solid waste
management
L E S S O N V I
L E S S O N I X

WIN
DO
WS
ON
WAS
TE
© Ohio Department of Natural Resources
Help Contents Back
▼
▼
Help Contents Back
▼
▼
16
16
CURRICULUM REFERENCE INDEXWINDOWS ON WASTE Learning Activities and Ohio Proficiency Test Learning Outcomes, Grades 4 and 6
The lessons contained in Windows on Waste (WOW) provide opportunities for elementary teach-ers and students to address the proficiency test learning outcomes by engaging in learning activi-ties about real world environmental issues. The lessons specifically address solid waste manage-ment, including recycling, in the context of energy, resource and land use, and pollution concerns.As with any real world issue, knowledge and skills from several subjects and disciplines are
required for understanding solid waste concerns. Many lessons in WOW are interdisciplinary, addressinglearning outcomes from several disciplines while others are more discipline-specific.
The outcomes in this index have been taken from two documents: Fourth-grade Proficiency Tests: InformationGuide, Ohio Department of Education (Columbus, Ohio), August 1995 and Sixth-grade Proficiency Tests:Information Guide, Ohio Department of Education (Columbus, Ohio), August 1995. A more completeunderstanding of each of the learning outcomes may be obtained by reading the entire learning outcomedescription provided in these documents.
Each lesson in WOW contains one or more activities. Each activity addresses several learning outcomes andis listed below under each of the learning outcomes addressed in the activity.
The learning outcomes for science and social studies are listed here in a different order than they appear inthe proficiency test guides; however, each retains the number given it in the guides. The order of presenta-tion below represents an informal “hierarchy of importance” of learning outcomes relevant to environmentalstudies issues. For example, within science, those outcomes that relate directly to environmental studies con-cerns are listed first, followed by those that pertain to scientific thinking processes and those that pertain tosubject matter (physical, life and earth sciences). Because economics and legislation are very important con-cerns for environmental studies, the social studies or citizenship learning outcomes have been reorganizedaccording to subject matter in the following order: economics, civics, geography and history. The mathemat-ics, reading and writing learning outcomes are listed in the order in which they appear in the proficiency testguides as their relevance to environmental studies is dependent upon their application to science or socialissues.
For each listing in the index, the fourth grade outcomes are presented first followed by the sixth grade outcomes.

WIN
DO
WS
ON
WAS
TE
© Ohio Department of Natural Resources
Help Contents Back
▼
▼
Help Contents Back
▼
▼
17
17
SCIENCE: ENVIRONMENTAL STUDIES LEARNING OUTCOMES
Grade 4, #14 Identify and/or describe the relationshipbetween human activity and the environment.
Lesson I, Activity 1: The Keys to Garbage
Lesson II, Activity 1: Econo-Community
Lesson II, Activity 3: Enterprising Recycling
Lesson III, Activity 1: Papermaking
Lesson IV, Activity 2: Lifecycle Hopscotch,
Lesson V, Activity 1: The Great Cycle
Lesson V, Activity 2: Bio What? That’sBiodegradation!
Lesson VII, Activity 1: Landfill Lingo
Lesson VII, Activity 4: Life…WithoutPollution Prevention
Lesson VIII, Activity 1: Show ’Em Sherlock,
Lesson X, Activity 1: The “Costly” Thing
Lesson X, Activity 2: Pollution on the Move
Lesson XI, Activity: Home, Safe Home
Lesson XII, Activity 1: Fishing for LitterHabits
Lesson XII, Activity 2: A Lot of Litter
Lesson XII, Activity 3: Don’t Step on Litter
Lesson XIII, Activity 1: Everybody is an Expert
Lesson XIII, Activity 2: Secrets in a GarbageCan
Lesson XIII, Activity 3: Throwaway Societies
Grade 6, #4 Identify the positive and/or negativeimpacts of technology on human activity.
Lesson V, Activity 1: The Great Cycle
Lesson VII, Activity 1: Landfill Lingo
Lesson VIII, Activity 2: Mining and Recycling
Lesson X, Activity 1: The “Costly” Thing
Lesson X, Activity 2: Pollution on the Move
Lesson XIII, Activity 1: Everybody is an Expert
Lesson XIII, Activity 2: Secrets in a GarbageCan
#17 Analyze the impacts of human activity onthe ecosystems of the earth.
Lesson V, Activity 1: The Great Cycle
Lesson VII, Activity 3: Finer Liner
Lesson VII, Activity 4: Life…WithoutPollution Prevention
Lesson VIII, Activity 1: Show ’Em Sherlock
Lesson VIII, Activity 2: Mining and Recycling
Lesson X, Activity 1: The “Costly” Thing
Lesson X, Activity 2: Pollution on the Move
SCIENCE: PROCESSES OF SCIENCE LEARNING OUTCOMES
Grade 4, #1 Create and/or use categories to organize aset of objects, organisms, or phenomena.
Lesson I, Activity 1: The Keys to Garbage
Lesson I, Activity 2: Garbage Data Pie
Lesson III, Activity 1: Papermaking
Lesson III, Activity 2: What Sort of Trash isThis Anyway?
Lesson III, Activity 3: The Paper Company
Lesson VIII, Activity 1: Show ’Em Sherlock
Lesson XIII, Activity 2: Secrets in a GarbageCan
#2 Select instruments, make observations,and/or organize observations of an event,object, or organism.
Lesson V, Activity 5: Compost Jars
Lesson VI, Activity: Separation Mania
Lesson VII, Activity 2: Does Your Soil Leak?
#3 Identify and/or compare the mass, dimen-sions, and volume of familiar objects instandard and/or non-standard units.
Lesson V, Activity 3: Compost Critters
#4 Use a simple key to distinguish betweenobjects.
Lesson I, Activity 1: The Keys to Garbage
Lesson III, Activity 1: Papermaking
Lesson III, Activity 2: What Sort of Trash isThis Anyway?
SCIENCE PROFICIENCY TEST LEARNING OUTCOMES

WIN
DO
WS
ON
WAS
TE
© Ohio Department of Natural Resources
Help Contents Back
▼
▼
Help Contents Back
▼
▼
18
18
Lesson IV, Activity 1: Lifecycle Bingo
Lesson V, Activity 2: Bio What? That’sBiodegradation!
Lesson V, Activity 3: Compost Critters
Lesson V, Activity 4: Meet the YIMBYs
Lesson VIII, Activity 1: Show ’Em Sherlock
#5 Analyze a series of events and/or simpledaily or seasonal cycles and predict the nextlikely occurrence in the sequence.
Lesson IV, Activity 2: Lifecycle Hopscotch
Lesson V, Activity 1: The Great Cycle
Lesson X, Activity 1: The “Costly” Thing
#6 Evaluate a simple procedure to carry out anexploration.
Lesson III, Activity 1: Papermaking
Lesson III, Activity 3: The Paper Company
Lesson V, Activity 3: Compost Critters
Lesson V, Activity 5: Compost Jars
Lesson VI, Activity: Separation Mania
Lesson VII, Activity 3: Finer Liner
Lesson VII, Activity 4: Life…WithoutPollution Prevention
#7 Identify and/or discuss the selection ofresources and tools used for exploring scien-tific phenomena.
Lesson V, Activity 3: Compost Critters
Lesson V, Activity 5: Compost Jars
Lesson VII, Activity 3: Finer Liner
#8 Evaluate observations and measurementsmade by other persons.
Lesson VII, Activity 2: Does Your Soil Leak?
#9 Demonstrate an understanding of safe useof materials and/or devices in science activi-ties.
Lesson V, Activity 3: Compost Critters
Lesson V, Activity 5: Compost Jars
Lesson VII, Activity 4: Life…WithoutPollution Prevention
#17 Identify ways in which organisms react tochanging environments.
Lesson V, Activity 3: Compost Critters
#18 Distinguish between living and non-livingthings and provide justification for these distinctions.
Lesson V, Activity 2: Bio What? That’sBiodegradation!
Grade 6, #1 Use a simple key to classify objects,organisms, and/or phenomena.
Lesson I, Activity 1: The Keys to Garbage
Lesson V, Activity 2: Bio What? That’sBiodegradation!
Lesson V, Activity 3: Compost Critters
Lesson V, Activity 4: Meet the YIMBYs
Lesson VIII, Activity 1: Show ’Em Sherlock
#2 Identify the potential hazards and/or pre-cautions involved in scientific investiga-tions.
Lesson V, Activity 3: Compost Critters
Lesson V, Activity 5: Compost Jars
Lesson VII, Activity 4: Life…WithoutPollution Prevention
#3 Make inferences from observations ofphenomena and/or events.
Lesson V, Activity 2: Bio What? That’sBiodegradation!
Lesson V, Activity 3: Compost Critters
Lesson V, Activity 4: Meet the YIMBYs
Lesson V, Activity 5: Compost Jars
Lesson VII, Activity 2: Does Your Soil Leak?
Lesson VII, Activity 3: Finer Liner
Lesson XIII, Activity 2: Secrets in a GarbageCan
Science, continued

WIN
DO
WS
ON
WAS
TE
© Ohio Department of Natural Resources
Help Contents Back
▼
▼
Help Contents Back
▼
▼
19
19
CITIZENSHIP PROFICIENCY TEST LEARNING OUTCOMES
CITIZENSHIP: ECONOMICS LEARNING OUTCOMES
Grade 4, #10 Identify the factors of production (land,labor, capital, and entrepreneurship) neededto produce various goods and services.
Lesson II, Activity 2: Business Boxes
Lesson II, Activity 3: Enterprising Recycling
Lesson III, Activity 3: The Paper Company:Extension
#11 Name the resources needed to produce various goods and services, classify eachresource by the factors of production, orsuggest alternative uses for those factors.
Lesson II, Activity 1: Econo-Community
Lesson II, Activity 2: Business Boxes
Lesson II, Activity 3: Enterprising Recycling
Lesson III, Activity 3: The Paper Company:Extension
Lesson IV, Activity 2: Lifecycle Hopscotch
Lesson VIII, Activity 1: Show ’Em Sherlock
Lesson IX, Activity 2: I Need This…Do YouHave Some?
Lesson X, Activity 1: The “Costly” Thing
#12 Classify various economic activities as examples of production or consumption.
Lesson II, Activity 1: Econo-Community
Grade 6, #12 Describe the role of each factor of produc-tion in producing a specific good or serviceand suggest alternative uses for the resourcesinvolved.
#5 Evaluate conclusions based on scientificdata.
Lesson VII, Activity 4: Life…WithoutPollution Prevention
SCIENCE: SUBJECT MATTER OUTCOMES (PHYSICAL, LIFE AND EARTH SCIENCES)
Grade 4, #12 Explain and/or predict the motion ofobjects and/or describe the effects of someobjects on other objects.
Lesson VI, Activity: Separation Mania
#16 Demonstrate an understanding of the basicneeds of living things.
Lesson V, Activity 1: The Great Cycle
Lesson V, Activity 4: Meet the YIMBYs
#18 Distinguish between living and non-livingthings and provide justification for thesedistinctions.
Lesson V, Activity 1: The Great Cycle
Lesson V, Activity 4: Meet the YIMBYs
Grade 6, #7 Predict the influence of the motion of someobjects on other objects.
Lesson VI, Activity: Separation Mania
#12 Identify characteristics and/or patterns inrocks and soil.
Lesson V, Activity 5: Compost Jars
#14 Trace the transmission of energy in a small,simple ecosystem and/or identify the rolesof organisms in the energy movement in anecosystem.
Lesson V, Activity 1: The Great Cycle
Lesson V, Activity 3: Compost Critters
#15 Compare and/or contrast the diverse waysliving things meet their needs.
Lesson V, Activity 3: Compost Critters
#16 Analyze behaviors and/or activities thatpositively or negatively influence humanhealth.
Lesson XI, Activity: Home, Safe Home
Science, continued
WIN
DO
WS
ON
WAS
TEHelp Contents Back
▼
▼
Help Contents Back
▼
▼
20
20© Ohio Department of Natural Resources
Lesson II, Activity 2: Business Boxes
Lesson II, Activity 3: Enterprising Recycling
Lesson III, Activity 3: The Paper Company:Extension
#13 Identify the factors that influence: (a) consumer decisions to demand goods or services, (b) producer decisions to supplygoods or services.
Lesson II, Activity 1: Econo-Community
Lesson II, Activity 3: Enterprising Recycling
#14 Identify the factors that determine thedegree of competition in a market anddescribe the impact of competition on amarket: (a) identify advantages and disad-vantages of competition in the marketplace,(b) explain the general relationship betweensupply, demand, and price in a competitivemarket.
Lesson II, Activity 3: Enterprising Recycling
CITIZENSHIP: CIVIC ACTION LEARNING OUTCOMES
Grade 4 #13 Identify the function of each branch of stategovernment.
Lesson XIV, Activity: Journey of a GarbageBill
#14 Identify the purposes of state government.
Lesson XIV: Journey of a Garbage Bill
#15 Identify or explain the purposes of local government.
Lesson XII, Activity 2: A Lot of Litter
Lesson XIV, Activity: Journey of a GarbageBill
#16 Differentiate between statements of fact andopinion found in information about publicissues and policies.
Lesson XIV, Activity: Journey of a GarbageBill
#17 Identify and assess the possibilities of groupdecision making, cooperative activity andpersonal involvement in the community(e.g., vandalism, school rules and recycling).
Lesson XII, Activity 2: A Lot of Litter
Lesson XIV, Activity: Journey of a GarbageBill
#18 Identify the elements of rules relating to fairplay.
Lesson XII, Activity 2: A Lot of Litter
Grade 6, # 17 Interpret how examples of political activityillustrate characteristics of American democracy.
Lesson XIV, Activity: Journey of a GarbageBill
#19 Analyze information on civic issues by orga-nizing key ideas with their supporting facts.
Lesson XIV, Activity: Journey of a GarbageBill
#20 Identify and analyze alternatives throughwhich civic goals can be achieved and selectan appropriate alternative based upon a setof criteria (e.g., fire hydrant repair, use ofpublic buildings, recycling programs).
Lesson XIV, Activity: Journey of a GarbageBill
CITIZENSHIP: GEOGRAPHY LEARNING OUTCOMES
Grade 4, #7 Demonstrate map skills by: (a) identifyingvarious major reference points on the Earth;(b) locating major landforms and bodies ofwater; or (c) using a number/letter grid sys-tem to locate places on a map, a map key tounderstand map symbols, a linear scale tomeasure distances on a map, and a directionindicator.
Lesson IX, Activity 1: From Ohio to theWorld…From the World to Ohio
Grade 6, #9 Interpret and analyze maps, charts orgraphs to formulate geographic ideas.
Lesson IX, Activity 1: From Ohio to theWorld…From the World to Ohio
#15 Use information about global resource dis-tribution to make generalizations aboutwhy nations engage in international trade.
Lesson IX, Activity 1: From Ohio to theWorld…From the World to Ohio
Lesson IX, Activity 2: I Need This…Do YouHave Some?
Citizenship, continued

WIN
DO
WS
ON
WAS
TE
© Ohio Department of Natural Resources
Help Contents Back
▼
▼
Help Contents Back
▼
▼
21
21
Grade 4, #1 Sort and identify objects on multiple attributes.
Lesson IV, Activity 1: Lifecycle Bingo
#3 Select appropriate notations and methodsfor symbolizing a problem situation, trans-late real life situations into conventionalsymbols of mathematics, and representoperations using models, conventional sym-bols and words.
Lesson VIII, Activity 2: Mining and Recycling
#4 Identify needed information to solve a problem.
Lesson II, Activity 3: Enterprising Recycling
Lesson III, Activity 1: Papermaking
Lesson III, Activity 3: The Paper Company
#5 Explain or illustrate why a solution is correct.
Lesson III, Activity 1: Papermaking
Lesson III, Activity 3: The Paper Company
#7 Illustrate or identify fractional parts ofwhole objects and like fractions greater thanone, and add and subtract like fractions withillustrations and symbols.
Lesson VII, Activity 2: Does Your Soil Leak?
#8 Add, subtract, multiply and divide wholenumbers and explain, illustrate or selectthinking strategies for making computa-tions.
Lesson I, Activity 3: It Takes a Big Hole
Lesson II, Activity 3: Enterprising Recycling
Lesson III, Activity 1: Papermaking
Lesson III, Activity 3: The Paper Company
Lesson VIII, Activity 2: Mining and Recycling
Lesson XII, Activity 3: Don’t Step on Litter
#11 Add and subtract decimals.
Lesson II, Activity 3, Enterprising Recycling
MATHEMATICS PROFICIENCY TEST LEARNING OUTCOMES
CITIZENSHIP: HISTORY LEARNING OUTCOMES
Grade 4, #1 Demonstrate knowledge of and ability tothink about the relationship among eventsby: (a) identifying sequence of events in his-tory; (b) grouping events by broad historicaleras on a time line; and (c) recognizing thatchanges occur in history; or (d) identifyingcause- and-effect relationships.
Lesson XIII, Activity 1: Everybody is an Expert
Lesson XIII, Activity 3: Throwaway Societies
#2 Identify and use sources of informationabout a given topic in the history of Ohioand the United States.
Lesson XIII, Activity 1: Everybody is an Expert
Grade 6, #1 Demonstrate knowledge of and ability tothink about relationships among events:
group significant individuals by broadlydefined historical eras, (b) utilize multiple-tier time lines.
Lesson XIII, Activity 1: Everybody is an Expert
#2 Utilize a variety of resources to considerinformation from different perspectivesabout North America: (a) identify the centralidea an historical narrative attempts toaddress, (b) inquire into the relative credibil-ity of sources.
Lesson XIII, Activity 1: Everybody is an Expert
#6 Draw inferences about the experiences,problems and opportunities that culturalgroups have encountered in the past.
Lesson XIII, Activity 3: Throwaway Societies
Citizenship, continued

WIN
DO
WS
ON
WAS
TE
© Ohio Department of Natural Resources
Help Contents Back
▼
▼
Help Contents Back
▼
▼
22
22
#17 Apply the use of tools to measure lengths,using centimeters and inches including rec-ognizing the positions of whole numbersand fractions on a number line.
Lesson V, Activity 3: Compost Critters
#19 Illustrate the approximate size of units oflength, capacity and weight; choose anappropriate unit to measure lengths, capaci-ties and weights in U.S. standard and metricunits; and relate the number of units thatmeasure an object to the size of the unit aswell as to the size of the object.
Lesson I, Activity 3: It Takes a Big Hole
#23 Collect data and create a picture or bargraph representing the data.
Lesson XII, Activity 1: Fishing for LitterHabits
#24 Make or use a table to record and sort infor-mation (in a problem-solving setting) andmake identifications, comparisons and pre-dictions from tables, picture graphs, bargraphs and labeled picture maps.
Lesson I, Activity 2: Garbage Data Pie
Lesson III, Activity 1: Papermaking
Lesson III, Activity 2: What Sort of Trash isThis Anyway?
Lesson IV, Activity 2: Lifecycle Hopscotch
Lesson VII, Activity 4: Life…WithoutPollution Prevention
Lesson IX, Activity 3: Trash Around the World
Grade 6, #3 Apply appropriate notations and methodsfor symbolizing the problem statement andsolution process.
Lesson I, Activity 3: It Takes A Big Hole
Lesson II, Activity 3: Enterprising Recycling
Lesson VIII, Activity 2: Mining and Recycling
#5 Validate and/or generalize solutions andproblem-solving strategies.
Lesson I, Activity 3: It Takes A Big Hole
#6 Compute with whole numbers, fractionsand decimals.
Lesson I, Activity 3: It Takes A Big Hole
Lesson II, Activity 3: Enterprising Recycling
Lesson VII, Activity 2: Does Your Soil Leak?
#21 Collect data, create a table, picture graph,bar graph, circle graph or line graph and usethem to solve application problems.
Lesson I, Activity 2: Garbage Data Pie
Lesson IV, Activity 2: Lifecycle Hopscotch
#22 Read, interpret and use tables, charts, mapsand graphs to identify patterns, note trendsand draw conclusions.
Lesson IX, Activity 3: Trash Around the World
Mathematics, continued
READING: LEARNING OUTCOMES
Grade 4, #2 Use graphic aids (for example, a table orgraph) or illustrations to locate or interpretinformation.
Lesson IV, Activity 2: Lifecycle Hopscotch
#4 Identify and interpret vocabulary critical tothe meaning of the text.
Lesson IV, Activity 1: Lifecycle Bingo
#6 Infer from the text (fiction).
Lesson XII, Activity 2: A Lot of Litter
#7 Compare and/or contrast elements such ascharacters, setting, or events (fiction).
Lesson XII, Activity 2: A Lot of Litter
#8 Respond to the text (fiction).
Lesson XII, Activity 2: A Lot of Litter
READING AND WRITING PROFICIENCY TEST LEARNING OUTCOMES

WIN
DO
WS
ON
WAS
TE
© Ohio Department of Natural Resources
Help Contents Back
▼
▼
Help Contents Back
▼
▼
23
23
#12 Use graphic aids (for example, a table orgraph) or illustrations to locate or interpretinformation.
Lesson XII, Activity 1: Fishing for LitterHabits
#13 Demonstrate an understanding of text byretelling the information, in writing, in ownwords.
Lesson XI, Activity: Home, Safe Home
#14 Identify and interpret vocabulary (words,phrases or expressions) critical to under-standing the text.
Lesson V, Activity 1: The Great Cycle
Lesson VII, Activity 1: Landfill Lingo
Lesson VII, Activity 2: Does Your Soil Leak?
Lesson XI, Activity: Home, Safe Home
Lesson XII, Activity 1: Fishing for LitterHabits
#17 Infer from the text.
Lesson IV, Activity 1: Lifecycle Bingo
Lesson V, Activity 1: The Great Cycle
Lesson VII, Activity 1: Landfill Lingo
Lesson VII, Activity 2: Does Your Soil Leak?
Lesson XI, Activity: Home, Safe Home
#18 Respond to the text.
Lesson V, Activity 1: The Great Cycle
#19 Choose materials related to purposes, as evi-denced in part by the capacity to: (a) chooseor identify reference resources to locate spe-cific information; (b) select fiction and non-fiction materials in response to a topic or
theme; (c) choose appropriate resources andmaterials to solve problems and make deci-sions.
Lesson IX, Activity 1: From Ohio to theWorld…From the World to Ohio
Lesson XIII, Activity 1: Everybody is an Expert
Grade 6, #11 Summarize the text.
Lesson V, Activity 1: The Great Cycle
#12 Infer from the text.
Lesson IV, Activity 1: Lifecycle Bingo
Lesson V, Activity 1: The Great Cycle
Lesson VII, Activity 1: Landfill Lingo
Lesson VII, Activity 2: Does Your Soil Leak?
Lesson XI, Activity: Home, Safe Home
#13 Respond to the text.
Lesson V, Activity 1: The Great Cycle
#16 Select information from a variety ofresources to support ideas, concepts, andinterpretations.
Lesson XIII, Activity 1: Everybody Is AnExpert
WRITING: LEARNING OUTCOMES
Grade 4, #1 Given an assigned activity direction intend-ed to elicit modes of writing, the learner willuse the writing process to make the intend-ed clear, as evidenced by: (1) a response thatstays on the topic; (2) the use of detail tosupport the topic and; (7) a response thatshows an awareness of word usage - vocab-ulary, homonyms and words in context.
Lesson V, Activity 2: Bio What? That’sBiodegradation!
Reading and Writing, continued

© Ohio Department of Natural Resources
▼
▼
▼
▼
Help Contents Back
Help Contents Back
WIN
DO
WS
ON
WAS
TE24
24
VISIT A RECYCLING CENTER OR MUNICIPALRECOVERY FACILITY
Lesson II, Activity 2: Business Boxes. How to manage a recy-cling facility, including business and processing decisions.
Lesson VI, Activity: Separation Mania. How machines areused to sort and separate materials based on their physicalproperties.
Lesson VIII, Activity 1: Show’Em Sherlock. Various aspectsof recyclable products and processes.
VISIT AN INDUSTRIAL OPERATION THAT USESRECYCLED-CONTENT MATERIAL
Lesson II, Activity 3: Enterprising Recycling. Business incen-tives to use recycled-content material through energy andresource savings.
Lesson III, Activity 1: Papermaking, How recycled paper isused to make paper products.
Lesson III, Activity 3: The Paper Company. Business incen-tives to use recycled-content material (paper) through ener-gy and resource savings.
Lesson IV, Activity 2: Lifecycle Hopscotch. Environmentalreasons to use recycled materials in production processes.
Lesson X, Activity 1: The “Costly” Thing. How the use ofrecycled material (aluminum) reduces pollution.
VISIT A LANDFILL OPERATION
Lesson VII, Activity 1: Landfill Lingo, and Lesson VII,Activity 3: Finer Liner. How pollution control techniquesare integrated into land disposal of waste.
Lesson X, Activity 2: Pollution on the Move. The impor-tance of pollution prevention at landfills and other com-munity places.
VISIT A COMPOST FACILITY
Lesson V, Activity 3: Compost Critters. How organic wastematter is reduced.
VISIT A MINING (OR OTHER RESOURCE ACQUISI-TION) OPERATION
Lesson IV, Activity 2: Lifecycle Hopscotch. Environmentalimpacts of using primary raw materials in productionprocesses.
Lesson VIII, Activity 2: Mining and Recycling. Where prod-uct materials come from and the importance of recycling.
Lesson X, Activity 2: Pollution on the Move. The impor-tance of pollution prevention at mining facilities and othercommunity places.
SCHOOL AND COMMUNITY ENGAGEMENT INDEXWINDOWS ON WASTE Environmental Stewardship
Environmental studies issues, and in particular solid waste concerns, provide classroom learningopportunities related to real-life situations. The lessons in this guidebook provide opportunities forstudents and teachers to become active beyond the classroom through community field trip experi-ences and activities that benefit the environment. Field trip experiences and environmental stew-ardship can be integrated into classroom activities in ways that reinforce the performance and
instructional objectives of the activities.
Various activities in Windows on Waste are indexed below according to learning and action opportunitiesbeyond the classroom.
COMMUNITY FIELD TRIP LEARNING OPPORTUNITIES
WIN
DO
WS
ON
WAS
TE
© Ohio Department of Natural Resources
▼
▼
Help Contents Back
▼
▼25
Help Contents Back 25
25
ENVIRONMENTAL STEWARDSHIP ACTIONS AND LEARNING OPPORTUNITIES
CONDUCT A SOLID WASTE AUDIT FOR HOME,SCHOOL, OR COMMUNITY PLACES
Lesson I, Activity 2: Garbage Data Pie. How to identify andclassify materials in the waste stream.
CONDUCT A HOUSEHOLD HAZARDOUS WASTEAUDIT AND ALTERNATIVES PROGRAM
Lesson XI: Home, Safe Home. How to identify and classifyhazardous materials and alternatives
CONDUCT A SCHOOL RECYCLING PROGRAM ORSUPPORT LOCAL COMMUNITY RECYCLING PROGRAMS
Lesson I, Activity 2: Garbage Data Pie. How to identify andclassify materials in the waste stream to identify potentialrecyclables.
Lesson III, Activity 3: The Paper Company. Planning aschool paper recycling program.
Lesson IV, Activity 2: Lifecycle Hopscotch. Environmentalreasons to establish a recycling program.
CONDUCT A SCHOOL COMPOSTING PROJECT TOREDUCE CAFETERIA WASTE
Lesson V, Activity 5: Compost Jars. Conduct a school cafete-ria waste audit and plan a compost pile on the schoolgrounds.
VISIT A GROCERY STORE OR OTHER RETAIL BUSINESS TO IDENTIFY RECYCLED-CONTENTPRODUCTS FOR CONSUMERS
Lesson II, Activity 1: Econo-Community. Identify recycled-content products and encourage others to purchase them.
VISIT A GROCERY STORE (OR OTHER RETAIL BUSI-NESS) TO IDENTIFY OVERPACKAGING FOR CON-SUMERS
Lesson V, Activity 2: Bio What? That’s Biodegradation!How to evaluate product packaging.
PLAN AND CONDUCT A LITTER PREVENTION PROGRAM AT SCHOOL OR IN THE COMMUNITY
Lesson XII: The Trouble With Litter (three activities). Thenature of litter: Why it exists and how to prevent it.

Help Contents Back
▼
▼
Help Contents Back
▼
▼
26©Ohio Department of Natural Resources
26
EnvironmentalStudies LearningConcept
Environmental problems
begin with local actions
that may be repeated on a
national and global scale. Local
communities, including individ-
uals, governments, businesses
and industry, make provisions for
the use of land space in order to
harness the potential resources of
a given area for individual and
community purposes. Under-
standing environmental problems
about resources, how we use
them and the consequences of
these uses, requires an analysis to
identify related factors and ele-
ments, and to quantify them to
whatever extent is possible.
Every individual and com-
munity must make provisions for
handling solid waste, including
its eventual disposal or reuse. The
management of solid waste is
problematic because of scarce
land space required for disposal
and the potential value of
materials (resources) in solid
waste. In addition to restoring
usefulness to materials that
would otherwise be thrown away,
recycling also defers the need to
site land space for disposal. A
solid waste analysis indicates the
potential for recycling systems to
reduce the burden on landfills
and to reintroduce materials
back into manufacturing systems.
Vocabularycomposting – a waste management alternative to disposal whereby organic wastesare decomposed by microorganisms to produce a soil additive
dichotomy – a division into two parts
disposal rate – products and materials, by weight or volume, that are managed forfinal containment (landfill) or destruction (incineration without energy recovery)
garbage – commonly used to describe all refuse; putrescible food waste (animal andvegetable)
general solid waste – term used by the Ohio EPA to designate commercial and resi-dential wastes that are disposed of in municipal solid waste landfills, including otheritems, such as scrap tires, petroleum contaminated soil, household hazardous waste,incinerator ash and municipal de-watered sludge
generation rate – products and materials, by weight or volume, that are collected aspart of the waste management system, before recycling or disposal takes place
incineration – a combustion (burning) process that reduces the quantity of wastematerials into gases and relatively small amounts of ash
landfill – an outdoor area for waste disposal, regulated in recent times to include asystem for encapsulating waste material to control potentially harmful liquids andgases
municipal solid waste (MSW) – non-hazardous waste generated by residential andcommercial establishments; sometimes includes very small amounts of potentially hazardous materials
recovery rate – products and materials, by weight or volume, recovered from thewaste stream by using various strategies, including recycling, composting, reuse andenergy recovery through incineration
recycling rate – products and materials, by weight or volume, that are recoveredfrom the waste stream to be used again to make new recycled-content products ormaterials; major portion of the recovery rate
refuse – anything thrown away, includes rubbish, garbage and trash
rubbish – non-putrescible solid waste (excluding ashes), consisting of both combustible and noncombustible waste material
solid waste – refuse, sludges and other discarded solid materials and residues,including those from residences and from industrial, commercial and agriculturaloperations (does not include solids or dissolved materials in domestic sewage orother significant pollutants in water sources)
solid waste analysis – identification, classification and quantification of waste mate-rials and products organized according to specific categories, including generation,recycling and disposal rates
solid waste management – a system that provides for the collection, storage, trans-portation, transfer, processing, treatment and disposal of solid waste, including separation and processing for recycling and composting
trash – dry waste material, excluding food waste and ashes; a synonym for garbage,rubbish and refuse
waste stream – a term commonly used for the total flow of solid waste from homes,businesses, institutions and industry that must be managed, or any segment thereof,such as the residential waste stream
LESSON I TRASHOLOGY 101
Windows on Waste - TRASHOLOGY 101 I

1
2
Activity 1: The Keys to Garbage DescriptionStudents cooperate in groups to make inferences from an illustration about two basictypes of garbage: natural (organic) matter and human-made materials. They makedeductions to discuss problems that may be created when disposing solid waste.Students are given a dichotomous key to complete by making inferences and deduc-tions about recyclable and non-recyclable materials.
Ohio Proficiency Test Learning OutcomesGrade 4, Science #1 – Create and/or use categories to organize a set of objects, organismsor phenomena.
Grade 4, Science #4 – Use a simple key to distinguish between objects.
Grade 4, Science #14 – Identify and/or describe the relationship between human activityand the environment.
Grade 6, Science #1 – Use a simple key to classify objects, organisms and/or phenomena.
Activity 2: Garbage Data PieDescriptionStudents cooperate in groups to classify solid waste products into three categories.They make inferences to identify (on a circle graph) the relative values of productsgenerated in solid waste. Students interpret another set of data about recycled materi-als and deduce what type of graph (bar chart) will best represent this data. They construct a bar chart and a line graph using the data presented. Students discuss theimportance of a solid waste analysis that includes both product and material classifications.
Ohio Proficiency Test Learning OutcomesGrade 4, Mathematics #24 – Make or use a table to record and sort information (in aproblem-solving setting) and make identifications, comparisons and predictions fromtables, picture graphs, bar graphs and labeled picture maps.
Grade 4, Science #1 – Create and/or use categories to organize a set of objects, organismsor phenomena.
Grade 6, Mathematics #21 – Collect data, create a table, picture graph, bar graph, circlegraph or line graph and use them to solve application problems.
Summary
This lesson includes three
activities. Each activity
may be conducted sepa-
rately; however, there is a logi-
cal progression from the first to
the third activity. The solid
waste information, such as the
amounts of products and mate-
rials in the solid waste stream
and recycling rates, may be used
with any of the Windows on
Waste lessons.
Overview - TRASHOLOGY 101
27
27©Ohio Department of Natural Resources
Help Contents Back
▼
▼
Help Contents Back
▼
▼

28
28©Ohio Department of Natural Resources
Help Contents Back
▼
▼
Help Contents Back
▼
▼
Background Information
What is garbage?From an infor-mal viewpoint,garbage is a syn-onym for refuse,
which consists of everything we throwaway or place at the curb to be pickedup. Formal classifications of refuseinclude using the word garbage tomean food waste (animal and veg-etable remains) and other putrescibleitems, while rubbish refers to thenon-putrescible (mostly human-madeproducts) portion of waste materials.Rubbish is generally the portion ofwaste containing recyclable material.Trash, another common synonym forrefuse, can also mean worthless, drywaste material including some organicmaterial, such as yard waste.
From a technical perspective, theU.S. Environmental ProtectionAgency (U.S. EPA), uses the termmunicipal solid waste (MSW) toinclude various types of consumerproducts (durable goods, non-durablegoods, containers and packaging),including food and yard waste thrownaway by residences (family homes),commercial establishments (officebuildings, stores, restaurants), institu-tions (schools, libraries, prisons), andindustry (packaging and administra-tive wastes, not process wastes). MSWis regulated by the U.S. EPA as a classof solid waste separate from munici-pal sludge, agriculture and miningwastes, industrial process wastes andhazardous wastes.
General solid waste, as identified
by the Ohio EnvironmentalProtection Agency (Ohio EPA),includes municipal solid waste andother solid waste, including contami-nated soil, de-watered sludge, house-hold hazardous waste and incineratorash. This lesson focuses on traditionalMSW, but many other types of mate-rials and products must also be man-aged, and may be disposed of in community landfills.
Dealing with MSW is a localproblem that can also be analyzednationally. Solid waste managementis the field that deals with problemsassociated with MSW and other typesof solid waste. As with any proble-matic environmental situation, thefirst endeavor is to ask what is theproblem, and how big is it? In the case
3
Activity 3: It Takes a Big HoleDescriptionStudents observe how garbage materials are compacted and discuss the differencebetween weight and volume measurements. They interpret data on charts to com-pare weight and volume measurements of solid waste materials. Students follow aformula to calculate how much space is required to bury the garbage generated bytheir family, the class, the community and the state.
Ohio Proficiency Test Learning OutcomesGrade 4, Mathematics #8 – Add, subtract, multiply and divide whole numbers andexplain, illustrate or select thinking strategies for making computations.
Grade 4, Mathematics #19 – Illustrate the approximate size of units of length, capacityand weight; choose an appropriate unit to measure lengths, capacities and weights in U.S.standard and metric units; and relate the number of units that measure an object to thesize of the unit as well as to the size of the object.
Grade 6, Mathematics #3 – Apply appropriate notations and methods for symbolizing theproblem statement and solution process.
Grade 6, Mathematics #5 – Validate and/or generalize solutions and problem-solvingstrategies.
Grade 6, Mathematics #6 – Compute with whole numbers, fractions and decimals.
Windows on Waste - TRASHOLOGY 101 I

Help Contents Back
▼
▼
Help Contents Back
▼
▼29©Ohio Department of Natural Resources
29
of garbage, this requires a solid wasteanalysis.
A solid waste analysis illustratesthe types and quantities of solid wastein a given waste stream. That infor-mation can determine how muchwaste must be collected and disposed,and how much can potentially berecycled. Both the U.S. EPA and theOhio EPA conduct and publish solidwaste analyses regularly; even localcommunities, businesses and schoolscan conduct their own solid wasteanalyses. (Refer to the Bibliographysection for a listing of national andstate solid waste reports.)
Three classification schemes areoften used to analyze the materialsand products in MSW. These are gen-eration rates (how much MSW mustbe managed), recovery rates (howmuch MSW is recycled, composted orotherwise reused, with the majority ofrecovered waste being recycled) anddisposal rates (how much MSWmust be disposed of after recyclingand composting). Currently, each per-son in the United States generatesabout 4.5 pounds of MSW each day,about one-third is recycled and two-thirds is disposed. The majority ofdisposed waste material is buried inlandfills. In Ohio, 99 percent of dis-posed materials are sent to landfills.
Most solid waste analyses use databased on weight figures. However, vol-ume is a more important measurefrom a disposal perspective because
landfills deal with lack of space issues.Volume studies are rarely carried outbecause measures of volume are moredifficult to achieve than measures ofweight.
There are other ways to classifysolid waste. Those in charge of com-posting operations may want to knowhow much waste material is organicand classify these materials separatelyfrom non-compostable items; inciner-ator operators may want to classifywaste material as combustible or non-combustible. Using a dichotomy, aclassification scheme that dividesitems into two distinct classifications,is especially valuable for solid wastemanagement. Recycling enterprisesare concerned about separating recy-clables from non-recyclables and thenseparating recyclables by type (glass,plastic, aluminum, steel, paper).
In recycling, further classificationmay be needed to determine specificproducts within a material category.For example, paper recyclers sort theirproducts by grades and the plasticsindustry uses a numeric code to clas-sify plastic products.
Over time, MSW data can also beanalyzed to note increases anddecreases in the amounts of certaintypes of materials being generated,recycled or disposed, so that manufac-turers and solid waste managers canplan for future needs and identify historical trends.
Bibliography and AdditionalResourcesEducator Information
Characterization of Municipal SolidWaste in the United States: 1997Update, by Franklin Associates, Ltd.,prepared for U.S. EnvironmentalProtection Agency, Report No.EPA530-R-98-007. Prairie Village, KS:Franklin Associates, Ltd., May 1998.
1997 Ohio Solid Waste Facility DataReport, by the Ohio EnvironmentalProtection Agency, prepared in 1997using 1996 data. Columbus, OH:Ohio Environmental ProtectionAgency.
1997 Summary of Solid WasteManagement in Ohio: Recycling,Reduction, Incineration & Disposal, bythe Ohio Environmental ProtectionAgency, includes data for the years1990-1996. Columbus, OH: OhioEnvironmental Protection Agency.
Waste in Place: Elementary CurriculumGuide, 6th edition, Keep AmericaBeautiful. Inc., 1997, Garbage Pizza,p. 47.
Background Information, continued
As with any problematic environmental situation, thefirst endeavor is to ask what is the problem, and howbig is it?
Windows on Waste - TRASHOLOGY 101 I

ProcedureWrite the word “solid waste” on
the board and discuss how it is anotherword for garbage, refuse, rubbish andtrash. Explain to students that they aregoing to explore the characteristics ofgarbage, why garbage is a problem andwhat can be done with it. Ask studentsto infer why garbage is a problem. Keeptheir responses for later discussion.
The first way to explore any prob-lem like garbage is to consider what theproblem consists of, what are its ele-ments and how these elements can bebroken down into useful categories.Give students the handout, Dichotomyof Solid Waste, to examine two broadcategories of solid waste. Define theword dichotomy (“dicho” means twoand “–tomy” means to cut or divide).On the handout, clarify the specificitems illustrated in each pile of waste.
Observable in Pile 1 are leaves, applecores, banana peels, tree branches, fruitrinds and peanut shells. Observable inPile 2 are glass and plastic beverage bot-tles, aluminum soda pop cans, steelcans, newspapers, cardboard boxes,refrigerator and old tires. Beneath thepiles are microorganisms (bacteria andfungi), around Pile 1 are animals and
insects, and around Pile 2 are insectsthat may find breeding opportunitieswhere water collects.
Divide students into groups and havethem answer Question 1, with each stu-dent writing the group answer in thespace provided. After a few minutes,have each group share their answer withthe class.
ANSWER: (Question 1): Pile 1 containsitems that are: natural, nature-made ororganic; they are part of the naturalenvironment. Pile 2 contains items thatare human-made; they are part of thebuilt environment.
Ask students, in their groups, todiscuss and answer questions 2 and 3on the handout. Discuss answers withthe class.
ANSWERS: (questions 2 and 3): Thenatural materials will decay in a shortperiod of time because animals andmicroorganisms will feed on anddecompose the waste. Weathering ele-ments also contribute to the destructionof organic waste material. The human-made materials, except for paper prod-ucts, will not completely decay in 10years, but will begin to break downfrom weathering and elements that cre-ate rust and corrosion. Plastic will beginto photodegrade from sunlight.
3
2
1
The Keys to GarbageObjectivesStudents will be able to: (a) classify solid waste according to natural and human-
made items and recyclable and non-recyclable items; (b) construct a dichotomous
key for solid waste management; and (c) explain what can be done with solid waste,
depending upon its biological and physical attributes.
Act
ivity
1Inquiries ● What is garbage?
● Why is garbage a problem?
● How can we classify ourgarbage?
● What can be done withgarbage?
Content DomainScience – General science
Social Studies – Geography
Learning OutcomesScience, Grade 4, #1, # 4, #14and Grade 6, #1
Duration55 minutes
MaterialsEight trash items (four madeof glass, four made of plastic)for the assessment activity: twoglass beverage bottles, each adifferent color or shape; drink-ing glass; glass cologne orperfume container; two plas-tic beverage bottles, each adifferent color or shape; plasticbread bag; polystyrene (plas-tic foam) drinking cup
Handouts● Dichotomy of Solid Waste
● Solid Waste Dichotomous Key
● Dichotomous Key
TRASHOLOGY 101
Windows on Waste - TRASHOLOGY 101 I
30
30©Ohio Department of Natural Resources
Help Contents Back
▼
▼
Help Contents Back
▼
▼

Help Contents Back
▼
▼
Help Contents Back
▼
▼
Using the completed handout,have students reflect why people donot dispose of their garbage on theirown property (although some peopledo compost on their own property).
ANSWER: Organic waste, if it is notcarefully composted, produces odorsand attracts vermin, which mayspread disease. Non-organic mattertakes much longer to decompose, isunsightly and will collect in larger andlarger piles. Items that collect water(tires in particular) may become abreeding ground for mosquitoes andother insects.
Ask students what happens to garbagewhen it is collected from the curb andwhy their answers to questions 2 and3 might create problems for localcommunities attempting to dispose ofeveryone’s solid waste.
ANSWER: Landfills are constructedand maintained to eliminate as manyodor and vermin problems as possi-ble. This is why a daily covering of soilor other material is spread over thewaste. However, landfills require moreand more space over time, and havethe potential to pollute ground waterand air. Incinerators reduce waste volume, but produce ash (sometimestoxic) that must be landfilled andhave the potential to produce air pollution.
Ask students what alternativesexist for disposing of solid waste.
ANSWER: Nature’s organic garbagecan be composted, which is a type ofrecycling that relies on nature’s recy-cling system. Human-made refuse andtrash cannot be efficiently recycledusing nature’s system, and therefore,requires a human-made system thatinvolves machines and industrialprocesses.
Discuss recycling and how thedichotomy of solid waste (discussedearlier) is important to know for recy-cling purposes.
Give each student the handout,Solid Waste Dichotomous Key, to com-
plete. The eight items listed under “AllGarbage” must be broken down intotwo categories of four items each,then into four categories of two itemseach.
ANSWERS:Can be recycled by nature’s recy-cling system (composting): leaves,orange peels
Can be recycled in a human-madesystem: aluminum can, refrigerator
Can be reused as is or modified:old winter coat, shoe box
Likely to be disposed of (buried orburned): used paper plate, burned-out light bulb
NOTE: This dichotomous key is basedon both social and scientific concepts.Scientific dichotomous keys aremutually exclusive, based on either/orpropositions and sensory observa-tions. Unlike dichotomous keys thatare used in science, this social sciencedichotomous key includes categoriesthat are not always mutually exclusive.This is because recycling and reuse arehuman activities that depend uponlocation and the types of materialsaccepted locally for recycling. Manyrecyclable items (aluminum can, oldrefrigerator) can also be reused andsome reusable items (shoebox) can berecycled. Theoretically, almost anyitem in the garbage can be recycled insome type of industrial process; how-ever, for many items it is not econom-ically feasible. This is why the words“can be” and “likely to be” are used inthe key. The assessment that followscontains a dichotomous key that isbased on scientific observations aboutwaste material, but also may relate torecycling.
Have students make a list ofadditional solid waste materials thatcould be included in the category:Can be recycled in a human-made system.
AssessmentShow students eight items: two
glass beverage bottles (each a differentcolor or shape); drinking glass; glasscologne or perfume container; twoplastic beverage bottles (each a differ-ent color or shape); plastic bread bag;and polystyrene (plastic foam) drink-ing cup. All items should be empty.Do not say anything about the items,or describe them in any way.
Give each student the handout,Dichotomous Key, and have each stu-dent work individually to completethe handout by classifying the eightdisplayed objects. Tell students theymay come up to touch and handleeach object as they please. Instructthem to fill in each blank space (let-ters “a” through “g”) with a headingand to put the name of one or moreof the eight specific items below eachheading. You may wish to have themrefer to the completed handout, SolidWaste Dichotomous Key, to serve as anexample.
ANSWERS: Answers will varydepending upon organizational choices. The following are appropriateanswers but others may be justifiable:
(a) “all containers” or “all items”–followed by naming each of the eightitems
(b, c) “plastic containers” and “glasscontainers” or just “plastic and glass”(either order) – followed by namingfour objects under each heading
(d, e, f, g) “(glass) soda bottles,” and“other” or “not (glass) soda bottles;”“(plastic) soda bottles,” and “other” or“not (plastic) soda bottles.”
Refer to sample key on nextpage. Ask students why this dichoto-my is useful for recycling purposes.
ANSWER: In order for human-madematerials to be recycled, they have tobe separated by material and some-times by types of products within aspecific material. For example, thebeverage bottles, both glass and plas-tic, are frequently recycled, while theother items are more difficult to recy-
3
2
1
7
6
5
4
Windows on Waste - TRASHOLOGY 101 I 31
31©Ohio Department of Natural Resources
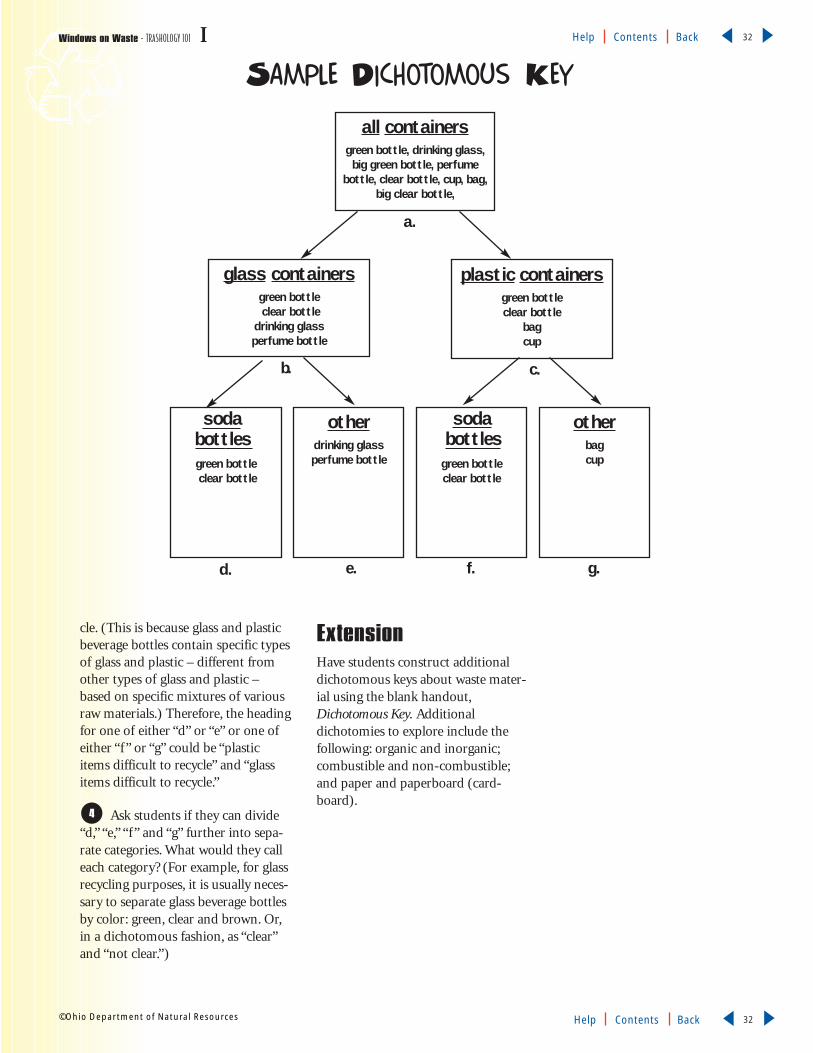
32
32©Ohio Department of Natural Resources
Help Contents Back
▼
▼
Help Contents Back
▼
▼
cle. (This is because glass and plasticbeverage bottles contain specific typesof glass and plastic – different fromother types of glass and plastic –based on specific mixtures of variousraw materials.) Therefore, the headingfor one of either “d” or “e” or one ofeither “f” or “g” could be “plasticitems difficult to recycle” and “glassitems difficult to recycle.”
Ask students if they can divide“d,” “e,” “f” and “g” further into sepa-rate categories. What would they calleach category? (For example, for glassrecycling purposes, it is usually neces-sary to separate glass beverage bottlesby color: green, clear and brown. Or,in a dichotomous fashion, as “clear”and “not clear.”)
ExtensionHave students construct additionaldichotomous keys about waste mater-ial using the blank handout,Dichotomous Key. Additionaldichotomies to explore include thefollowing: organic and inorganic;combustible and non-combustible;and paper and paperboard (card-board).
4
all containersgreen bottle, drinking glass,
big green bottle, perfumebottle, clear bottle, cup, bag,
big clear bottle,
glass containersgreen bottleclear bottle
drinking glass perfume bottle
sodabottlesgreen bottleclear bottle
otherdrinking glassperfume bottle
sodabottles
green bottleclear bottle
otherbagcup
plastic containersgreen bottleclear bottle
bagcup
a.
b.
d. e. f. g.
c.
Sample Dichotomous Key
Windows on Waste - TRASHOLOGY 101 I

Help Contents Back
▼
▼
Help Contents Back
▼
▼33©Ohio Department of Natural Resources
33
Student Handout ✐
Solid Waste DichotomyThere are two groups of solid waste items below that have been put into separate piles outdoors.Items that have a certain characteristic are in Pile 1. Items that have a certain characteristic are inPile 2.
Directions: Looking at Pile 1 and Pile 2, answer the following questions.
1. What characteristic was used to separate the items into two piles. Explain your answer.
2. What will happen to the items in Pile 1 if they are left there for a period of 10 years? Explain.
3. What will happen to the items in Pile 2 if they are left there for a period of 10 years? Explain.
PILE 1 PILE 2
Windows on Waste - TRASHOLOGY 101 I

Help Contents Back
▼
▼
Help Contents Back
▼
▼34©Ohio Department of Natural Resources
34
Solid Waste Dichotomous KeyDirections: Place the following items into a dichotomous key.
recyclable
can be recycledby nature’s
system(composting)
can be recycledin a human
recycling system
can be reused(as is or modified)
likely to bedisposed (buried
or burned)
non-recyclable
a.
b.
d. e. f. g.
c.
Student Handout ✐
all garbageused paperplatealuminum canold winter
coatleavesrefrigeratororange peels
shoe boxburned-outlight bulb
Windows on Waste - TRASHOLOGY 101 I

Student Handout ✐35
35©Ohio Department of Natural Resources
Help Contents Back
▼
▼
Help Contents Back
▼
▼
a.
b.
d. e. f. g.
c.
Dichotomous Key
Windows on Waste - TRASHOLOGY 101 I

ProcedureDefine and explain the terms
municipal solid waste (MSW) and solidwaste analysis. Explain to the class that aresearch group conducts a nationalsolid waste analysis of items in themunicipal solid waste stream and gives this information to the U.S.Environmental Protection Agency (U.S.EPA). Explain the role of the U.S. EPAas the federal government agencyresponsible for protecting the environ-ment. Tell the class they will be examin-ing data from the U.S. EPA’s municipalsolid waste report.
Give each student the handout,Goods Galore & Garbage. In groups,have students complete the handout.Discuss the three categories listed at thetop of the handout, and then havegroups begin listing items (products orgoods) under the various categories.Have students complete the top half ofthe handout, listing items thrown awayat home. After discussing these items,have them think of items thrown awayat school, placing them into the threecategories. The handout, Waste Stream
Products, which contains numerousexamples for each of the three cate-gories, can be used for teacher or stu-dent reference.
Tell students they will be examin-ing the U.S. EPA solid waste analysisbased on the categories of the complet-ed handout, Goods Galore & Garbage.But before doing so, ask students whattypes of garbage were not included inthe handout, Goods Galore & Garbage(food waste and yard waste). Remindstudents that the separation of food andyard waste from products is based on adichotomy between natural andhuman-made materials (done inActivity 1).
Give each student the handout,Products in Municipal Solid Waste, andreview the information. Discuss the rel-ative nature of the categories and givethem the circle graph handout,Graphing Data: Products in MSW. Havestudents fill in the spaces on the piechart (label the circle bases) with theappropriate product category. Or, ifcapable, have students make circlegraphs for the data using a compass and
4
3
2
1
Garbage Data PieObjectivesStudents will be able to: (a) cooperate in groups to construct a solid waste analysis;
(b) interpret solid waste data and identify relative values on circle graphs and/or cre-
ate their own circle graphs to represent the data; (c) interpret solid waste data and
represent the data in a variety of graphic forms; and (d) explain the importance of
classifying solid waste according to specific products and materials for recycling.
Act
ivity
2
Inquiries● What is in municipal solid
waste?
● How do we classify solidwaste?
● How much solid waste isrecycled?
Content DomainMath – Arithmetic
Science – General science
Learning OutcomesMath, Grade 4, #24 and Grade6, #21
Science, Grade 4, #1
Duration55 minutes
Materialspencils, plain paper, optionalitems: protractor, compass,graph paper
continued next page
TRASHOLOGY 101Windows on Waste - TRASHOLOGY 101 I 36
36©Ohio Department of Natural Resources
Help Contents Back
▼
▼
Help Contents Back
▼
▼
37
37©Ohio Department of Natural Resources
Help Contents Back
▼
▼
Help Contents Back
▼
▼
protractor. (You may also have themwrite in the circle bases the names ofsome specific products identified onthe handout, Goods Galore &Garbage.) Make sure students under-stand that in a circle graph all circlebases or sections must total 100 percent.
You can modify this step by copyingthe handout, Products in MunicipalSolid Waste, with the percentages cov-ered so they are blank, and have stu-dents make calculations to derive per-centages rounded off to the nearestfigure.
Ask students if there is anotherway, using a different type of graph,they can represent the data from thehandout, Products in Municipal SolidWaste. (The actual amounts by weightor the percentages can be representedin a bar graph.) Give students theblank handout, Bar Graph, to com-plete by labeling it appropriately andfilling in the first five columns withweight data.
NOTE: Students need to fill in head-ings “a” (PRODUCTS, there will befive to list) and “b” (MILLIONS OFTONS PER YEAR) and give the charta title (PRODUCTS IN MSW).Students also need to decide howmany million tons each square shouldrepresent (10 million up to 100 mil-lion), putting numbers in the spacesprovided below heading “b.”
Upon completing steps 4 and 5, thestudents now have two representa-tions of different sets of data aboutthe same products in MSW. Theserepresent a solid waste analysis.
Ask students to reconsider theproducts in the categories and howthe products differ, other than the cat-egories: durable goods, non-durablegoods, containers and packaging. Inother words: What is another way toorganize a solid waste analysis?
ANSWER: The products can be orga-nized according to the materials they
are made from. Categorizing by mate-rial is especially important for recy-cling, because only products made ofthe same material can be recycledtogether. Although glass bottles, alu-minum cans and plastic containersmay all be collected together, theymust be recycled in separate process-es. Refer to the handout, Materials inMunicipal Solid Waste, also used in theAssessment section. You may want tomake an overhead of this handout tointroduce students to the materialsthat products are made from.
In pairs, give each student thehandout, Materials Recycled. Discussthe information. Ask which type ofgraph can be used to represent thisdata.
ANSWER: A bar graph, because thepercentages given are for each materi-al, not the total of all materials. (Thetotal of all materials percentageswould be more than 100 percent.)Exception: A circle graph could beconstructed for each material to com-pare the amount recycled with theamount not recycled (or amount dis-posed of). This would require manygraphs, one for each material.
Give each student another copy of theblank handout, Bar Graph, to com-plete by labeling it appropriately andfilling in all 12 columns.
NOTE: Students need to fill in head-ings “a” (MATERIALS, there will be 12to list) and “b” (PERCENTAGE OFMATERIAL RECYCLED) and give thechart a title (MSW MATERIALSRECYCLED). Students also need todecide how many percentage pointseach square should represent (10 per-cent up to 100 percent), by puttingthe numbers in the spaces providedbelow heading “b.”
Optional: Ask students whatother type of information does thedata on the top half of the handout,Materials Recycled, reveal, in additionto materials recycled?
8
7
6
5
Handouts● Goods Galore & Garbage
● Waste Stream Products
● Products in Municipal SolidWaste
● Graphing Data: Products inMSW
● Bar Graph
● Materials Recycled
● Materials in Municipal SolidWaste
● Graphing Data: Materials inMSW
● What Do the Data Say?
TRASHOLOGY 101Windows on Waste - TRASHOLOGY 101 I

38
38©Ohio Department of Natural Resources
Help Contents Back
▼
▼
Help Contents Back
▼
▼
ANSWER: The MSW disposal rate foreach material. This can be derived bysubtracting each percentage from 100percent. This subtracted figure wouldrepresent the percentage of eachmaterial that is disposed of after recy-cling or composting. Have studentsconstruct a comparative bar graph forrecycling and disposal rates using thisdata.
The data at the bottom half ofthe handout, Materials Recycled, pro-vides information about recyclingrates from 1960 to 1995. Discuss withstudents how this information can begraphed. (A line graph is most appro-priate.) Have students construct a linegraph using this data.
AssessmentGive students the handouts, Bar
Graph, Materials in Municipal SolidWaste and Graphing Data: Materialsin MSW. Have them label the circlegraph and the bar graph for the twosets (columns) of data deciding whichset of data to use for each graph.
Have students complete the testhandout, What Do the Data Say?
ANSWERS: 1. c, 2. b, 3. c, 4.- 6. Referto the handout, Materials inMunicipal Solid Waste, 7. c,8. Answers will vary.
ExtensionsHave students in groups discuss
various methods of conducting aschool solid waste analysis or wasteaudit. Have each group present theirideas and as a class choose the best
group method. Initiate the solid wasteaudit and have each group constructvarious methods of representing thedata that has been collected and makeclassroom presentations.
Conduct the activity, GarbagePizza, from Keep America Beautiful,which is referenced in theBibliography section of the lesson.
Explain to students that the datathey have shows that in any commu-nity products are thrown away in therelative quantities presented on thecircle graphs, but in some communi-ties the values may differ slightly.However, the more samples you have,the more likely it is that the overalldata will reflect national figures. Toshow how sampling works and whatprobability means, do the followingactivity:
● Divide students into pairs and giveeach pair a set of “spinner” materials(Make a spinner with a pencil andpaper clip. Poke the pencil in thecenter of the circle graph through abent, extended paper clip with apoint that can be flicked around thepencil lead with a finger).
● Have each pair make a list of each ofthe product or material categoriesfrom one of the circle graphs to useas a tally sheet.
● Have one student place their spin-ner on the circle graph and spin itwhile the other records which prod-uct or material category is selectedby the spinner. Have each pair dothis 25 times, trading places halfway through the spins.
● When each pair has completed 25spins, have them compare their data
with the national figures and thenrecord data from all pairs of stu-dents and compare with the nation-al data. The entire class should bemore representative of national datathan the individual pairs.
3
2
1
2
1
9
Windows on Waste - TRASHOLOGY 101 I

Student Handout ✐39
39©Ohio Department of Natural Resources
Help Contents Back
▼
▼
Help Contents Back
▼
▼
Goods Galore & Garbage
DURABLE GOODS Products that last a longtime before they are thrownaway or recycled (washingmachine, hair dryer, television).
NON-DURABLEGOODS
Products that last a shortperiod of time before they arethrown away or recycled(paper plates, junk mail, sometoys).
CONTAINERS and PACKAGING
Products that preserve foodand hold other things thatgenerally last a short periodof time before they are thrownaway or recycled (aluminumcan, plastic grocery bag).
GENERATED AT HOMEDURABLE NON-DURABLE CONTAINERS and
PACKAGING
GENERATED AT SCHOOL
DURABLE NON-DURABLE CONTAINERS and PACKAGING
Windows on Waste - TRASHOLOGY 101 I

Help Contents Back
▼
▼
Help Contents Back
▼
▼40©Ohio Department of Natural Resources
40
Waste Stream ProductsConsumerism is reflected in the products found in our solid waste stream. These can be classified asdurables, non-durables, containers and packaging, and other wastes including food waste and yard trimmings.
Durable products may have a lifetime of three years or more (up to 20 years) before being discarded. Non-durable products last for less than three years and include many one-time use items. Containers and packag-ing items have varying life spans, but are generally short-lived.
The following list is representative of the major product categories for each classification.
Major Appliancesrefrigerators*washing machines*water heaters*
Small Appliancestoastershair dryers
coffee potsFurniture
couches/chairslampstablesbeds
Carpets/Rug
Lead-AcidBatteries*Vehicle Tires
Miscellaneoustelevisionsvideo cassette
recorderspersonal computersluggagesports equipment
Paper Productsbooks/magazinespaper*
(copier/computer)newspaper*mailnapkins/tissuesplates/cups/bowlsgames
Plastic Productsplastic tablewarefood service containers
Disposable Diapers
Textilesclothing/footwear*bedding
Miscellaneoushousehold itemsmedical suppliesnovelty itemstoys
Aluminumbeverage cans*foilclosures (tabs)
Glassbeverage bottles*food jars*cosmetic packaging
Paper/Paperboardboxes*food/beverage
containersretail bags/boxeswrapping paper
Steelbeverage cans*food cans*strapping
Plastic Containers/Packaging
bottles (PET- #1 & HDPE-#2)*
bags (LDPE, LLDPE)*coatings & closuresother- (made from a
variety of resins -PVC, PS, PP)
Other Packagingwood packaging*
(crates/pallets)textilesleathers
Food Waste Yard Trimmings Miscellaneous inorganic waste
DURABLES
NON-DURABLES
CONTAINERS & PACKAGING
OTHER WASTES
*Indicates items that are commonly recycled depending upon location. Non-asterisked items may be more difficult torecycle or establish recycling programs for.
Windows on Waste - TRASHOLOGY 101 I

Student Handout ✐41
41©Ohio Department of Natural Resources
Help Contents Back
▼
▼
Help Contents Back
▼
▼
Products in Municipal Solid Waste (MSW)*
GENERATION RATE PRIOR TO DISPOSAL OR RECYCLINGPercentages indicate the percentage of each product category in relation to thetotal amount of all products generated in MSW.
PRODUCTS MILLION TONS PERCENTAGEPER YEAR
Durable goods ...............................31 ................................15%
Non-durable goods......................56 ...............................27%
Containers & packaging .............69...............................33%
Food, other ....................................25................................12%
Yard trimmings.............................28 ...............................13%
TOTAL .....................................209........................100%
*Franklin Associates, Ltd., Characterization of Municipal Solid Waste in the United States: 1997Update (published by the U.S. Environmental Protection Agency, May 1998, using 1996 figures), p.6. Figures include wastes from residential, commercial and institutional sources. Does not includeautomobile scrap, construction and demolition debris and industrial process wastes.
Windows on Waste - TRASHOLOGY 101 I
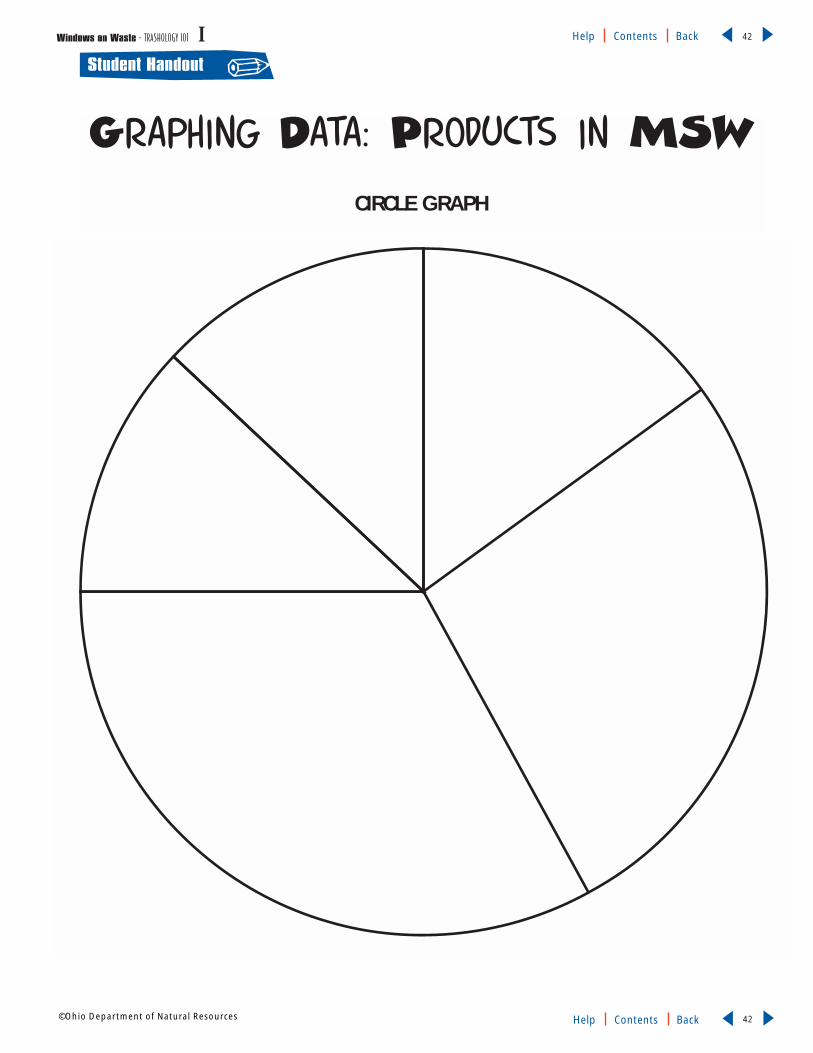
Student Handout ✐42
42©Ohio Department of Natural Resources
Help Contents Back
▼
▼
Help Contents Back
▼
▼
Graphing Data: Products in MSW
CIRCLE GRAPH
Windows on Waste - TRASHOLOGY 101 I

Student Handout ✐43
43©Ohio Department of Natural Resources
Help Contents Back
▼
▼
Help Contents Back
▼
▼
Bar Graph
Title:____________________________________________a.
1.2.3.4.5.6.
7.8.
9.10.
11.
12.
b.
Windows on Waste - TRASHOLOGY 101 I

Student Handout ✐44
44©Ohio Department of Natural Resources
Help Contents Back
▼
▼
Help Contents Back
▼
▼
Materials Recycled*and materials composted
Figures indicate the percentage of each material recycled or composted in relation to thetotal amount of the particular material. (Example: 40% of all paper and paperboard prod-ucts were recycled; 60% were not recycled.)
MATERIALS IN PRODUCTS
Paper & paperboard ..................41% Plastics ................................. 5%
Glass .........................................26% Rubber & leather .................10%
Ferrous metals ........................38% Textiles...................................12%
Aluminum ..................................34% Wood ...................................... 5%
Other nonferrous metals.......67% Other materials...................21%
OTHER WASTE
Food, other ..................................2% Yard trimmings...................39%
TOTAL RECYCLING RATE IN 1996 FOR ALL MATERIALS IN MUNICIPAL SOLID WASTE: 27%
HISTORICAL RECYCLING RATES (FOR ALL MATERIALS): 1960-1990
1960..........................6%
1970 ...........................7%
1980.........................10%
1990.........................16%
*Franklin Associates, Ltd., Characterization of Municipal Solid Waste in the United States: 1997 Update (pub-lished by the U.S. Environmental Protection Agency, May 1998, using 1996 figures), pp. 5, 27, 52. Figuresinclude wastes from residential, commercial and institutional sources. Does not include automobile scrap,construction and demolition debris and industrial process wastes.
Windows on Waste - TRASHOLOGY 101 I

Student Handout ✐45
45©Ohio Department of Natural Resources
Help Contents Back
▼
▼
Help Contents Back
▼
▼
Materials in Municipal Solid WasteGENERATION RATE PRIOR TO DISPOSAL OR RECYCLING
Each of the materials below is found in products in the waste stream. Percentages indicate the percentage of each material in relation to the total amount of all mate-rials generated in MSW.
MATERIALS MILLION TONS PERCENTAGEPER YEAR
Paper & paperboard ..................80 ........................................38%
Glass.............................................12 ...........................................6%
Metals ..........................................16 ...........................................8%(Ferrous ......................12)(Aluminum ...................3)(Other nonferrous.......1)
Plastics ........................................19 ...........................................9%
Wood...............................................11 ...........................................5%
Other materials ..........................21..........................................10%(rubber, leather, textiles,
miscellaneous inorganic)
Food..............................................22 ...........................................11%
Yard trimmings..........................28..........................................13%
TOTAL................................ 209.................................100%
*Franklin Associates, Ltd., Characterization of Municipal Solid Waste in the United States: 1997Update (published by the U.S. Environmental Protection Agency, May 1998, using 1996 figures), pp. 4,51. Figures include wastes from residential, commercial and institutional sources. Does not includeautomobile scrap, construction and demolition debris and industrial process wastes.
Windows on Waste - TRASHOLOGY 101 I

Student Handout ✐46
46©Ohio Department of Natural Resources
Help Contents Back
▼
▼
Help Contents Back
▼
▼
Graphing Data: Materials in MSW
CIRCLE GRAPH
Windows on Waste - TRASHOLOGY 101 I
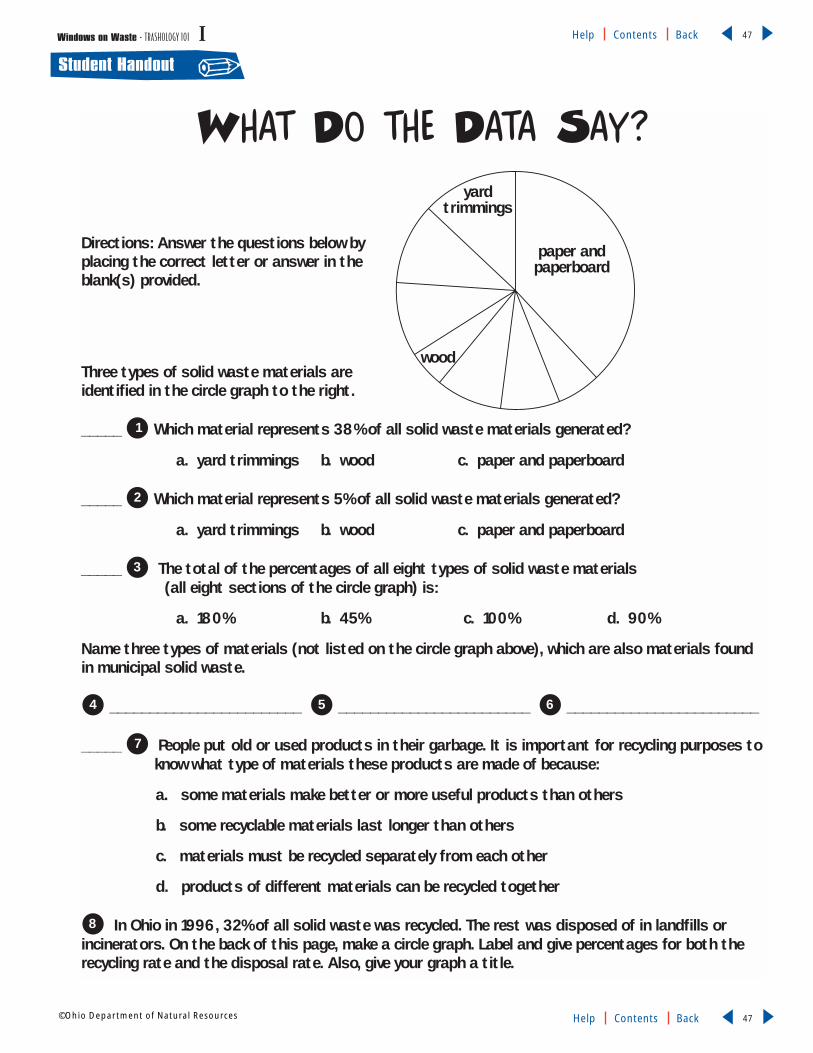
Student Handout ✐47
47©Ohio Department of Natural Resources
Help Contents Back
▼
▼
Help Contents Back
▼
▼
What Do the Data Say?
Directions: Answer the questions below byplacing the correct letter or answer in theblank(s) provided.
Three types of solid waste materials are identified in the circle graph to the right.
_____ Which material represents 38% of all solid waste materials generated?
a. yard trimmings b. wood c. paper and paperboard
_____ Which material represents 5% of all solid waste materials generated?
a. yard trimmings b. wood c. paper and paperboard
_____ The total of the percentages of all eight types of solid waste materials (all eight sections of the circle graph) is:
a. 180% b. 45% c. 100% d. 90%
Name three types of materials (not listed on the circle graph above), which are also materials foundin municipal solid waste.
________________________ ________________________ ________________________
_____ People put old or used products in their garbage. It is important for recycling purposes toknow what type of materials these products are made of because:
a. some materials make better or more useful products than others
b. some recyclable materials last longer than others
c. materials must be recycled separately from each other
d. products of different materials can be recycled together
In Ohio in 1996, 32% of all solid waste was recycled. The rest was disposed of in landfills orincinerators. On the back of this page, make a circle graph. Label and give percentages for both therecycling rate and the disposal rate. Also, give your graph a title.
8
7
654
3
2
1
paper andpaperboard
wood
yard trimmings
Windows on Waste - TRASHOLOGY 101 I

ProcedureDiscuss with students the differ-
ence between measurements of weightand volume.
Give students the handout, Weightin Space, and compare the figures forthe materials based on weight and vol-ume (space). Ask students: Why dosome materials take up more space thanweight relative to other materials?Conduct a demonstration, or have stu-dents experiment to densify variousitems of trash, such as a plastic cup anda paper cup that are the same size.
Discuss how, when conducting asolid waste analysis, it is more difficultto arrive at “exact” measurements ofvolume than for weight for solid wastematerials. Have students mentally pic-ture a garbage truck arriving at a land-fill. The truck could be weighed (on ascale) or the landfill operator might cal-culate the amount by the volume ofgarbage in the truck. (Estimates of vol-ume are less reliable than those basedon weight because there is less consen-sus of what constitutes volume mea-
surements, particularly under landfillconditions where compaction variesfrom landfill to landfill and truck totruck.) The handout, Weight in Space,shows volume measures for waste mate-rial based on one method derived froma garbology project at the University ofArizona. The next step includes a hand-out with another method of derivingvolume.
Most solid waste analyses are conductedwith measurements of weight, as indi-cated in the previous activity; however,the problem for communities is oftenone of space at the local landfill.
Have students complete the hand-out, Making Reservations at the Landfill.Review and discuss answers. Beforeanswering the last question on thehandout, you will need to give studentssome idea of the size of a cubic yard.
In groups, have students brain-storm problem-solving strategies forcalculating one of the following:
(a) How much garbage does the com-munity generate in a year and howmuch space would it require at a land-
5
43
2
1
It Takes a Big HoleObjectivesStudents will be able to: (a) explain the difference between measurements of weight
and volume as they apply to solid waste disposal; and (b) calculate the volume of
space required to bury waste at a landfill.
Act
ivity
3
Inquiry● What amount of land space
is required to dispose of solidwaste?
Content DomainMath – Arithmetic
Learning OutcomesMath, Grade 4, #8, #19 andGrade 6, #3, #5, #6
Duration45 minutes
Materialspencil, paper
Handouts● Weight in Space
● Making Reservations at theLandfill
TRASHOLOGY 101Windows on Waste - TRASHOLOGY 101 I 48
48©Ohio Department of Natural Resources
Help Contents Back
▼
▼
Help Contents Back
▼
▼

49
49©Ohio Department of Natural Resources
Help Contents Back
▼
▼
Help Contents Back
▼
▼
fill? (You will need to use populationdata of your local community and, ifthis data is not broken out into adultsand children, figure an average forboth – 4.5 pounds per day.)
(b) How much garbage is generated inthe state of Ohio on a yearly basis?(The population of Ohio is approxi-mately 11 million people.)
Have groups create pictures ofhow much space each of theseamounts of garbage would require.
Discuss with students how recy-cling can reduce our dependence onlandfill space. Pose the followingproblem: If 25 percent of all solidwaste generated is recycled, how muchless landfill space would be requiredin each of the cases above? Calculatewhat this would be if the recyclingrate is 30 percent, 40 percent, 50 per-cent. (Many experts believe that arecycling rate above 50 percent isunrealistic.)
AssessmentWhichever problem was used in Step5, choose the other one to give eachstudent to assess their understanding.
7
6
Windows on Waste - TRASHOLOGY 101 I

Student Handout ✐50
50©Ohio Department of Natural Resources
Help Contents Back
▼
▼
Help Contents Back
▼
▼
MATERIALS AND PRODUCTS DISCARDED IN MSW BY WEIGHT*(As a percentage of the total amount of materials discarded, after materials recovery)
PAPER & PAPERBOARD .....................................32%
YARD WASTE.........................................................14%
PLASTICS...............................................................12%
OTHER WASTES ...................................................12%
FOOD WASTES ......................................................9%
WOOD ......................................................................9%
METALS...................................................................6%
GLASS ....................................................................6%
TOTAL.............................................100%
MATERIALS DISCARDED IN MSW BY VOLUME*(As a percentage of the total amount of materials discarded, after materials recovery)
PAPER & PAPERBOARD......................................34%
PLASTICS..............................................................20%
OTHER WASTES ...................................................15%
METALS..................................................................12%
YARD WASTE.........................................................10%
WOOD.......................................................................4%
FOOD WASTEs .......................................................3%
GLASS .....................................................................2%
TOTAL.............................................100%
*These figures are based on a solid waste analysis conducted in 1990 using 1988 data. Source: FranklinAssociates, Ltd., Characterization of Municipal Solid Waste in the United States: 1990 Update preparedfor the U. S. Environmental Protection Agency (Prairie Village, KS: 1990), pp. 87-88.
Weight in Space*Below are two charts that indicate the type of materials discarded in landfills andincinerators in the United States. These materials are from consumer products thatpeople buy, use and throw away. All of these things are called municipal solid waste orMSW. The majority (99%) of MSW discarded in Ohio is disposed of in landfills.
Windows on Waste - TRASHOLOGY 101 I
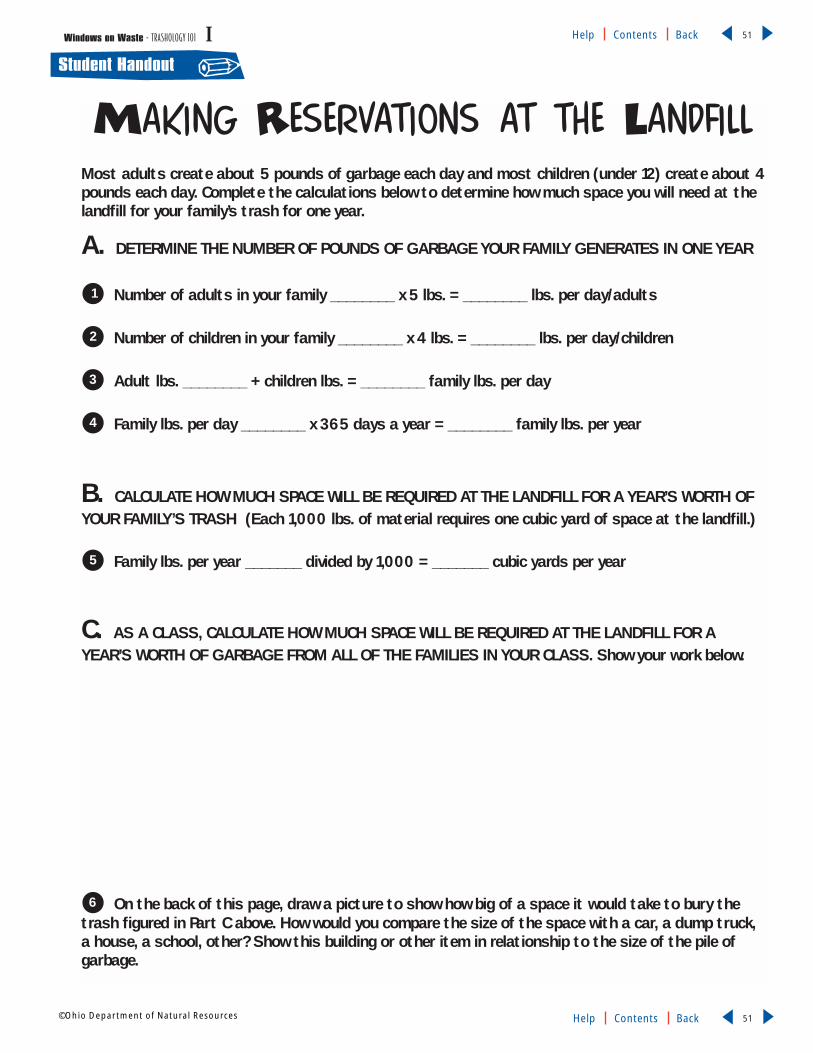
Windows on Waste - TRASHOLOGY 101 IStudent Handout ✐
51
51©Ohio Department of Natural Resources
Help Contents Back
▼
▼
Help Contents Back
▼
▼
Making Reservations at the LandfillMost adults create about 5 pounds of garbage each day and most children (under 12) create about 4pounds each day. Complete the calculations below to determine how much space you will need at thelandfill for your family’s trash for one year.
A. DETERMINE THE NUMBER OF POUNDS OF GARBAGE YOUR FAMILY GENERATES IN ONE YEAR
Number of adults in your family ________ x 5 lbs. = ________ lbs. per day/adults
Number of children in your family ________ x 4 lbs. = ________ lbs. per day/children
Adult lbs. ________ + children lbs. = ________ family lbs. per day
Family lbs. per day ________ x 365 days a year = ________ family lbs. per year
B. CALCULATE HOW MUCH SPACE WILL BE REQUIRED AT THE LANDFILL FOR A YEAR’S WORTH OFYOUR FAMILY’S TRASH (Each 1,000 lbs. of material requires one cubic yard of space at the landfill.)
Family lbs. per year _______ divided by 1,000 = _______ cubic yards per year
C. AS A CLASS, CALCULATE HOW MUCH SPACE WILL BE REQUIRED AT THE LANDFILL FOR AYEAR’S WORTH OF GARBAGE FROM ALL OF THE FAMILIES IN YOUR CLASS. Show your work below.
On the back of this page, draw a picture to show how big of a space it would take to bury thetrash figured in Part C above. How would you compare the size of the space with a car, a dump truck,a house, a school, other? Show this building or other item in relationship to the size of the pile ofgarbage.
6
5
4
3
2
1

GARBAGE GOODSEnvironmental StudiesLearning Concept
Economic activities require the
use of natural resources and
therefore impact the environ-
ment. Business and industry utilize
resources to produce economic
wealth. They rely on inputs in the
form of resources and energy to pro-
vide goods and services. Sometimes,
the desire to produce wealth conflicts
with the conservation of natural
resources.
Solid waste results from the eco-
nomic decisions of consumers and
producers. It is composed of materi-
als and products that were discarded,
but at one time represented the
wants and needs of consumers.
Recycling renews usefulness to mate-
rials that would otherwise be wasted
by reintroducing them back into
production processes. This can pro-
vide economic incentives to recycle
by reducing the costs of production.
When economics alone does not
provide an incentive to recycle,
environmental concerns provide
reasons to recycle, including saving
energy, resources and land space
(for landfills), and reducing pollu-
tion. Recycling also promotes an
ethical value – frugality.
Vocabularycapital – the resources, used to produce a good or service, made by pasthuman efforts including buildings, machinery, vehicles and tools; a factor ofproduction
entrepreneurship – the ability of a person to make decisions about using economic resources to make a profit
factors of production – all of the resources required to produce a good or ser-vice divided into four groups of productive resources: land, labor, capital andentrepreneurship
goods – things or tangible products that are produced by manufacturers
labor – the knowledge, skills and physical abilities of people used to produce agood or service; a factor of production
land – the natural resources, or materials used in place of natural resources,that are used in production processes; a factor of production
market – a gathering of people for buying and selling things; a type ofeconomic organization in which the forces of supply and demand are reliedupon to make decisions about the production and consumption of goods andservices
natural resources – raw materials occurring in nature
primary materials – natural resources used in production processes
raw materials – natural resources, processed materials or recycled materialsused in manufacturing processes
recycling – the act of collecting and separating materials and products fromthe solid waste stream and reusing them as raw materials in manufacturingprocesses
secondary materials – the recycled materials used as raw materials in production processes
services – actions that are provided by public and private enterprises
52Windows on Waste - GARBAGE GOODS II Help Contents Back
▼
▼
52©Ohio Department of Natural Resources Help Contents Back
▼
▼

Windows on Waste - GARBAGE GOODS II Help Contents Back
▼
▼
53©Ohio Department of Natural Resources Help Contents Back
▼
▼
53
1
2
Activity 1: Econo-CommunityDescription Students are introduced to basic economic concepts such as goods, services, con-sumption and production in relation to natural resources, solid waste managementand recycling. Students develop group discussion skills by responding to inquiriesabout the “wants” associated with five recyclable products that represent commonrecyclable materials in the municipal solid waste stream. They place “missing pieces”(representing businesses) on an economic model by interpreting information andmaking inferences from sequential stages in the production of the five products.Students analyze the model closely to make deductions about the environmental benefits of recycling and what is necessary to “close the production-consumptionloop.”
Ohio Proficiency Test Learning OutcomesGrade 4, Citizenship #11– Name the resources needed to produce various goods and services, classify each resource by the factors of production, or suggest alternative uses forthose factors.
Grade 4, Citizenship #12– Classify various economic activities as examples of productionor consumption.
Grade 4, Science #14– Identify and/or describe the relationship between human activityand the environment.
Grade 6, Citizenship #13– Identify the factors that influence: consumer decisions todemand goods or services, producer decisions to supply goods or services.
Activity 2: Business BoxesDescription Students role-play entrepreneurs of a recycling business, manipulating materials toconstruct models of their businesses using shoe boxes. They cooperate in groups toproblem solve what is needed to operate a recycling business. Students read and inter-pret the definitions of the factors of production and classify the elements of a recy-cling business according to each factor.
Ohio Proficiency Test Learning OutcomesGrade 4, Citizenship #10 – Identify the factors of production (land, labor, capital andentrepreneurship) needed to produce various goods and services.
Grade 4, Citizenship #11 – Name the resources needed to produce various goods and services, classify each resource by the factors of production, or suggest alternative uses forthose factors.
Grade 6, Citizenship #12 – Describe the role of each factor of production in producing aspecific good or service and suggest alternative uses for the resources involved.
Summary
This lesson includes three
activities. Although
each may be conducted
separately, the first activity
provides a good foundation for
conducting the second and
third activities, especially for
students with a limited
understanding of economic
concepts. The third activity is
an extended version of the
second activity and requires
more time and materials.
Overview - GARBAGE GOODS
54Windows on Waste - GARBAGE GOODS II Help Contents Back
▼
▼
54©Ohio Department of Natural Resources Help Contents Back
▼
▼
3Activity 3: Enterprising RecyclingDescription Students analyze the role of natural resources and recyclable materials as factors ofproduction. They role-play entrepreneurs who produce recycled-content products.Students conduct research about the production of specific products and manipulatematerials to build model factories using shoe boxes and make illustrations based ontheir research. Students compare the costs of producing products from naturalresources and from recycled materials by reading and interpreting economic informa-tion to solve mathematical problems.
Ohio Proficiency Test Learning OutcomesGrade 4, Citizenship #10 – Identify the factors of production (land, labor, capital andentrepreneurship) needed to produce various goods and services.
Grade 4, Citizenship #11 – Name the resources needed to produce various goods and services, classify each resource by the factors of production, or suggest alternative uses forthose factors.
Grade 4, Mathematics #4 – Identify needed information to solve a problem.
Grade 4, Mathematics #8 – Add, subtract, multiply and divide whole numbers andexplain, illustrate or select thinking strategies for making computations.
Grade 4, Mathematics #11 – Add and subtract decimals.
Grade 4, Science #14 – Identify and/or describe the relationship between human activityand the environment.
Grade 6, Citizenship #12 – Describe the role of each factor of production in producing aspecific good or service and suggest alternative uses for the resources involved.
Grade 6, Citizenship #13 – Identify the factors that influence: consumer decisions todemand goods or services, producer decisions to supply goods or services.
Grade 6, Mathematics #3 – Apply appropriate notations and methods for symbolizing theproblem statement and solution process.
Grade 6, Mathematics #6 – Compute with whole numbers, fractions, decimals.

Recycling, generally per-ceived as an environ-mental action, is alsoan integral part of oureconomic system. Itplays a role in our eco-
nomic market system because itinvolves the production of both goodsand services. Environmentally, recy-cling offers a beneficial alternative towaste disposal. In general, it conservesenergy, resources and land space.Therefore, the incentives to recycleinclude both economic and environ-mental factors.
Two types of markets are impor-tant to recycling. First, and mostobservable, is the market for consumergoods, in which goods such as food,containers and appliances are pur-chased by individuals and households.Most of these goods, at one time oranother, end up as solid waste. If theyare taken to a landfill for disposal theyare wasted, whereas recycling offers achance to reuse these goods.
Most citizens are familiar withrecycling collection programs, butcollection is only half of the story. Asrecyclable materials become part ofmanufacturing processes, they enteranother type of market, the marketfor resources. In the market forresources, manufacturing businessesare consumers of resources – bothnatural and recycled – for the produc-tion of goods.
It is often said that economicdecisions begin with a “want” – a con-sumer demand for a good or servicewithin the market system. In otherwords, individuals and householdsmust “want” (buy) recycled-contentproducts to provide an incentive torecycle. Producers will then meet thisconsumer demand. On the produc-tion side, there is another incentive touse recycled material, when producers
can lower production costs (savemoney) by using recycled materials inplace of natural resources.
Using recycled materials benefitsthe economy and the environment.From an economic perspective, asproduction costs are lowered, profitsmay increase and consumer prices arelikely to decrease. From an environ-mental perspective, resources, energyand land space may be conserveddepending upon the industrialprocesses used to make specific goods.Recycling, however, is problematicbecause collecting and processingrecycled materials is not always eco-nomically sustainable, and using recycled materials in manufacturingdoes not always guarantee lower production costs.
Producers make economic deci-sions based on the factors of produc-tion. The factors of production areland, labor, capital and entrepreneur-ship. Examples within each factor arecalled productive resources, orresources. Land refers to productive
resources occurring in nature (trees,minerals, soil, water, plants and ani-mals). Land resources are also naturalresources. Recycled materials are landresources because they can be used inplace of natural resources. Energy andenergy sources are also land resources.
Natural resources and recycledmaterials are used as raw materials tomake products. Natural resources arecalled primary (raw) materials orvirgin materials, while recycled mate-rials are called secondary (raw) mate-rials. Primary materials may be nat-
ural resources or processed materials,the latter being natural resources thathave been refined by manufacturingprocesses. For example, iron ore is a“natural” raw material in the produc-tion of steel, while steel is a“processed” raw material in the production of automobiles. Recycledmaterials are processed raw materialsthat may take the place of primaryraw materials in manufacturingprocesses.
Capital, another factor of pro-duction, includes resources such astools, machines and buildings. Oneway to identify whether a productiveresource is land or capital, is toremember land resources become partof the good or product being produced.Capital resources, on the other hand, donot become a part of the good beingproduced. This is another reason whyrecycled material and energy are con-sidered land resources.
Labor is a factor of productionthat consists of the knowledge, skillsand physical abilities of the people
that are used to produce goods andservices. Sometimes labor is called ahuman resource or human capital(the latter denoting developed skills).
Entrepreneurship is the abilityto make decisions about how to usethe other factors of production so aproduct makes a profit. Entrepreneursare people who start businesses withinitial investments.
The factors of production areused to produce a good or provide aservice within the context of marketsand communities. Overall land use
Background InformationWindows on Waste - GARBAGE GOODS II Help Contents Back
▼
▼
55©Ohio Department of Natural Resources Help Contents Back
▼
▼
55
Recycling, generally perceived as an environmentalaction, is also an integral part of our economic system.

Windows on Waste - GARBAGE GOODS II Help Contents Back
▼
▼
56©Ohio Department of Natural Resources Help Contents Back
▼
▼
56
within a community is based on thetypes of goods and services that areproduced and sold. Communitiesthemselves include three importantsectors of the economy: services sec-tor, manufacturing sector and naturalresources sector.
Services are actions. The servicessector includes private businesses andpublic enterprises such as schools,grocery stores, retail stores, local gov-ernment, and health care and medicalproviders. Solid waste collection is aservice provided by a local govern-ment, private waste haulers or a com-bination of both. Goods are things, ortangible products that are produced inthe manufacturing sector. Naturalresources are those things that existin nature (not made by humans) thatcan either be used to make productsor enjoyed as they exist in nature.Recyclers collect and prepare usedgoods so that they can be used inmanufacturing processes instead ofnatural resources. For this reason,recycling enterprises may be consid-ered as part of the natural resourcessector of the economy.
Bibliography and AdditionalResourcesStudent Resources
Recycling, by Rebecca Stefoff, NewYork: Chelsea House, 1991.
Recycling, by Don Nardo, San Diego:Lucent Books, 1992.
Plastics, by Judith C. Galas, San Diego:Lucent Books, 1995.
How a Crayon Is Made, by Oz Charles,New York: Scholastic, 1988.
Educator Information
The Next Efficiency Revolution:Creating A Sustainable MaterialsEconomy, by John E. Young and AaronSachs, World Watch Institute, 1994.
“Can Business Save the Environment?”by Dick Russell, Owen deLong andEve Pell, E Magazine,November/December 1991, vol. 2, #6.
Green Business: Hope or Hoax, ed. byChristopher Plant and Judith Plant,Philadelphia: New Society Publishers,1991.
Mastering the Economic Concepts,Grades 3-4, ed. by Douglas A. Haskell,Cincinnati: The Greater CincinnatiCenter for Economic Education, 1996.
Mastering the Economic Concepts,Grade 6, ed. by Douglas A. Haskell,Cincinnati: The Greater CincinnatiCenter for Economic Education, 1996.
Economics and the Environment:Ecodetectives, by Mark C. Schug, JohnS. Morton and Donald R. Wentworth,New York: National Council onEconomic Education, 1997.
Background Information, continued

Windows on Waste - GARBAGE GOODS II Help Contents Back
▼
▼
57©Ohio Department of Natural Resources Help Contents Back
▼
▼
57
GARBAGE GOODS
ProcedureYou may pre-assess student under-
standing of the economic concepts thatwill be part of the activity by using oneor both of the methods explained in theAssessment section of this activity. Usethe pre-test to determine which termsand concepts are not clearly understoodso you can emphasize them during theactivity. Or, if students show an under-standing of concepts and terms in theactivity, you may wish to advance to oneof the next two activities in the lesson.
Arrange the five display items(plastic detergent bottle, writing papertablet (lined), aluminum soda can, glasspickle jar and steel soup can) so all thestudents can see them. Lead a discus-sion about basic economic concepts byfollowing inquiries on the teacher hand-out, Teacher-Led Inquiry of EconomicTerms.
After the inquiry discussion, giveeach student the handout, Econo-Puzzle.
Discuss the meaning of the handout asa model of our economic system.Initially, tell students to disregard thenumbered blank spaces. They representbusinesses that the students will soonexamine. Explain how the terms “ser-vices,” “goods,” and “natural resources”indicate important sectors of the econo-my in which businesses exist. Ask stu-dents to give other examples of goods,services and natural resources otherthan the ones depicted in the model.
Have students make inferencesabout what type of businesses the num-bered blank spaces may represent. Dothis by giving each student the half-pagehandout, Missing Pieces, and have themcut out the various businesses and placethem on the model where they thinkthey belong. After reviewing eachanswer, have students glue the business-es in the appropriate spaces.
ANSWERS: 1. plastic bottle factory, 2.paper factory, 3. glass jar factory, 4. alu-minum can factory, 5. steel can factory,
4
3
2
1
Inquiries● What happens to recycled
materials after they have beencollected?
● How is recycling a part of theeconomic system?
● What are the environmentalbenefits of recycling?
Content DomainScience – Natural resources
Social Studies – Economics
Learning OutcomesCitizenship, Grade 4, #11, #12and Grade 6, #13
Science, Grade 4, #14
Duration50-75 minutes
MaterialsFive items for display: plasticdetergent bottle, writingpaper tablet (lined), alu-minum soda can, glass picklejar, steel soup can (containersshould be unopened); scissorsand glue (for each student);transparency of the handout,Econo-Community (optional)
Handouts● Teacher-Led Inquiry of
Economic Terms
● Econo-Puzzle
● Missing Pieces
● Econo-Community
● How Five Goods are Produced
● Econo-Community Model:Follow-up Questions
● Goods, Garbage & Resources
Econo-CommunityObjectivesStudents will be able to: (a) identify production and consumption activities that are
part of our economic system; (b) explain how the production of goods, including
those made from recycled materials, is based on consumer demand to satisfy wants
or needs; (c) explain how recyclables are used after they have been diverted from
solid waste disposal; and (d) identify the natural resources used to make common
goods and explain how using recyclables can reduce the amount of natural resources
and energy used in production processes.
Act
ivity
1

Windows on Waste - GARBAGE GOODS II Help Contents Back
▼
▼
58©Ohio Department of Natural Resources Help Contents Back
▼
▼
58
6. recycling facility, 7. garbage collec-tion facility, 8. landfill
The handout, Econo-Community,depicts all the answers. You may wishto make an overhead of this for use inthe discussion which follows.
Review with students thesequence of businesses that arerequired in order to produce each ofthe five display products. The supple-mental handout, How Five Goods areProduced, may be used by the teacheror given to students to help explainthe various production processes.Some natural resources required tomake the food products are notdepicted on the model, such as plantsand animals (farming). You may wishto ask students which resources andbusinesses are missing and have themwrite the name of the business on themodel in the appropriate sector. Thehandout, How Five Goods areProduced, provides information onbusinesses that are missing.
NOTE: The entire model is generic innature. With any product item, thenumber of businesses involved in theproduction of the various goods ornatural resources will vary at differentstages. Also, many more ingredients,chemicals and processes are requiredthan are depicted.
Have students identify the natur-al resources used to make commongoods and alternative uses of theseresources by examining the Econo-Community model and answering thefollowing questions:
● Which natural resource is requiredto make each of the various prod-ucts (containers, writing paper, etc.)in the model?
● What other types of products canbe made from glass, plastic, paper,steel and aluminum, other than theones depicted in the model?
● What is the value of recycling in the
model? You may wish to use thehandout for teacher-led discussion,Econo-Community Model: Follow-upQuestions, for this purpose.
Have students look at the Econo-Community model and describe whatis meant by the phrase “closing theloop.” The “production-consumption”loop is closed when materials arerecycled and consumers then buythose recycled materials. Have stu-dents trace a loop on the model forany one material. They can begin witha product (can, bottle, paper, etc.) intheir household garbage, trace its paththrough garbage collection and sepa-ration for recycling, its reintroductioninto the manufacturing process, itssale to stores where it is bought byconsumers. The production-con-sumption loop is not completed whenrecyclable materials are thrown awaybecause their use ends at the landfill.
Have students examine the loopsthey made. Ask what natural resourcesare saved when recycled materials areused. (Both natural resources andenergy resources are saved.) A recy-cled-content product is rarely madeusing 100 percent recycled material.Some amount (varying from 10 to 90percent) of natural resources is typi-cally required when using recycledmaterial, depending upon the productproduced.
AssessmentAssess student understanding of theterms and concepts in the activity byusing one or both of the followingmethods.
Method A: Assemble the five displayitems (plastic detergent bottle, writingpaper tablet (lined), aluminum sodacan, glass pickle jar, steel soup can) soall students can see them. Have eachstudent choose one of the items anddepict its history in the form of a dia-gram with pictures and written
descriptions to explain the diagramand pictures. Students should depicteverything – natural resources, busi-nesses, consumers, etc. – associatedwith the “life of the product.” Theyshould also include what happens tothe product when it is and when it isnot recycled. Use a rubric to evaluatethe projects.
Method B: Have students completethe handout, Goods, Garbage &Resources. This latter assessment useslanguage and concepts of the statemodel proficiency test outcomes.
ANSWERS to handout, Goods,Garbage & Resources: 1. b, 2. c, 3. b,4. a, 5. b, 6. d
ExtensionsHave students research the
manufacturing of the products in theactivity to discover the complexities(other businesses and resources) thatare not represented in the model.
Revisit the economic concept ofconsumer demand based on “wants.”If people want to conserve resourcesand energy and save landfill space,they must buy recycled-content prod-ucts. Take students or have them visit,on their own, a local store and askthem to make a list of products madefrom recycled-content materials. Askthe store to display posters or othermaterials (brochures, etc.) created bythe students that tell consumers whattypes of recycled-content products aresold in the store.
2
1
8
7
6
5

?Before classroom discussion:Set up the five display items below so allstudents can view them:
● plastic detergent bottle
● writing paper tablet (lined)
● glass pickle jar
● aluminum soda can
● steel soup can
How do the five items representwhat (some) people want?
What are the “wants” associated with thedetergent bottle?
The person or consumer “wants” clothes tobe clean, “wants” what is in the detergent,“wants” a sturdy, unbreakable container,“wants” a strong handle for carrying, etc.
What are the “wants” associated with thewriting paper tablet?
The consumer “wants” paper to write some-thing on, “wants” lined paper to write instraight lines, “wants” the quantity of sheetssupplied, “wants” the stiff backing for sup-port, etc.
What do all five items have in com-mon?
Among various answers, be sure to pointout that all five are considered goods, ineconomic language. Goods are tangiblethings (things you can see, touch, smell,taste or hear).
Why do people buy goods at a store,such as a grocery store? Why not buy eachitem individually from the business thatmakes it? It may even be cheaper to buyeach item directly from the business thatproduces it.
People, or consumers, “want” a service. Agrocery store provides the service of distrib-uting a variety of items at one location sopeople do not need to go to various loca-tions. So when people buy goods at a store,they are also buying a service.
How is a service different from agood?
A service is an action, not a thing orproduct.
What are examples of businesses thatprovide services? (banks, hospitals, gas sta-tions, etc.)
What are examples of businesses thatproduce goods?
Any type of manufacturing enterprise orfactory for cars, soap, toys, etc.
What are natural resources?
They are things that occur in nature, suchas minerals (coal, iron ore, copper, gemstones), water, plants and animals.
What is consumption?
Solicit examples of someone consuming(buying) a good and a service. (Parentsconsume education – a service – for theirchildren.)
What is production?
Solicit examples of someone producing(making) a good and a service. (Teachersare examples of people producing a service – education.)
8
7
6
5
4
3
2
1
59Help Contents Back
▼
▼Windows on Waste - GARBAGE GOODS II
59©Ohio Department of Natural Resources Help Contents Back
▼
▼
Teacher-Led Inquiry of Economic Terms

Windows on Waste - GARBAGE GOODS IIStudent Handout ✐
60Help Contents Back
▼
▼
60©Ohio Department of Natural Resources Help Contents Back
▼
▼
Indi
vidua
l and
Hou
seho
ld W
ants
Scho
olSt
ore
8
Nat
ural
Res
ourc
es
7
Laun
dry
dete
rgen
tfa
ctor
y
Writ
ing
pape
r fa
ctor
yPi
ckle
fact
ory
Soda
pop
fact
ory
Soup
fact
ory
12
34
56
Power plant (electricity)Energy
Coal
min
eO
il we
llTr
ee fa
rmSa
ndst
one
quar
ryBa
uxit
e m
ine
Iron
ore
m
ine
Goo
ds P
rodu
ctio
n
Serv
ices
Econo-Puzzle

Student Handout ✐61Help Contents Back
▼
▼Windows on Waste - GARBAGE GOODS II
61©Ohio Department of Natural Resources Help Contents Back
▼
▼
Missing Pieces
Missing Pieces
Steel can factory
Paperfactory
Aluminum can factory
Garbage collection
facility
Landfill Glass jarfactory
Recyclingfacility
Plastic bottle
factory
Steel can factory
Paperfactory
Aluminum can factory
Garbage collection
facility
Landfill Glass jarfactory
Recyclingfacility
Plastic bottle
factory

Indi
vidua
l and
Hou
seho
ld W
ants
Scho
olSt
ore
Land
fill
Nat
ural
Res
ourc
es
Gar
bage
co
llect
ion
faci
lity
Laun
dry
dete
rgen
tfa
ctor
y
Writ
ing
pape
r fa
ctor
yPi
ckle
fact
ory
Soda
pop
fact
ory
Soup
fact
ory
Plas
tic
bott
le
fact
ory
Pape
rfa
ctor
yG
lass
jar
fact
ory
Alu
min
umca
n fa
ctor
ySt
eel c
anfa
ctor
yRe
cycl
ing
faci
lity
Power plant (electricity)Energy
Coal
min
eO
il we
llTr
ee fa
rmSa
ndst
one
quar
ryBa
uxit
e m
ine
Iron
ore
m
ine
Goo
ds P
rodu
ctio
n
Serv
ices
Econo-Com
munity
Windows on Waste - GARBAGE GOODS II
✐
62Help Contents Back
▼
▼
62©Ohio Department of Natural Resources Help Contents Back
▼
▼
Econo-Puzzle Key

LAUNDRY DETERGENT PRODUCTIONTwo goods are involved – the detergent and the plastic container.
In the natural resources sector, an oil well business* must extract petroleum and make plas-tic resin from it. [A business must extract the petroleum needed to make the detergent.]**
In the goods production sector, a plastic bottle factory must use plastic resin to make plasticbottles in which to put the detergent. It sells the containers to a laundry detergent factory,which makes detergent from natural resources and puts it in the bottles.
WRITING PAPER TABLET PRODUCTIONAlthough no packaging is implied in this model, sometimes tablets come wrapped in plastic.
In the natural resources sector, a tree farm business must cut down trees and grind theminto chips.
In the goods production sector, a paper factory uses wood chips to make rolls of paper. Awriting paper factory buys the rolls of paper and cuts them into sheets and prints lines on thesheets.
PICKLE PRODUCTIONTwo goods are involved – the pickles and the glass container.
In the natural resources sector, a sandstone quarry business mines sandstone for makingglass jars. [A farming business must grow cucumbers to make pickles.]
In the goods production sector, a glass jar factory uses sandstone to make glass jars. Thepickle factory makes pickles from cucumbers and puts them in glass jars.
SODA POP PRODUCTIONTwo goods are involved – the soda pop and the aluminum container.
In the natural resources sector, a bauxite mining business takes bauxite from extracted alu-minum ore to make aluminum. [A farming business grows grapes, lemons and limes, etc. tomake soda pop.]
In the goods production sector, an aluminum can factory makes aluminum cans. A soda popfactory makes soda pop and puts it in aluminum cans.
SOUP PRODUCTIONTwo goods are involved – soup and the steel container.In the natural resources sector, an iron ore mining business obtains iron ore. [A farmingbusiness grows plants or raises livestock to produce the ingredients to make soup.]In the goods production sector, a steel can factory makes steel cans from iron ore. A soupfactory makes soup and puts it in steel cans.
* Italics indicate businesses that are depicted on the model, Econo-Puzzle or Econo-Community.
** Brackets indicate businesses that are not depicted on the model, Econo-Puzzle or Econo-Community.
How Five Goods are Produced
+=
+=
+=
+=
+=
SOAP
Student Handout ✐63Help Contents Back
▼
▼Windows on Waste - GARBAGE GOODS II
63©Ohio Department of Natural Resources Help Contents Back
▼
▼

What do all of the businesses (and other places on
the model) need?
ANSWER: Energy and natural resources.
[Teachers may wish to review other sources of energy
than the one (coal-electricity) highlighted on the
model.]
What happens to recyclable materials after they
have been collected by a recycling facility?
ANSWER: Businesses, such as factories, buy the recy-
cled materials to make containers or other products.
(plastic bottle factory, paper factory, etc. in the goods
production sector)
Why must recycled materials be separated in order
to sell them to other businesses?
ANSWER: Each business uses unique technological
processes to make a specific type of material product.
For example, aluminum can factories can only use
recycled aluminum (or bauxite) in their processes to
make aluminum cans; plastic bottle factories can only
use recycled plastic (or natural plastic resin) to make
plastic bottles.
How does the use of recycled materials reduce the
amount of natural resources required to make
products?
ANSWER: Recycled material can be used in place of
natural resources. Generally, some amount of natural
resources is always required in production processes,
even when recycled materials are used. The amount of
recycled material that can be used varies from high
percentages in the case of steel and aluminum to lower
percentages in the case of some paper and glass prod-
ucts, depending upon the production processes used
and the quality of the product produced.
How does the use of recycled materials reduce the
amount of energy required to make products?
ANSWER: In the case of many production processes
(e.g., aluminum and glass), lower furnace temperatures
are required to melt recycled materials than are
required to melt natural resources. Also, less energy is
used to mine and transport resources when recycled
materials are used. (In a few production processes, the
use of recycled materials may actually require more
energy. However, even in these cases, the energy used to
mine and transport resources is reduced when recycled
materials are used.)
What can people do to increase the amount of
materials that are collected for recycling?
ANSWER: People can become part of a recycling pro-
gram at home or school. Most importantly, they can
create an economic incentive to recycle within the mar-
ket place by buying products made of recycled-content
material.
6
5
4
3
2
1
Econo-Community Model: Follow-up Questions
Windows on Waste - GARBAGE GOODS IIStudent Handout ✐
64Help Contents Back
▼
▼
64©Ohio Department of Natural Resources Help Contents Back
▼
▼
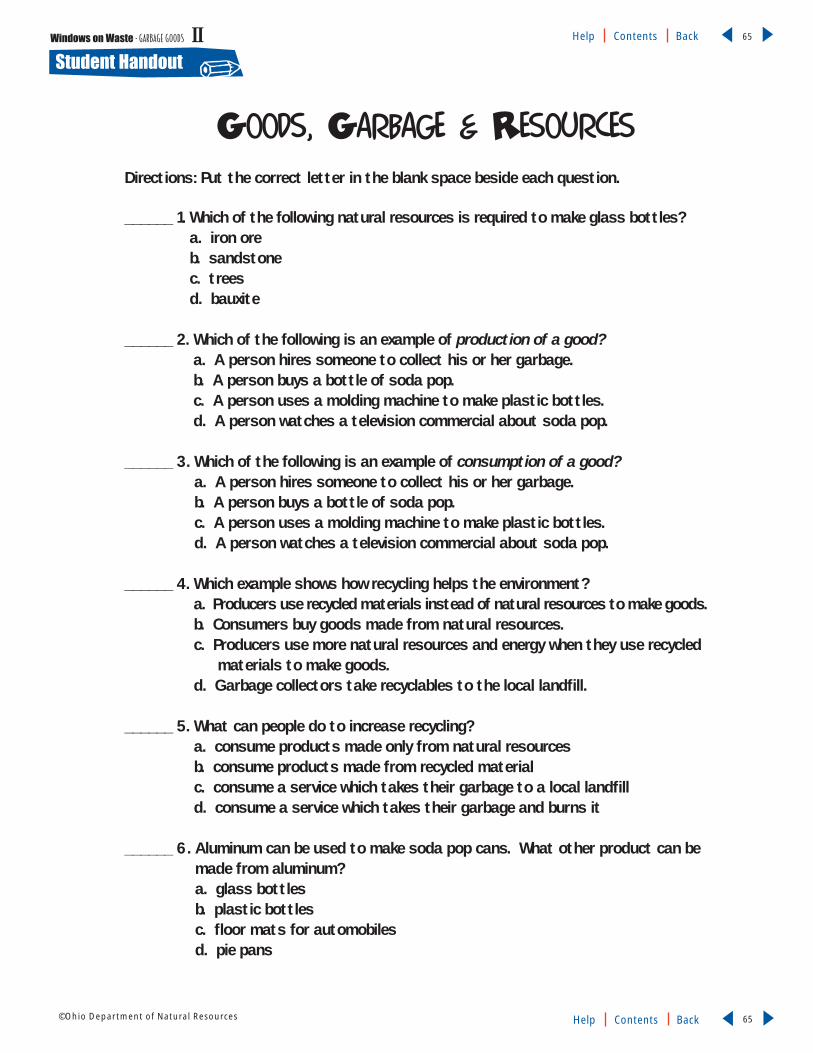
Goods, Garbage & ResourcesDirections: Put the correct letter in the blank space beside each question.
______ 1. Which of the following natural resources is required to make glass bottles?a. iron oreb. sandstonec. treesd. bauxite
______ 2. Which of the following is an example of production of a good?a. A person hires someone to collect his or her garbage.b. A person buys a bottle of soda pop.c. A person uses a molding machine to make plastic bottles.d. A person watches a television commercial about soda pop.
______ 3. Which of the following is an example of consumption of a good?a. A person hires someone to collect his or her garbage.b. A person buys a bottle of soda pop.c. A person uses a molding machine to make plastic bottles.d. A person watches a television commercial about soda pop.
______ 4. Which example shows how recycling helps the environment? a. Producers use recycled materials instead of natural resources to make goods. b. Consumers buy goods made from natural resources. c. Producers use more natural resources and energy when they use recycled
materials to make goods.d. Garbage collectors take recyclables to the local landfill.
______ 5. What can people do to increase recycling?a. consume products made only from natural resourcesb. consume products made from recycled materialc. consume a service which takes their garbage to a local landfilld. consume a service which takes their garbage and burns it
______ 6. Aluminum can be used to make soda pop cans. What other product can bemade from aluminum?a. glass bottlesb. plastic bottlesc. floor mats for automobilesd. pie pans
Student Handout ✐65Help Contents Back
▼
▼Windows on Waste - GARBAGE GOODS II
65©Ohio Department of Natural Resources Help Contents Back
▼
▼

Windows on Waste - GARBAGE GOODS II Help Contents Back
▼
▼
66©Ohio Department of Natural Resources Help Contents Back
▼
▼
66
PreparationNOTE: This activity and the next one,Enterprising Recycling, are good follow-up activities to the concepts explored inthe economic model (see Econo-Community handout, p. II-12 ) in theprevious activity, Econo-Community.You may wish to review this activity,Business Boxes, and the next activity,Enterprising Recycling, to determinewhich you want to conduct, becauseboth utilize the making of “businessboxes” to teach students about the fac-tors of production. However, the twoactivities are also different. BusinessBoxes is limited to teaching about thefactors of production focusing on recy-cling centers as a business. The activity,Enterprising Recycling, is more complex;it focuses on producers of products andincludes research, mathematical calcula-tions, environmental impacts and con-troversial issues. If you have time, bothactivities may be conducted withoutrepetition (except of important terms)and are compatible with each other.
Before the activity, have students pre-pare shoe boxes to become “businessboxes.” Have each student write his/hername on the bottom of his/her ownbox. They should make the outside ofthe box as plain as possible. Words and
brand names should be covered.Students can cover the outside of theboxes with construction paper, or usemarkers to cover existing details. Havestudents draw windows and a door onthe outside of the box. Make sure stu-dents attach things or mark on theboxes so the lids will close.
Find the handout, Econo-Community,p. II-12, from the previous activity,Econo-Community. You will need toeither make copies of this handout forstudents, or make an overhead trans-parency for the class to view.
You may find it useful to staple thehandout, Factors of Production, from thisactivity to the handout, Econo-Community, for each student.
ProcedurePART A
Assess students’ knowledge of thefactors of production. If they alreadypossess a good understanding of the fac-tors of production, proceed with thesteps that concentrate on the making ofbusiness boxes, which will assess eachstudent’s understanding of the factors ofproduction. To conduct pre-assessment,see the handouts referred to in theAssessment section.
1
Inquiry● What is necessary to operate
a business and, in particular,what is necessary to operate arecycling business?
Content DomainSocial Studies – Economics
Learning OutcomesCitizenship, Grade 4, #10, #11and Grade 6, #12
DurationPart A: 50 minutes (not includ-ing preparation of businessboxes)
Part B: 50 minutes
MaterialsEach student will need to bringin a shoe box. Each student orgroup of students will alsoneed: scissors, tape, glue,rubber bands to secure shoebox lids, coloring and writingmaterials, construction paperand/or plain paper
Handouts● Starting Your Own Recycling
Business
● Business Box Pictures
● Factors of Production
● Econo-Community (from theprevious activity, Econo-Community)
● Business Box Labels
● Recycling and the Factors ofProduction
● Garbage Goods
Business BoxesObjectiveStudents will be able to describe the factors of production necessary to operate any
business and the specific “productive resources” needed to operate a recycling business.
Act
ivity
2GARBAGE GOODS

Windows on Waste - GARBAGE GOODS II Help Contents Back
▼
▼
67©Ohio Department of Natural Resources Help Contents Back
▼
▼
67
Give each student the handout,Starting Your Own Recycling Business.Read the scenario and make sureeveryone understands it.
Divide the students into groupsand give each group, or each studentin the group, the materials listed in theMaterials section. Give each studenthis/her own business box (previouslyprepared) and the handout, BusinessBox Pictures.
As a class, read the directions atthe bottom of the handout, StartingYour Own Recycling Business, and havestudents begin to draw pictures.
Students should share ideas with othermembers of their group, making infer-ences and discussing all the possiblethings needed to operate a recyclingbusiness. They should discuss what isneeded as a group, with each learnermaking his/her own pictures. As stu-dents finish their pictures, have themplace the pictures loosely in their busi-ness boxes. Each student in each groupshould have the same items in his/herbox, but the drawings of each itemshould be made by each individualstudent. Refer to Part B, Step 4 forexamples of picture items listed underLAND, LABOR and CAPITAL. Ifneeded, prompt students who are hav-ing difficulty thinking of items ontheir own.
Have each group share theiranswers. As answers are being shared,students may wish to make pictures ofitems they did not think of. Make sureeveryone has made pictures of each ofthe recyclable materials identified onthe handout, Starting Your OwnRecycling Business.
Students may keep all the materi-als, including their pictures, in theirboxes. Secure the lids with rubberbands and store the boxes until theyare used to complete the activity.
PART B
If students are unfamiliar withthe factors of production, give eachstudent a copy of the handout, Factorsof Production, and review the defini-tions. It is not necessary to cover “rawmaterials” at the bottom of the pageunless you find the distinctions useful.
After discussing the factors ofproduction, use the handout, Econo-Community, from the previous activi-ty, to help students answer the follow-ing questions and understand the roleof land resources in the making ofproducts.
● Recyclable materials are used inplace of natural resources. Whichnatural resources can be replaced byrecyclables?
ANSWER: glass instead of sand-stone, aluminum instead of bauxite,plastic bottles instead of petroleum-generated plastic resin, paperinstead of wood chips (trees), steelcans instead of iron ore.
● All of the natural resources on thehandout are which factor of produc-tion? (land)
● Which factor of production do recy-clables come under?
ANSWER: land. Although recy-clables do not come directly fromnatural resources, a process of elimi-nation and an understanding of therules may help students answer thisquestion. It should be obvious tostudents that recyclables are notlabor or entrepreneurship.
Recyclable material is also not capital because of Rules 1 and 2 onthe handout, Factors of Production.Recyclable material becomes part ofthe good being produced. Unlikeitems of capital, recyclables do notremain after they have been used.
● Energy in the form of electricity ornatural gas, that is used to makeproducts, is which factor ofproduction?
ANSWER: land. Again, see Rule 1.Energy is transferred into the prod-uct and becomes latent energy. Forexample, if old products, such asnewspapers and plastic bottles, areburned, they release the latent ener-gy that is stored in them.
Give each student his/her busi-ness box. This may be done individu-ally instead of in groups because thispart of the activity can serve as anassessment of each student’s under-standing of the factors of production.
Students should take all pictures andmaterials out of their boxes. Have eachstudent use a marker to divide theinside of the box into three equal sec-tions, by drawing two lines from thetop of one side (a long side, not ashort side), down across the bottomand up the other side. (See illustrationon next page.)
Give each student a set of labels fromthe handout, Business Box Labels. Havestudents cut out labels (LAND,LABOR, CAPITAL) and glue each oneon the inside of the box, each label atthe top of a different section, but onthe same side of the box. Have eachstudent cut out the blank sign andwrite his/her name between the words“The” and “Company” in the spaceprovided. This can be glued anywhereon the outside of the box.
Have students examine each pic-ture and decide in which factor ofproduction section the picture shouldbe placed in their business boxes.Have them lightly tape (temporarily)each picture in the appropriate sec-tion. Afterwards, you may evaluateeach student’s box for assessment purposes.
4
3
2
1
6
5
4
3
2
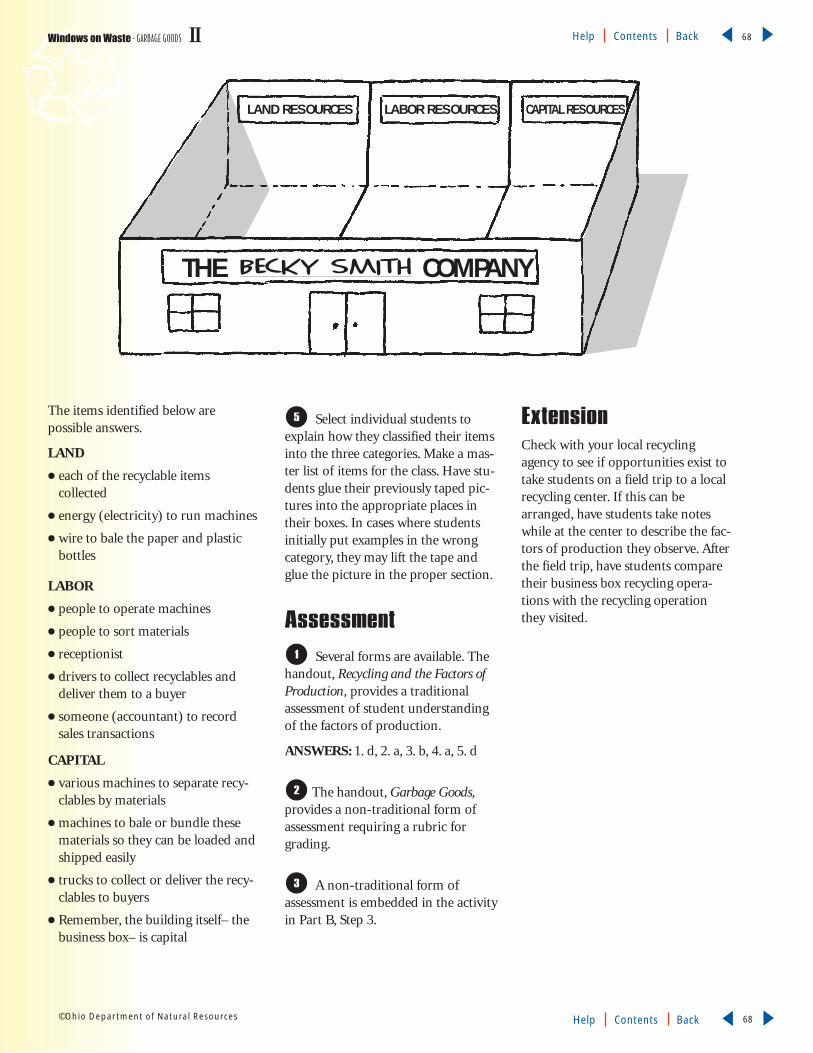
Windows on Waste - GARBAGE GOODS II Help Contents Back
▼
▼
68©Ohio Department of Natural Resources Help Contents Back
▼
▼
68
The items identified below are possible answers.
LAND
● each of the recyclable items collected
● energy (electricity) to run machines
● wire to bale the paper and plasticbottles
LABOR
● people to operate machines
● people to sort materials
● receptionist
● drivers to collect recyclables anddeliver them to a buyer
● someone (accountant) to recordsales transactions
CAPITAL
● various machines to separate recy-clables by materials
● machines to bale or bundle thesematerials so they can be loaded andshipped easily
● trucks to collect or deliver the recy-clables to buyers
● Remember, the building itself– thebusiness box– is capital
Select individual students toexplain how they classified their itemsinto the three categories. Make a mas-ter list of items for the class. Have stu-dents glue their previously taped pic-tures into the appropriate places intheir boxes. In cases where studentsinitially put examples in the wrongcategory, they may lift the tape andglue the picture in the proper section.
AssessmentSeveral forms are available. The
handout, Recycling and the Factors ofProduction, provides a traditionalassessment of student understandingof the factors of production.
ANSWERS: 1. d, 2. a, 3. b, 4. a, 5. d
The handout, Garbage Goods,provides a non-traditional form ofassessment requiring a rubric forgrading.
A non-traditional form ofassessment is embedded in the activityin Part B, Step 3.
ExtensionCheck with your local recyclingagency to see if opportunities exist totake students on a field trip to a localrecycling center. If this can bearranged, have students take noteswhile at the center to describe the fac-tors of production they observe. Afterthe field trip, have students comparetheir business box recycling opera-tions with the recycling operationthey visited.
3
2
1
5
LAND RESOURCES
THE becky smith COMPANY
LABOR RESOURCES CAPITAL RESOURCES

Windows on Waste - GARBAGE GOODS II Help Contents Back
▼
▼
69©Ohio Department of Natural Resources Help Contents Back
▼
▼
69
Starting Your Own Recycling Business
You are a business person. You have been given a contract by the local government to collect recyclable items from all of the households in your community. Each household puts all of its recy-clable items (GLASS BOTTLES, ALUMINUM CANS, PLASTIC DETERGENT BOTTLES and PLASTIC MILKBOTTLES, PAPER ITEMS, and STEEL CANS) in one container for you to collect. Each household putsthe rest of its garbage in another container to be taken by another business to the local landfill.
In order to sell your recycled materials, you need to prepare the recyclables the way that the buyersrequest. Here are descriptions of how each buyer wants you to prepare the material:
● A glass bottle maker will buy your recycled glass if it is ground up into small 1⁄4 inch pieces andput in barrels.
● An aluminum can maker will buy your recycled aluminum cans if you flatten and squeeze them(about 1,000) into bricks that weigh 35 pounds each.
● A plastic bottle maker will buy your plastic detergent bottles and milk jugs if you shred theminto long, thin pieces and wrap the pieces tightly into bales (about the size of a refrigerator)wrapped with wire.
● A paper tablet maker will buy your paper if it is not wet or dirty and if you squeeze 800 poundsof paper (junk mail, newspaper, notebook paper, etc.) into a bale (about the size of a refrigerator)wrapped by wire.
● A steel can maker will buy your steel cans if you put them into a big truck bed.
BUSINESS BOX DIRECTIONS: Make pictures of the things you need to operate your recycling business. Draw each picture in a single square on the handout, Business Box Pictures. In the spacewithin each square, write what the picture is. Make each picture about one thing only. For example, ifyou draw a picture of a machine, draw a separate picture of a person who operates the machine. Donot make a single picture of a person and a machine together.
Student Handout ✐

Windows on Waste - GARBAGE GOODS II Help Contents Back
▼
▼
70©Ohio Department of Natural Resources Help Contents Back
▼
▼
70
Business
Box
Pictu
res
Dire
ctio
ns: C
ut o
ut e
ach
squa
re a
long
the
dot
ted
lines
and
dra
w a
pict
ure
in t
he
bott
om o
f the
squ
are.
Tel
l wha
t th
e pi
ctur
e is
in t
he t
op p
art
of e
ach
squa
re.
Student Handout ✐
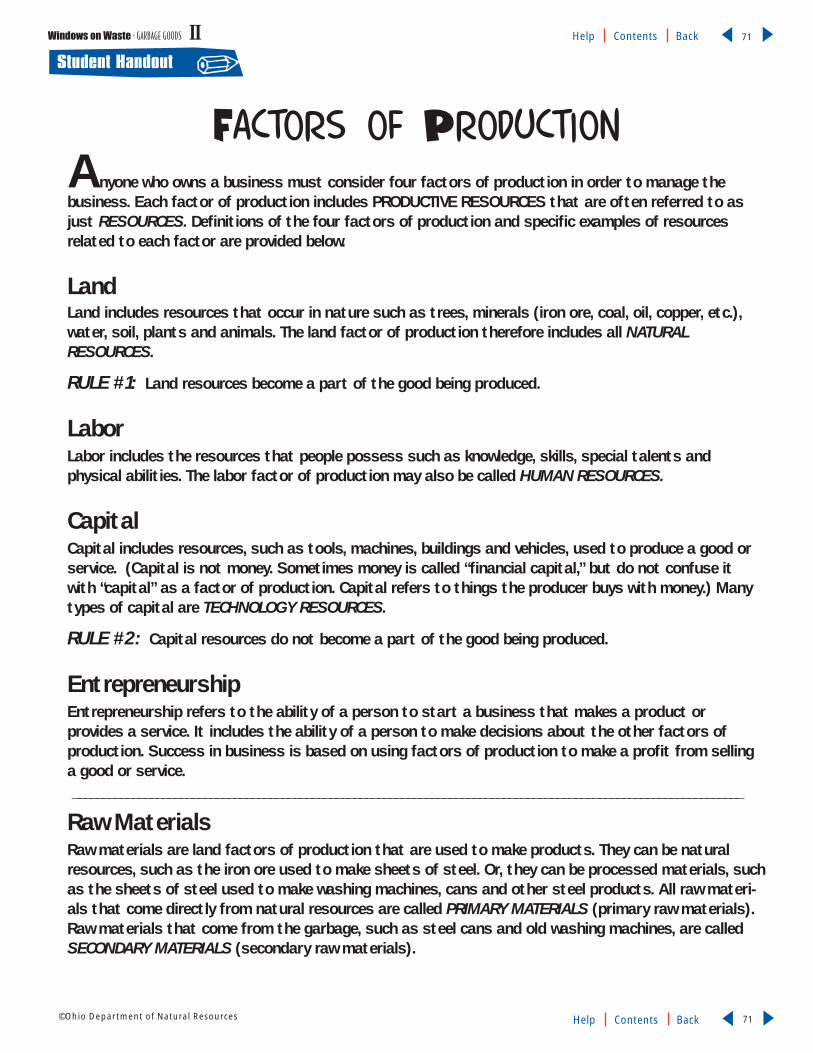
Windows on Waste - GARBAGE GOODS II Help Contents Back
▼
▼
71©Ohio Department of Natural Resources Help Contents Back
▼
▼
71
Student Handout ✐
Factors of ProductionAnyone who owns a business must consider four factors of production in order to manage the business. Each factor of production includes PRODUCTIVE RESOURCES that are often referred to asjust RESOURCES. Definitions of the four factors of production and specific examples of resourcesrelated to each factor are provided below.
LandLand includes resources that occur in nature such as trees, minerals (iron ore, coal, oil, copper, etc.),water, soil, plants and animals. The land factor of production therefore includes all NATURALRESOURCES.
RULE #1: Land resources become a part of the good being produced.
LaborLabor includes the resources that people possess such as knowledge, skills, special talents and physical abilities. The labor factor of production may also be called HUMAN RESOURCES.
CapitalCapital includes resources, such as tools, machines, buildings and vehicles, used to produce a good or service. (Capital is not money. Sometimes money is called “financial capital,” but do not confuse itwith “capital” as a factor of production. Capital refers to things the producer buys with money.) Manytypes of capital are TECHNOLOGY RESOURCES.
RULE #2: Capital resources do not become a part of the good being produced.
EntrepreneurshipEntrepreneurship refers to the ability of a person to start a business that makes a product or provides a service. It includes the ability of a person to make decisions about the other factors of production. Success in business is based on using factors of production to make a profit from sellinga good or service.________________________________________________________________________________________________________________
Raw MaterialsRaw materials are land factors of production that are used to make products. They can be naturalresources, such as the iron ore used to make sheets of steel. Or, they can be processed materials, suchas the sheets of steel used to make washing machines, cans and other steel products. All raw materi-als that come directly from natural resources are called PRIMARY MATERIALS (primary raw materials). Raw materials that come from the garbage, such as steel cans and old washing machines, are called SECONDARY MATERIALS (secondary raw materials).

Business Box Labels
LAND RESOURCES
LABOR RESOURCES
CAPITAL RESOURCES
THE ____________________________COMPANY
LAND RESOURCES
LABOR RESOURCES
CAPITAL RESOURCES
THE ____________________________COMPANY
Windows on Waste - GARBAGE GOODS IIStudent Handout ✐
72Help Contents Back
▼
▼
72©Ohio Department of Natural Resources Help Contents Back
▼
▼

Recycling and the Factors of Production
Directions: Put the correct letter in the blank space beside each question.
_____ 1. Ralph Goodguy, who manages the local recycling collection center, bought a magnetic separator to sort aluminum cans from steel cans. What factor of production is a magneticseparator?
a. landb. laborc. entrepreneurshipd. capital
_____ 2. Machines that separate different materials like steel cans from aluminum cans are important to a recycling business because:
a. a business that uses recycled material to make a new product will buy only one type of material from a recycling business
b. a business that uses recycled material to make a new product will buy several types of materials from a recycling business
c. businesses that make machines that separate materials need recycling businesses to buytheir products
_____ 3. Cathy Goodgirl owns a factory that makes aluminum. She has decided to buy recycled aluminum cans to make aluminum. She decided to do this because making aluminum fromrecycled aluminum cans costs less than making it from bauxite. Cathy’s decision to do thisis an example of which factor of production?
a. landb. entrepreneurshipc. capitald. labor
_____ 4. Recycled materials are an example of which factor of production?
a. landb. entrepreneurshipc. capitald. labor
_____ 5. Bill Workhard operates the paper baler at the local recycling center. He also drives a truck tocollect recyclables. He is an example of which factor of production?
a. landb. entrepreneurshipc. capitald. labor
Student Handout ✐73Help Contents Back
▼
▼Windows on Waste - GARBAGE GOODS II
73©Ohio Department of Natural Resources Help Contents Back
▼
▼
Windows on Waste - GARBAGE GOODS IIStudent Handout ✐
74Help Contents Back
▼
▼
74©Ohio Department of Natural Resources Help Contents Back
▼
▼
Garbage Goods
You have been given 10 tons of garbage and trash from your local community waste collector.
What could you do and what things would you need to start a recycling business and sell some of
this garbage and trash? Write a short paragraph to explain your answer. Include the following words
in your explanation if you know what they mean: LAND, LABOR, CAPITAL, ENTREPRENEURSHIP,
RECYCLED MATERIALS.
_____________________________________________________________________________________
_____________________________________________________________________________________
_____________________________________________________________________________________
_____________________________________________________________________________________
_____________________________________________________________________________________
_____________________________________________________________________________________
_____________________________________________________________________________________
_____________________________________________________________________________________
_____________________________________________________________________________________
_____________________________________________________________________________________

PreparationNOTE: This activity and the previousone, Business Boxes, are good follow-upactivities to the concepts explored in theeconomic model (see Econo-Communityhandout, p. II-12 ) in the previous activ-ity, Econo-Community. You may wish toreview Enterprising Recycling and theprevious activity, Business Boxes, todetermine which to conduct, becauseboth utilize the making of “businessboxes” to teach students about the fac-tors of production. However, the twoactivities are different. Business Boxes islimited to teaching the factors of pro-duction and focuses on recycling centersas a business. This activity, EnterprisingRecycling, is more complex; it focuseson producers of products and includesresearch, mathematical calculations andenvironmental impacts. If you have thetime, both activities may be conductedwithout repetition (except of importantterms) and are compatible with eachother.
Before the activity, have students pre-pare their shoe boxes to become “busi-ness boxes.” Have each student writehis/her name on the bottom of the box.They should make the outside of thebox as plain as possible. Words and
brand names should be covered.Students can cover the outside of theboxes with construction paper, or usemarkers to cover existing details. Havestudents draw windows and a door onthe outside of the box. Make sure stu-dents attach things or mark on theboxes with the lids closed.
Four handouts from the previous twoactivities will be useful when conduct-ing this activity. These handouts are:
Econo-Community, p. II-12, from theactivity, Econo-Community. This is amodel of the economic production-consumption system that students willneed in order to make decisions in thisactivity. Make an overhead of this hand-out so all students can see it, or makecopies for each student.
Factors of Production, p. II-21, from theactivity, Business Boxes. This handoutcontains definitions of terms that arereinforced throughout the activity.Make a copy for each student. (You mayfind it useful to staple the handout,Factors of Production, to the Econo-Community handout for each student.)
Business Box Labels, p. II-22, andBusiness Box Pictures, p. II-20 , from theprevious activity, Business Boxes.
Inquiries● What happens to recycled
materials after they have beencollected?
● Why do producers use recycled materials to makenew products?
● How can the use of recycledmaterials in productionprocesses benefit the environment?
Content DomainMath – Arithmetic
Science – Natural resources
Social Studies – Economics
Learning OutcomesCitizenship, Grade 4, #10, #11and Grade 6, #12, #13
Math, Grade 4, #4, #8, #11 andGrade 6, #3, #6
Science, Grade 4, #14
DurationPart A: 50 minutes (not includ-ing preparation of businessboxes)
Part B: 50 minutes
MaterialsEach student will need to bringin a shoe box. Each student orgroup of students will alsoneed: scissors, tape, glue, rub-ber bands to secure shoe boxlids, coloring and writingmaterials, construction paperand/or plain paper
Enterprising RecyclingObjectivesStudents will be able to: (a) identify the factors of production and describe recyclable
material as a factor of production; (b) explain how production decisions are made
regarding the use of recycled materials; (c) identify the natural resources used to make
products; and (d) identify the environmental impact of using recycled materials.
Act
ivity
3GARBAGE GOODS
Windows on Waste - GARBAGE GOODS II Help Contents Back
▼
▼
75©Ohio Department of Natural Resources Help Contents Back
▼
▼
75
continued next page

From this activity, make copies of thehandouts, Production Costs andBusiness Management Planning, foreach student. Staple these together.
ProcedurePART A
Assess students’ knowledge ofthe factors of production. If theyalready possess a clear understandingof the factors of production, proceedwith the steps that concentrate onmaking business boxes, which canserve to assess each student’s ability toapply an understanding of the factorsof production. To conduct pre-assess-ment, see the handouts referred to inthe Assessment section, p. II-18, of theprevious activity, Business Boxes.
If students are unfamiliar withthe factors of production, give eachstudent a copy of the handout, Factorsof Production, and review the defini-tions. Be sure to cover the concept of“raw materials” at the bottom of thepage.
After discussing the factors ofproduction, have students answer thefollowing questions. Use the handout,Econo-Community, to help studentsanswer the questions and understandthe role of land resources in the mak-ing of products.
● Recyclable materials are used inplace of natural resources. Whichnatural resources can be replaced byrecyclables?
ANSWER: glass instead of sand-stone, aluminum instead of bauxite,plastic bottles instead of petroleum-generated plastic resin, paperinstead of wood chips (trees), steelcans instead of iron ore.
● All of the natural resources on thehandout are which factor of produc-tion? (land)
● Which factor of production do recy-
clables come under?
ANSWER: land. Although recy-clables do not come directly fromnatural resources, students can useprocess of elimination and anunderstanding of the rules toanswer this question. It should beobvious to students that recyclablesare not labor or entrepreneurship.
Recyclable material is also not capi-tal because of Rules 1 and 2 on thehandout, Factors of Production.Recyclable material becomes part ofthe good being produced. Unlikeitems of capital, recyclables do notremain after they have been used.
● Energy in the form of electricity ornatural gas, that is used to makeproducts, is which factor ofproduction?
ANSWER: land. Again see Rule 1.Energy is transferred into the prod-uct and becomes latent energy. Forexample, if old products, such asnewspapers and plastic bottles, areburned, they release the latent ener-gy that is stored in them.
On the handout, Econo-Community, identify the businessesthat make products directly from nat-ural resources or from recycled mate-rials (steel can factory, paper factory,aluminum can factory, glass jar facto-ry, and plastic bottle factory – in thebottom row of the “goods production”section). Ask students what these busi-nesses need in order to make theirproducts (natural resources, energy,labor, machines, etc.). Explain to stu-dents that the activity they are aboutto do will help them understand howbusiness people, or entrepreneurs,make production decisions and whybusinesses may be motivated to userecycled materials in productionprocesses. Have students trace the lifeof a plastic bottle, aluminum can, etc.by making inferences from the model.
43
2
1
HandoutsFrom Activity 1,Econo-Community:
● Econo-Community
From Activity 2, Business Boxes:
● Business Box Labels
● Business Box Pictures
● Factors of Production
From this activity:
● Production Costs
● Business ManagementPlanning
● Business ManagementPlanning Answers
Windows on Waste - GARBAGE GOODS II Help Contents Back
▼
▼
76©Ohio Department of Natural Resources Help Contents Back
▼
▼
76
GARBAGE GOODS

Windows on Waste - GARBAGE GOODS II Help Contents Back
▼
▼
77©Ohio Department of Natural Resources Help Contents Back
▼
▼
77
Divide students into five groupsof four or five students each. Designateeach group to be one of the five busi-nesses listed in the bottom row of the“goods production” section on thehandout, Econo-Community. Use allfive businesses (steel can factory,paper factory, aluminum can factory,glass jar factory and plastic bottle factory).
Give each student his/her busi-ness box, previously prepared perinstructions in the preparation sec-tion. Each student in each group willconstruct his/her own business box asdescribed below. Each student in eachgroup will be making the same busi-ness, with a different business for eachgroup.
Business boxes should be con-structed in the following manner:Have each student use a marker todivide the inside of the box into threeequal sections, by drawing two linesfrom the top of one side (a long side,not a short side), down across thebottom and up the other side. (Seeillustration above). Give each studenta set of labels from the handout,Business Box Labels. Have students cut
out labels (LAND, LABOR, CAPITAL)and glue each one on the inside of thebox, with each label at the top of adifferent section, but on the same sideof the box. Have each student cut outthe blank sign and write his/her namebetween the words “The” and“Company” in the space provided.This can be glued anywhere on theoutside of the box.
Using encyclopedias, web sitesand other reference material, have students research each of the factorsof production involved in makingtheir products. Groups should worktogether to make lists of productiveresources. As resources are identified,have each student in the group makea picture of the item and tape it insidehis/her business box in the appropri-ate factor of production section.Pictures can be made using the hand-out, Business Box Pictures. For eachsquare there is space at the top toidentify the picture. Have studentslightly tape (temporarily) each pictureand afterwards evaluate each group’sboxes for the correct placement ofresources. Students can then glue theresources in permanently.
PART B
Give each student a copy of thehandout, Production Costs. Reviewthis sheet and have students fill in theblanks as you go over it. Students willneed to refer to the handout, Econo-Community, to help fill in some of theanswers. The first thing they can do isidentify the good produced by theirbusiness and write the name of thisgood (steel cans, plastic bottles, etc.)in all of the spaces indicated on thehandout, Production Costs.
Students will need to refer to thehandout, Production Costs, to derivefigures to record on the handout,Business Management Planning. Youmay want to staple these together assuggested in the Preparation section.The handout, Business ManagementPlanning Answers, provides answers tothe handout, Business ManagementPlanning.
Refer students to the first rowunder “Production Choices” (Q =1,000) on the handout, BusinessManagement Planning. Help studentsfigure all the costs associated withproducing 1,000 items of their prod-
3
2
1
8
7
6
5
LAND RESOURCES
THE becky smith COMPANY
LABOR RESOURCES CAPITAL RESOURCES

Windows on Waste - GARBAGE GOODS II Help Contents Back
▼
▼
78©Ohio Department of Natural Resources Help Contents Back
▼
▼
78
uct, filling in all of the blocks in thefirst row under land, labor, capital,revenue, etc. Remember, the answersare to be found by referencing thehandout, Production Costs. Calculateas follows:
LANDStudents need to buy 2 units ofraw materials to make 1,000items.
(2 units x $5.00 = $10.00)
Have students put $10.00 in theRAW MATERIAL square, row 1.
Students need to buy 2 units ofenergy (electricity to run themachine) to make 1,000 items.
(2 units x $5.00 = $10.00)
Have students put $10.00 in theENERGY square, row 1.
LABORStudents need to buy 2 units oflabor time to pay someone tooperate the machine(s) longenough to produce 1,000 items.
(2 units x $10.00 = $20.00)
Have students put $20.00 in theLABOR square, row 1.
CAPITALStudents need to buy a buildingand machine to make their prod-uct. They need to buy a buildingwhich costs $50.00 and a machinewhich costs $50.00.
($50.00 + $50.00 = $100.00)
Have students put $100.00 in theCAPITAL square, row 1.
It may appear that $100.00 is rathercheap for machine and building costs.These costs may be considered fromthe perspective of costs per day, andall “Production Choices” are based onproduction choices for one day.
Students now add up their total costs tomake 1,000 items of their product. Havethem put $140.00 in the TOTAL COSTSsquare for Production Choice #1.
In the REVENUE square, studentsshould put $140.00 per the sale of1,000 items (one batch). Have stu-dents now calculate profit or loss.(They broke even.)
Ask students which resources theyused up when making their 1,000items (raw materials, energy, labortime). Why isn’t the machine “usedup”? The machine can make1,000,000 items before it must bereplaced (or repaired). Most capitalitems, such as buildings andmachines, are permanent features of abusiness, unlike land and laborresources which are used up and mustbe acquired continually. This is whycapital costs are considered “fixedcosts” as indicated on the handout,Business Management Planning. Landand labor costs vary with productionand are called “variable costs” as indi-cated on the handout.
Ask students if they see any waythey could make a profit by consider-ing the nature of costs as understoodso far. See if anyone recognizes thevalue of fixed costs relative to producing more product.
Have students in their groups calculate costs, revenue and profitpotential if they boost production to2,000 items of product. Have them cal-culate these figures for both 2,000 itemsproduced using natural resources,Production Choice #2 and 2,000 itemsproduced using recycled material,Production Choice #3. Refer to thehandout, Business ManagementPlanning Answers, which indicateshow using recycled materials can cutproduction costs and enhance profits.
Discuss the issues associatedwith economics, environmental concerns and recycling. Continuewith further mathematical problemsolving, if desired. Sample questionsfollow.
Economics What economic factors create incen-tives for the use of recycled materialsby producers? (cost reduction, buyerwilling to pay the same price for recy-cled material as for virgin products,consumers must ultimately demandor buy recycled-content products,etc.)
EnvironmentHow can good economic practicesalso be good for the environment?(save resources and energy) Whatwould happen in this scenario ifrecycled materials cost more than virgin materials? Is energy savingsenough to reduce costs sufficiently touse recycled materials?
MathematicsHave students calculate per item (eachitem of a batch of 1,000) costs andpercentages of total cost of each factorof production, etc. Given that recycledmaterials cost say, 50 cents more thannatural resources, is the amount ofenergy savings that can be realizedenough to reduce costs?
AssessmentTo assess students’ knowledge aboutthe factors of production you can usethe handout, Recycling and the Factorsof Production, in the activity, BusinessBoxes, p. II-23. To assess students’understanding of the math conceptsin the activity, use the blank rows 4and 5 on the handout, BusinessManagement Planning, to constructadditional math problems associatedwith producing varying amounts ofproduct.
6
5
4

Student Handout ✐79Help Contents Back
▼
▼Windows on Waste - GARBAGE GOODS II
79©Ohio Department of Natural Resources Help Contents Back
▼
▼
Production Costs
What is the good that you produce? ____________________________________________________
LAND RESOURCES: Natural ResourcesWhat natural resource raw material is required to make your good? __________________________COSTS: One unit of natural resource raw material costs $5.00.
It takes two units of natural resource raw material to make a batch of 1,000 _________________(good you produce)
It takes two units of energy to make 1,000 _____________________ from _____________________COSTS: One unit of energy costs $5.00. (good you produce) (natural resource you use)
LABOR RESOURCES:You need to hire a person to operate the machine that makes your product and pay the employee for the timehe or she spends operating the machine.
It takes two units of labor time to make 1,000 ___________________________________________
COSTS: One unit of labor time costs $10.00. (good you produce)
CAPITAL RESOURCES:You need a building in which to make your product. You need a machine to make your product.
You can make 1,000,000 _______________________ with the building and machine.(good you produce)
COSTS: The building costs $50.00. The machine costs $50.00.
REVENUE:Who will buy the good you produce? ____________________________________________________
This buyer will pay you $140.00 for each batch of 1,000 ____________________________________(good you produce)
LAND RESOURCES: Recycled MaterialsWhat type of recycled material can you use to make your good? _____________________________COSTS: One unit of recycled material costs $2.50.
One unit of recycled material can be used instead of one unit of natural resource.
You can only use one unit of recycled material for each batch of 1,000 _________________________(Only 50% of your product can be recycled material.) (good you produce)
When you use recycled material, it takes only one unit of energy instead of two units to make a batch of 1,000 __________________________
(good you produce)
11
10
9
8
7
6
5
4
3
2
1

Windows on Waste - GARBAGE GOODS IIStudent Handout ✐
80Help Contents Back
▼
▼
80©Ohio Department of Natural Resources Help Contents Back
▼
▼
Business
Man
agem
ent Planning
FIXE
DVA
RIA
BLE
+#
batc
hes
✘RE
VEN
UEVA
RIA
BLE
COST
SCO
STS
FIXE
D CO
STm
arke
t pr
ice
--CO
STS
LAN
DTO
TAL
SALE
S PR
OFI
TLA
BOR
CAPI
TAL
COST
SRE
VEN
UEO
RLO
SS
Q=1,0
00(1
batc
h)
Q=2,0
00(2
batc
hes)
Q=2,0
00(2
batc
hes
with
recy
cled
mat
erial
)
PRODUCTIONCHOICES
Raw
Ener
gyM
ater
ial
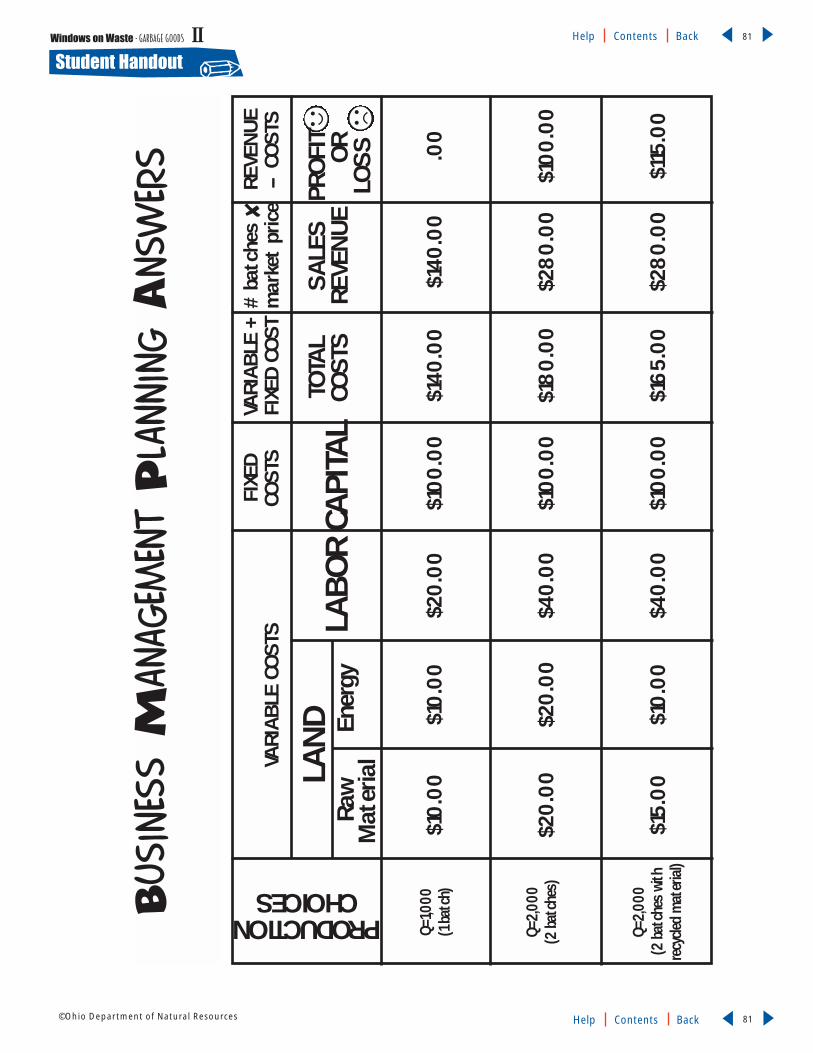
Student Handout ✐81Help Contents Back
▼
▼Windows on Waste - GARBAGE GOODS II
81©Ohio Department of Natural Resources Help Contents Back
▼
▼
Business
Man
agem
ent Planning A
nsw
ers
FIXE
DVA
RIA
BLE
+#
batc
hes
✘RE
VEN
UEVA
RIA
BLE
COST
SCO
STS
FIXE
D CO
STm
arke
t pr
ice
--CO
STS
LAN
DTO
TAL
SALE
S PR
OFI
TLA
BOR
CAPI
TAL
COST
SRE
VEN
UEO
RLO
SS
Q=1,0
00(1
batc
h)
Q=2,0
00(2
batc
hes)
Q=2,0
00(2
batc
hes
with
recy
cled
mat
erial
)
$10.
00$1
0.00
$20.
00$1
00.0
0$1
40.0
0$1
40.0
0.0
0
$20.
00$2
0.00
$40.
00$1
00.0
0$1
80.
00$2
80.
00$1
00.0
0
$15.
00$1
0.00
$40.
00$1
00.0
0$1
65.
00$2
80.
00$1
15.0
0
PRODUCTIONCHOICES
Raw
Ener
gyM
ater
ial

EnvironmentalStudies LearningConcept
Historically, technological
advances have increased
energy consumption.
Increased energy availability has
enabled the development of
advanced technologies, some
increasing and some reducing
energy requirements as compared
to older technologies. Advances in
technology have brought concerns
about energy and resource
conservation.
Recycling is part of the techno-
logical and industrial process.
Using recycled materials in produc-
tion processes generally reduces the
energy needed to make new prod-
ucts and may reduce the energy
required to extract and process raw
materials. This in turn reduces the
energy costs of manufacturers.
Many manufacturing processes rely
on non-renewable energy sources,
but the demand for this type of
energy can be reduced when man-
ufacturers use secondary materials.
Recycling imparts economic
value to what would otherwise be a
waste material requiring disposal.
Recycled material (secondary
material) is economically valuable
because it is part of an industrial
process that conserves energy and
non-renewable resources, thereby
reducing production costs.
Vocabularyadvertisement – information that a business provides about its products or services
base paper – material that is added to water to make recycled paper; different basesmay include newspaper, tissue, computer paper
consumer – a person who buys a product or a service
demand – how much something is wanted, particularly in regard to consumerspurchasing goods
disposal – the process by which waste is prepared for its final containment ordestruction
energy – the ability to perform work or produce a change
entrepreneur – a person who starts a business and makes decisions about the useof economic resources in order to make a profit
goods – products that can be bought or sold
grade – a classification system for paper products, uses fiber strength and color asdetermining factors
human resources – people who work for a company
manufacturing – the process of turning raw materials into finished products, usu-ally with the aid of machines
marketing – planning how to sell a product
natural resource – a material source of wealth, such as timber, freshwater, wildlifeor a mineral deposit that occurs in nature
paper – a thin sheet of material made of cellulose pulp, derived mainly from wood,but can be made from textiles and certain grasses
paper pulp – a mixture of cellulose material that is ground up and moistened tomake paper
price – the cost to buy a product or service
product – something that people make or grow, often to sell
production – the process of making or manufacturing a product for sale or trade
raw materials – resources needed to make a product; may be natural resources orrecycled materials
recycling – to collect and process waste materials for use in manufacturing newproducts
reuse – to use again; to extend the life of an item by repairing it or by creating newuses for it
service – something one person does for another
solid waste – discarded garbage and trash
supply – the amount of a product or service available for sale
technology – the use of machines, tools and materials to make products faster andmore easily
wages – money that is used to pay workers
waste – anything that is worthless or useless; material which cannot be reused orrecycled and must be disposed of
work – actions of humans and/or machines that require energy
THE PAPER FACTORYWindows on Waste - THE PAPER FACTORY III Help Contents Back
▼
▼
82©Ohio Department of Natural Resources Help Contents Back
▼
▼
82

Windows on Waste - THE PAPER FACTORY III Help Contents Back
▼
▼
83©Ohio Department of Natural Resources Help Contents Back
▼
▼
83
1
2
Activity 1: PapermakingDescriptionStudents cooperate in groups to produce a paper product using recycled paper or anatural resource. After making their product, students decorate their paper and thenanalyze the process, which includes identifying materials and their costs. Each groupgathers information to assign energy and monetary value to the materials they usedin order to compute the cost of their paper product. Using this cost information,students make deductions about the effectiveness of recycling in saving money andenergy.
Ohio Proficiency Test Learning OutcomesGrade 4, Mathematics #4 – Identify needed information to solve a problem.
Grade 4, Mathematics #5 – Explain or illustrate why a solution is correct.
Grade 4, Mathematics #8 – Add, subtract, multiply and divide whole numbers andexplain in words thinking strategies for making computations.
Grade 4, Mathematics #24 – Make or use a table to record and sort information andmake identifications, comparisons and predictions from tables, graphs, bar graphs andlabeled picture maps.
Grade 4, Science #1 – Create and/or use categories to organize a set of objects, organismsor phenomena.
Grade 4, Science #4 – Use a simple key to distinguish between objects.
Grade 4, Science #6 – Evaluate a simple procedure to carry out an exploration.
Grade 4, Science #14 – Identify and/or describe the relationship between human activityand the environment.
Activity 2: What Sort of Trash is This Anyway?DescriptionStudents manipulate trash items, classify them using a dichotomous key and identifywhich materials can be recycled and which materials, when recycled, can be madeinto paper. This activity also includes a vocabulary puzzle.
Summary
This lesson includes three
activities. The first is the
introductory activity,
which teaches students how to
make paper. The second activity
can be done with the first activ-
ity because it involves sorting
recycled paper from trash. The
papermaking knowledge gained
in the first activity is essential to
conducting the last activity,
when students establish their
own mock papermaking
companies.
Overview - THE PAPER FACTORY

Windows on Waste - THE PAPER FACTORY III Help Contents Back
▼
▼
84©Ohio Department of Natural Resources Help Contents Back
▼
▼
84
3
Ohio Proficiency Test Learning OutcomesGrade 4, Mathematics #24 – Make or use a table to record and sort information andmake identifications, comparisons and predictions from tables, picture graphs, graphs, bargraphs and labeled picture maps.
Grade 4, Science #1 – Create and/or use categories to organize a set of objects, organismsor phenomena.
Grade 4, Science #4 – Use a simple key to distinguish between objects.
Activity 3: The Paper CompanyDescriptionStudents use what they learned about recycling paper to develop a plan to establishcompanies to produce recycled paper products and sell their products to a partnerclass. They implement their plan and work cooperatively to gather materials, computecosts and manipulate materials to create a paper product. To sell their product, stu-dents use creative writing to create advertisements.
Ohio Proficiency Test Learning OutcomesGrade 4, Mathematics #4 – Identify needed information to solve a problem.
Grade 4, Mathematics #5 – Explain or illustrate why a solution is correct.
Grade 4, Mathematics #8 – Add, subtract, multiply and divide whole numbers andexplain in words thinking strategies for making computations.
Grade 4, Science #1 – Create and/or use categories to organize a set of objects, organismsor phenomena.
Grade 4, Science #6 – Evaluate a simple procedure to carry out an exploration.
If extension is done, the following apply:
Grade 4, Citizenship #10 – Identify the factors of production (land, labor, capital andentrepreneurship) needed to produce various goods and services.
Grade 4, Citizenship #11 – Name the resources needed to produce various goods and ser-vices, classify each resource by the factors of production, or suggest alternative uses forthose factors.
Grade 6, Citizenship #12 – Describe the role of each factor of production in producing aspecific good or service and suggest alternative uses for the resources involved.

Windows on Waste - THE PAPER FACTORY III Help Contents Back
▼
▼
85©Ohio Department of Natural Resources Help Contents Back
▼
▼
85
Background Information
Human activity and theenvironment is a pro-ficiency concept thatruns through everyage group. Respect forthe environment and
our use of it, is integral to the conceptof recycling. Why recycle? This is aquestion that is both economic andenvironmental.
Does recycling save energy andresources? The argument that recy-cling saves energy and naturalresources is undeniable for metals likealuminum and steel. When discussinghow paper recycling saves naturalresources, the answer is not as clear. Itcan be argued that trees are a renew-able resource. Further, many of thetrees used for paper are specificallyplanted for that purpose and wouldnot be planted if they were not need-ed to make paper.
However, it is easier to demon-strate how recycling paper saves landspace and energy. Recycled paperproducts are diverted from landfills,saving land space. Making new paperfrom old paper takes less energy thancutting and processing trees.Answering the following questionsgives further cause to support paperrecycling: Why recycle? What do youvalue? Should we throw usable mate-rials away?
To understand the issues involvedin paper recycling, students need tounderstand how recycled paper isused. Recycled paper products can bemade from a variety of base papers.Cereal boxes can be recycled intodrink carriers or egg cartons. Officepaper can be recycled into schoolpaper, toilet paper or paper towels.Newspaper can be recycled into cor-rugated cardboard and cereal boxes.
Each time paper is recycled itbecomes a lesser grade (a classifica-tion of paper), which means it goesfrom a smooth, tightly woven paperwith a certain amount of strength to aheavier or looser weave paper. Forexample, office paper requires a high-er grade of recyclable paper than cere-al boxes.
When students are given a chanceto look at the recycling process andcompare the use of natural resourcesto recycled resources, they are giventhe knowledge to make decisions thataffect the environment. They are alsogiven the opportunity to see that thereare no easy answers and that we, as asociety, have to decide what we value.By choosing to recycle, students willlearn they can make a difference intheir own homes and schools.
Bibliography and AdditionalResourcesStudent Resources
50 Simple Things Kids Can Do ToRecycle, by John Javna, The EarthWorks Group and the OhioDepartment of Natural Resources,1994.
From Tree to Paper, by Wendy Davis,New York: Scholastic, 1995.
Media
Step into the World of Papermaking,(video) may be obtained fromGeorgia-Pacific Papers, 1994.
How Paper Recycling Works, 12 min-utes, grades 7-12, American PaperInstitute, 1995.
Educator Information
Facts Not Fear, A Parent’s Guide toTeaching Children About theEnvironment, by Michael Sanera andJane S. Shaw, Washington, DC:Regency Publishing, Inc., 1996.
Mastering the Economics Concepts,Ohio Grade 6 Citizenship ProficiencyTest, The Greater Cincinnati Centerfor Economic Education, Universityof Cincinnati, 1995.

Windows on Waste - THE PAPER FACTORY III Help Contents Back
▼
▼
86©Ohio Department of Natural Resources Help Contents Back
▼
▼
86
PreparationPart A: Gather materials. Read overinstructions and papermaking tips onthe handout, How to Make Paper. Coverwork area with newspaper.
Part B: This needs to be done after thepaper products have dried, approxi-mately two days after papermaking.Gather materials. Cover tables for eachgroup. Make an overhead of the hand-out, Papermaking Cost-Analysis Sheet.
ProcedurePART A
Explain how recycling paperrequires a physical change, first by tear-ing and then by liquefying. Comparethe physical change that paper goesthrough with other physical changes,like melting and freezing. Explain thateach student will be a member of agroup that will make paper products.
Divide students into five groups.Each group will have a different baseand group procedure (see the teacherhandout, Papermaking Groups). Make
sure that at least one group has a basethat is labeled “natural resource” (thiscorrelates to using trees to make paper)and at least one group uses a base that isa “recycled resource.”
Give each group their base materi-al and have them shred their materialuntil they have two cups.
NOTE: During papermaking it is usual-ly easier if one group at a time works onmaking paper. The other groups cancomplete Activity 2, What Sort of Trashis This Anyway?
Have groups follow the directionson the handout, How to Make Paper.They will make a paper pulp usingeither a whisk or blender.
NOTE: Groups using the whisk maywant to soak their paper in warm water.
Students may add items to theirpulp as directed on their group sheet.
Students will then use their pulp tomake paper. Each group should use all oftheir pulp to make as many paper prod-ucts as they can. This is important whenthey do the comparisons in Part B.
6
5
4
3
2
1
PapermakingObjectivesStudents will be able to: (a) identify the resources needed to produce a paper productand describe alternative resources that can be used to produce paper; (b) explain therole of energy in a production process; (c) make deductions about the effectiveness ofrecycling in saving money and energy; and (d) analyze the costs and benefits of alter-native consumer choices.
Act
ivity
1Inquiries● How is recycled paper made?
● How can energy be saved byusing recycled paper?
● How can we identify energysaved when using recycledmaterials in a productionprocess?
Content DomainMath – Arithmetic (problemsolving)
Science – General and physicalscience
Learning OutcomesMath, Grade 4, #4, #5, #8, #24
Science, Grade 4, #1, #4, #6, #14
DurationPart A: 45-60 minutes
Part B: 45-60 minutes
MaterialsPart A: Blender, base paper(newspaper, colored construc-tion, colored tissue, toilet tis-sue), warm water, two largebowls, candy molds, wirestrainer, dish pans, screens(see instructions), whisk,newspaper, tablespoons,2-cup measure, Argo pow-dered laundry starch, yarn,potpourri
Part B: Paint, glitter, yarn,markers, doilies, ribbon andassorted materials for decora-tion
THE PAPER FACTORY
continued next page
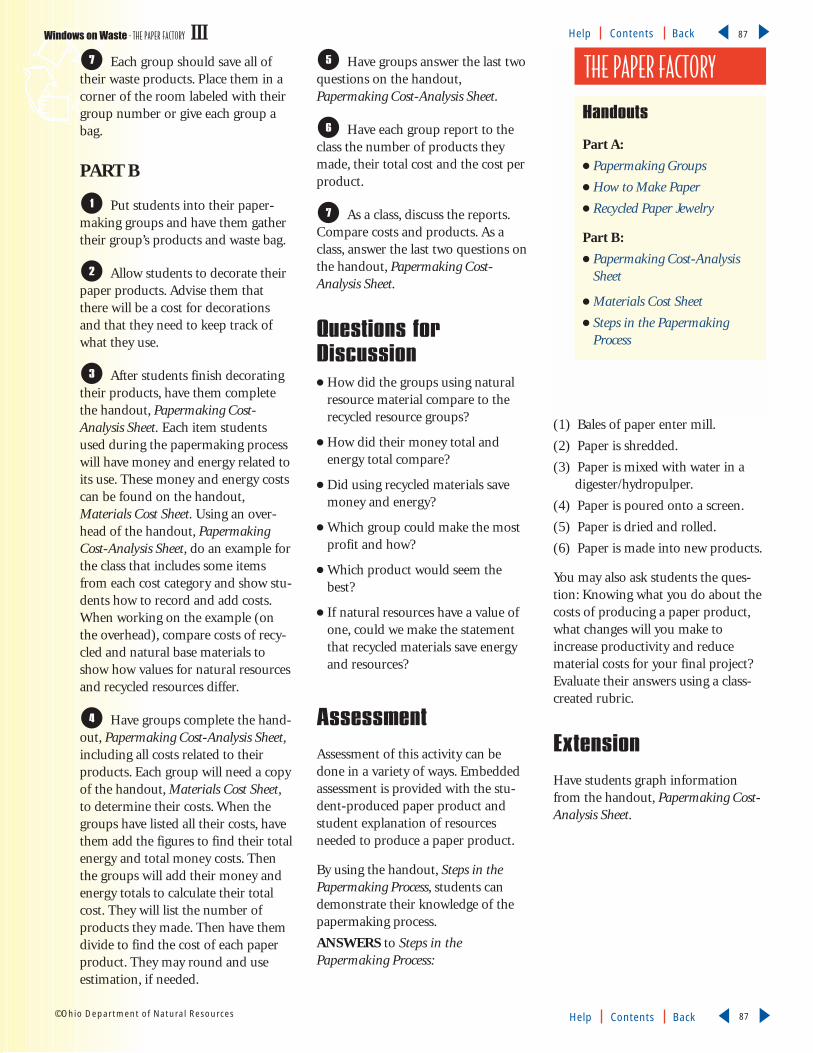
Windows on Waste - THE PAPER FACTORY III Help Contents Back
▼
▼
87©Ohio Department of Natural Resources Help Contents Back
▼
▼
87
Each group should save all oftheir waste products. Place them in acorner of the room labeled with theirgroup number or give each group abag.
PART B
Put students into their paper-making groups and have them gathertheir group’s products and waste bag.
Allow students to decorate theirpaper products. Advise them thatthere will be a cost for decorationsand that they need to keep track ofwhat they use.
After students finish decoratingtheir products, have them completethe handout, Papermaking Cost-Analysis Sheet. Each item studentsused during the papermaking processwill have money and energy related toits use. These money and energy costscan be found on the handout,Materials Cost Sheet. Using an over-head of the handout, PapermakingCost-Analysis Sheet, do an example forthe class that includes some itemsfrom each cost category and show stu-dents how to record and add costs.When working on the example (onthe overhead), compare costs of recy-cled and natural base materials toshow how values for natural resourcesand recycled resources differ.
Have groups complete the hand-out, Papermaking Cost-Analysis Sheet,including all costs related to theirproducts. Each group will need a copyof the handout, Materials Cost Sheet,to determine their costs. When thegroups have listed all their costs, havethem add the figures to find their totalenergy and total money costs. Thenthe groups will add their money andenergy totals to calculate their totalcost. They will list the number ofproducts they made. Then have themdivide to find the cost of each paperproduct. They may round and useestimation, if needed.
Have groups answer the last twoquestions on the handout,Papermaking Cost-Analysis Sheet.
Have each group report to theclass the number of products theymade, their total cost and the cost perproduct.
As a class, discuss the reports.Compare costs and products. As aclass, answer the last two questions onthe handout, Papermaking Cost-Analysis Sheet.
Questions forDiscussion● How did the groups using natural
resource material compare to therecycled resource groups?
● How did their money total andenergy total compare?
● Did using recycled materials savemoney and energy?
● Which group could make the mostprofit and how?
● Which product would seem thebest?
● If natural resources have a value ofone, could we make the statementthat recycled materials save energyand resources?
Assessment Assessment of this activity can bedone in a variety of ways. Embeddedassessment is provided with the stu-dent-produced paper product andstudent explanation of resourcesneeded to produce a paper product.
By using the handout, Steps in thePapermaking Process, students candemonstrate their knowledge of thepapermaking process.
ANSWERS to Steps in thePapermaking Process:
(1) Bales of paper enter mill.
(2) Paper is shredded.
(3) Paper is mixed with water in a digester/hydropulper.
(4) Paper is poured onto a screen.
(5) Paper is dried and rolled.
(6) Paper is made into new products.
You may also ask students the ques-tion: Knowing what you do about thecosts of producing a paper product,what changes will you make toincrease productivity and reducematerial costs for your final project?Evaluate their answers using a class-created rubric.
ExtensionHave students graph informationfrom the handout, Papermaking Cost-Analysis Sheet.
7
6
5
4
3
2
1
7
Handouts
Part A:
● Papermaking Groups
● How to Make Paper
● Recycled Paper Jewelry
Part B:
● Papermaking Cost-AnalysisSheet
● Materials Cost Sheet
● Steps in the PapermakingProcess
THE PAPER FACTORY

Windows on Waste - THE PAPER FACTORY III Help Contents Back
▼
▼
88©Ohio Department of Natural Resources Help Contents Back
▼
▼
88
Group #1Base -------------------newspaper (recycled resource)Tools -------------------blenderMethod ----------------pourShaping----------------screensAdditives --------------colored tissue, potpourri
Group #2Base -------------------colored scrap construction paper (recycled resource),
combine colors (only slightly blended paper will show flecks)
Method ----------------pourShaping----------------screensAdditives --------------none
Group #3Base -------------------colored tissue paper (represents natural resource
because it has not served another use)Tools -------------------whiskMethod ----------------pourShaping----------------screensAdditives --------------potpourri
Group #4Base -------------------toilet paper (natural resource)Tools -------------------whiskMethod ----------------pourShaping----------------screensAdditives --------------string, dryer lint, yarn, feathers
Group #5 (Follow instructions on the handout, Recycled Paper Jewelry)
Base -------------------newspaperTools -------------------blenderMethod ----------------hand fillingShaping----------------candy moldsAdditives --------------starch
Papermaking Groups

Windows on Waste - THE PAPER FACTORY III Help Contents Back
▼
▼
89©Ohio Department of Natural Resources Help Contents Back
▼
▼
89
INSTRUCTIONS FOR MAKING SCREENS: Use wooden or plastic embroidery hoops. Cut polyester win-dow screening to fit the hoops, leaving excess so the screenscan be tightened if they loosen up. Cut plastic canvas to fitthe opening in the hoop.
Tear the base paper into small pieces measuring about 2 cups.
TOOLS:• If using a whisk, put paper and 3 cups of warm water into a
bowl. Let soak for at least 20 minutes. Stir with whisk. • If using a blender, fill blender half full of warm water. Add 2
cups of paper. Blend until the consistency of oatmeal.
ADDITIVES: If your group has an additive put it intothe blender or bowl at this time. Additives add color, textureand smell.
SHAPING: You will be pouring your paper pulp ontoscreens. Make sure to do this over the dishpans so they willcatch the extra water. Pour enough pulp onto the inside of yourhoop to cover the screening. Take the piece of plastic canvasand press onto the pulp to remove the excess water.
With the excess water removed from the pulp, place thehoop, with the canvas still in it, onto a section of newspaper.Use the newspaper to blot the extra moisture out of yourrecycled paper. You are ready to take out your paper when youblot and no water comes out.
Take out the plastic canvas and turn the hoop over ontoa scrap piece of paper. Tap on the back of the screening. If thepaper doesn’t come out, take the hoop apart. Leave the recy-cled paper on the piece of scrap paper to dry.
Put the hoop back together to make your next sheet ofpaper.
7
6
5
4
3
2
1
base paperwarm water2 large bowls
wire strainerdish pansscreens
(see instructions)
whiskblenderplastic canvasnewspaper
2-cup measurecolored tissuestring, yarn, feathers,lint
How to Make PaperMATERIALS
1
2
3
4
5
6
7
NOTE: Collect leftover pulp in a strainer. DO NOT POUR PULP DOWN A SINK DRAIN - it might block it.
Student Handout ✐

Windows on Waste - THE PAPER FACTORY III Help Contents Back
▼
▼
90©Ohio Department of Natural Resources Help Contents Back
▼
▼
90
Recycled Paper JewelryMATERIALS
blender candy or cookie molds acrylic paint2 cups shredded paper dishpans matte spray finishwarm water pin backs 2 mesh screens or 2 tbs. Argo laundry powder starch jewelry glue metal strainers
Fill blender half full of warm water. Add2 cups of shredded paper to warm waterand 2 tablespoons of Argo laundry powderstarch. Blend well.This mixture should bethick but still pourable.
Pour mixture onto screen or into strain-er over dishpan (to catch excess water).Take the other mesh screen and put it ontop of the paper mixture and squeezetogether to remove excess water. If usingstrainer, mix with hands until most of thewater is out of the mixture.
Firmly press paper mixture into candyor cookie molds. Make sure the paper doesnot hang over the edge of the mold. Letmolds dry for one to two days. The paperjewelry will easily come out of molds whencompletely dry.
When jewelry is dry, use glue to adherepin back.
Paint your jewelry using an acrylic paint.After the paint has dried, spray your fin-ished pin with a matte spray finish.
NOTE: Collect leftover pulp in a strainer.DO NOT POUR PULP DOWN A SINKDRAIN - it might block it.
5
4
3
2
1 1
2
3
4
5
ACRYLIC
Student Handout ✐

SUPPLIES
Base Materials ________________________________________Natural or Recycled Resource
Method_____________________________________________
Additives ___________________________________________
___________________________________________________
___________________________________________________
Framing ____________________________________________
Drying Materials _____________________________________
Waste Management __________________________________
Disposal ____________________________________________
___________________________________________________
Decorations _________________________________________
___________________________________________________
___________________________________________________
Labor ______________________________________________
How many paper products did you make? _________________
How many chips did each product cost to make? (total chips divided by number of products) ______________
Were there any ways to make more pieces out of one production session? ________________________
____________________________________________________________________________________
Would you have saved or spent more if your product was made from recycled materials? _________
____________________________________________________________________________________
____________________________________________________________________________________
Student Handout ✐Windows on Waste - THE PAPER FACTORY III Help Contents Back
▼
▼
91©Ohio Department of Natural Resources Help Contents Back
▼
▼
91
Papermaking Cost-Analysis SheetName of company _____________________________________________________________________
Product produced______________________________________________________________________
Students in company ___________________________________
NUMBER OF CHIPSMoney Energy
________ ________
________ ________
________ ________
________ ________
________ ________
________ ________
________ ________
________ ________
________ ________
________ ________
________ ________
________ ________
________ ________
________ ________
________ ________Total money Total energy
______________________Total chips
(total money + total energy = total chips)

Student Handout ✐Windows on Waste - THE PAPER FACTORY III Help Contents Back
▼
▼
92©Ohio Department of Natural Resources Help Contents Back
▼
▼
92
MONEY ENERGY
BASE MATERIALSNewspaper (recycled) . . . . . . . . .2 . . . . . . . .2Toilet paper (natural) . . . . . . . . .3 . . . . . . .3Scrap construction paper
(recycled) . . . . . . . . . . . . . . . . .2 . . . . . . . .2Tissue paper (natural) . . . . . . . .4 . . . . . . .3Water . . . . . . . . . . . . . . . . . . . . . .1 . . . . . . . .1
METHODBlender . . . . . . . . . . . . . . . . . . . . .4 . . . . . . .3Whisk . . . . . . . . . . . . . . . . . . . . . . .1 . . . . . . . .3
ADDITIVESColored tissue . . . . . . . . . . . . . . .4 . . . . . . .3Potpourri . . . . . . . . . . . . . . . . . . .3 . . . . . . .2Argo starch . . . . . . . . . . . . . . . . .3 . . . . . . .3String . . . . . . . . . . . . . . . . . . . . . .1 . . . . . . . .1Yarn . . . . . . . . . . . . . . . . . . . . . . . .1 . . . . . . . .1Feathers . . . . . . . . . . . . . . . . . . .1 . . . . . . . .1
FRAMINGScreens . . . . . . . . . . . . . . . . . . . .3 . . . . . . .3Molds . . . . . . . . . . . . . . . . . . . . . .3 . . . . . . .3
MONEY ENERGY
DRYING MATERIALSNewspaper . . . . . . . . . . . . . . . . . .2 . . . . . . . .2Scrap paper . . . . . . . . . . . . . . . . .2 . . . . . . . .2
WASTE MANAGEMENTSpills . . . . . . . . . . . . . . . . . . . . . . .2 . . . . . . . .2
DISPOSALWaste newspaper . . . . . . . . . . . . .2 . . . . . . . .2Waste water . . . . . . . . . . . . . . . . .2 . . . . . . . .4Base paper . . . . . . . . . . . . . . . . . .5 . . . . . . .5
DECORATIONSPaint . . . . . . . . . . . . . . . . . . . . . . .5 . . . . . . .3Ribbon . . . . . . . . . . . . . . . . . . . . . .3 . . . . . . .3Glitter . . . . . . . . . . . . . . . . . . . . .3 . . . . . . .5Glue . . . . . . . . . . . . . . . . . . . . . . .3 . . . . . . .3Doilies . . . . . . . . . . . . . . . . . . . . . .3 . . . . . . .3
LABOROne Worker . . . . . . . . . . . . . . . . . .2 . . . . . . . .2
Materials Cost Sheet

Student Handout ✐Windows on Waste - THE PAPER FACTORY III Help Contents Back
▼
▼
93©Ohio Department of Natural Resources Help Contents Back
▼
▼
93
Steps in the Papermaking Process
Directions: Put the papermaking process in the right order by numbering the pictures from 1 to 6.
#______Bales of paper enter mill.
#______Paper is dried and
rolled.
#______Paper is poured onto a screen.
#______Paper is made into
new products.
#______Paper is shredded.
#______Paper is mixed with waterin a digester/hydropulper.
P A P E R C O M P A N Y

Windows on Waste - THE PAPER FACTORY III Help Contents Back
▼
▼
94©Ohio Department of Natural Resources Help Contents Back
▼
▼
94
PreparationPlace a sample of each material intoeach of the five bags. Try to give eachgroup the same materials and makesure there is a wide variety of materialsto sort, some recyclable, some not (seecategories on the handout, DichotomousKey). Make a transparency of the hand-out, Dichotomous Key.
ProcedureDivide students into five groups.
Give each group a bag of materials tosort and the handout, Dichotomous Key.
Explain that a dichotomous key isa tool to help in the sorting process andthat they will see these kinds of keys onthe proficiency test. Place the handouttransparency on the overhead andexplain to students how to sort.
NOTE: Through class discussion youmay generate a list of items that can berecycled to help students with the activ-ity. Or, lead a group discussion after theclass completes the task and ask stu-dents to justify their answers.
Have each group place the key ona table, the floor or a group of desks.Then, using the classifications on thekey, have students sort the materials intheir bag. They should raise their handany time they are asked to do so. Whena group raises their hands, check whathas been sorted so far. Ask questionsabout the students’ sorting choices. Ifthe students can justify their choices,they may move to the next sort.
As a group, discuss the sorts eachgroup made and share justifications.
After students are finished sorting,have them complete the handout,Papermaking Terms Puzzle.
AssessmentUse the students’ justification of sortsand class discussion to assess the activity.
5
4
3
2
1
What Sort of Trash is ThisAnyway?ObjectiveStudents will be able to classify solid waste materials using a dichotomous key.
Act
ivity
2
Inquiries● What can be recycled?
● What kinds of materials canbe made into paper?
Content DomainScience – General science
Learning OutcomesMath, Grade 4, #24
Science, Grade 4, #1, #4
Duration30 minutes
MaterialsFive bags with five samples ofeach of the following: newspa-per, toilet paper, tissue, brownpaper towel, constructionpaper, cardboard egg carton,plastic bag, film canister, plas-tic cup, can, metal or plastictoy, plastic soda pop bottle
Handouts● Dichotomous Key
● Papermaking Terms Puzzle
THE PAPER FACTORY

Windows on Waste - THE PAPER FACTORY III Help Contents Back
▼
▼
95©Ohio Department of Natural Resources Help Contents Back
▼
▼
95
Key to Papermaking Terms Puzzle, page 17
R A W M A T E R I A L S A G Z I U B H K E G
P R O D U C T I O N Z X Q R O P P U E N N B
S R E U S E K J X Z X J S G A K G O E I C M
P U S A V M B W C W F E T S A W P R R T R Q
L R P T S O B L Q S X Z V Z E L G U W E I I
A A O P C Z V K E Q T Z Q C U Y T Q J C J W
L D S D L I N Q H Z Y E I P H C P E J H Y Q
V G V O U Y O Z M E C V R U A C D I K N G D
R U A E P C R Y Q I R E M F C F E O B O V V
Z Q Y P R S T V R E P A U F L J D Q O L K D
O Z I O X T I P S A N N O F Z Z Y L K O Z R
U U G U N P I D P R A X N P P G O E S G Y U
R B A X L E G S E M P P L E S H V S X Y E E
Q Z K F I O E S E M G K A F O H C N S H N N
C B Z C O G O C J M A N W P F L B L H F O E
F T Q D A U O A U K E R I T E C O V S L M R
H X S B R N G G B B A N K L D R W P E S G P
S J R C S T X D X S L L T E C N D H G M N E
H A E U Y E B O I C K K P Y T Y A R A G I R
G S M M W G D W V R R N Z A O I C M W I V T
L E I V W R B G F Z E Q K R O W N E E K A N
R T R A S H O T M C I X B X F R E G R D S E

Student Handout ✐Windows on Waste - THE PAPER FACTORY III Help Contents Back
▼
▼
96©Ohio Department of Natural Resources Help Contents Back
▼
▼
96
Dichotomous Key
All Solid Waste Materials
Materials that can berecycled
Materials that cannotbe recycled
Materials that can Materials that Materials that Materialsbe made into a recycled cannot be made into a can be reused that cannot be
paper product recycled paper product reused
STOP ANDRAISE YOUR
HAND
STOP ANDRAISE YOUR
HAND
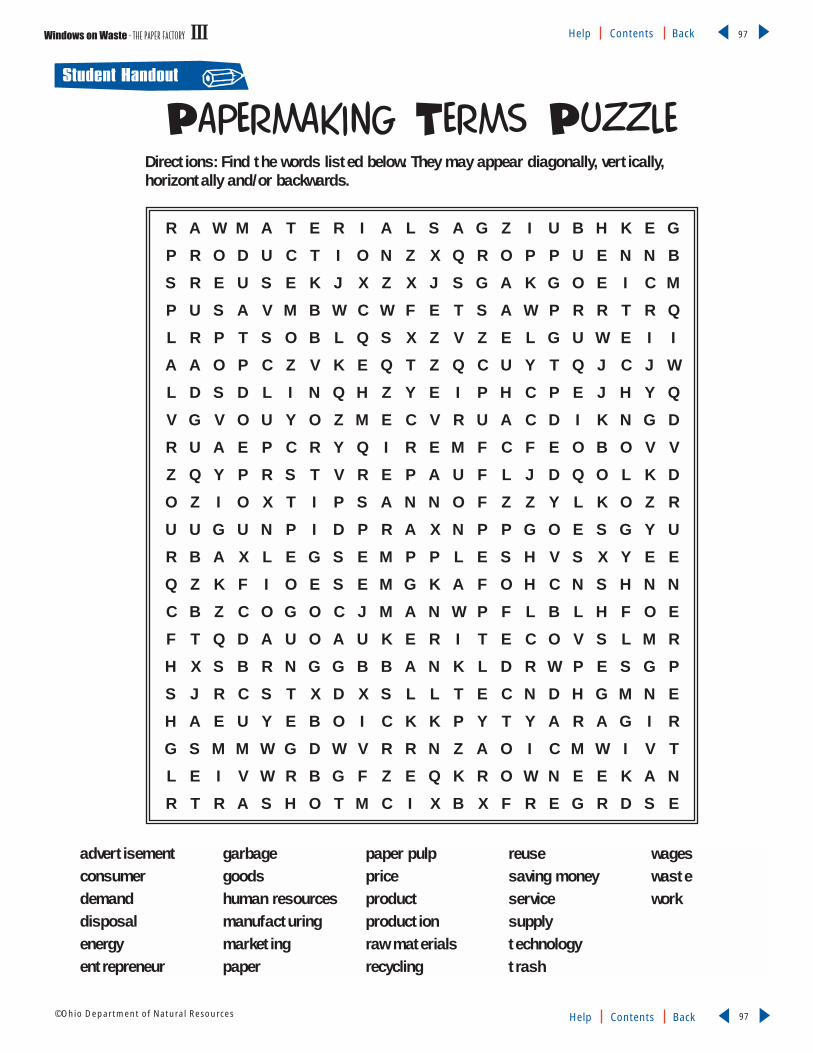
Student Handout ✐Windows on Waste - THE PAPER FACTORY III Help Contents Back
▼
▼
97©Ohio Department of Natural Resources Help Contents Back
▼
▼
97
advertisementconsumerdemanddisposalenergyentrepreneur
garbagegoodshuman resourcesmanufacturingmarketingpaper
paper pulppriceproductproductionraw materialsrecycling
reusesaving moneyservicesupplytechnologytrash
wageswastework
R A W M A T E R I A L S A G Z I U B H K E G
P R O D U C T I O N Z X Q R O P P U E N N B
S R E U S E K J X Z X J S G A K G O E I C M
P U S A V M B W C W F E T S A W P R R T R Q
L R P T S O B L Q S X Z V Z E L G U W E I I
A A O P C Z V K E Q T Z Q C U Y T Q J C J W
L D S D L I N Q H Z Y E I P H C P E J H Y Q
V G V O U Y O Z M E C V R U A C D I K N G D
R U A E P C R Y Q I R E M F C F E O B O V V
Z Q Y P R S T V R E P A U F L J D Q O L K D
O Z I O X T I P S A N N O F Z Z Y L K O Z R
U U G U N P I D P R A X N P P G O E S G Y U
R B A X L E G S E M P P L E S H V S X Y E E
Q Z K F I O E S E M G K A F O H C N S H N N
C B Z C O G O C J M A N W P F L B L H F O E
F T Q D A U O A U K E R I T E C O V S L M R
H X S B R N G G B B A N K L D R W P E S G P
S J R C S T X D X S L L T E C N D H G M N E
H A E U Y E B O I C K K P Y T Y A R A G I R
G S M M W G D W V R R N Z A O I C M W I V T
L E I V W R B G F Z E Q K R O W N E E K A N
R T R A S H O T M C I X B X F R E G R D S E
Papermaking Terms PuzzleDirections: Find the words listed below. They may appear diagonally, vertically, horizontally and/or backwards.

Windows on Waste - THE PAPER FACTORY III Help Contents Back
▼
▼
98©Ohio Department of Natural Resources Help Contents Back
▼
▼
98
Act
ivity
3THE PAPER FACTORY
PreparationArrange to partner with another classfor this activity. Students in the otherclass need to earn chips for their workso they can save for the “product sale.” Itwill take about two weeks to get readyfor the sale, which includes drying timeand days not working on this activity.
PART A: Students should create a jour-nal to keep during the activity.
PART C: Cut examples of good adver-tising out of newspapers and magazinesfor students to use.
PART E: Schedule a time with the part-ner class when each production teamcan present and sell their product.
ProcedurePART A: Develop a Plan
Review with students what theylearned in Activity 1, Papermaking.Explain to students that they will beplaced into groups to establish compa-nies. Their companies will producepaper products, advertise the products
and sell them (for chips) to a youngerclass. (The partner class will be earningchips by working in their classroom.)
Student companies must meet threegoals:
a. Produce a paper product.
b. Use the least amount of money,resources and energy possible.
c. Make a decision about disposal ofwaste products. Disposal optionsinclude:
● landfill● recycle● reuse● toxic waste landfill or incinerator● exchange it● litter or dump it
Students use the handout,Creating Companies, to make basic deci-sions about their companies. As part oftheir planning, students should com-plete the handout, Papermaking Cost-Analysis Sheet #2, by using the handout,Materials Cost Sheet #2, to estimate theircosts. Students start with 100 chips tomake their purchases. Their total costneeds to be less than the purchase priceof materials. Remind students that they
2
1
Inquiries● How does using recycled
materials affect energy use,production costs and saleprice?
● How does waste disposalaffect costs and how canwaste be reduced?
Content DomainMath – Arithmetic (problemsolving)
Science – General science,physical science
Social Studies – Economics
Learning OutcomesMath, Grade 4, #4, #5, #8
Science, Grade 4, #1, #6
If extension is done, the fol-lowing apply:Citizenship, Grade 4, #10, #11and Grade 6, #12
DurationPart A: 60 minutesPart B: 60 minutesPart C: 60 minutesPart D: 60 minutesPart E: 35 minutes
MaterialsPart A: See list of materials forActivity 1, Papermaking
Part C: tag board, markers,stencils, construction paper,glue
Part D: lunch bags, newspa-pers, ziplock bags, tissuepaper, wrapping paper
continued next page
The Paper CompanyObjectivesStudents will be able to: (a) cooperate in groups to develop and implement plans; (b)
compute with whole numbers to assess efficiency of the production process; and (c)
discuss and write advertisements to market their products.

Windows on Waste - THE PAPER FACTORY III Help Contents Back
▼
▼
99©Ohio Department of Natural Resources Help Contents Back
▼
▼
99
should keep some money in reservefor unforeseen events.
Explain that each group willreceive a limited number of resourceand energy chips, so students shouldlook at their estimated costs to makesure they can afford everything theywant or decide where to make costadjustments. To make a profit, thegroups must receive more money(chips) for their product than theyneed to pay for their original expendi-tures. Also, they need to rememberhuman resources (salary for theirworkers).
NOTE: The simulation works if youcharge for everything or provide someitems to each group at no cost.
Consider doing a sample for theclass that shows how to figure cost,estimate the number of paper prod-ucts produced and decide how muchto charge for each product. Remindstudents that this is a plan and theymay find that once they start produc-tion some things may need to change.You can also point out to studentsthat if they look carefully at theirmaterials cost sheet, they can savemoney in the area of waste productdisposal.
PART B: Production
While two groups are in produc-tion, the other groups can work onPart C. The production process maytake several days to complete to giveeach group an opportunity to makeproducts.
Groups should refer back to thepapermaking instructions in Activity1, Papermaking (p. III-9), to maketheir product. Students need to pur-chase their materials. Remind themthat they only have 100 chips tospend.
Students are now ready to pro-duce their products. They must decide
how many products to produce anddetermine what to charge so they canpay costs and earn a profit.
Students also need to put intopractice whatever decision they madeabout waste disposal. Charge for anywaste materials according to thehandout, Materials Cost Sheet #2.
PART C: Advertising
Discuss advertising, why compa-nies advertise and what advertisingsays. Have students look at a variety ofadvertising from newspapers andmagazines.
Each group that is not in pro-duction should work on their adver-tising. They can make posters andwrite jingles or scripts to advertisetheir product to the partner class. Thegroup’s advertising costs will comeout of their original budget.
PART D: Decorate and Package
Allow students an opportunityto buy decorating and packagingmaterials. Discuss with students theimportance of making a productattractive to buyers.
Students decorate and packagetheir products for sale. Ask students toavoid excess packaging and use pack-aging to protect the product. Studentsshould also use packaging to promotethe product and company name.
PART E: Product Show and Sale
Groups are now ready to selltheir products. They can hang theirposters, perform any commercial theyhave and then place their products ona sales table. All products will remainon the sales table until presentationsare made. The partner class will thenhave an opportunity to buy the products.
After the sale, have students fig-ure finances by completing the hand-out, Final Financial Statement. Havethem complete their final journalentry.
Discuss group findings – whatwould they do the same and whatwould they do differently?
At the end of each part in this activity,students should make an entry in ajournal noting what they learnedabout companies and how companieswork.
AssessmentAssessment can be made using arubric designed by companies,reviewing journal entries, or by evalu-ating participation in discussion andaccuracy of written work.
ExtensionReview the information provided inthe lesson, Garbage Goods, p. II-5.Depending upon students’ priorknowledge about the factors of pro-duction, review some of the handoutinformation (such as the handout,Factors of Production, on p. II-21).Have students reconsider all of thematerials and processes that wererequired to make their product andclassify them according to the factorsof production. Also, suggest alterna-tive uses for various resources.
3
2
1
2
1
2
1
4
3
2
1
4
3
Handouts● Creating Companies
● Papermaking Cost-AnalysisSheet #2
● Materials Cost Sheet #2
● Final Financial Statement
THE PAPER FACTORY

Student Handout ✐Windows on Waste - THE PAPER FACTORY III Help Contents Back
▼
▼
100©Ohio Department of Natural Resources Help Contents Back
▼
▼
100
Creating Companies
Choose your company name.________________________________________________________
Choose the paper product to make for the sale. _______________________________________
Using the handout, Papermaking Cost Analysis #2, determine which materials you will need foryour paper product and how much they will cost (see the handout, Materials Cost Sheet #2).
____________________________________________________________________________________
____________________________________________________________________________________
Write an estimate of total costs here. ___________________________________________________
_________________________________________________
_________________________________________________
_________________________________________________
Decide how to handle your waste products:
_________________________________________________
_________________________________________________
____________________________________________________________________________________
____________________________________________________________________________________
Determine costs and add to total in #3 __________________________________________________
Decide how many products you will need to make and how much you will have to charge in order tomake a profit. ________________________________________________________________________
____________________________________________________________________________________
____________________________________________________________________________________
____________________________________________________________________________________
5
4
3
2
1
Money EnergyLandfill (See disposal on Cost Analysis)Recycle 1 1Reuse 0 1Toxic landfill 5 5Exchange 0 0Litter or dump it 8 8

Student Handout ✐Windows on Waste - THE PAPER FACTORY III Help Contents Back
▼
▼
101©Ohio Department of Natural Resources Help Contents Back
▼
▼
101
SUPPLIES
Base Materials ________________________________________Natural or Recycled Resource
Method_____________________________________________
Additives ___________________________________________
___________________________________________________
___________________________________________________
Framing ____________________________________________
Drying Materials _____________________________________
Waste Management __________________________________
Disposal ____________________________________________
___________________________________________________
Decorations _________________________________________
___________________________________________________
___________________________________________________
Labor ______________________________________________
Advertising Materials _________________________________
___________________________________________________
Packaging Materials __________________________________
___________________________________________________
Add up your money chips and energy chips.
Mark the total number of chips for materials and labor on your handout, Creating Companies.
Papermaking Cost-Analysis Sheet #2Name of company _____________________________________________________________________
Product produced______________________________________________________________________
Students in company __________________________________________________________________
NUMBER OF CHIPSMoney Energy
________ ________
________ ________
________ ________
________ ________
________ ________
________ ________
________ ________
________ ________
________ ________
________ ________
________ ________
________ ________
________ ________
________ ________
________ ________
________ ________
________ ________
________ ________
________ ________Total money Total energy
______________________Total chips
(total money + total energy = total chips)

Student Handout ✐Windows on Waste - THE PAPER FACTORY III Help Contents Back
▼
▼
102©Ohio Department of Natural Resources Help Contents Back
▼
▼
102
Materials Cost Sheet #2
MONEY ENERGY
BASE MATERIALSNewspaper (recycled) . . . . . . . . .2 . . . . . . . .2Toilet paper (natural) . . . . . . . . .3 . . . . . . .3Scrap construction paper
(recycled) . . . . . . . . . . . . . . . . .2 . . . . . . . .2Tissue paper (natural) . . . . . . . .4 . . . . . . .3Water . . . . . . . . . . . . . . . . . . . . . .1 . . . . . . . .1
METHODBlender . . . . . . . . . . . . . . . . . . . . .4 . . . . . . .3Whisk . . . . . . . . . . . . . . . . . . . . . . .1 . . . . . . . .3
ADDITIVESColored tissue . . . . . . . . . . . . . . .4 . . . . . . .3Potpourri . . . . . . . . . . . . . . . . . . .3 . . . . . . .2Argo starch . . . . . . . . . . . . . . . . .3 . . . . . . .3String . . . . . . . . . . . . . . . . . . . . . .1 . . . . . . . .1Yarn . . . . . . . . . . . . . . . . . . . . . . . .1 . . . . . . . .1Feathers . . . . . . . . . . . . . . . . . . .1 . . . . . . . .1
FRAMINGScreens . . . . . . . . . . . . . . . . . . . .3 . . . . . . .3Molds . . . . . . . . . . . . . . . . . . . . . .3 . . . . . . .3
DRYING MATERIALSNewspaper . . . . . . . . . . . . . . . . . .2 . . . . . . . .2Scrap paper . . . . . . . . . . . . . . . . .2 . . . . . . . .2
WASTE MANAGEMENTSpills . . . . . . . . . . . . . . . . . . . . . . .2 . . . . . . . .2
MONEY ENERGY
DISPOSALWaste newspaper . . . . . . . . . . . . .2 . . . . . . . .2Waste water . . . . . . . . . . . . . . . . .2 . . . . . . . .4Base paper . . . . . . . . . . . . . . . . . .5 . . . . . . .5
DECORATIONSPaint . . . . . . . . . . . . . . . . . . . . . . .5 . . . . . . .3Ribbon . . . . . . . . . . . . . . . . . . . . . .3 . . . . . . .3Glitter . . . . . . . . . . . . . . . . . . . . .3 . . . . . . .5Glue . . . . . . . . . . . . . . . . . . . . . . .3 . . . . . . .3Doilies . . . . . . . . . . . . . . . . . . . . . .3 . . . . . . .3
LABOROne Worker . . . . . . . . . . . . . . . . . .2 . . . . . . . .2
ADVERTISING MATERIALSTag board . . . . . . . . . . . . . . . . . . .3 . . . . . . .3Markers . . . . . . . . . . . . . . . . . . . .2 . . . . . . . .2Stencils . . . . . . . . . . . . . . . . . . . . .1 . . . . . . . .1Glue . . . . . . . . . . . . . . . . . . . . . . .2 . . . . . . . .2Construction paper . . . . . . . . . . .3 . . . . . . .3
PACKAGING MATERIALSLunch bags . . . . . . . . . . . . . . . . . .3 . . . . . . .3Newspapers . . . . . . . . . . . . . . . . .2 . . . . . . . .2Plastic bags . . . . . . . . . . . . . . . . .3 . . . . . . .3Wrapping paper . . . . . . . . . . . . . .4 . . . . . . .3

Student Handout ✐Windows on Waste - THE PAPER FACTORY III Help Contents Back
▼
▼
103©Ohio Department of Natural Resources Help Contents Back
▼
▼
103
Final Financial StatementName of company ________________________________________________________
Members of company______________________________________________________
________________________________________________________________________
Total cost of product (including human resources) $_____________
Total income from sales $_____________
Profit $_____________
Loss $____________
What would you do differently if you could begin again?__________________________
________________________________________________________________________
________________________________________________________________________
________________________________________________________________________
________________________________________________________________________
What did you do well?______________________________________________________
________________________________________________________________________
________________________________________________________________________
________________________________________________________________________
________________________________________________________________________
What did you learn from this lesson?_________________________________________
________________________________________________________________________
________________________________________________________________________
________________________________________________________________________
________________________________________________________________________
________________________________________________________________________

EnvironmentalStudies LearningConcept
Alifecycle analysis (LCA)
can help determine the
environmental impacts of
our consumer culture, in terms of
specific products. These impacts
include those associated with land
use, energy and resource use, and
pollution. LCA models are based on
the materials management system
in society – how we use resources to
make materials – from a cradle-to-
grave perspective. LCA can help
make decisions about which
products to produce and how to
produce them. LCA complements,
but sometimes conflicts with,
market forces of consumer demand
and material supplies.
Recycling proves to be benefi-
cial for several reasons when
modeled using LCA. The benefits
of recycling can include energy
and resource conservation and
pollution reduction depending
upon the product lifecycle analysis.
Also, recycling reduces the need to
use land space for disposal.
Vocabularybale – to compress, bind or wrap
bauxite – a clay-like ore; used to make aluminum
coal – a mineral resulting from the partial decomposition of vegetable matter, lackof oxygen and under varying degrees of increased temperature and pressure over aperiod of millions of years; used to make steel
cullet – small pieces of glass
cycle – a course of events or operations that recur regularly and usually lead back toa starting point
energy input – the work required to turn a natural resource into a product
iron ore – a mineral from which metals can be extracted; used to make steel
landfill – a place where solid waste is buried, compacted and covered with soil
lifecycle analysis – a method of accounting for all the environmental impactsresulting from a single product
limestone – a rock consisting mainly of calcium carbonate; used to make steel andglass
manufacture – the process of turning raw materials into finished products, usuallywith the aid of machines
mold – a hollow form designed to give a specific shape to something in a molten state
molten – melted
natural resource – material extracted from nature, not made by humans
output – the product, good or material that results from the manufacturing process
petroleum – a natural, thick, oily, flammable, dark liquid mixture found beneaththe Earth’s surface; used to make such products as natural gas, gasoline and plastics
pollution – the contamination of soil, water or air by the discharge or improperdisposal of harmful substances
process – a particular method of doing something, generally involving a number ofsteps
pulp – a mixture of cellulose material, such as wood, paper and rags, ground up andmoistened to make paper
raw materials – natural resources, processed materials or recycled materials used inmanufacturing processes
recycled materials – materials from the solid waste stream that are used insteadof/in combination with raw materials in the manufacturing process
resins – organic substances from various plants and trees; resins can also be manufactured synthetically like the resins used to make plastics
soda ash – crude sodium carbonate; used in the formation of glass
solid waste – regularly collected waste from households, institutions and commercial establishments
transportation energy – the work required to move something from one place toanother
wood chips – small pieces of wood; used as raw material in the papermaking process
THIS IS YOUR LIFECYCLE!Windows on Waste - THIS IS YOUR LIFECYCLE! IV Help Contents Back
▼
▼
104©Ohio Department of Natural Resources Help Contents Back
▼
▼
104

Windows on Waste - THIS IS YOUR LIFECYCLE! IV Help Contents Back
▼
▼
105©Ohio Department of Natural Resources Help Contents Back
▼
▼
105
1
2
Activity 1: Lifecycle BingoDescriptionStudents participate in a modified bingo game to identify the symbols and the math-ematical attributes of the symbols used to represent the parts of a product lifecycle.Students use a key to match words and definitions with the symbols that representthem. They infer from text the words and phrases that describe various parts of thelifecycle of a glass bottle.
Ohio Proficiency Test Learning OutcomesGrade 4, Mathematics #1 – Sort or identify objects on multiple attributes.
Grade 4, Reading #4 – Identify and interpret vocabulary critical to the meaning ofthe text.
Grade 4, Reading #17 – Infer from the text.
Grade 4, Science #4 – Use a simple key to distinguish between objects, organisms and/or phenomena.
Grade 6, Reading #12 – Infer from the text.
Activity 2: Lifecycle HopscotchDescriptionWith the teacher’s help, students construct a classroom-size product lifecycle modelby using paper cutouts for each step of the lifecycle. Students make inferences fromdescriptions of the steps in the product lifecycle to sequentially order the steps onto aclassroom model. Students then role-play various environmental impacts – energy,natural resources, pollution. Lifecycle Hopscotch is played twice, first using a processthat uses only natural resources, and again with a process that replaces naturalresources with recycled materials. Students graph environmental data and comparethe environmental impact of making the product with natural resources to making itusing recycled materials.
Students also cooperate in groups and manipulate materials to construct one offour additional product lifecycles. Students organize and graph data for the productand compare using natural resources to using recycled materials. They constructgraphs again to compare and analyze the data from all five product lifecycles.
Summary
This lesson has two activ-
ities, which should be
conducted in the order
they are presented. The first
activity introduces students to
the symbols needed to construct
a lifecycle model. The second
activity engages students in the
construction of lifecycle models.
Overview - THIS IS YOUR LIFECYCLE!

Windows on Waste - THIS IS YOUR LIFECYCLE! IV Help Contents Back
▼
▼
106©Ohio Department of Natural Resources Help Contents Back
▼
▼
106
Natural resources areused everyday to man-ufacture new prod-ucts. These resourcesare often used as rawmaterials in the man-
ufacturing process. The manufactur-ing process requires energy inputs(transportation and mechanical) toturn a natural resource into a prod-uct, or output. Pollution emissionsand solid waste often result fromthese types of processes.
Buying and using products thatresult in less waste is one aspect ofsource reduction or waste prevention.Mapping the manufacturing processor doing a lifecycle analysis of a prod-uct can show us how much energyand natural resources are requiredand how much pollution and waste isgenerated when making the product.Lifecycle analysis (LCA) traces the“life” of a product from cradle tograve – from the beginning when nat-ural resources are extracted and used
in the manufacturing process to thefinal disposal of the product. In addi-tion, lifecycle analysis charts the flowof energy and natural resources in anartificial ecosystem (manufacturing)and identifies the costs of doing busi-ness in an industrial economy.
Most lifecycles have six steps:• acquiring natural resources• manufacturing• distribution and
transportation• use and reuse• recycling• disposal
Each step requires different types ofnatural resources and energy inputs,and creates outputs of pollution andwaste. Overall, these stages may have a significant impact upon the environment.
Technology has created increasingdemands for the Earth’s energy andnatural resources. Using technology tomanufacture products that meet ourneeds and wants has also generated
pollution. Mapping the lifecycle of aproduct offers an effective way to analyze the environmental impactsassociated with energy and naturalresource use, pollution emissions andsolid waste disposal and recycling. Infact, most LCA studies indicate thatrecycling is beneficial for many rea-sons, depending upon the specificproduct.
Lifecycle analysis studies are notusually well developed enough tomake specific comparisons betweensimilar products such as, which ismore harmful to the environment, apaper cup or plastic cup. However,LCAs can help identify the trade-offsassociated with different choices. Theinformation enables industry andbusiness to identify where and whento use practices that conserve energyand resources, and reduce environ-mental emissions and solid waste.
Ohio Proficiency Test Learning OutcomesGrade 4, Citizenship #11 – Name the resources needed to produce various goods and services.
Grade 4, Mathematics #24 – Make or use a table to record and sort information (in aproblem-solving setting using simple and complex patterns in nature, art or poetry as set-ting) and make identifications, comparisons and predictions from tables, picture graphs,bar graphs and labeled picture maps.
Grade 4, Reading #2 – Use graphic aids (for example, a table or graph) or illustrations tolocate or interpret information.
Grade 4, Science #5 – Analyze a series of events and/or simple daily or seasonal cycles andpredict the next likely occurrence in the sequence.
Grade 4, Science #14 – Identify and/or describe the relationship between human activityand the environment.
Grade 6, Mathematics #21 – Collect data, create a table, picture graph, bar graph, circlegraph or line graph and use them to solve application problems.
Background Information

Windows on Waste - THIS IS YOUR LIFECYCLE! IV Help Contents Back
▼
▼
107©Ohio Department of Natural Resources Help Contents Back
▼
▼
107
PreparationCut out the individual Lifecycle Cardsthat start on p. IV-14 and glue eachdescription on a 3"x 5" card. The keyfor the cards is on p. IV-13, LifecycleDescription Key.
ProcedureGive each student a bingo card,
as well as enough buttons to play several games. Make sure the five different bingo cards are distributedequally among the class.
Using a transparency of thehandout, Lifecycle Symbol Key, intro-duce students to the five symbols and
2
1
Lifecycle BingoObjectivesStudents will be able to: (a) identify symbols that represent the parts of a manufacturing lifecycle; (b) use a key to match words and definitions with the symbols that represent them; and (c) identify and interpret vocabulary used todescribe the manufacturing lifecycles for aluminum, glass, paper, plastic and steel.
Act
ivity
1 Inquiries● How can geometric shapes be
used to make a model of aproduct lifecycle?
● What environmental andproduction factors areimportant in the making of aproduct?
Content DomainMath
Reading – Comprehension
Science – General science
Learning OutcomesMath, Grade 4, #1
Reading, Grade 4, #4, #17 andGrade 6, #12
Science, Grade 4, #4
Duration45-50 minutes
THIS IS YOUR LIFECYCLE!
continued next page
Bibliography and AdditionalResourcesStudent Resources
The Great Glass Caper, The GlassContainer Industry, 1990.
Educator Information
Lifecycle Analysis, An Ounce ofPrevention, National Science TeachersAssociation, 1997.
Paper or Plastic? A Lifecycle AnalysisPerspective, An Ounce of Prevention,National Science Teachers Association,1997.
Scrap Map Teacher’s Kit, Institute ofScrap Recycling Industries, Inc., 1990.
“Product Lifecycles and Recycling,”Investigating Solid Waste Issues, OhioDepartment of Natural Resources,1996.

Windows on Waste - THIS IS YOUR LIFECYCLE! IV Help Contents Back
▼
▼
108©Ohio Department of Natural Resources Help Contents Back
▼
▼
108
explain what they represent. Be sure toexplain the attributes of each symbol(e.g., the number of sides of each sym-bol) and what the symbol (shape) iscalled (hexagon, square, etc.). Ask stu-dents to give examples of each symbol.(When giving examples of naturalresources–the trapezoid–you can notethat Ohio’s natural resources includetrees, coal, water, sand and limestone.)
Play a few games of LifecycleBingo by calling letters and one of thefive symbols used to construct a manu-facturing lifecycle. For example, whenthe instructor calls “B process,” studentswould place a button on a square undercolumn B. When the instructor calls “Noutput,” students would place a buttonon a hexagon under column N. Theinstructor may want to mark his/herown bingo card on the overhead ashe/she calls the letters and symbols.
Students who have five buttonsplaced in a vertical, horizontal or diago-nal line on their bingo card win thegame. Ask winners to yell “recycle”instead of “bingo” when they fill a line.
A more challenging way to playLifecycle Bingo is to use the LifecycleCards instead of calling letters and sym-bols. After listening to a description ofwhat the symbol represents, studentsmust decide whether the description is aprocess, energy input, transportationenergy, an output or a natural resourceand mark their card appropriately. Forexample, when the instructor says “glassjar,” students would place a button on ahexagon because glass jar represents anoutput. If the instructor reads “coal iscarried on a barge to a coal-burningpower plant,” students would place abutton on a diamond because coal car-ried on a barge describes transportationenergy.
Be sure to check the winners’ answers tomake sure he/she has chosen the correctsymbol for each description. In caseswhere the correct answer could be eithera process or transportation energy, theinstructor should ask students which isthe best answer.
NOTE: Descriptions depicting trans-portation energy will have a word inthem directly related to transportation –“carried,” “shipped,” “trucked.”
AssessmentThe handout, Matching Symbols andDefinitions, assesses students’ under-standing of the symbols that are used tomake a product lifecycle model in thenext activity. The handout, Making Glassfrom Raw Materials, assesses students’understanding of the elements that arerequired to make a product and the useof symbols to represent them.
ANSWERS to Matching Symbols andDefinitions:1. trapezoid=natural resources2. diamond=transportation energy3. hexagon=output4. triangle=energy output5. square=process6. square, trapezoid, diamond7. hexagon8. triangle
ANSWERS to Making Glass from RawMaterials:1. the lime, soda ash and sand are mixed
together…square2. lime, soda ash and sand…trapezoid3. gasoline or diesel fuel powers…
triangle4. a finished glass container…hexagon5. three natural resources are then trans-
ported…diamond
5
4
3
MaterialsButtons, 52-3"x 5" cards,copies of each of the five differ-ent bingo cards, transparencyof Lifecycle Symbol Key
Handouts● Lifecycle Symbol Key
● Lifecycle Bingo Cards 1-5
● Lifecycle Description Key
● Lifecycle Cards
● Matching Symbols andDefinitions
● Making Glass from RawMaterials
THIS IS YOUR LIFECYCLE!
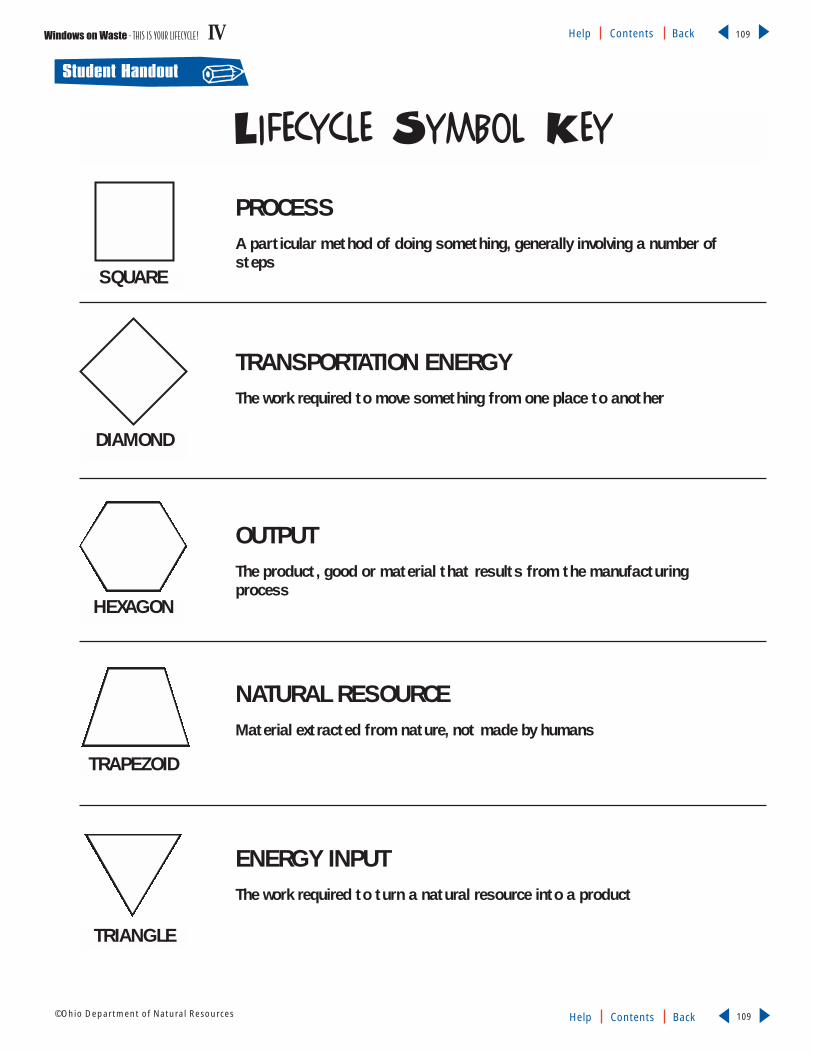
Student Handout ✐Windows on Waste - THIS IS YOUR LIFECYCLE! IV Help Contents Back
▼
▼
109©Ohio Department of Natural Resources Help Contents Back
▼
▼
109
PROCESS A particular method of doing something, generally involving a number ofsteps
TRANSPORTATION ENERGY The work required to move something from one place to another
OUTPUT The product, good or material that results from the manufacturingprocess
NATURAL RESOURCE Material extracted from nature, not made by humans
ENERGY INPUT The work required to turn a natural resource into a product
Lifecycle Symbol Key
SQUARE
DIAMOND
HEXAGON
TRAPEZOID
TRIANGLE

Student Handout ✐Windows on Waste - THIS IS YOUR LIFECYCLE! IV Help Contents Back
▼
▼
110©Ohio Department of Natural Resources Help Contents Back
▼
▼
110
Lifecycle Bingo Card #1
B I N G O

Student Handout ✐Windows on Waste - THIS IS YOUR LIFECYCLE! IV Help Contents Back
▼
▼
111©Ohio Department of Natural Resources Help Contents Back
▼
▼
111
Lifecycle Bingo Card #2
B I N G O

Student Handout ✐Windows on Waste - THIS IS YOUR LIFECYCLE! IV Help Contents Back
▼
▼
112©Ohio Department of Natural Resources Help Contents Back
▼
▼
112
Lifecycle Bingo Card #3
B I N G O

Student Handout ✐Windows on Waste - THIS IS YOUR LIFECYCLE! IV Help Contents Back
▼
▼
113©Ohio Department of Natural Resources Help Contents Back
▼
▼
113
Lifecycle Bingo Card #4
B I N G O

Student Handout ✐Windows on Waste - THIS IS YOUR LIFECYCLE! IV Help Contents Back
▼
▼
114©Ohio Department of Natural Resources Help Contents Back
▼
▼
114
Lifecycle Bingo Card #5
B I N G O
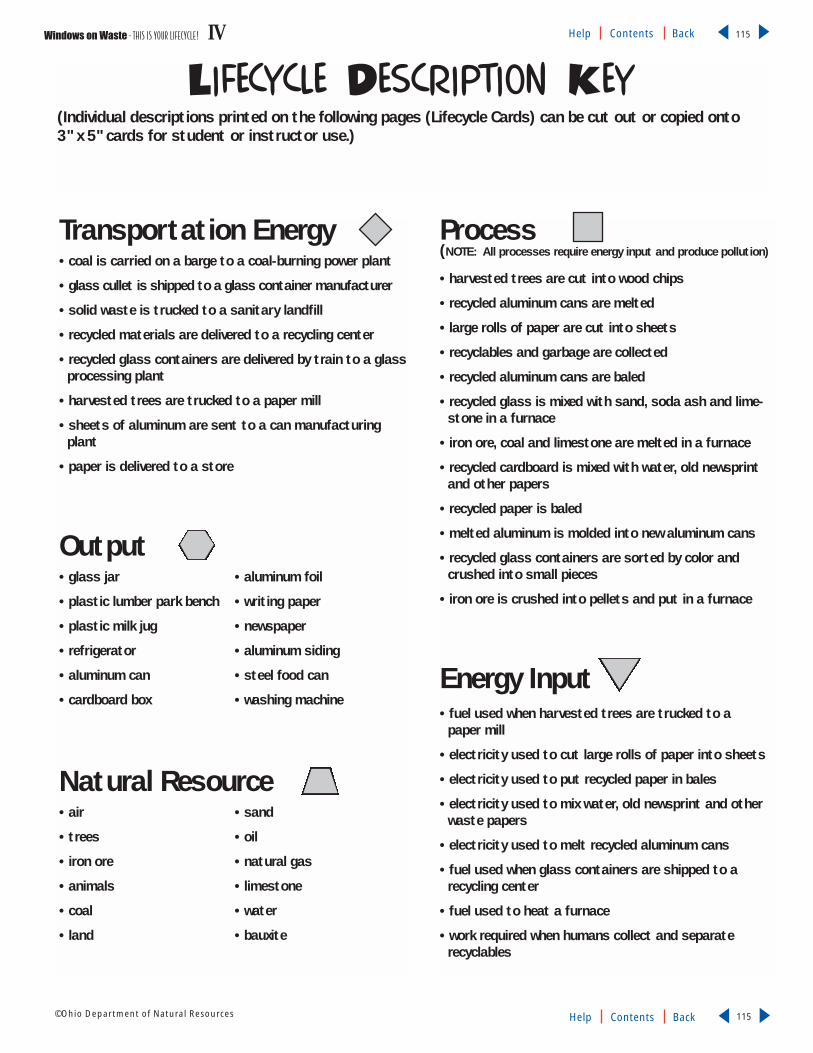
Windows on Waste - THIS IS YOUR LIFECYCLE! IV Help Contents Back
▼
▼
115©Ohio Department of Natural Resources Help Contents Back
▼
▼
115
Lifecycle Description Key(Individual descriptions printed on the following pages (Lifecycle Cards) can be cut out or copied onto 3" x 5" cards for student or instructor use.)
Transportation Energy• coal is carried on a barge to a coal-burning power plant
• glass cullet is shipped to a glass container manufacturer
• solid waste is trucked to a sanitary landfill
• recycled materials are delivered to a recycling center
• recycled glass containers are delivered by train to a glassprocessing plant
• harvested trees are trucked to a paper mill
• sheets of aluminum are sent to a can manufacturingplant
• paper is delivered to a store
Output• glass jar • aluminum foil
• plastic lumber park bench • writing paper
• plastic milk jug • newspaper
• refrigerator • aluminum siding
• aluminum can • steel food can
• cardboard box • washing machine
Natural Resource • air • sand
• trees • oil
• iron ore • natural gas
• animals • limestone
• coal • water
• land • bauxite
Process(NOTE: All processes require energy input and produce pollution)
• harvested trees are cut into wood chips
• recycled aluminum cans are melted
• large rolls of paper are cut into sheets
• recyclables and garbage are collected
• recycled aluminum cans are baled
• recycled glass is mixed with sand, soda ash and lime-stone in a furnace
• iron ore, coal and limestone are melted in a furnace
• recycled cardboard is mixed with water, old newsprintand other papers
• recycled paper is baled
• melted aluminum is molded into new aluminum cans
• recycled glass containers are sorted by color andcrushed into small pieces
• iron ore is crushed into pellets and put in a furnace
Energy Input• fuel used when harvested trees are trucked to a
paper mill
• electricity used to cut large rolls of paper into sheets
• electricity used to put recycled paper in bales
• electricity used to mix water, old newsprint and otherwaste papers
• electricity used to melt recycled aluminum cans
• fuel used when glass containers are shipped to a recycling center
• fuel used to heat a furnace
• work required when humans collect and separate recyclables

Windows on Waste - THIS IS YOUR LIFECYCLE! IV Help Contents Back
▼
▼
116©Ohio Department of Natural Resources Help Contents Back
▼
▼
116
coal is carried on a barge toa coal-burning power plant
glass cullet is shippedto a glass containermanufacturer
solid waste is trucked to asanitary landfill
recycled materials aredelivered to a recyclingcenter
recycled glass containersare delivered by train to aglass processing plant
harvested trees aretrucked to a paper mill
sheets of aluminum aresent to a can manufactur-ing plant
paper is delivered to a store
Lifecycle Cards (1 of 7)

Windows on Waste - THIS IS YOUR LIFECYCLE! IV Help Contents Back
▼
▼
117©Ohio Department of Natural Resources Help Contents Back
▼
▼
117
glass jar plastic lumber park bench
plastic milk jug refrigerator
aluminum can cardboard box
aluminum foil writing paper
Lifecycle Cards (2 of 7)

Windows on Waste - THIS IS YOUR LIFECYCLE! IV Help Contents Back
▼
▼
118©Ohio Department of Natural Resources Help Contents Back
▼
▼
118
newspaper aluminum siding
steel food can washing machine
air trees
iron ore animals
Lifecycle Cards (3 of 7)

Windows on Waste - THIS IS YOUR LIFECYCLE! IV Help Contents Back
▼
▼
119©Ohio Department of Natural Resources Help Contents Back
▼
▼
119
coal land
sand oil
natural gas limestone
water bauxite
Lifecycle Cards (4 of 7)
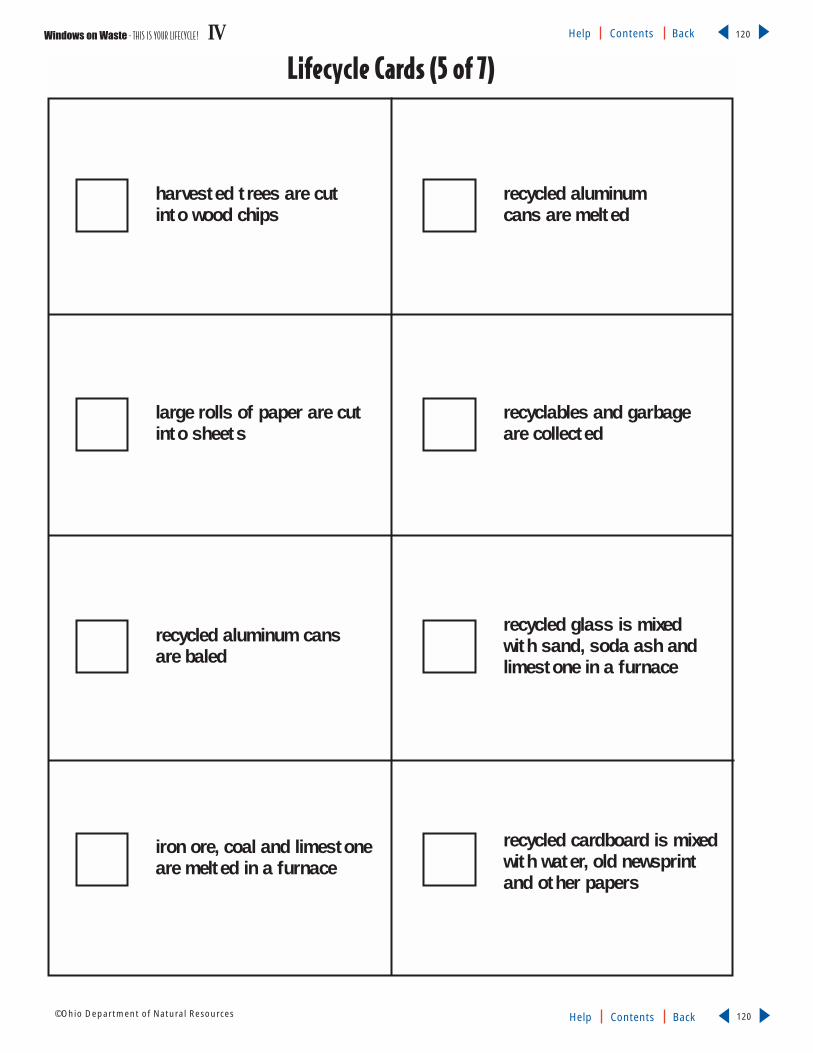
Windows on Waste - THIS IS YOUR LIFECYCLE! IV Help Contents Back
▼
▼
120©Ohio Department of Natural Resources Help Contents Back
▼
▼
120
harvested trees are cutinto wood chips
recycled aluminumcans are melted
large rolls of paper are cutinto sheets
recyclables and garbageare collected
recycled aluminum cansare baled
recycled glass is mixedwith sand, soda ash andlimestone in a furnace
iron ore, coal and limestoneare melted in a furnace
recycled cardboard is mixedwith water, old newsprintand other papers
Lifecycle Cards (5 of 7)

Windows on Waste - THIS IS YOUR LIFECYCLE! IV Help Contents Back
▼
▼
121©Ohio Department of Natural Resources Help Contents Back
▼
▼
121
recycled paper is baledmelted aluminumis molded into newaluminum cans
recycled glass containersare sorted by color andcrushed into small pieces
iron ore is crushed into pellets and put in a furnace
fuel used when harvestedtrees are trucked to apaper mill
electricity used to cut largerolls of paper into sheets
electricity used to putrecycled paper in bales
electricity used to mixwater, old newsprint andother waste papers
Lifecycle Cards (6 of 7)

Windows on Waste - THIS IS YOUR LIFECYCLE! IV Help Contents Back
▼
▼
122©Ohio Department of Natural Resources Help Contents Back
▼
▼
122
electricity used to meltrecycled aluminum cans
fuel used when glasscontainers are shippedto a recycling center
fuel used to heat a furnacework required whenhumans collect andseparate recyclables
Lifecycle Cards (7 of 7)

1. PROCESS
2. ENERGY INPUT
3. NATURAL RESOURCE
4. TRANSPORTATION ENERGY
5. OUTPUT
6. What are the names of the symbols with four sides?
7. What is the name of the symbol with six sides?
8. What is the name of the symbol with three sides?
Student Handout ✐Windows on Waste - THIS IS YOUR LIFECYCLE! IV Help Contents Back
▼
▼
123©Ohio Department of Natural Resources Help Contents Back
▼
▼
123
Matching Symbols and DefinitionsDirections: Draw a line from the word on the right to the symbol on the left that represents it.

Student Handout ✐Windows on Waste - THIS IS YOUR LIFECYCLE! IV Help Contents Back
▼
▼
124©Ohio Department of Natural Resources Help Contents Back
▼
▼
124
1.
2.
3.
4.
5.
Making Glass from Raw MaterialsDirections: Read the following paragraph and in the space beside each symbol, write the words or phrases fromthe paragraph that match the symbols that represent different steps in the manufacturing process.
Lime, soda ash and sand are removed from the earth. Gasoline or diesel fuel powers the machines that removethe lime, soda ash and sand from the earth. These three natural resources are then transported to a glass man-ufacturing plant. At the plant, the lime, soda ash and sand are mixed together and heated at a very high temper-ature to make a glassy liquid. This liquid is then dropped into a mold where it is formed into a finished glass con-tainer. Before the container is ready to be shipped to a store or food processing facility, the container is reheat-ed and allowed to cool slowly.
SYMBOL PHRASES OR WORDS THAT MATCH THE SYMBOL

Windows on Waste - THIS IS YOUR LIFECYCLE! IV Help Contents Back
▼
▼
125©Ohio Department of Natural Resources Help Contents Back
▼
▼
125
Inquiries● How is a product made when
only using natural resources?
● How is a product made whenusing recycled materials?
● In a product lifecycle, whendoes using recycled materialsreduce the amount of energyrequired, the amount of nat-ural resources consumed andthe amount of pollutionemitted?
Content DomainMath – Arithmetic
Science – General science
Social Studies – Economics
Learning OutcomesCitizenship, Grade 4, #11
Math, Grade 4, #24 and Grade 6, #21
Reading, Grade 4, #2
Science, Grade 4, #5, #14
DurationPart A: 45-50 minutes
Part B: Two 50-minute periods
MaterialsPart A: 81/2˝ x 11˝ (or larger)cards with individual steps forONE of the lifecycles (alu-minum, glass, paper, plastic orsteel), three groups of items,each a different color, 20items in each group (20 grayfuzzies, 20 green, 20 red) thatcan be passed from one studentto another in their hands.
Lifecycle HopscotchObjectivesStudents will be able to: (a) identify when energy is required, natural resources areconsumed and pollution is emitted in a product lifecycle; (b) explain the environ-mental impact of using recycled materials in a product lifecycle; and (c) constructbar charts to illustrate and compare the environmental impacts of using naturalresources and recycled materials in a product lifecycle.
Act
ivity
2THIS IS YOUR LIFECYCLE!
continued next page
PreparationReview the teacher pages. Begin with theteacher page, Product Lifecycle Model.This model can be used for each of thefive products (aluminum cans, glass bot-tles, newspaper, plastic bottles and steelcans) explained on additional teacherpages.
There are two teacher pages for each ofthe five products. Each pair includes: anexplanation of the lifecycle model andthe environmental impacts when theproduct is made from natural resources(Making Aluminum Cans, Glass Bottles,Newspaper, Plastic Bottles and Steel Cansfrom Natural Resources) and an explana-tion of the lifecycle model and the envi-ronmental impacts when the product is made using recycled materials(Making Aluminum Cans, Glass Bottles,Newspaper, Plastic Bottles and Steel Cansfrom Recycled Materials).
Decide which product lifecycle to use inthe activity. You will need two copies ofeach pair of teacher pages; one to be cutup into the various parts, the other tobe used to conduct the “hopscotching.”
NOTE: Remember, the numbers for thevarious steps (symbols) on the teacher
page, Product Lifecycle Model, corre-spond with the numbers on each of thepairs of product explanations.
Make the steps for a large classroommodel of the Product Lifecycle Model.Using large (81⁄2˝ x 11˝ or larger) sheetsof paper, cut each in the appropriateshape as indicated on the ProductLifecycle Model. (The shapes are thesame geometric symbols used in the firstactivity and they represent the samesteps of a lifecycle as previously dis-cussed.) Be sure to add energy inputs(triangles) to processes (squares). Todesignate pollution emissions, add a “P”to transportation energy (diamonds)and to processes (squares). Also, includeenough arrows to indicate the flow ofthe lifecycle.
Cut out the descriptions – not includingthe numbers for energy inputs, pollu-tion, resources, etc, in parenthesis – ofeach step of the product’s lifecycle.These will be applied in discussion withstudents after the lifecycle symbols havebeen placed sequentially on the floor orwall.
A floor or wall space of approximately 20feet by 5 feet will be required to assemblethe lifecycle of your choice.

Windows on Waste - THIS IS YOUR LIFECYCLE! IV Help Contents Back
▼
▼
126©Ohio Department of Natural Resources Help Contents Back
▼
▼
126
In the activity you will conduct withstudents the linear part of the modelfirst—the part without recycling—andthen conduct the cyclical part—the partwith the recycling loop added to the lin-ear model.
ProcedurePART A
Explain to students that the activitythey will engage in portrays the lifecycleof a product (how the product is madeand what happens to it after it is used—whether recycled or landfilled), includinghow the environment is affected by mak-ing consumer products.
Over a large expanse of the class-room floor or wall (about 20 feet by 5foot space), assemble the lifecycle modelyou have chosen to use. (See thePreparation section.) For the first roundof Lifecycle Hopscotch, place only thesteps for the linear lifecycle, (withoutrecycling). This involves the 12 stepsdescribed on the teacher page for theproduct made using natural resources.
Explain the model to students. Asyou explain the model, review the sym-bols from the previous activity for aprocess, energy input, transportationenergy, output and natural resource.
Decide how to add the explanations tothe symbols on the model.
● Either read aloud each step, insequence, and have a student glue theexplanation onto the symbol, or
● Divide students into groups and giveeach group a set of the explanations(with the numbers not included ineach cut-out description) to place onthe model in the order in which theythink each step happens.
The latter method takes more time butrequires more thought by students.
NOTE: The latter approach is used inPart B of this activity. If you decide to
conduct Part B, use the first methodabove as an example.
After completing the linear model,explain to students that the environ-mental effects are missing from themodel. The environmental effects arerepresented by using different coloredfuzzies (or any item chosen to designateunits). In the following scenario, redfuzzies represent natural resources,green fuzzies represent energy (bothenergy inputs and transportation ener-gy) and gray fuzzies represent pollution,designated with a “P” on processes(squares) and on transportation energy(diamonds).
Choose one student to move or“hopscotch” through the model—onestep at a time—collecting fuzzies fromother students. The “hopscotching” stu-dent will need a container (about the sizeof a coffee can) to collect the fuzzies.
Have other students line up beside themodel ready to hand the appropriatenumber and color of fuzzies to the stu-dent depending upon the step of themodel he/she has hopped to.
● Give eight students a handful of grayfuzzies each and place the studentsbeside the steps of the model with a“P” written on them.
● Give eight students a handful of greenfuzzies each and place the studentsbeside the energy (energy inputs andtransportation energy) steps of themodel.
● Give two students a handful of redfuzzies each and place them beside thetwo steps where natural resource symbols are located.
Each student in the class should have arole.
To know how many different coloredfuzzies the hopscotching student shouldreceive at each step, refer to the corre-sponding teacher page, (i.e. MakingAluminum Cans from Natural Resources,etc.) for your chosen product lifecycle.
5
4
3
2
1
Materials, Part B: three sets ofcolor-coded items (fuzzies),80 each color for four studentgroups. If more groups areused, additional fuzzies areneeded.
Handouts● Product Lifecycle Model
● Environmental Impacts andthe Product Lifecycle Models
● Making _____from NaturalResources: Bar Chart
● Making _____from RecycledMaterials: Bar Chart
● Lifecycle Hopscotch Post-Test
A set of the teacher pages forproduct of choice*:
● Making Aluminum Cans fromNatural Resources andMaking Aluminum Cans fromRecycled Materials
● Making Glass Bottles fromNatural Resources andMaking Glass Bottles fromRecycled Materials
● Making Newspaper fromNatural Resources andMaking Newspaper fromRecycled Materials
● Making Plastic DetergentBottles from Natural Resourcesand Making Plastic DetergentBottles from RecycledMaterials
● Making Steel Cans fromNatural Resources andMaking Steel Cans fromRecycled Materials
* In the teacher sets, the firsthandout describes a product life-cycle using natural resources andthe impact to the environment,and the second handoutdescribes the same product life-cycle using recycled materialsand the impact to the environ-ment.
THIS IS YOUR LIFECYCLE!

Windows on Waste - THIS IS YOUR LIFECYCLE! IV Help Contents Back
▼
▼
127©Ohio Department of Natural Resources Help Contents Back
▼
▼
127
Have the hopscotching studentbegin on the natural resource symbolfor the product. The student shouldreceive the designated amount of redfuzzies from the student beside theresource symbol. When pollution isemitted in the process (which occursevery time there is a process andtransportation energy), a student role-playing pollution emissions shouldgive the hopscotching student the designated number of gray fuzzies.When energy inputs are required(every time there is a process andtransportation energy), the designatednumber of green fuzzies should begiven to the hopscotching student.
Have students return to theirseats, except for the hopscotching stu-dent who collected the fuzzies. Havethis student sort the fuzzies by colorand count how many of each colorwere collected. While this student iscounting, give each students the hand-out, Making _____from NaturalResources: Bar Chart. Have them writein the blank space the product beingconsidered. On the bar chart, recordthe number of resource units (redfuzzies) used, the number of energyunits (green fuzzies) used, and thenumber of pollution units (grayfuzzies) produced. Have students storethese graphs in a safe place.
Now continue the lifecycle hop-scotch game by repeating steps 5-7above, only this time use the recyclingscenario and record the environmen-tal impacts by having each studentrecord data on the handout, Making_____from Recycled Materials: BarChart.
Have students compare theresults of the two bar charts by mak-ing a single bar chart. Discuss resultsin class. Refer to the teacher page,Environmental Impacts and the ProductLifecycle Models, to aid in discussionand to ensure that the data was col-lected correctly for the chosen productlifecycle.
PART B
Conduct the rest of the activityusing the four product lifecycles notused in Part A.
Divide students into groups andgive each group a set of lifecycle stepsfor one product cut out from the twoteacher pages. Give them the steps forboth natural resources and recycledmaterials. DO NOT include the num-ber of each step and distribute all fourof the other products among thegroups.
Decide whether to include the infor-mation about environmental impacts(the numbered items in parenthesisbelow each step) in the cut-outdescriptions given to the groups, orwait and conduct the hopscotch gameagain for each product and read aloudthe number of fuzzies.
Give each group materials andsupplies sufficient to construct a life-cycle model using the set of steps theyhave been given. (Instead of a largeclassroom floor model, you could havestudents draw or glue the model onlarge sheets of paper.) Have eachgroup construct their model.
Conduct the hopscotch game foreach product lifecycle, collecting data(fuzzies) again and recording this dataon the graphs. Or, just have studentgroups make their own calculations ifyou supplied this information witheach step.
Have all groups share their dataand graphs. Have each student orgroup make one large bar graph,including all five products and compar-isons of all five in regard to productionusing natural resources only and pro-duction using recycled materials.
Once again, refer to the teacher page,Environmental Impacts and the ProductLifecycle Models, to aid in discussionand to ensure that data was collectedcorrectly for each product.
Discuss the data and how envi-ronmental impacts differ dependingupon the product. It should be notedthat different products of the samematerial type (i.e., copy paper, news-paper, writing paper) have differentimpacts based on the industrialprocesses and other materials requiredto make each product.
Conducting this activity will show thatalthough impacts vary from productto product, the use of recycled materi-als, generally (always when using thescenario of this lesson), produce lessharmful impacts upon the environ-ment in regard to resource and energyuse, pollution and land use.
AssessmentHave students complete the
handout, Lifecycle Hopscotch Post-Test.
ANSWERS to Lifecycle Hopscotch Post-Test: 1. d, 2. b, 3. d, 4. a
Have students write about thenatural resources’ journey through thelifecycle. Make sure that studentsinclude the steps in the lifecycle whereenergy inputs and natural resourceswere required and where pollutionwas emitted. Students should answerthe following questions in their narra-tive:
● What natural resources are used tomake the product?
● Where in the product’s lifecycle waspollution emitted? Why?
● Where in the product’s lifecycle isenergy used to extract, process andtransport the natural resource?
ExtensionHave students research and create alifecycle for a favorite product.Students can write about their prod-ucts’ lifecycle in journals, map out life-cycles with pattern blocks on the flooror make lifecycle posters.
2
1
6
5
4
3
2
1
9
8
7
6

Windows on Waste - THIS IS YOUR LIFECYCLE! IV Help Contents Back
▼
▼
128©Ohio Department of Natural Resources Help Contents Back
▼
▼
128
Product L
ifecycle M
odel
RECY
CLIN
G
P
14
56
78
910
1112
16
1514
13
32
PP
PP
P
PP
PP
P
P
���

Windows on Waste - THIS IS YOUR LIFECYCLE! IV Help Contents Back
▼
▼
129©Ohio Department of Natural Resources Help Contents Back
▼
▼
129
Environmental Impacts and the Product Lifecycle Models
The data below, derived from the product lifecycle models in this activity, indicate the environmental impacts for thevarious product lifecycles that can be used in the activity. The data, based on hypothetical units (“fuzzies” or otheritems used when conducting the lifecycle activity), indicate that recycling saves natural resources and energy, andreduces pollution. The hypothetical units for each environmental impact category (resources, energy and pollution),with and without recycling, differ depending upon the specific product. This represents reality to the extent that dif-ferent products (glass products, paper products, plastic products, etc.) have different environmental impacts depend-ing upon the materials and production processes used to make each product.
In this lesson, the environmental impacts (or hypothetical units-fuzzies) have been generalized based on thescheme below. *
RECYCLING REDUCES POLLUTION: aluminum, steel, paper, glass, plasticRECYCLING REDUCES ENERGY USE: aluminum, plastic, steel, paper, glassRECYCLING REDUCES RESOURCE USE: steel, aluminum, plastic, glass, paper
*This scheme is based on generalizations derived from the following sources:
Lester Brown, Christopher Flavin & Sandra Postel, Saving the Planet: How to Shape an Environmentally Sustainable Global Economy (NewYork: W.W. Norton & Company, 1991), p. 65; Susan M. Selke, Packaging and the Environment: Alternatives, Trends, Solutions (Lancaster, PA:Technomic Publishing Co., 1990), pp. 100 & 106; and John E. Young, “Mining the Earth,” State of the World 1992: A Worldwatch InstituteReport on Progress Toward a Sustainable Society (New York: W.W. Norton & Company, 1992), p.100.
Natural Resources Energy Pollution
ALUMINUM CAN
with natural resources 6 12 12
with recycling 2 7 7
units saved with recycling 4 5 5
GLASS BOTTLE
with natural resources 6 11 10
with recycling 4 9 8
units saved with recycling 2 2 2
NEWSPAPER
with natural resources 3 9 10
with recycling 2 7 7
units saved with recycling 1 2 3
PLASTIC BOTTLE
with natural resources 3 11 9
with recycling 1 7 8
units saved with recycling 2 4 1
STEEL CAN
with natural resources 6 10 11
with recycling 1 7 7
units saved with recycling 5 3 4
Hypothetical units (fuzzies or other items) derived when conducting the activity.

Windows on Waste - THIS IS YOUR LIFECYCLE! IV Help Contents Back
▼
▼
130©Ohio Department of Natural Resources Help Contents Back
▼
▼
130
1. Bauxite is needed.(5 natural resource)
2. Bauxite is mined.(2 energy input/2 pollution)
3. Bauxite is transported to an aluminum smelting plant.(1 transportation energy/1 pollution)
4. At the aluminum plant, bauxite is refined into alumina powder andmelted (smelted) in a furnace to make aluminum.(4 energy input/4 pollution)
5. Product: large sheets of aluminum.
6. Sheets of aluminum are delivered to a manufacturing plant.(1 transportation energy/1 pollution)
7. Sheets of aluminum are made into cans and filled with a beverage.(1 energy input/1 pollution)
8. Product: aluminum cans filled with beverage.
9. Filled aluminum cans are delivered to a store.(1 transportation energy/1 pollution)
10. Customer buys and uses product, then discards the aluminum can.
11. Aluminum cans, along with other solid waste items, are collectedand transported to a landfill.(1 transportation energy/1 pollution)
12. Aluminum cans and other solid waste items are buried in a landfill.(1 natural resource/1 energy input/1 pollution)
Making Aluminum Cans from Natural Resources
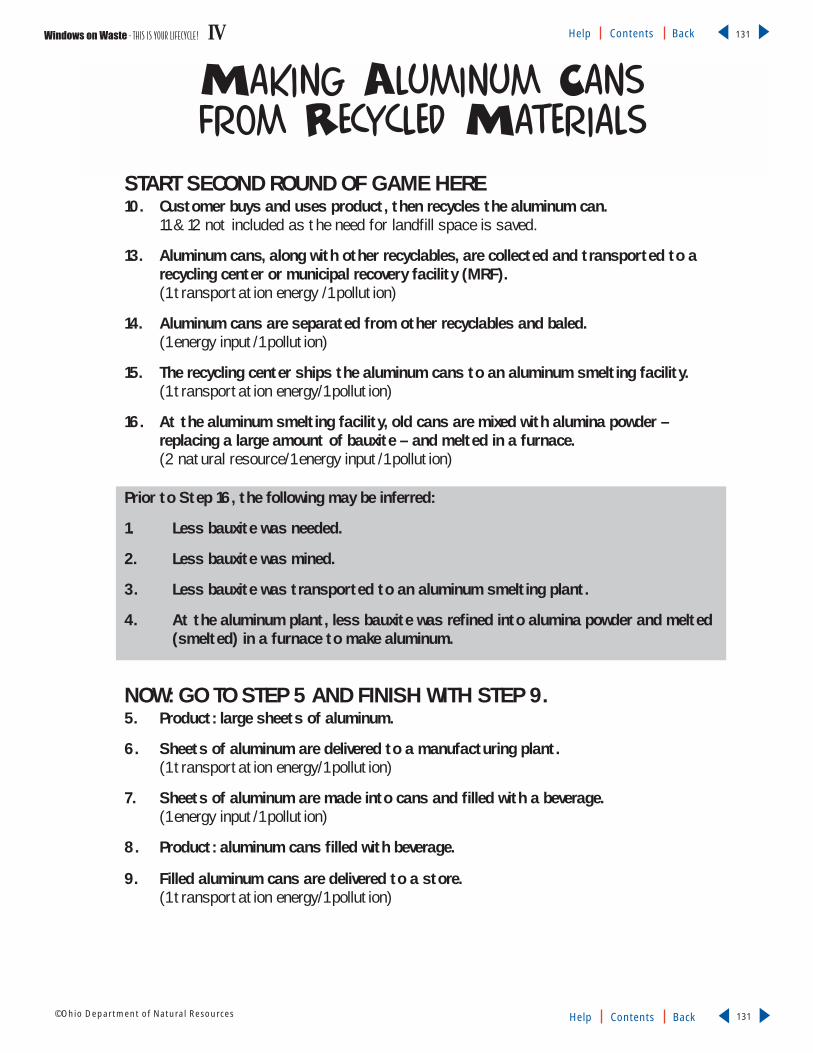
Windows on Waste - THIS IS YOUR LIFECYCLE! IV Help Contents Back
▼
▼
131©Ohio Department of Natural Resources Help Contents Back
▼
▼
131
START SECOND ROUND OF GAME HERE10. Customer buys and uses product, then recycles the aluminum can.
11 & 12 not included as the need for landfill space is saved.
13. Aluminum cans, along with other recyclables, are collected and transported to arecycling center or municipal recovery facility (MRF).(1 transportation energy /1 pollution)
14. Aluminum cans are separated from other recyclables and baled.(1 energy input/1 pollution)
15. The recycling center ships the aluminum cans to an aluminum smelting facility.(1 transportation energy/1 pollution)
16. At the aluminum smelting facility, old cans are mixed with alumina powder – replacing a large amount of bauxite – and melted in a furnace.(2 natural resource/1 energy input/1 pollution)
Prior to Step 16, the following may be inferred:
1. Less bauxite was needed.
2. Less bauxite was mined.
3. Less bauxite was transported to an aluminum smelting plant.
4. At the aluminum plant, less bauxite was refined into alumina powder and melted(smelted) in a furnace to make aluminum.
NOW: GO TO STEP 5 AND FINISH WITH STEP 9.5. Product: large sheets of aluminum.
6. Sheets of aluminum are delivered to a manufacturing plant.(1 transportation energy/1 pollution)
7. Sheets of aluminum are made into cans and filled with a beverage.(1 energy input/1 pollution)
8. Product: aluminum cans filled with beverage.
9. Filled aluminum cans are delivered to a store.(1 transportation energy/1 pollution)
Making Aluminum Cans from Recycled Materials

Windows on Waste - THIS IS YOUR LIFECYCLE! IV Help Contents Back
▼
▼
132©Ohio Department of Natural Resources Help Contents Back
▼
▼
132
1. Sand, soda ash and limestone are needed.(5 natural resource)
2. Sand, soda ash and limestone are mined.(2 energy input/2 pollution)
3. Sand, soda ash and limestone are transported to a glass plant.(1 transportation energy/1 pollution)
4. At the glass plant, sand, soda ash and limestone are mixedtogether and melted in a furnace to form gobs that are droppedinto molds to make glass bottles.(3 energy input/2 pollution)
5. Product: glass bottles.
6. Glass bottles are delivered to a beverage plant.(1 transportation energy/1 pollution)
7. Glass bottles are filled with beverage.(1 energy input/1 pollution)
8. Product: glass bottles filled with beverage.
9. Filled glass bottles are delivered to a store.(1 energy input/1 pollution)
10. Customer buys and uses product, then discards the glass bottle.
11. Glass bottles, along with other solid waste items, are collectedand transported to a landfill.(1 transportation energy/1 pollution)
12. Glass bottles and other solid waste items are buried in a landfill.(1 natural resource/1 energy input/1 pollution)
Making Glass Bottles from Natural Resources

Windows on Waste - THIS IS YOUR LIFECYCLE! IV Help Contents Back
▼
▼
133©Ohio Department of Natural Resources Help Contents Back
▼
▼
133
START SECOND ROUND OF GAME HERE10. Customer buys and uses product, then recycles the glass bottle.
11 & 12 not included as the need for landfill space is saved.
13. Glass bottles and jars, along with other recyclables, are collected and transportedto a recycling center or municipal recovery facility (MRF). (1 transportation energy/1 pollution)
14. At the recycling center, glass bottles and jars are separated by color from otherrecyclables– clear, green and amber.(2 energy input/ 2 pollution)
15. The recycling center ships the cullet to a glass plant.(1 transportation energy/1 pollution)
16. At the plant, the color-separated glass is crushed into small pieces called cullet.This cullet is mixed with sand, soda ash and limestone (replacing some of the sand,soda ash and limestone) and melted in a furnace to form gobs that are droppedinto molds to make glass bottles.(4 natural resource/2 energy input/1 pollution)
Prior to Step 16 the following may be inferred:
1. Less sand, soda ash and limestone was needed.
2. Less sand, soda ash and limestone was mined.
3. Less sand, soda ash and limestone was transported to a glass plant.
4. At the glass plant, less sand, soda ash and limestone was mixed together and melt-ed in a furnace to form gobs that are dropped into molds to make glass bottles.
NOW: GO TO STEP 5 AND FINISH WITH STEP 9.5. Product: glass bottles.
6. Glass bottles are delivered to a beverage plant.(1 transportation energy/1 pollution)
7. Glass bottles are filled with beverage.(1 energy input/1 pollution)
8. Product: glass bottles filled with beverage.
9. Filled glass bottles are delivered to a store.(1 energy input/1 pollution)
Making Glass Bottlesfrom Recycled Materials

Windows on Waste - THIS IS YOUR LIFECYCLE! IV Help Contents Back
▼
▼
134©Ohio Department of Natural Resources Help Contents Back
▼
▼
134
1. Trees are needed.(2 natural resource)
2. Trees are harvested.(1 energy input/1 pollution)
3. Trees are transported to a paper mill.(1 transportation energy/1 pollution)
4. At the paper mill, trees are cut into wood chips. The wood chips are soakedin chemicals to make pulp, which is stretched out into large sheets ofpaper. The large sheets of paper are cut into large rolls of paper.(2 energy input/ 3 pollution)
5. Product: large rolls of paper.
6. Large rolls of paper are delivered to a newspaper printing facility.(1 transportation energy/1 pollution)
7. Rolls of paper are printed on and cut into sheets to make a newspaper.(1 energy input/1 pollution)
8. Product: newspaper.
9. Newspapers are delivered to a store or distributor.(1 transportation energy/1 pollution)
10. Customer buys and uses the newspaper, then discards it.
11. Old newspapers, along with other solid waste items, are collected andtransported to a landfill.(1 transportation energy/1 pollution)
12. Old newspaper and other solid waste items are buried in a landfill.(1 natural resource/1 energy input/1 pollution)
Making Newspaper from Natural Resources

Windows on Waste - THIS IS YOUR LIFECYCLE! IV Help Contents Back
▼
▼
135©Ohio Department of Natural Resources Help Contents Back
▼
▼
135
START SECOND ROUND OF GAME HERE10. Customer buys and uses newspaper, then recycles it.
11 & 12 not included as the need for landfill space is saved.
13. Old newspapers, along with other recyclables, are collected and transported to arecycling center or municipal recovery facility (MRF).(1 transportation energy/1 pollution)
14. Old newspapers are separated from other recyclables and baled.(1 energy input/1 pollution)
15. The recycling center ships the newspaper bales to a paper mill.(1 transportation energy/1 pollution)
16. Waste paper is pulped and added to wood chips – replacing some wood chips/trees– and made into large rolls of paper.(2 natural resources/1 energy input/1 pollution)
Prior to Step 16, the following may be inferred:
1. Fewer trees, a renewable natural resource, were needed.
2. Fewer trees were harvested.
3. Fewer trees were transported to a paper mill.
4. At the paper mill, fewer trees were cut into wood chips. The wood chips were soakedin chemicals to make a pulp, which was stretched out into large sheets of paper. The large sheets of paper were cut into large rolls of paper.
NOW: GO TO STEP 5 AND FINISH WITH STEP 9.5. Product: large rolls of paper.
6. Large rolls of paper are delivered to a newspaper printing facility.(1 transportation energy/1 pollution)
7. Rolls of paper are printed on and cut into sheets to make a newspaper.(1 energy input/1 pollution)
8. Product: newspaper.
9. Newspapers are delivered to a store or distributor.(1 transportation energy/1 pollution)
Making Newspaperfrom Recycled Materials

Windows on Waste - THIS IS YOUR LIFECYCLE! IV Help Contents Back
▼
▼
136©Ohio Department of Natural Resources Help Contents Back
▼
▼
136
1. Petroleum or natural gas is needed.(2 natural resource)
2. Petroleum or natural gas is extracted from the ground.(1 energy input/1 pollution)
3. Petroleum or natural gas is transported to a plastics factory.(1 transportation energy/1 pollution)
4. At the plastics factory, petroleum or natural gas is heated andchanged into polymers or plastic resins. The resins are melted andblown through molds that turn the resins into plastic bottles.(4 energy input/2 pollution)
5. Product: plastic bottles.
6. Plastic bottles are shipped to a detergent factory.(1 transportation energy/1 pollution)
7. At the factory, plastic bottles are filled with liquid detergent.(1 energy input/1 pollution)
8. Product: plastic bottles filled with detergent.
9. Filled plastic bottles are delivered to a store.(1 transportation energy/1 pollution)
10. Customer buys and uses the product, then discards the bottle.
11. Plastic bottles, along with other solid waste items, are collectedand transported to a landfill.(1 transportation energy/1 pollution)
12. Plastic bottles and other solid waste items are buried in a landfill.(1 natural resource/1 energy input/1 pollution)
Making Plastic Detergent Bottlesfrom Natural Resources

Windows on Waste - THIS IS YOUR LIFECYCLE! IV Help Contents Back
▼
▼
137©Ohio Department of Natural Resources Help Contents Back
▼
▼
137
START SECOND ROUND OF GAME HERE10. Customer buys and uses the product, then recycles the bottle.
11 & 12 not included as the need for landfill space is reduced.
13. Plastic bottles, along with other solid waste items, are collected and transport-ed to a recycling center or municipal recovery facility (MRF).(1 transportation energy/1 pollution)
14. Plastic bottles are separated from other recyclables, compacted and baled.(1 energy input/1 pollution)
15. Plastic bottles are transported to a plastic resin producer where the bottles arechopped, washed and converted into flakes or pellets.(1 transportation energy/1 energy input/2 pollution)
16. The flakes or pellets (which replace petroleum or natural gas) are melted andblown through a mold and removed in the shape of plastic bottles.(1 natural resource/1 energy input/1 pollution)
Prior to Step 16, the following may be inferred:
1. Less petroleum or natural gas was needed.
2. Less petroleum or natural gas was extracted from the ground.
3. Less petroleum or natural gas was transported to a plastics factory.
4. At the plastics factory, less petroleum or natural gas was heated and changedinto polymers or plastic resins. The resins were melted and blown through moldsthat turned the resins into plastic bottles.
NOW: GO TO STEP 5 AND FINISH WITH STEP 9.5. Product: plastic bottle.
6. Plastic bottles are shipped to a detergent factory.(1 transportation energy/1 pollution)
7. At the factory, plastic bottles are filled with liquid detergent.(1 energy input/1 pollution)
8. Product: plastic bottles filled with detergent.
9. Filled plastic bottles are delivered to a store.(1 transportation energy/1 pollution)
Making Plastic Detergent Bottlesfrom Recycled Materials

Windows on Waste - THIS IS YOUR LIFECYCLE! IV Help Contents Back
▼
▼
138©Ohio Department of Natural Resources Help Contents Back
▼
▼
138
1. Iron ore, coal and limestone are needed.(5 natural resource)
2. Iron ore, coal and limestone are mined.(2 energy input/2 pollution)
3. Iron ore, coal and limestone are transported to a steel mill.(1 transportation energy/1 pollution)
4. Iron ore, coal, limestone and other alloys are melted in a furnace tomake steel.(2 energy input/ 3 pollution)
5. Product: large sheets of steel.
6. Sheets of steel are transported to a manufacturing plant.(1 transportation energy/1 pollution)
7. The sheets of steel are made into cans and filled with vegetables.(1 energy input/1 pollution)
8. Product: steel cans filled with vegetables.
9. Filled steel cans are delivered to a store.(1 transportation energy/1 pollution)
10. Customer buys and uses product, then discards the can.
11. Steel products, along with other solid waste items, are collectedand transported to a landfill.(1 transportation energy/1 pollution)
12. Steel cans and other solid waste items are buried in a landfill.(1 natural resource/1 energy input/1 pollution)
Making Steel Cans from Natural Resources
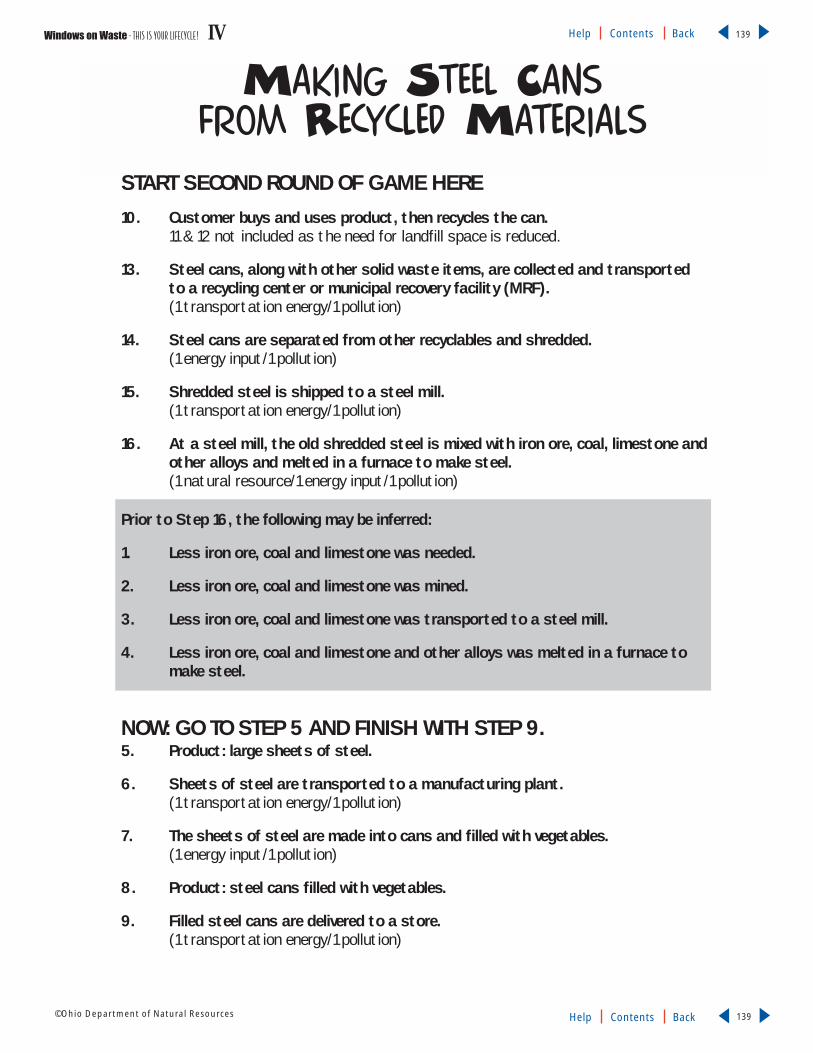
Windows on Waste - THIS IS YOUR LIFECYCLE! IV Help Contents Back
▼
▼
139©Ohio Department of Natural Resources Help Contents Back
▼
▼
139
START SECOND ROUND OF GAME HERE10. Customer buys and uses product, then recycles the can.
11 & 12 not included as the need for landfill space is reduced.
13. Steel cans, along with other solid waste items, are collected and transportedto a recycling center or municipal recovery facility (MRF).(1 transportation energy/1 pollution)
14. Steel cans are separated from other recyclables and shredded.(1 energy input/1 pollution)
15. Shredded steel is shipped to a steel mill.(1 transportation energy/1 pollution)
16. At a steel mill, the old shredded steel is mixed with iron ore, coal, limestone andother alloys and melted in a furnace to make steel.(1 natural resource/1 energy input/1 pollution)
Prior to Step 16, the following may be inferred:
1. Less iron ore, coal and limestone was needed.
2. Less iron ore, coal and limestone was mined.
3. Less iron ore, coal and limestone was transported to a steel mill.
4. Less iron ore, coal and limestone and other alloys was melted in a furnace tomake steel.
NOW: GO TO STEP 5 AND FINISH WITH STEP 9.5. Product: large sheets of steel.
6. Sheets of steel are transported to a manufacturing plant.(1 transportation energy/1 pollution)
7. The sheets of steel are made into cans and filled with vegetables.(1 energy input/1 pollution)
8. Product: steel cans filled with vegetables.
9. Filled steel cans are delivered to a store.(1 transportation energy/1 pollution)
Making Steel Cans from Recycled Materials

Student Handout ✐Windows on Waste - THIS IS YOUR LIFECYCLE! IV Help Contents Back
▼
▼
140©Ohio Department of Natural Resources Help Contents Back
▼
▼
140
Making from Natural Resources Bar Chart
12
10
8
6
4
2
0Resources Energy Pollution

Student Handout ✐Windows on Waste - THIS IS YOUR LIFECYCLE! IV Help Contents Back
▼
▼
141©Ohio Department of Natural Resources Help Contents Back
▼
▼
141
Makingfrom Recycled Materials Bar Chart
12
10
8
6
4
2
0Resources Energy Pollution

Student Handout ✐Windows on Waste - THIS IS YOUR LIFECYCLE! IV Help Contents Back
▼
▼
142©Ohio Department of Natural Resources Help Contents Back
▼
▼
142
Lifecycle Hopscotch Post-TestDirections: Put the letter of the correct response in the space next to the number.
_______1. What happens during a lifecycle (manufacturing process)?
a. natural resources are consumed
b. pollution is emitted
c. energy is required
d. all of the above
_______ 2. When a product is made using raw materials instead of recycled materials,which one of the following statements is generally true?
a. less energy is required
b. more natural resources are used
c. less natural resources are used
d. less pollution is emitted
_______ 3. When a product is made using recycled materials instead of raw materials,which one of the following statements is generally true?
a. more energy is required
b. more natural resources are used
c. more pollution is emitted
d. less energy is required
_______ 4. In the lifecycle of a product, when is pollution always emitted?
a. process
b. natural resources
c. output
d. none of the above

Windows on Waste - NATURE ’ S WAY WITH WASTE V Help Contents Back
▼
▼
143©Ohio Department of Natural Resources Help Contents Back
▼
▼
143

Environmental StudiesLearning Concept
All life on Earth depends on anefficient recycling system innature – a complex system of
nutrient and energy flows. Nutrients,in food and water, are passed throughfood chains from plants to herbivores tocarnivores (producers to consumers)and finally to decomposers who returnnutrients to the soil to be used byplants again.
The flow of nutrients through anecosystem occurs as energy is trans-formed from one state to another.Green plants chemically convert sun-light into food energy for animals, andanimals convert this food-chemicalenergy into kinetic energy for move-ment and thermal energy for warmth.
Natural ecosystems efficiently recy-cle nature’s solid waste (dead plantsand animal matter) through biochemi-cal cycles that rely on decomposers tochange organic matter (once living)into nutrients (non-living) that aredeposited in soil to be absorbed andused by green plants again. Organicmatter from plants affects soil textureand nutrient composition.
Nature’s recycling process is similarto the composting of organic solidwaste material. A large portion of solidwaste is organic or biodegradable andcan be composted. Composted materi-als include food waste and yard waste.Composting saves land space andenhances soil quality. Artificial solidwaste, such as inorganic packagingmaterials, will not efficiently biode-grade and must either be landfilled orrecycled.
Vocabularyartificial – not genuine or real, unnatural; made by human skill
bacteria – any of the numerous microscopic, spherical, rod-shaped or spiral organisms that play a role in the fixing of atmospheric nitrogen
biodegradation – the process of decaying elements or cells of dead plants and animals into simpler substances that are absorbed by the environment
compost – a nutrient-rich humus; a mixture of various decaying organic substances,such as dead leaves, manure, etc. used for fertilizing land
composting – the natural decomposition of organic waste materials through theaction of microorganisms that results in compost
cycles – any complete round or series of occurrences that repeats or is repeated
decomposer – an organism, usually a bacterium or fungus, that breaks down thecells of dead plants or animals into smaller substances
decomposition – the breakdown of organic matter by microbial action
degrade – the breaking down of organic matter
ecosystem – a complex system made up of the interactions between living and non-living components
energy – the capacity to perform work, includes the activities of plants, animals andhuman beings
energy transformations – the act of transforming energy from one state to another
food chain – a series of organisms interrelated in their feeding habits, the smallestbeing fed upon by a larger being
food waste – with regard to compost, wastes such as fruits, rinds, egg shells, coffeegrounds; nothing that would be considered remains of another animal
fungi – any of the numerous thallophytes characterized by a lack of chlorophyll andsubsist upon organic matter (i.e. mushrooms, molds, mildews, rusts and smuts)
humus – the dark organic material in soils, produced by decomposition of vegetableor animal matter, and essential to the fertility of the earth
inorganic – substance in which carbon-to-carbon bonds are absent; mineral matter
municipal solid waste (MSW) – includes garbage and trash, that originates inhouseholds, commercial establishments, or construction and demolition sites
natural – existing in or formed by nature (opposed to artificial)
nutrients – a substance taken by a cell from its environment and used in catabolicor anabolic reactions
organic – once living matter
packaging (natural and artificial) – a container or wrap in which something maybe packed to preserve matter
recycling – the act of collecting and separating materials from the waste stream andreusing them as raw materials in manufacturing processes
scavengers – any of various animals or organisms feeding on dead organic matter
soil – a mixture of mineral and organic material and decomposer organisms (main-ly bacteria and fungi)
vermicomposting – the process of using earthworms and microorganisms to con-vert organic waste into black, earth-smelling nutrient-rich humus
waste – crop residues; animal dung
NATURE’S WAY WITH WASTEWindows on Waste - NATURE ’ S WAY WITH WASTE V Help Contents Back
▼
▼
144©Ohio Department of Natural Resources Help Contents Back
▼
▼
144

Windows on Waste - NATURE ’ S WAY WITH WASTE V Help Contents Back
▼
▼
145©Ohio Department of Natural Resources Help Contents Back
▼
▼
145
1
2
Activity 1: The Great CycleDescriptionStudents read a story about nature’s recycling system and interpret vocabulary words.Using visual representations of recycling, they make inferences about energy andnutrient flows in natural ecosystems. Students analyze composting as a beneficialhuman activity.
Ohio Proficiency Test Learning OutcomesGrade 4, Reading #14 – Identify and interpret vocabulary (words, phrases or expressions)critical to understanding the text.
Grade 4, Reading #17 – Infer from the text.
Grade 4, Reading #18 – Respond to the text.
Grade 4, Science #5 – Analyze a series of events and/or simple daily or seasonal cycles andpredict the next likely occurrence in the sequence.
Grade 4, Science #14 – Identify and/or describe the relationship between human activityand the environment.
Grade 4, Science #16 – Demonstrate an understanding of the basic needs of living things.
Grade 4, Science #18 – Distinguish between living and non-living things and provide jus-tification for these distinctions.
Grade 6, Reading #11 – Summarize the text.
Grade 6, Reading #12 – Infer from the text.
Grade 6, Reading #13 – Respond to the text.
Grade 6, Science #4 – Identify the positive and/or negative impacts of technology onhuman activity.
Grade 6, Science #14 – Trace the transmission of energy in a small, simple ecosystemand/or identify the roles of organisms in the energy movement in an ecosystem.
Grade 6, Science #17 – Analyze the impacts of human activity on the ecosystems of theEarth.
Activity 2: Bio-What? That’s Biodegradation!DescriptionStudents analyze packaging as a source of nutrient preservation to meet the culturaland energy needs of humans. They compare artificial packaging with nature’s andmake inferences about the rates of decomposition of various solid waste materialsand the value of composting as a waste reduction process. Students perform a simpledecomposition experiment using organic and inorganic matter in plastic bags.
Overview - NATURE’S WAY WITH WASTE
Summary
This lesson consists of five
activities. Although each
activity may be conduct-
ed separately, it will be helpful
for students to conduct Activity 4
before using Activity 5.

Windows on Waste - NATURE ’ S WAY WITH WASTE V Help Contents Back
▼
▼
146©Ohio Department of Natural Resources Help Contents Back
▼
▼
146
3
Ohio Proficiency Test Learning OutcomesGrade 4, Science #4 – Use a simple key to distinguish between objects.
Grade 4, Science #14 – Identify and/or describe the relationship between human activityand the environment.
Grade 4, Science #18 – Distinguish between living and non-living things and provide jus-tification for these distinctions.
Grade 4, Writing – Given an assigned activity direction intended to elicit modes of writ-ing, the learner will use the writing process to make the intended clear, as evidenced by:(#1) a response that stays on the topic; (#2) the use of detail to support the topic; and (#7)a response that shows an awareness of word usage – vocabulary, homonyms and words incontext.
Grade 6, Science #1 – Use a simple key to classify objects, organisms and/or phenomena.
Grade 6, Science #3 – Make inferences from observations of phenomena and/or events.
Activity 3: Compost CrittersDescriptionStudents observe the types of living organisms in a compost pile and describe the roleof scavengers and decomposers in nature’s recycling and sanitation process. Theyanalyze the handout, Food Web of the Compost Pile, and identify the active decom-posers and scavengers in actual compost with magnifying glasses, hand lenses ormicroscopes.
Ohio Proficiency Test Learning OutcomesGrade 4, Mathematics #17 – Apply the use of tools to measure lengths, using centimetersand inches including recognizing the positions of whole numbers and fractions on anumber line.
Grade 4, Science #3 – Identify and compare the mass, dimensions and volume of familiarobjects in standard and non-standard units.
Grade 4, Science #4 – Use a simple key to distinguish between objects.
Grade 4, Science #6 – Evaluate a simple procedure to carry out an exploration.
Grade 4, Science #7 – Identify and/or discuss the selection of resources and tools used forexploring scientific phenomena.
Grade 4, Science #9 – Demonstrate an understanding of safe use of materials and/ordevices in a science activity.
Grade 4, Science #16 – Demonstrate an understanding of the basic needs of living things.
Grade 4, Science #17 – Identify ways in which organisms react to changing environments.
Grade 6, Science #1 – Use a simple key to classify objects, organisms and/or phenomena.
Grade 6, Science #2 – Identify the potential hazards and/or precautions involved in scien-tific investigations.
Grade 6, Science #3 – Make inferences from observations of phenomena and/or events.
Grade 6, Science #14 – Trace the transmission of energy in a small, simple ecosystemand/or identify the roles of organisms in the energy movement in an ecosystem.
Grade 6, Science #15 – Compare and/or contrast the diverse ways living things meet theirneeds.

Windows on Waste - NATURE ’ S WAY WITH WASTE V Help Contents Back
▼
▼
147©Ohio Department of Natural Resources Help Contents Back
▼
▼
147
4
5
Activity 4: Meet the YIMBYsDescriptionStudents cooperate as a group to role-play the components of a compost pile.Throughout this activity, students apply knowledge by using such skills as differentia-tion, categorization, synthesis, explanation and evaluation.
Ohio Proficiency Test Learning OutcomesGrade 4, Science #4 – Use a simple key to distinguish between objects.
Grade 4, Science #16 – Demonstrate an understanding of the basic needs of living things.
Grade 4, Science #18 – Distinguish between living and non-living things and provide jus-tification for these distinctions.
Grade 6, Science #1 – Use a simple key to classify objects, organisms and/or phenomena.
Grade 6, Science #3 – Make inferences from observations of phenomena and/or events.
Activity 5: Compost JarsDescriptionStudents observe and compare various soil samples and record data. They manipulateequipment to make individual compost jars. They compare various types of soils tothe compost soil. Students interpret data to infer the value of compost. Using anexperimental approach will enhance observing, hypothesizing and data interpretationskills.
Ohio Proficiency Test Learning OutcomesGrade 4, Science #2 – Select instruments to make observations of an event, object ororganism.
Grade 4, Science #6 – Evaluate a simple procedure to carry out an exploration.
Grade 4, Science #7 – Identify and/or discuss the selection of resources and tools used forexploring scientific phenomena.
Grade 4, Science #9 – Demonstrate an understanding of safe use of materials and/ordevices in a science activity.
Grade 6, Science #2 – Identify the potential hazards and/or precautions involved in scien-tific investigations.
Grade 6, Science #3 – Make inferences from observations of phenomena and/or events.
Grade 6, Science #12 – Identify characteristics and/or patterns in rocks and soil.

Windows on Waste - NATURE ’ S WAY WITH WASTE V Help Contents Back
▼
▼
148©Ohio Department of Natural Resources Help Contents Back
▼
▼
148
Background Information
National statistics indi-cate that leaves, brushand other organicwastes account formore than 30 percent
of our municipal solid waste stream(MSW). Yard waste alone is the sec-ond largest component of the wastestream (paper and paper products isthe largest component). The dis-posal of these materials isbecoming increasingly diffi-cult for communities acrossthe state, country andaround the world. Strictenvironmental regulationson landfills and incineratorsincrease the costs of disposal,so communities continue tosearch for environmentally-sound solid waste alternatives,such as recycling and compost-ing. Benefits of recycling organicmaterials include: conserving energyand natural resources, improvingmuch-needed topsoil and reducinglandfill space.
Nature recycles its solid waste(dead plant and animal matter)through biochemical cycles.Decomposers change once-livingorganic matter into non-living nutri-ents that are deposited in the soil tobe absorbed and used again and againby green plants. Nature’s recyclingprocess resembles the composting oforganic solid waste material. A largeportion of solid waste, such as foodwaste and yard waste, can be composted because it is organic andwill decompose.
All life on Earth depends uponnature’s efficient recycling system,which involves a complex system ofnutrients and flows of energy.Nutrients in food and water arepassed through food chains fromplants to herbivores to carnivores –producers to consumers – and finallyto decomposers who return nutrients
to the soil to be used again by plants.Nutrients flow through an ecosystemas energy is transformed from onestate to another. Green plants chemi-cally convert sunlight into food ener-gy for animals, and animals convertthis chemical energy into kinetic ener-gy for movement and thermal energy
for warmth.Decomposers are part
of every food chain.They include different
types of microscopicbacteria and variousfungi (molds, mush-rooms, mildews).
Although decomposers arefound everywhere, they are most
plentiful in soil. A single tablespoon ofgood topsoil may contain up to fourbillion bacteria. Bacteria are essentialto life because they renew nutrients tothe soil as they break down waste. Soilrich in nutrients from the breakdownof organic materials by fungi and bac-teria is called humus. The humus leftbehind by bacteria also gives soil thenecessary texture to retain propermoisture.
Decomposers are not the onlyorganisms breaking down waste anddead matter. In fact, sometimes beforedecomposers can do their work, wastematter must be broken down by larg-er organisms called scavengers.Scavengers include insects (ants, bee-tles, termites), aquatic creatures (fish,snails), birds (sea gulls, crows, vul-tures), and mammals (raccoons, rats,bears). Large scavengers (vultures,rats, hyenas) work on bulk waste, suchas carcasses. Small scavengers (insects,earthworms, centipedes, slugs, snails)also work on bulk waste and smallerbits of decaying plant and animalmatter, breaking it down into tinypieces for the decomposers.
Scavengers prepare food fordecomposers in another way. Theyconsume living or dead matter and
metabolize it, leaving behind excre-ment or dung on which bacteria feed.As the bacteria feed on waste, theyleave behind chemical compounds,which are nutrients that green plantscan absorb. Together, scavengers anddecomposers act as nature’s sanitationcrew!
Basic CompostingCompost is a mixture of variousdecaying organic substances that addtexture and nutrients in the form ofhumus. Nutrients are needed for goodplant growth. Texture allows the soilto retain nutrients, moisture and oxy-gen over a longer period of time.
Nature has its own method ofproducing compost. In natural sur-roundings, leaves and branches fall tothe ground and form a rich, moistlayer of mulch that protects the rootsof plants and provides a home fornature’s most fundamental recyclers:the insects, microorganisms and bac-teria. Through this biological process,soil-enriching compost, carbon diox-ide, heat and water are all produced.See the Flow Chart for the CompostingProcess on p. V-9.
Composting is an age-old recipe.Ancient Romans learned they couldcreate rich and healthy soil by plowingcomposted animal manure and vege-tation into their agricultural fields.Two early-American farming presi-dents, George Washington andThomas Jefferson, believed compost-ing made their soils healthier.
By properly managing air andmoisture, the composting process cantransform large quantities of organicmatter into humus (compost) over arelatively short period of time. A goodsmall-scale example is a backyardcompost pile that includes both car-bon-rich and nitrogen-rich materials.The carbon-rich components of acompost pile are often referred to asthe “brown” material. Carbon-rich

Windows on Waste - NATURE ’ S WAY WITH WASTE V Help Contents Back
▼
▼
149©Ohio Department of Natural Resources Help Contents Back
▼
▼
149
materials include woody materials,dead leaves and dried, brown grass orstraw. Nitrogen-rich components arethe “green” materials and includefresh grass clippings, nuts, fruit andvegetable remains, and livestockmanure.
Composters can mix approxi-mately 75 percent “brown” organicmaterials with approximately 25 per-cent “green” organic materials (by vol-ume), or a 3:1 ratio of brown to greenmaterials. These ingredients, with theaddition of water, oxygen, heat andcomposter organisms (both micro-scopic and macroscopic), willdegrade and become compost.
Five Essential IngredientsAfter a compost pile is built, naturedoes most of the work. The homecomposter only needs to gather theraw materials and bring them togeth-er in a manner that facilitates theprocess. The composting processrequires five ingredients: organic matter, nitrogen, bacteria, water andoxygen.
Organic matter includes leaves,grass clippings, garden plants, weeds,nuts, straw, animal manure and veg-etable trimmings. A variety of materi-als is desirable and a ratio of threeparts fibrous matter (leaves andfibrous matter) to one part nitroge-nous matter (animal manure, not petwaste) works best.
Nitrogen is another key elementin the composting process. In a com-post pile, leaves and fibrous materials
usually require the addition of nitro-gen. Fertilizers, such as 10-10-10, 5-10-5, or blood meal, cottonseed orsoybean meal, can be used for thispurpose.
Bacteria and fungi are largelyresponsible for the compostingprocess. Since beneficial bacteria,fungi and other decomposers live insoil and vegetable matter, their pres-ence is assured.
Water is essential. The organismsthat speed decomposition need awarm, moist environment. Somematerials, such as fresh grass clippingsand food waste, already have a highwater content and will add moistureto the pile. If the compost is dry andflaky, water can be added with a pitch-er or garden hose. The pile should beabout as wet as a wrung-out sponge.If the pile is waterlogged, the bacteriaand other beneficial organisms willnot get enough air.
Lack of moisture will delay thecomposting process. Since leaves usu-ally contain little moisture, a pile withlarge quantities of leaves usuallyrequires the addition of water. Toomuch wet material will cool the pileand can cause organisms to becomedormant and inactive. Generally, theinitial moisture will stay adequate byadding grass clippings, vegetable trim-mings, weeds and/or garden plants.
Oxygen is vital because compost-ing is essentially an aerobic (in thepresence of air) process. Bacteriarequire oxygen to live and multiply. Ifthe air supply is cut off, anaerobicbacteria will take over and unpleasantodors and poor quality compost mayresult. The pile should be turnedapproximately every four or five daysand when new material is added.
If your compost pile containsmostly leaves, consider adding someground limestone to neutralize theacidity of the finished product.Compost made from a variety ofmaterials tends to be neutral and
therefore does not require lime.The following items should NOT
be composted: meat scraps, fishscraps, bones, dairy products, peanutbutter, cooking oil, diseased vegeta-tion, animal fats, household petwastes, plywood or pressure-treatedwood, commercial potting soil andanything inorganic that will notbiodegrade (e.g. plastics). Theseitems can attract pests, generate foulodors, or contaminate or infect thecompost. Most food waste (exceptthose listed above) can be included inthe pile. To avoid attracting flies, con-trol odors and aid the decompositionprocess, bury food scraps 8 inches to 1foot beneath the surface of the pile.Food remains can also be coveredwith leaves, straw or sawdust.
VermicompostingEarthworms enrich the growingmedium, soil. Vermicomposting(worm bin composting) has become apopular way to recycle most kitchenfood waste. Worm bins can be keptinside, do not need much materialand do not create odors. In three tofour months, the finished vermicom-post (which is twice as rich in nutri-ents as regular compost) can be usedto start seed, transplant seedlings, puton flower or vegetable beds, or usedaround trees and shrubs.
Worms play a major role inbreaking down plant matter.Earthworms eat fallen leaves andother plant parts. Their droppings,called “castings,” fertilize the soil. Asworms tunnel into the earth, theymove leaves and other organic matterdownward and bring deeper soil tothe surface. This tunneling and mix-ing aerates the soil so that roots andwater penetrate more easily. Earth-worms and other decomposers assistthe larger and smaller scavengers inkeeping our Earth free of nature’s litter.

Windows on Waste - NATURE ’ S WAY WITH WASTE V Help Contents Back
▼
▼
150©Ohio Department of Natural Resources Help Contents Back
▼
▼
150
Some earthworm species live inleaf litter, while others dwell severalmeters below the soil surface. The bestworms to use are red worms. Redworms consume a lot of organic mat-ter, survive well in captivity andreproduce quickly. Red worms are notthe same worms found in garden soil,but can be found in garden, leaf andcompost piles, or manure pilesaround stables and barns. Red wormscan be bought at bait shops. If redworms cannot be obtained locally, seethe Bibliography section.
Compost BinsAlthough many people prefer to usean enclosure or container for com-posting, bins are not essential to theprocess, and composting can occur inopen piles. The choice of a bin oropen pile is usually based on aestheticconsiderations. Bins can be made oflogs or poles laid log-cabin fashion;cinder blocks laid without mortar andwith air spaces between them; snowfence or chicken wire supported byupright posts; a steel barrel with thebottom removed and holes punchedin the sides; or a variety of other ways.Also, compost bins may be purchasedat retail stores. All bins should have aneasy opening to turn and retrieve thecompost.
Composting on a Large ScaleLarge-scale municipal compostinguses the same principles of organicdecomposition. Facilities can processthousands of tons of organic materialeach year. Composting facilities acceptmaterials, such as yard trimmings,food scraps, biosolids, wood shavingsand soiled paper. After processing(shredding, turning and mixing),materials are turned into compost ineight to 24 weeks. There are morethan 3,000 composting facilitiesaround the country, processing tons
of organic material that would other-wise be sent to landfills.
Is Composting Recycling?According to the United StatesEnvironmental Protection Agency(U.S. EPA), composting is recyclingand an essential tool for states reach-ing recycling goals. Today, more than25 states consider yard waste com-posting as recycling and 15 currentlycount solid waste composting in theirstate recycling goals. Adding compost-ing to traditional recycling methodscan divert as much as 70 percent ofthe waste stream to beneficial userather than disposal.
Bibliography and AdditionalResourcesStudent Resources
Books
Compost Critters, by Bianca Lavies,New York: Dutton Children’s Books,1993.
The Magic School Bus Meets The RotSquad, New York: ScholasticProductions, 1995.
Worms Eat My Garbage, by MaryAppelhof, Kalamazoo, Michigan:Flower Press, 1993.
Compost! Growing Gardens From YourGarbage, by Linda Glaser,Connecticut: Millbrook Press, 1996.
Lots of Rot, by Vickie Cobb, New York:Harper Collins, 1991.
Squirmy, Wormy Composters, byBonnie Kalman and Janine Schaub,New York: Crabtree PublishingCompany, 1992.
Composting Matters, EHMI(Environmental HazardsManagement Institute), 1995,(603) 868-1496.
Home Composting Wheel, EHMI,1994.
Videos
Biodiversity and Garbage, Bill Nye TheScience Guy, Disney EducationalProductions, 1995.
21st Century Home Composting. TheEarth Machine, Norseman Plastics,1992.
The Complete Home Composting VideoGuide With Howard Stenn, VernalProductions, 1993.
Pollution Solutions, Bill Nye TheScience Guy, Disney EducationalProductions, 1997.
Wormania, Mary Appelhof,Flowerfield Enterprises, 1995.
Educator Information
Books
Backyard Composting, Your CompleteGuide to Recycling Yard Clippings, 9thed., by Harmonious Technologies,Ojai, California: Harmonious Press,1992, (707) 823-1999.
Bottle Biology, Dubuque, Iowa:Kendall/Hunt Publishing Company,1993.
Let It Rot! The Gardener’s Guide ToComposting, by Stu Campbell, StoreyPublishing, 1990.
The Rodale Guide to Composting, byJerry Minnich, Emmaus,Pennsylvania: Rodale Press, 1979.
Worms Eat Our Garbage, by MaryAppelhof, Kalamazoo, Michigan:Flower Press, 1993.
Equipment
Compost Bins: HarmoniousTechnologies, P.O. Box 1716,Sebastopol, California 95473,(707) 823-1999.
RPM (Recycled Plastics Marketing),Inc., 2829 152nd Ave., N.E.,Redmond, Washington 98052,(425) 867-3200.
Background Information, continued

Windows on Waste - NATURE ’ S WAY WITH WASTE V Help Contents Back
▼
▼
151©Ohio Department of Natural Resources Help Contents Back
▼
▼
151
Containers: Norseman Plastics,2296 Kenmore Ave., Buffalo, NY14207, (800) 267-4391.
Worms: Flowerfield Enterprises,Kalamazoo, Michigan, (616) 327-0108.
VermiCo, P.O. Box 1134, Merlin,Oregon 97532, (541) 476-9626.
Willingham Worm Farms, Rt. #1, Box241, Butler, Georgia 31006.
Worm Digest, P.O. Box 544, Eugene,Oregon 97440-9998.
Internet
Ohio Environmental ProtectionAgency (Ohio EPA):www.epa.ohio.gov/
General Information:www.old growth/org/compost/
Harmonious Technologies:www.homecompost.com
RotWeb:• starbase.neosoft.com/~gregg/compost.
html• net.indra.com/~topsoil/Gr4_worm.txt
The Composting Council:[email protected]
New Jersey’s Online Yucky Site: WormWorld: www.nj.com/yucky/worm.
Mary Appelhof:www.wormwoman.com
VermiCo:www.nwin.com/vermico/email:[email protected]
RPM (Recycled Plastics Marketing):www.rrpm.com
The Master Composter:www.mastercomposter.com
Publications
Composting, July 7, 1996 and YardWaste Management Guidebook forOhio Communities, 1992, OhioEnvironmental Protection Agency(EPA), 122 S. Front St., P.O. Box 1049,Columbus, Ohio 43215.
Home, Yard, and Garden Facts andComposting: A Citizen’s Guide to theProper Disposal of Leaves and OtherOrganic Materials, Ohio StateUniversity Extension, Horticulture,2001 Fyffe Court, Columbus, Ohio43210.
FLOW CHART FOR THE COMPOSTING PROCESS
Energy
Microorganisms
CarbonDioxide WaterCompost
(Humus)
Raw MaterialsCarbon - Brown organic material
Nitrogen - Green organic material
Development of NewMicroorganisms
and Decomposers
Moisture
Heat
Oxygen

Windows on Waste - NATURE ’ S WAY WITH WASTE V Help Contents Back
▼
▼
152©Ohio Department of Natural Resources Help Contents Back
▼
▼
152
ProcedurePART A
You may pre-assess student knowl-edge of this lesson and its five activitiesby using the pre- and post-test handout,Nature’s Way With Waste, found at theend of this activity.
Give a copy of the handout, TheGreat Cycle, to each student. Ask stu-dents to scan material, paying attentionto the words in bold print. Read thestory to the class. Discuss what the titlemeans and what the main idea seems tobe. To make a comparison, describehow the forest is part of nature’s effi-cient recycling system. Also, point outthat the word “cycle” is part of the word“recycle.”
Have students identify the mean-ing of the words in bold. Each studentcan use the 3˝x 5˝ cards to write downa word or word phrase and give its defi-nition. Have students use a dictionary
to find the meaning of the words orhave them determine the meaningsfrom the story. (If time is a factor, haveeach student identify the meaning ofonly five words or word phrases.)
Discussion Questions:
● How is nature’s recycling system likecomposting?
● How is nature’s waste like and unlikehuman waste?
● What are some things that humansmake (as waste) that nature does not(paper, plastic, metal)?
● Examine students’ own place in thefood chain by asking questions suchas:● Where do you fit into the cycle of
life?● Where do you fit into nature’s
cycle? ● What is your responsibility to care
for our Earth?
4
3
2
1
The Great CycleObjectivesStudents will be able to: (a) identify cycles in nature and compare natural recycling
with human-initiated recycling; (b) describe the flow of nutrients and energy at the
bottom of the food chain and how this meets the needs of plants and animals,
including humans; and (c) identify and interpret vocabulary words critical to the
understanding and meaning of composting.
Act
ivity
1
Inquiries● What is nature’s garbage?
● How does nature’s garbagebecome part of the foodchain?
● In an ecosystem, how is ener-gy transmitted at the bottomof the food chain?
● How is nature’s recycling system like composting?
● How is composting likematerials recycling?
Content DomainReading – Listening/visual literacy
Science – General science,biology
Learning OutcomesReading, Grade 4, #14, #17, #18and Grade 6, #11, #12, #13
Science, Grade 4, #5, #14, #16,#18 and Grade 6, #4, #14, #17
DurationPart A: 45 minutes, not includ-ing pre-test
Part B: 45 minutes
continued next page
NATURE’S WAY WITH WASTE

Windows on Waste - NATURE ’ S WAY WITH WASTE V Help Contents Back
▼
▼
153©Ohio Department of Natural Resources Help Contents Back
▼
▼
153
Ask how many of the studentsknow what compost is and if theyhave a compost pile. Are there anyproblems with the compost pile?(There is a right way to make com-post and that will be revealed inActivity 4, Meet the YIMBYs.)
Have students keep their 3˝x 5˝vocabulary cards to use for furtherassessment.
ProcedurePART B
Distribute to each student a copyof the handout, Cycles. Have studentscomplete the handout. Be sure to havestudents look at the pictures and see thedirection of the arrows.
Organize students into four or sixgroups to work cooperatively to com-pare and complete the answers (about10 minutes).
Use the transparency, Cycles, to dis-cuss the groups’ answers. Discuss thefollowing:
● What is nature’s garbage? (as shownin the pictures)
● How does nature’s garbage become apart of the food chain?
● Why is it so important that nature’sgarbage be recycled?
● What part does composting play inthe cycle of life? In an ecosystem?
● How is energy transmitted? Explainthe flow of nutrients and how thesemeet the needs of plants and animals.
Discuss Question 7 on the hand-out, Cycles. Discuss what is organicmaterial and inorganic material, giv-ing examples of each (dead leaves andhair from a haircut are organic and acomputer and a rock are inorganic).Have students explain how systems
for inorganic materials differ fromrecycling systems for organic materials.
Ask students how human activitycan affect nature’s recycling systemand the environment.
AssessmentSeveral forms are available.
Method A: Give students the pre- andpost-test handout.
ANSWERS to Nature’s Way With Waste:1. d, 2. c, 3. b, 4. c, 5. d, 6. a, 7. b, 8. b
Method B: Have students draw anothertype of cycle in nature that includes thetransmission of energy (food energy)and label it.
Method C: Give a vocabulary test onthe words and concepts from the 3˝x 5˝cards.
ExtensionWrite a story about what life in a nearbyforest or woods would be like if therewere no natural decomposers or scavengers.
5
4
3
2
1
6
5
Materials3˝x 5˝ cards or blank slips ofpaper (24 for each student);transparency of the handout,Cycles.
Handouts● Nature’s Way With Waste
(pre- and post-test)
● The Great Cycle
● Cycles
NATURE’S WAY WITH WASTE

Windows on Waste - NATURE ’ S WAY WITH WASTE V Help Contents Back
▼
▼
154©Ohio Department of Natural Resources Help Contents Back
▼
▼
154
PRE- AND POST-TEST
Nature’s Way With Waste
Student Handout ✐
Directions: Circle the best answer.
Which phrase best describes compost?a. a home for decomposersb. nature’s recycling systemc. soil rich in nutrientsd. all of the above
Which does not describe a food chain?a. scavengers and decomposers working
togetherb. animals eat meat or plantsc. recycling a pop cand. flow of energy that is passed on from
plants to herbivores to carnivores todecomposers
Identify what belongs in a recycling bininstead of in a compost pile?a. leaves and grass clippingsb. glass jarc. worms d. heat
What does it mean to biodegrade?a. non-living matter b. garbage and trash that originates in
households, commercial establishmentsor construction and demolition sites
c. the cycle of decaying elements or cellsof dead plants and animals into similarsubstances that are absorbed by the environment
d. a mixture of mineral and organic materialand decomposer organisms, mainly bacteria and fungi
What helps matter to decay?a. microorganisms b. oxygen, water, heatc. open environmentd. all of the above
What will take the longest to decompose?a. inorganic matter b. organic matterc. old tree branchesd. paper
What is the largest component in ourgarbage (by weight and volume)?a. glassb. paperc. yard waste d. plastic
What will happen to a compost pile if thereis not enough water or oxygen?a. the odor will be sweet-smellingb. organisms will not survivec. materials will multiplyd. organisms will increase in number
8
7
6
5
4
3
2
1

Windows on Waste - NATURE ’ S WAY WITH WASTE V Help Contents Back
▼
▼
155©Ohio Department of Natural Resources Help Contents Back
▼
▼
155
Student Handout ✐
Earth is a beautiful place to live withlovely shades of blue, yellow, red, green and brown. Plants, insects, birds, ani-
mals, fish, reptiles and humans all live togetheron Earth.
All of these creatures are living things, fullof energy and living in harmony with nature in
their ecosystems. Eachcreature is trying to
meet its own needsfor survival. Thesource for all energyis sunlight. Greenplants change sun-
light into food ener-gy for animals, and
animals convert thisfood-chemical energy into
kinetic energy for movement and thermal ener-gy for warmth.
Everyday, the natural cycles of the seasons(fall to winter, spring to summer), days tonights, seeds to trees, and biodegradation(decomposition) to renewal happens.There are changes in all ecosystemsbecause the flow of energy continueson and on and on…in food chains.Food is a source of energy in foodchains. Food energy is passed on from plantsto herbivores (plant eaters) to carnivores (meateaters) to decomposers. Decomposers use foodenergy to change organic matter, which wasonce living, into inorganic matter, which isnon-living matter in the form of nutrients.
And with all of this beauty and energy, thereis WASTE. All living things produce waste.
Nature’s waste includes fallen leaves, treebranches, animal dung, dead plants, dead ani-mals, and grass clippings. Nature’s litter!
A large portion of nature’s waste is organicor biodegradable and therefore can be madeinto compost. Things that can be compostedinclude food waste and yard waste. Therewould just be a BIG pile of nature’s garbage onthe ground if nature’s scavengers and decom-posers did not dispose of all waste matter.
Large scavengers, such as bears, lions andraccoons chew on the skin and bones of deadanimals, leaving small piecesbehind for the smallerscavengers to eat.
Small scavengersinclude insects, such asbeetles, ants, centipedes,sow bugs and slugs. Twovery important small scav-engers are earthworms andtermites. These small scavengers get rid of waste
by recycling it! They pass it throughtheir bodies and leave it behind in theform of nutrients, which plants need togrow.
Termites help decomposers break downdead trees. Wood is hard for decomposers todigest because it contains a tough materialcalled cellulose. Cellulose in wood is easier fordecomposers to eat after termites have chewedit up or left it in the form of termite dung.
Worms are important scavengers becausethey digest soil through their bodies as theymake tunnels in the soil. They leave behind
The Great Cycle

Windows on Waste - NATURE ’ S WAY WITH WASTE V Help Contents Back
▼
▼
156©Ohio Department of Natural Resources Help Contents Back
▼
▼
156
Student Handout ✐worm dung (castings), which is rich in thenutrients plants need to grow.
Other small scavengers include aquaticcreatures, such as snails and fish, birds suchas vultures, crows and seagulls, and mam-mals, such as rats and mice. These smallscavengers also work on breaking downdecaying plant and animal matter intotiny pieces for the decomposers. As theyconsume living or dead matter and metabolize(digest) it, they, too, leave behind excrement, ordung, on which the bacteria feed. Yum, yum.
Tiny microorganisms are part of every foodchain and include different types of microscop-ic fungi (such as mushrooms, molds andmildews) and bacteria. Decomposers are foundeverywhere, but are most plentiful in soil,where they feed on very tiny pieces of wastematter. Soil is a mixture of mineral, organic
material and decomposerorganisms, mainly bacteriaand fungi. A single table-spoon of good topsoil may
contain up to four billion bac-teria.
Bacteria are essentialto life because as they die and breakdown into the soil, they are alsorenewing it with nutrients.Nutrients are the delicious “vita-mins” for plants. The roots ofplants draw them up intotheir stems or trunks togrow. Soil rich in nutrientsis called humus. Soil pro-vides nutrients, water andsupport for plants. The airtrapped in soil will provideoxygen to plant roots.
Organic matter from plants affects soil textureand composition.
As bacteria feed on waste, theyleave behind chemical elements
and compounds (carbon,oxygen, hydrogen, nitro-
gen, potassium, phosphorous, calcium and sul-fur) that are nutrients green plants can absorb.The flow of nutrients through an ecosystemhappens as energy is transformed and con-verted from one state to another.
Life on Earth depends upon nature’s recy-cling system. Together, scavengers and decom-posers act as nature’s sanitation (sewage) crew!They are garbage eaters. They recycle. They arerecyclers!
And then there is human waste – the grassclippings, yard waste, cereal boxes, empty tooth-paste tubes, soda pop cans, glass jars, deadrefrigerators, old TVs, all of the food waste(those peas and that spinach you won’t eat),and the list goes on and on and on!
Although some human waste can easilybecome part of nature’s flow of nutrients, manytypes of human waste cannot. There is a way
that we as human beings can assist nature’srecycling process. People can recycle
nutrients back into the soil. We can turnsome of our garbage into soil! We dothis by making compost. Remember,compost is the oldest form of recycling!

Windows on Waste - NATURE ’ S WAY WITH WASTE V Help Contents Back
▼
▼
157©Ohio Department of Natural Resources Help Contents Back
▼
▼
157
Student Handout ✐ CyclesDirections: Use the letters of the picture blocks to answer the following questions. Remember, some questions may have more than one answer.
What do the arrows represent? ______________________________________________________
Which blocks show the recycling of plant matter? ______________
Which blocks show the recycling of animal matter? _____________
Which block identifies compost? _______________
Put an X in each block where the decomposers and scavengers will be found.
In the blocks, circle the pictures that use food energy to produce movement and warmth.
Which block does not fit with the other three? ___________Why?__________________________
____________________________________________________________________________________
____________________________________________________________________________________
Pick a block and explain how it represents a food chain. __________________________________
____________________________________________________________________________________
____________________________________________________________________________________
What is a good title for each of these picture blocks?
A.________________________________________B._________________________________________
C. ________________________________________D _________________________________________
9
8
7
6
5
4
3
2
1
A➡
➡
➡
➡
C➡
➡
➡
➡
B➡
➡
➡➡
D➡
➡
➡
➡

Windows on Waste - NATURE ’ S WAY WITH WASTE V Help Contents Back
▼
▼
158©Ohio Department of Natural Resources Help Contents Back
▼
▼
158
Cycles – Answer Key1. energy flow
2. B, D
3. C
4. D
5. and 6. See chart below
7. A
8. answers will vary
9. see sample title above the blocks below
Recycling man-made waste
A➡
➡
➡
➡
C➡
➡
➡
➡
B➡
➡
➡
➡
D➡
➡
➡
➡
Recycling plant waste
Recycling animal waste Composting

Windows on Waste - NATURE ’ S WAY WITH WASTE V Help Contents Back
▼
▼
159©Ohio Department of Natural Resources Help Contents Back
▼
▼
159
Background InformationFood is packaged in different ways; thepackaging serves to preserve. Somepreservation methods are natural ororganic, such as nature’s own packag-ing (fruit rinds, nutshells, potato skins)and some are artificial or inorganic(cans, jars, bottles). If packaging materi-al is organic, it can be recycled naturally,by composting.
Artificial packaging, unlike naturalpackaging, does not degrade easily andmust be recycled through a technologi-cal process to be used again.Science and technology have enabledartificial packaging to preserve foodenergy longer than natural packaging.But, the chemical compounds requiredto provide this function make manyconsumer products difficult to degrade.Because inorganic packaging materialswill not efficiently decompose, they
must be recycled by an artificial systemor landfilled. Today’s modern landfillsmake it difficult for organic materials tonaturally degrade, so inorganic packag-ing has little chance of degrading whendisposed of in a landfill.
PreparationOne or two weeks prior to conductingthis activity, you should put a slice ofwhite bread, a small piece of inorganicmaterial (part of plastic bag, aluminumtab, etc.) and two drops of water into anairtight ziplock plastic bag. This willallow time for mold/fungi to begin toform on the bread to show how decom-position works. Or, have each studentindividually do this activity – provideeach student with his or her own bag.Vary the days making these bags, andshow the progression of decomposition,and/or vary the types of organic materi-
Inquiries● Why do some things take
longer to decay than others?
● How does packaging in the natural environmentcompare with artificial packaging?
● What happens to solid waste,in particular artificial packag-ing and other inorganicmaterials, when they areburied in a landfill?
Content DomainLanguage Arts – Listening,reading comprehension,writing
Science – General science,biology
Learning OutcomesScience, Grade 4, #4, #14, #18and Grade 6, #1, #3
Writing, Grade 4, #1, #2, #7
DurationPart A: 40 minutes
Part B: 30 minutes
continued next page
Bio-What? That’sBiodegradation!ObjectivesStudents will be able to: (a) classify rates of decomposition for their own garbage
items; (b) use a simple key to classify decomposition rates; (c) analyze a series of
decomposition rates and predict their occurrence in a sequence; (d) identify the rela-
tionship between human activity and the environment with regard to packaging; (e)
demonstrate an understanding of the basic needs of living things; (f) identify ways in
which organisms react to changing environments; (g) distinguish between living and
non-living things; (h) identify and interpret vocabulary words; (i) retell a story in
their own words; and (j) demonstrate an understanding of the story.
Act
ivity
2NATURE’S WAY WITH WASTE

Windows on Waste - NATURE ’ S WAY WITH WASTE V Help Contents Back
▼
▼
160©Ohio Department of Natural Resources Help Contents Back
▼
▼
160
al (banana peel, peanut, lettuce leaf,orange slice) in the bags. Make atransparency of the handout, ThisTakes How Long to Degrade? andcopies for each student.
ProcedurePART A
Have students brainstorm andmake a list of the contents of theirhome garbage can.
Divide the class into five or sixgroups. Distribute the handout, ThisTakes How Long to Degrade? Have stu-dents make inferences about whichsolid waste items might correspondwith the four classifications.
Use a transparency of the hand-out, This Takes How Long to Degrade?to review answers. Also, consider dis-cussing which items from the garbagein the school lunchroom could beadded to this chart and where theseitems could have originated.
ANSWER: Weeks – might includepieces of food items or light weightpaper; Months – might include ragsand leaves; Years – might includepainted fence posts, tree trunks;Hundreds of Years – generally includesconsumer packaging items, such ascans and bottles.
Discuss what happens whenthese items are put in a landfill. (In alandfill, it takes longer to break downbecause there is not enough oxygenfor aerobic microorganisms to live,and they are more efficient at con-suming garbage than anaerobic bacte-ria.) Identify which items would begood for composting. Discuss howcomposting reduces the amount ofsolid waste that is landfilled.
Discuss what other factors(other than microbes) help decom-pose garbage (sunlight, heat, wind,water).
Show the class the partiallydecomposed slice of bread and discusswhat happened and why. Why isn’t theinorganic item showing signs ofdecay? Relate this to the time factorand conditions necessary for decom-position to occur. Examine themicroorganisms that feed on organicmaterial. (Can they be easily seen?)
For first-hand knowledge, giveeach student a ziplock plastic bag andon different days, have students placetheir bread (or any organic item) andan inorganic item in the bag. Labeleach bag with the date of the experi-ment. Place all the bags where theywill not be disturbed and will beobserved under the same conditions(temperature, location, etc.). Have stu-dents look at the bags at a designatedtime each day to see what is happen-ing. Chart observations in a dailyjournal or format of your choice.
Discuss the idea of packaging.Does packaging exist in the naturalenvironment? Have students giveexamples of nature’s packaging (cornhusk, nut shell, banana peel, cocoon,skins on potatoes, bark on a tree).What is the purpose of nature’s pack-aging?
Compare nature’s packaging tohuman-made packaging. Give exam-ples of artificial packaging (soda popcan, plastic wrap, fast food bags).Discuss the different types of organic(paper bag) and inorganic packaging(soda pop can).
Discuss the process of decompositionthrough exposure to ultra-violet light(sunlight). The time needed todegrade photodegradable bags andsome plastics can be as short as threeto six weeks in the summer, becausethe sun is stronger. In the winter, itcan take seven to 15 weeks. In our cul-ture, technology produces a wide vari-ety and number of non-degradablematerials to meet the needs of con-
9
8
7
6
5
4
3
2
1
MaterialsOne slice of white bread;inorganic materials (pieces ofplastic, aluminum can tab,etc.); one ziplock plastic bag;two drops of water (optional -enough slices of white bread,ziplock plastic bags and waterfor entire class), The MagicSchool Bus Meets The RotSquad (book)
Handout● This Takes How Long to
Degrade?
NATURE’S WAY WITH WASTE

Windows on Waste - NATURE ’ S WAY WITH WASTE V Help Contents Back
▼
▼
161©Ohio Department of Natural Resources Help Contents Back
▼
▼
161
sumers. Discuss how science and tech-nology have enabled us to create effi-cient preservation methods, yet thechemical compounds required to pro-vide this function have made consumerproducts difficult to degrade.
When both artificial and organicmaterials are disposed in a landfill, theytake much longer to degrade than in anatural environment. Solid wastes, suchas inorganic packaging, will not effi-ciently biodegrade or decompose andmust either be landfilled or recycled byan artificial system. Discuss how builtenvironments (artificial ecosystems)might be changed to replicate the effi-cient recycling system of natural ecosys-tems.
PART B
Read the story, The Magic SchoolBus Meets the Rot Squad (seeBibliography section). Read slowlyenough so students can comprehendthe story and look carefully at each picture.
Have each student respond to thestory by identifying key vocabularywords, such as decomposition, rot andrecycle.
Have students demonstrate anunderstanding of the story by retellingthe story in writing, in their own words,by using no more than 100 words.
AssessmentMethod A: Have students answer ques-tions 3, 4, 5, 6 and 8 on the handout,Nature’s Way With Waste, in Activity 1on p. V-12. These questions relate tothis activity. (The test assesses theentire lesson.)
Method B: Student stories written inPart B, Step 3.
ExtensionVisit a local grocery store and evaluatethe types of packaging used to preservefood based on biodegradability.
3
2
1
10

Windows on Waste - NATURE ’ S WAY WITH WASTE V Help Contents Back
▼
▼
162©Ohio Department of Natural Resources Help Contents Back
▼
▼
162
Student Handout ✐This
Tak
es H
ow L
ong
to D
egrade?
Dire
ctio
ns: I
n th
e ap
prop
riate
box
es b
elow
, cla
ssify
the
var
ious
item
s of
you
r ga
rbag
e ac
cord
ing
to d
ecom
posi
tion
tim
e.
Wee
ks
Mon
ths
Year
s H
undr
eds
of Y
ears
to D
ecay
to D
ecay
to D
ecay
to D
ecay

Windows on Waste - NATURE ’ S WAY WITH WASTE V Help Contents Back
▼
▼
163©Ohio Department of Natural Resources Help Contents Back
▼
▼
163
PreparationBefore conducting Part B of this activi-ty, locate an active compost bin and putabout 8 cups of fresh compost in a con-tainer with a lid to bring to class. Maketransparencies of the handouts, FoodWeb of the Compost Pile, Nature’sSanitation Crew, Food Chains and FoodChain Within a Compost Pile. Also,make copies of the first three handoutsfor each student. Students should haveaccess to scissors, tape or glue, and colored pencils, crayons or coloredmarkers.
ProcedurePART A
Define compost, using the wordsorganic, organisms, natural and decom-position.
Give each student a copy of thehandout, Food Web of the Compost Pile.
Explain to students that this handoutnot only shows the types of organisms(living) in a compost pile, but also thelevels of who eats who. Refer to the key atthe bottom of the left hand corner.Discuss the different types of organismsfound in a food chain and the level atwhich they are active.
Give students an example of onefood chain related to this food web. (Aground beetle eats a mold mite, whicheats bacteria, which feeds on organicmaterial.) Make sure students under-stand the cycle of eaters and of beingeaten. Using a transparency of thehandout, Food Chain Within a CompostPile, explain this cycle in a simpler formto students.
Give each student a copy of thehandout, Food Chains. Ask students toconstruct a type of food chain and indi-cate what the arrows represent (foodenergy). An example could be: grassgrows, cows eat grass, humans drinkmilk. In the column labeled, “A
4
3
2
1
Inquiry● How is compost made by
tiny organisms?
Content DomainLanguage Arts – Vocabulary
Math – Arithmetic
Science – Natural science,biology
Learning OutcomesMath, Grade 4, #17
Science, Grade 4, #3, #4, #6, #7,#9, #16, #17; and Grade 6, #1,#2, #3, #14, #15
DurationPart A: 45 minutes
Part B: 45 minutes
MaterialsFour magnifying glassesand/or four microscopes andfour glass microscope slidesand/or petri dishes; rulerswith centimeter measure-ment; scissors; tape or glue;colored pencils, crayons orcolored markers; four alu-minum pie pans; four forks;one container of fresh com-post (approximately 8 cups)
Handouts● Food Web of the Compost Pile
● Food Chain Within a CompostPile
● Food Chains
● Nature’s Sanitation Crew
Compost CrittersObjectivesStudents will be able to: (a) use a simple key to distinguish between compost critters;
(b) identify and compare the dimensions of compost critters in metric measurement;
(c) identify and discuss the selection of tools for exploring compost; (d) demonstrate
an understanding of the safe use of magnifying glasses and/or microscope and glass
slides; (e) demonstrate an understanding of the basic needs of living things; (f) iden-
tify ways in which organisms react to changing environments; and (g) sort and iden-
tify organisms according to size.
Act
ivity
3NATURE’S WAY WITH WASTE

Windows on Waste - NATURE ’ S WAY WITH WASTE V Help Contents Back
▼
▼
164©Ohio Department of Natural Resources Help Contents Back
▼
▼
164
Compost Food Chain,” have studentsrefer back to the handout, Food Web ofthe Compost Pile, to construct anothertype of food chain using examplesfrom that handout. An example couldbe: leaf provides energy to molds andfungi, which provides energy tospringtails, which provides energy tocentipedes.
Have students consider otherbasic needs that compost critters musthave to exist in a compost pile (heat,oxygen, water, bacteria, organic mat-ter). Discuss how heat in a compostpile may destroy some organisms, butcreate a good environment for others.
Discuss the connection humanbeings have to the compost foodchain and its organisms. Identify thevarious types of cycles found in thehandout (energy, food, decomposi-tion) and the place of compost crittersin the cycle of life.
Distribute the handout, Nature’sSanitation Crew, to each student. Haveeach student use a ruler with centime-ter measurements to compare sizes ofthe various organisms.
Students should choose anorganism that interests them, cut thepicture out and color it. Students mayalso draw larger examples of thesecompost critters to use for displaypurposes at a later time.
ProcedurePART B
Review the transparency, FoodWeb of the Compost Pile, and identifythe different types of living organismsin a compost pile. Have each studentshow the class his/her cut-out coloredpicture of the organism he/she chosefrom the handout, Nature’s SanitationCrew. Make sure students correlate/evaluate other classmates’ measure-ments, color and place in the food
chain. Ask students to predict whichcritters might eat other organisms andwhich might be eaten. Collect cut-outcritters and display on a bulletinboard.
At four locations, place an alu-minum pie pan filled with 2 cups ofunfinished compost. Do not do thisahead of time, because the microor-ganisms may crawl or fly around theroom.
Divide students into fourgroups. Each group should go to analuminum pie pan and examine thefresh compost with magnifying glassesand forks. Students may also usemicroscopes and glass microscopeslides and/or petri dishes. All studentsshould be reminded of the safe use ofmaterials in this science activity.Discuss what they are observing(movement, compost composition,texture, etc.). Relate observations backto the handout, Food Chain Within aCompost Pile. Students should actuallysmell, touch and hear (listen to) thecompost.
Have students return the com-post back to its original container.
Take about a cup of the freshcompost and put it on top of an over-head projector glass for the class.Observe the organisms as they moveabout, noting size, movement, etc. anddiscuss student observations. (Pointout that the projector lamp is servingas a heat source.) Immediately follow-ing the discussion, return the compostto the container.
Ask questions about the prob-lems associated with exploring com-post, such as critters get loose, out oftheir own bigger environment/ecosys-tem. Discuss the relationship ofhuman activity (making compost)and the environment.
AssessmentMethod A: Embedded assessmentincludes discussion answers andcooperative learning behavior.
Method B: Completing the handout,Food Chains, and cutting out theNature’s Sanitation Crew.
Method C: Have students describe theinstruments necessary to studymicroorganisms in compost.
Method D: On the handout, Nature’sWay With Waste on p. V-12, have stu-dents answer questions 1, 2, 3, 5 and8. These questions relate to this activi-ty. (The test assesses the entire lesson.)
Extensions
Have each student bring in anold sock and, using various art sup-plies, make a sock puppet of a com-post critter (from the handout,Nature’s Sanitation Crew) of his/herchoice. Students could role-play thechosen “critter” by acting out how itlooks, what it eats and who it mustavoid in the compost pile.
Using encyclopedias, research thecompost critters. Students could alsovisit compost-related web sites on theInternet and learn more about com-post facilities.
Put compost critter names into ahat. Students pick a name and sit inrows of chairs that are classified byvarious keys (number of legs, size inlength, etc.). Ask a variety of ques-tions: Who do you eat? Who eatsyou?, etc. Students will tag who theyeat; thus enacting a food web and theflow of energy.
Locate compost piles in yourneighborhood and/or city. Are thereany large compost sites or facilitiesnearby?
4
3
2
1
6
5
4
3
2
1
8
7
6
5

Windows on Waste - NATURE ’ S WAY WITH WASTE V Help Contents Back
▼
▼
165©Ohio Department of Natural Resources Help Contents Back
▼
▼
165
✐Food Web of the Compost Pile
Centipedes 30 mm
3º
2º
1º
Predatory Mite .5 -1 mm
Rove Beetles(Staphylinid)
10 mm
Ant (Formicid) 5-10 mm
Pseudoscorpion 1-2 mm
Protozoa.01-5 mm
Rotifera 1-5 mm
Mold Mite(Acarina)(.5-1mm)
Springtails(Collembola)
.5-3 mm
Sow Bug(Isopod)10 mm
Whiteworms, Potworms
(Enchtraeids) 10-25 mm
Land Snails andSlugs 2-25 mm Bacteria
Actinomycetes
Molds(Fungi)
OrganicResidues
KEY1º – First level consumers
2º – Second level consumers
3º – Third level consumers
Millipedes 20-80 mm
Fly (Diptera) 1-2 mm
Earthworms 50-150 mm
Beetle Mites1 mm
Roundworms(Nematodes) 1 mm
Feather-winged Beetles (Ptiliids)
1-2 mm
Soil Flatworms(Tubellarians)
70-150 mm
Brow
ning
-Fer
ris In
dust
ries
© 19
90
Ground Beetles (Carabid) 8-20 mm
Student Handout ✐

Windows on Waste - NATURE ’ S WAY WITH WASTE V Help Contents Back
▼
▼
166©Ohio Department of Natural Resources Help Contents Back
▼
▼
166
Food Chain Within a Compost Pile
Flesh eaters/Predators – centipedes, rove beetles, ants, predatory mites
springtails, mold mites, protozoa
earthworms, beetle mites, sow bugs, flies, enchtraeids, molds, bacteria
Dead organic matter
Note: These compost critters are all mixed together and interact with one another,rather than being stacked on top of each other as shown in this diagram.
➮➮➮

Windows on Waste - NATURE ’ S WAY WITH WASTE V Help Contents Back
▼
▼
167©Ohio Department of Natural Resources Help Contents Back
▼
▼
167
Food Chains
A FOOD CHAIN A COMPOST FOOD CHAIN
Student Handout ✐

Windows on Waste - NATURE ’ S WAY WITH WASTE V Help Contents Back
▼
▼
168©Ohio Department of Natural Resources Help Contents Back
▼
▼
168
Student Handout ✐
White Worms – Potworms (10-25 mm)I am a skinny, white worm, also known as a pot worm or
an enchtraeid (en kee tray id). I amabout an inch long, but I am so thin Ilook like a frayed piece of thread. Imove like an earthworm. In fact, we’rerelated. I don’t have red blood like anearthworm. I eat well-decomposedmaterial. You might think of me as
one who likes to “finish off” the job of decomposition.
Sow Bug (10 mm)I am an isopod. I have 10 pairs oflegs. I am related to crayfish andlobsters. I breathe with gills, so Imust live in a damp, moist place.My 1⁄2 inch body is oval and flat,with a series of flattened plates, like my close relative,the roly-poly. However, I can’t roll up in a ball. I eat vege-tation and leaf litter.
Earthworm (50-150 mm)I am a long, thin, soft-bodied animal. My body is madeup of little rings called segments. I have neither legs
nor eyes, but when I sense light, I slitheraway from it. I eat bacteria, fungi, protozoa and decaying organic matter.
Ant (5-10 mm)I am an insect with sixlegs and three bodysections: head, thoraxand abdomen. I am animportant decomposer because I break materials downinto smaller particles. I create tunnels, and assemblesoil particles into clumps.
Carabid Beetle – Ground Beetle (8-20 mm)I am an insect with shiny, black, tough wings and I’mabout a 1⁄2 inch long. I live beneath stones, boards andother moist places. At night, I rapidly pursue my prey,such as slugs, snails and soft insects, like caterpillars. I am a fierce predator.
Fruit Fly (1-2 mm)I am a small fly. I am sometimes a nui-sance. I don’t bite, I don’t sting and Idon’t make annoying buzzing noises. Inever harm earthworms. People considerme a pest because I sometimes invade
compost piles. If it’s warm and moist, and fruit andyeast are present, I lay eggs and they hatch. One wayto help keep me from being a nuisance is to hide foodwaste deep in the compost pile. Usually I am present and you don’t know it.
Nature’s Sanitation Crew
(Worms Eat Our Garbage: Classroom Activities for a Better Environment, Mary Appelhof, © Flower Press, 1993)

Windows on Waste - NATURE ’ S WAY WITH WASTE V Help Contents Back
▼
▼
169©Ohio Department of Natural Resources Help Contents Back
▼
▼
169
Student Handout ✐
Nature’s Sanitation Crew, continued
Mite (.5-1 mm)I’m tiny. It takes 25 of us to coveran inch long line. My body is soround and fat it’s hard to see myeight jointed legs. Thousands of uslive in a compost pile. We are importantdecomposers. Some of us eat plantmaterial, such as mold and softtissues of leaves. Others eat themanure of other organisms.Some of us can harm earthworms.
Millipede (20-80 mm)I have so many legs youwould have a hard timecounting them. My namemeans “thousand legs,” but Idon’t have that many. Each segment has two pairs oflegs. I’m not fierce, but quite timid. I roll up in a ball toavoid danger. I am a vegetarian and I eat soft, moist,decaying plants. I’m thick-skinned, dark red in colorand measure from 1–3 inches long.
Collembola (.5-3 mm)I am a close relative of theSpringtail, but I don’t have thespringing tail. I am tiny, oftenwhite and less than 1⁄16 of aninch long. Like the springtails, we aremembers of a group of animals that are primitive insects. I live with thousands of my companions in compost piles where I eat molds anddecaying matter.
Springtail (.5-3 mm)I am a tiny, white insect, less than 1⁄16 of aninch long. I have a pointed prong foldedbeneath my abdomen. By quicklyextending this “spring,” I jump highinto the air. When thousands of usgather on well-decomposed worm bedding, it looks as if we are jumpingall over the place. We feed on moldsand decaying matter and are impor-tant producers of humus.
Centipede (30 mm)I am a fierce hunter! I amknown as a predator becauseI prey on earthworms andeat them. I have a pair ofpoison claws to help keepmy prey from getting away.I move quickly on my manylegs. I have only one pair oflegs on each of my many(13-173) segments. I amabout a 1⁄2 inch long.
Pill Bug – Roly-PolyI am an isopod, which meansthat I have 10 pairs of legs thatlook very similar to each other.The flattened plates on my bodymake me look like an armadillo. I am about a 1⁄2 inch long. I roll upin a ball if I’m disturbed. I eat vegetation and leaf litter.
(Worms Eat Our Garbage, Mary Applehof, © Flower Press, 1993)
Predatory Mite
Mold Mite

Windows on Waste - NATURE ’ S WAY WITH WASTE V Help Contents Back
▼
▼
170©Ohio Department of Natural Resources Help Contents Back
▼
▼
170
MARKER CARD TEXTCOLOR #
BROWN* #1 twigs, brush#2 pine cones#3 brown leaves#6 dead animals#7 soil
#13 tree branches#14 bark#15 straw, pine needles#18 dead fish#23 weeds#24 peanuts, walnuts,
acorns, hickory nuts#25 sawdust, corncobs#27 dung/manure
MARKER CARD TEXTCOLOR #
GREEN* #4 grass clippings#5 fruit peelings
#16 vegetable peelings#17 coffee grounds,
egg shells#26 green leaves
BLUE* #8 rake, shovel or pitchfork
#22 thermometer
YELLOW* #9 oxygen#10 water#11 heat
Meet the YIMBYsObjectivesStudents will work cooperatively in groups to: (a) sort and identify components of acompost pile and construct a model through role-playing activities; (b) use patternsto make generalizations and predictions by identifying missing components in acompost pile; (c) make inferences about nutrient flows and energy transfers; (d)trace the transmission of energy in a small, simple ecosystem and identify the roles oforganisms in the energy movement in an ecosystem; (e) demonstrate an understand-ing of the basic needs of living things; (f) compare and contrast the diverse ways liv-ing things meet their needs; and (g) identify and interpret vocabulary words criticalto understanding composting. Students will explain how compost is part of nature’snutrient recycling system.
PreparationMake copies of the handouts, Is It O or Not? and Compost Scramble.
Write the information from the following chart on 4˝x 6˝ index cards. Use theassigned ink colors to write the phrases listed below:
Act
ivity
4
Inquiries● What is a compost pile?
● What are the components ofa compost pile?
● What are efficient ways tocompost organic waste?
Content DomainLanguage Arts – Oral communication, creative writing
Science – General science,biology
Learning OutcomesScience, Grade 4, #4, #16, #18and Grade 6, #1, #3
Duration45 minutes
Materials37 4˝x 6˝ index cards; yellow,pink, black, blue, green,brown, red markers; trans-parencies made from thehandouts, Is It O or Not? andCompost Scramble; jelly beans
Handouts ● Is It O or Not?
● Compost Scramble
NATURE’S WAY WITH WASTE

Windows on Waste - NATURE ’ S WAY WITH WASTE V Help Contents Back
▼
▼
171©Ohio Department of Natural Resources Help Contents Back
▼
▼
171
MARKER CARD TEXTCOLOR #
RED* #12 earthworms#19 termites, sow
bugs, other decomposers
#20 bacteria#21 fungi
PINK* #28 cotton rag#29 aluminum
beverage can#30 steel food can#31 plastic bottle#32 glass bottle#33 paper#34 cereal box#35 newspaper#36 meats, fat, oils
BLACK* #37 finished compost
*BROWN ... brown organic matter (carbon)
*GREEN.....green organic matter (nitrogen)/animal food and waste
*BLUE ........tools for making andobserving compost
*RED ..........living organisms, includ-ing decomposers
*YELLOW ..environmental needs ofthe microorganisms whofeed on the compostables
*PINK.........man-made, trash components
*BLACK......compost
Write the numbers and words on oneside of the card only. The color codewill represent the ratio of 3 browns(carbon): 1 green (nitrogen), which isthe necessary mixture for the successof a balanced compost pile.Remember, too much carbon willcause the pile to decay very slowly andtoo much nitrogen creates ammoniaand bad odors. A proper 3:1 carbon/nitrogen ratio is required.
ProcedureDivide the class into four or six
groups.
Introduce the YIMBY (“Yes, inmy back yard,” as distinct fromNIMBY, “not in my back yard”) com-post components by giving each ofthe groups the numbered index cards.(Each group will be responsible fordetermining who will be and dowhat.) Divide the 37 color-codedcards evenly and randomly. (Can alsouse the real items, but if artificialitems are used with the cards, savetime by attaching the card to theitem.)
Each student will tell the class ifhe/she is organic or inorganic and inwhat way he/she will address theneeds of plants and animals (as toolsor energy sources).
Optional: Use the handout, Is It O orNot?, to not only have students identi-
fy what they are in the compost pile,but to expand the list and recognizeother items that may or may not beorganic and could also be used in thepile.
Beginning with card #1, studentswill individually act out or say whatthey “are” and then position them-selves on the floor at the bottom ofthe compost pile. The sequence isrepeated so that all 37 cards are spo-ken for and most of the students willbe sitting side by side on the floor.
Items To Consider:● Student #8 (rake, shovel or pitch-
fork) should stand and mix students#1-7 and then mix students #10-21in with students #1-7.
● Students #9, 10 and 11 should beadded at some point. These compo-nents help meet the needs of bacte-ria and fungi.
● Student #22 (thermometer) shouldslip through students #21-31 and actout a temperature reading of 68° -77° Fahrenheit. (The temperature ina compost pile may climb to 150°F.)
All brown and green cards are sourcesof food energy for the decomposers.This energy is transformed intomovement and heat.
● Students with cards #28-35 areman-made items and the classshould discuss whether or not theseitems should go into the compostpile. These students could be put ina recycling bin and considered later.
40 percent of man’s garbage consistsof paper products! A small amountof paper products may go into thepile, but students should considercontaminants to nature such as theink.
● Student (or card) #36 (meats, fatsand oils) should never go in a com-post pile. Explain the reasons why tothe class (spread diseases, attractanimals and problems with odor).
4
3
2
1
1twigs, brush
Example Card
Note: This cardis written withbrown marker.

Windows on Waste - NATURE ’ S WAY WITH WASTE V Help Contents Back
▼
▼
172©Ohio Department of Natural Resources Help Contents Back
▼
▼
172
● Student #37 is finished compost.This person should remove his/hershoes and sit on top of the pile ashe/she reads the definition of com-post.
When the compost pile has beenbuilt, and as students are sitting onthe floor, sprinkle some jelly beans(serves as the element nitrogen thatmay need to be added) on the pile.Then student #8 (the rake) should“turn” the pile again. All the studentsshould be moving themselves aroundin the pile.
Other considerations: Studentsshould notice the color-coded cards.Remember to explain the 3 B: 1 Gratio (3 browns to 1 green), which willensure a successful compost pile.
Have students complete thehandout, Compost Scramble.
AssessmentMethod A: Make a list of items fromthe activity, with at least two fromeach of the following groups: brown,green, red, pink. Scramble the words.Have students make a chart and clas-sify each of the items and explain itspurpose in a compost pile.
Collect completed copies of thehomework sheet, Compost Scramble.
Method B: Embedded assessment ofthe role-playing. Use a rubric mea-surement or the rating scale that fol-lows:
Rating Scale
3 = Super
2 = Satisfactory
1 = Needs Improvement
___1. Each member of the grouphandled his/her group role.
___2. Each member of the grouptook turns listening to one another’sideas.
___3. Each member of the group
actively engaged in the assigned learn-ing role.
___4. Each member of the groupapplied his/her conflict resolutionskills when appropriate to do so.
___5. Each member of the groupshowed respect for one another.
___6. Each member of the groupmade a major contribution to theoverall performance.
___7. Each member of the groupmaintained a positive attitude.
Method C: Have students answerquestions 1, 3, 5, and 7 on the hand-out, Nature’s Way With Waste on p.V-12. These questions relate to thisactivity. (The test assesses the entirelesson.)
ExtensionsStudents can be asked, ahead of
time as homework, to bring in sam-ples of the 37 components of thecompost pile. Construct a compostpile outside of the classroom onschool grounds after students havelearned the procedure.
An actual compost bin can beput in the classroom and layered withartificial components. Have the artifi-cial items on a table in the classroomand as students take their numberedcards and before they position them-selves on the floor, have them picktheir corresponding components fromthe table and put the components inthe bin.
Rotate YIMBY cards so different stu-dents play different roles.
Create a play utilizing the com-post components as characters.
Have one student at a time standin front of the group with the cardtaped to the back of his/her shirt sothat only the group can see the card.Without saying what the word is,
group participants should discuss:What is the definition? How does ithelp or hurt the pile? The studentwith the card can attempt to guess theword at any time. The discussionshould carry on even after the studentcorrectly guesses the word. Evaluateall student contributions.
For homework, have studentsuse their cards to write a short sum-mary, poem or song to answer the fol-lowing questions: Who am I? Whatdid I do? When did I go in? Wheredid I fit in (beside what other compo-nents)? Why was I important?
Make a giant coloring book of acompost pile. Each student could bein charge of a different page.
6
5
4
3
2
1
7
6
5

Windows on Waste - NATURE ’ S WAY WITH WASTE V Help Contents Back
▼
▼
173©Ohio Department of Natural Resources Help Contents Back
▼
▼
173
Student Handout ✐
______Twigs, brush
______Cotton rag
______Plastic
______Pine cones
______Brown leaves
______Wax paper cup/milk carton
______Fruit peelings
______Plastic shopping bag
______Peanuts, walnuts
______Soil
______Tree branches
______Disposable diaper
______Bark
______Corncobs, pine needles
______Cereal box
______Coffee grounds, eggshells
______Weeds, brown leaves
______Dung
______Hickory nuts, acorns
______A piece of wood
______Sawdust, straw
______Traffic ticket
______Green leaves
______Aluminum beverage can
______Orange peel
______Steel food can
______Grass
______Paper
______Styrofoam package
______Newspaper
______Brown paper bag
______Banana peel
______Rope
______Bamboo pole
______Plastic six-pack holder
______Vegetable peelings
______Styrofoam package
______Cigarette butt
______Wool sock
Is It O or Not?
Directions: Identify the following list by placing a B next to each of the organic-carbon items and a Gnext to each of the organic-nitrogen items. Circle all the inorganic items.
______Rake
______Oxygen
______Water
______Heat
______Bacteria
______Fungi
______Thermometer
______Pitchfork
______Shovel
______Termites and otherdecomposers
OptionalDirections: Put the capital letter beside the word(s) that it represents.
L = Living organisms T = Tools E = Energy sources

Windows on Waste - NATURE ’ S WAY WITH WASTE V Help Contents Back
▼
▼
174©Ohio Department of Natural Resources Help Contents Back
▼
▼
174
Student Handout ✐ Compost ScrambleDirections:
Unscramble the words in the compost pile.
Write the correct word under the scrambled word.
Write your name on the pitchfork handle.
In the pile below, circle the unscrambled words that don’tbelong in a compost pile.
In the following list, put a square around the decomposers and put brackets around the sources of food energy.
5
4
3
2
1
dungair heatwormsleavesgrassvegetablesfunguspine needles
weedsold fruitnutsbarkcoffee grounds
bacteriatwigsfishglasssow bug
A R A B T C E I
S R O W M
B L E V E S T A G E N E I P D E E E S L NH S I F
D O L U R T I F
S N T U
L S A S G
A K R B
E C F O F E D S U G O R N
I W T S G

Windows on Waste - NATURE ’ S WAY WITH WASTE V Help Contents Back
▼
▼
175©Ohio Department of Natural Resources Help Contents Back
▼
▼
175
PreparationPART A
Review background information oncomposting at the beginning of this lesson.
Collect soil samples and place one cupof each on paper plates; divide the soilsamples in this manner:
● Plate #1 = sandy soil
● Plate #2 = clay soil
● Plate #3 = school yard soil
● Plate #4 = potting soil
At four locations, place a soil sampleplate and a magnifying glass, a spoon, apopsicle stick, and, if you wish, a rubberglove. Consider using four microscopesand prepare four glass microscope slidesof soil samples for the microscopeinvestigation.
Make copies of the handout, SoilSamples, for each student.
PART B
Collect enough clean glass jars for eachstudent. Have a tool ready to poke holesin metal lids for the students’ jars.
Optional: Have students collect foodscraps from the school cafeteria. Keepscraps in a sealed container until theclass is ready to begin making theircompost jars. (Do not keep waste in thecontainer for more than 24 hours or itwill decompose too quickly.)
ProcedurePART A
Explain to students that this activ-ity is about soil. Define soil and explainthat there are thousands of differenttypes of soil based on mixtures of threebasic types – sand, clay and loam. (Siltmay or may not be used in your defini-tion.)
Divide the class into four groups.Give each student a copy of the hand-out, Soil Samples. Have each group go toone of the soil sample stations. Allowthe groups enough time to examine thesoil sample and record observations onthe handout. The groups should thenmove from station to station to recordtheir observations of all four soil sam-ples. Make sure students do not writeanything in the column under “com-post.”
2
1
Inquiries● What are the components of
compost?
● How is compost made?
● What is the most efficientway to make compost?
Content DomainLanguage Arts – Oral communication, listening/visual literacy, reading content,organization
Math – Arithmetic
Science – Natural science,biology
Learning OutcomesScience, Grade 4, #2, #6, #7, #9and Grade 6, #2, #3, #12
DurationPart A: 30 minutes (notincluding preparation time)
Part B: 45 minutes or more(depending upon procedureused and compost develop-ment time)
Part C: 45 minutes
continued next page
Compost JarsObjectivesStudents will be able to: (a) make observations and record information about vari-ous soil samples, including compost; (b) evaluate a simple procedure to make com-post; and (c) describe the value of compost as a soil amendment.
Act
ivity
5NATURE’S WAY WITH WASTE

Windows on Waste - NATURE ’ S WAY WITH WASTE V Help Contents Back
▼
▼
176©Ohio Department of Natural Resources Help Contents Back
▼
▼
176
Engage groups in a classroom dis-cussion to report observations andmake comparisons and contrasts of thesoil samples. Ask students questionsregarding the method of observation –the magnifying glasses and/or the glassmicroscope slides, as well as the properusage of the scientific equipment.
Collect the completed handoutsfrom students and save them for use inPart C.
PART B
Explain to students that they willbe making compost. Decide whetherevery student will make compost thesame way, or discuss as a class how stu-dents (in groups) could make compostin different ways. Other decisions tomake regarding the experiment:
● use a control or no control
● what variables will be used
● type and size of container for compost
● worms or no worms
● types of ingredients (refer to thebrown, green, red and yellow factorsfrom the previous activity, Meet theYIMBYs)
● what kind of information tochart/observe
● types of hypothesis or hypotheses thatwill guide interpretations of results
To collect compostables, have stu-dents request permission to collect foodscraps from the school cafeteria. Duringlunch, students should research types ofsolid waste in the cafeteria and deter-mine which types would make healthyand safe organic waste for composting.Another option would be to have stu-dents bring to class, in containers orsome type of secure packaging, organicitems from the previously listed materi-als and/or from the activity, Meet TheYIMBYs.
Distribute to each student, a sheetof newspaper to place on the desk and aplastic or glass jar with a lid.
Very small holes need to bepunched in the lids for air to enter.Supervise this task closely or punchholes in the lids before distributing thejars.
Fill each glass jar about 1⁄4 full ofsoil from your school’s or home’s back-yard. Do not use potting soil (chemicaladditives). You may want to add a littlemanure to the soil to enhance thegrowth of microorganisms.
Optional: Add one or two redworms.
Add food scraps until the jar ishalf full; do not add meat, dairy orfatty/oily foods.
Optional: You may want to chop thefood and yard wastes into small pieceswith a blender or food processor.Smaller pieces will hasten the decompo-sition of the organic waste.
Place a 1-inch layer of soil, thenadd a 2-inch layer of organic waste anda few drops of water to the jar to keepeverything damp. Don’t add too muchwater; the compost should be moist, butnot soggy. Use a misting bottle tomoisten the soil. Then add a 1⁄2-inchlayer of newspaper.
Place a 1-inch layer of soil or com-post on top of the completed pile.
Add additional water as needed tomake the pile moist, but not soggy. Itshould feel like a damp sponge.
Place a thermometer in the middleof some of the compost jars. See thediagram on p. V-35.
Put lids on the jars. Place the com-pleted compost jars in an easily accessi-ble area in the classroom. Do not putthem in direct sunlight, unless this is avariable, because the worms may die.
The contents of the compost jarshould be turned once a week. This maybe done with a fork or by gently shakingthe jar.
12
11
10
9
8
7
6
5
4
3
2
1
4
3
MaterialsPart A: Soil type samples –
sandy soil, clay soil, soil from
school yard, potting soil (you
may be able to acquire these
soil samples from your local
Soil and Water Conservation
District office); four magnify-
ing glasses and/or four micro-
scopes and four glass micro-
scope slides; four spoons and
four popsicle sticks; four
paper plates and/or four petri
dishes
Part B: Four spoons; small
thermometer for each group;
old newspaper; clean, clear
plastic or glass jars (quart-size
would be best) with lids (one
for each student); spray mist-
ing bottle; tool to poke very
small holes in metal lids; rub-
ber gloves; organic wastes
(brought in containers by stu-
dents), such as banana peel,
orange peel, coffee grinds,
sawdust, corn cob, grass clip-
pings, weeds, apple core, egg
shells, potato peels, leaves, a
piece of paper (see the list of
YIMBY items used in the pre-
vious activity, Meet the
YIMBYs).
Caution: no meat, dairy or
fatty items should be used;
redworms are optional.
Handouts● Soil Samples
● Compost Observation Chart(optional)
NATURE’S WAY WITH WASTE

Windows on Waste - NATURE ’ S WAY WITH WASTE V Help Contents Back
▼
▼
177©Ohio Department of Natural Resources Help Contents Back
▼
▼
177
Each student should record theinitial odor, temperature, height andweight of the compost. Studentsshould record observations once ortwice a week, or at other designatedtimes. The handout, CompostObservation Chart, can be used torecord data. Allow enough time topass (up to a few months) for com-post to develop.
Have students compare theirobservations and findings. If theexperimental approach was used, stu-dents should synthesize the informa-tion and evaluate the decomposition/composting process to see if it con-firmed their hypotheses.
PART C
Return the nearly completedhandout, Soil Samples, to each student(from Part A).
Now have students observe thecompost they made and record datain the middle column for compost.
Have students compare and contrasttheir findings with the other four soiltypes.
Ask students how compostwould be beneficial if it was added tothe other soil types.
AssessmentAssessment may include evalua-
tion of completed handouts. Haveeach student evaluate the compost jarprocedure and write up safety proce-dures, equipment use and suggestionsfor improving the activity or experi-ment.
Students could also make ascrapbook on composting. Evaluatewith a rubric.
Have students answer questions3, 5, 6, and 8 on the handout, Nature’sWay With Waste on p. V-12 fromActivity 1. These questions relate tothis activity. (The test assesses theentire lesson.)
If you conducted the entire lesson,administer the entire handout. Returnthe handout to students and discuss.
Extensions Plant seeds in soil samples from
the activity, with and without com-post, and compare growth rates.
Conduct a vermicompostingactivity (see Background Informationsection). Construct a worm bin forthe classroom and nurture it through-out the school year. (Suggestions forordering worms for classroom com-post projects are found in theBibliography section, under EducatorInformation.) Students could also cre-ate a compost center equipped withplastic gloves, thermometer, papertowels, magnifying glasses, storybooksof compost critters, etc.
Have students conduct inter-views with the following: a farmer –to find out what he/she does withhis/her dead livestock; a senior citizen– regarding his/her experience withrecycling, compost, garbage; and agarden store/nursery owner.Interviews could be done with a taperecorder. Students could then write areport or role-play the characters forthe class.
Visit a compost facility or amunicipal yard waste drop-off site.What community efforts have beenestablished to compost organic mate-rials?
Research the types of solid wastefound in the school’s cafeteria.Examine the cafeteria’s organic foodscraps, as well as the school’s organicwaste – grass clippings, leaves, etc.Which of these wastes are consideredhealthy and safe organic waste? Couldthese items be used to begin a class-room compost pile project? Howabout a school compost pile? Design acompost pile for your school’s organicwastes.
5
4
3
2
1
3
2
1
3
2
1
14
13
Redworms (optional)
1˝ soil
1⁄2̋ newspaper
2˝ organic/food waste
1˝ soil
Half container full offood scraps
Quarter container fullof fresh soil
➔➔➔➔
➔
➔
➔
Diagram of Compost Jars (Completed)
Drops of water➔

Windows on Waste - NATURE ’ S WAY WITH WASTE V Help Contents Back
▼
▼
178©Ohio Department of Natural Resources Help Contents Back
▼
▼
178
Student Handout ✐ Soil Samples
Directions: Examine the soil samples. Complete the following chart and questions.
Soil can be classified by texture (feel).● Soils that are clay-like are smooth, sticky and
dense. They hold water tightly, making it lessavailable to plants.
● Soils that are sandy are very gritty, loose andcrumbly. They hold little water for plants.
● Soils that are loamy are mixtures of the soilsabove. They are loose, crumbly and hold waterwell.
Soil can also be classified by color. ● Dark – black, dark gray or dark brown● Medium – brown to yellow brown● Light – pale brown to yellowThe more organic material in the soil, the darkerthe color of the soil. Generally, the darker the soil,the more easily water sinks in and the better it isfor growing plants.
Location Found
Color
Smell
Particle Size
Texture
Prediction for growing plants G=Good, F=Fair, P=Poor
Furthur Observations
Directions: Answer the following questions on the back of this handout.
● In what ways are these soil types alike? ● In what ways are these soil types different?
1 2 3 4 5Sandy Soil Clay-like Soil School Soil Potting Soil Compost
There are more than 70,000 different types of soil in North America. A classification system is neededto distinguish the types.

Windows on Waste - NATURE ’ S WAY WITH WASTE V Help Contents Back
▼
▼
179©Ohio Department of Natural Resources Help Contents Back
▼
▼
179
Student Handout ✐
Compost Observation ChartDate Temperature Odor Initial Observations
(if any) Observations of Changes

Environmental StudiesLearning Concept
Technology increases material prosperi-
ty by increasing human’s efficiency in
completing tasks and making prod-
ucts. It also increases a society’s chance of
changing the natural environment in negative
ways, including land degradation through the
acquisition of natural resources and the gen-
eration of pollution. Therefore, technological
efficiency, from an environmental (and some-
times economic) perspective, is based on com-
pleting more tasks or making more products
with fewer natural resources, less energy and
less pollution. Appropriate technology does
this by meeting human needs with minimal
long-term damage to the environment and
maximum social and economic benefits to its
users.
Solid waste management, including recy-
cling, requires the use of technology. Recycling
is an appropriate technology – it generally
reduces land space consumption, energy and
resources; it reduces the generation of pollu-
tion; and it creates more jobs than disposal
programs. One of the most complex challenges
in recycling and waste collection is to effi-
ciently collect, separate and prepare materials
for reintroduction into the manufacturing
process. Simple and complex machines can be
integrated into processes to make recycling
more efficient. Technology can be applied,
which will change the way products are made
so they can be more easily recycled. Solid
waste collection and disposal processes rely on
technologies to improve collection efficiency
and reduce the volume of solid waste.
Vocabularyappropriate technology – tools and processes that meet human needswith minimal long-term damage to the environment and maximumsocial and economic benefits to the users
commingle – to mingle together; intermix in a single container trashitems made from different materials
contamination – being made impure through contact or addition ofanother substance
ferrous metal – metal containing, or derived from, iron
manual – physically worked by human hands without electricity orother power source
materials recovery facility (MRF) – facility for separating andpreparing solid waste products and materials for recycling
mechanical – produced or operated by machinery (simple and/orcomplex machines)
natural resources – things from nature, such as ores, plants, animals;the source of all consumer products made of glass, steel, aluminum,paper, plastic, etc.
paperboard – a relatively stiff, heavy material, thicker than paper,made from paper pulp; commonly used as container material
recycling – the act of collecting and separating materials and productsfrom the solid waste stream and reusing them as raw materials inmanufacturing processes
technology – all the tools and processes, including knowledge, used toextract resources from the environment and provide goods and services
SEPARATION MANIAWindows on Waste - SEPARATION MANIA VI Help Contents Back
▼
▼
180©Ohio Department of Natural Resources Help Contents Back
▼
▼
180

Windows on Waste - SEPARATION MANIA VI Help Contents Back
▼
▼
181©Ohio Department of Natural Resources Help Contents Back
▼
▼
181
1Activity 1: Separation ManiaDescriptionStudents simulate the operation of recycling technology at a materials recovery facility (MRF) by constructing a classroom model to separate “recyclable” objectswith simple machines along a moving conveyor. They observe the objects carefullyand complete a handout to describe the differences and similarities of the physicalcharacteristics of the items. They cooperate in groups to test the mini-MRF and theyanalyze the results to redesign the process. Students perform another trial run andevaluate it for accuracy and efficiency. They compare the two attempts and make recommendations for further improvements.
Ohio Proficiency Test Learning OutcomesGrade 4, Science #2 – Select instruments, make observations and/or organize observationsof an event, object or organism.
Grade 4, Science #6 – Evaluate a simple procedure to carry out an exploration.
Grade 4, Science #12 – Explain and/or predict the motion of objects and/or describe theeffects of some objects on other objects.
Grade 6, Science #7 – Predict the influence of the motion of some objects on otherobjects.
SummaryThis lesson includes one
activity.
Overview - SEPARATION MANIA
Background Information
Recycling is a technolo-gy that returns oldmaterials or trash to themanufacturing process.Using recycled materials
to make new products consumesfewer natural resources and reducespollution. Recycling is an appropriatetechnology because it promotes con-servation and lessens environmentaldegradation.
Recycling is achieved when mate-rials are sorted and separated fromthe solid waste stream, and theprocessed recyclables are used tomanufacture new products. To meetthe specifications of manufacturers,
recycling businesses rely on peopleand technology to clean, sort and pre-pare the recycled materials. Theprocess of separating and preparingmaterials for manufacturing addscosts to recycling efforts. Therefore,the success of recycling is based, inpart, on how efficiently differentmaterials (glass, paper, plastic, etc.)can be collected and separated fromeach other.
Separation generally begins at thesource of waste generation, such asresidences and businesses where recy-clables are separated by hand fromother waste materials. These materialsmay then be collected through curb-
side pickup, drop-off boxes or buy-back centers. Waste generators may, ormay not, separate specific recyclableitems from each other. When recy-clable items are collected together orcommingled, further separation ofthese items takes place at a recyclingcenter or materials recovery facility(MRF). Some MRF facilities receivemixed waste, which requires them toseparate recyclables from all types oftrash and garbage, others receive only commingled recyclables for separation.
At a MRF (pronounced “murf”),materials run along conveyor beltsand are both manually and mechani-
Windows on Waste - SEPARATION MANIA VI Help Contents Back
▼
▼
182©Ohio Department of Natural Resources Help Contents Back
▼
▼
182
cally separated. Sorting methods differfrom material to material. Paper andcardboard are often sorted manually.Commingled glass, aluminum, steeland plastic are often sorted using acombination of manual andmechanical techniques.
As the commingled mixturemoves along the conveyor line, theferrous metal (steel) is pulled outwith magnets and loaded into a con-tainer to be baled or shredded andthen shipped to a manufacturer. Theplastic may be sorted by a vacuum orblower and/or sorted by hand to sepa-rate the plastic into types such asPETE (#1 plastics, including softdrink, juice and water bottles) andHDPE (#2 plastics, including milkjugs and detergent bottles). The plas-tic is then compacted, baled and sentto a manufacturer. Glass is manuallyseparated by color, crushed and sentto a manufacturer. Aluminum, whichmoves down the line and eventuallyfalls off the end into a container, isalso compacted and sent to a manu-facturer.
Along the entire sorting line,workers must pay close attention to
ensure that materials are accuratelysorted. Accurate sorting methods arecrucial to the financial stability ofrecycling centers. Manufacturers relyon recycling centers to provideuncontaminated material. If the mate-rial received from a recycling center isnot pure, the manufacturer will eitherrefuse it or demand a price reduction,depending upon the level of contami-nation. For example, recycled papermanufacturers who buy newspapermay accept paper bales that alsoinclude paperboard, but will pay therecycling center less for those “conta-minated” bales. Once manufacturersreceive the materials, they may conduct additional sorting and clean-ing operations for quality control purposes.
After new products are madefrom recyclable materials, they enterthe market system. In order to “closethe loop,” consumers must purchaserecycled-content products. Unlessconsumers make these environmen-tally-friendly choices, there is noincentive to begin the process ofsorting and separating recyclablematerials.
Bibliography and AdditionalResourcesStudent Resources
How the Environment Works, byPreston Gralla, Ziff-Davis Press, 1994.
25 Simple Things Kids Can do to SaveEnergy, The Earth Works Group,1992.
Internet
Ohio Energy Project Web Site:www.ohioenergy.org
Media
Bill Nye the Science Guy – Biodiversityand Garbage, Disney EducationalProductions. Both videos are 26 minutes. To order: (800) 295-5010.
Educator Information
Earth Cycles Curriculum Supplement,Ohio Energy Project and Cycles forScience, Steel Recycling Institute. OhioEnergy Project, (614) 785-1717.
Missouri Polymer AmbassadorActivities, Mary E. Harris, 1996,(314) 993-4040.
Background Information, continued

Windows on Waste - SEPARATION MANIA VI Help Contents Back
▼
▼
183©Ohio Department of Natural Resources Help Contents Back
▼
▼
183
Preparation Arrange the room as follows. Set up arow of desks, 10 feet or longer, in thecenter of the room (no chairs). Set upsix student group locations at deskswith chairs around them.
Place the items for each group (seebelow) in a brown paper grocery bag.With a permanent marker, write thename of the group on its correspondingbag.
Conveyor Group – several sections ofnewspaper, masking tape, paper tubesand box
Aluminum Group – two pieces of con-struction paper, two straws, two barmagnets, a cookie sheet, two balloonsand a container marked ALUMINUM
Steel Group – two pieces of construc-tion paper, two straws, two bar magnets,a cookie sheet, two balloons and a con-tainer marked STEEL
Paper Group – two pieces of construc-tion paper, two straws, two bar magnets,a cookie sheet, two balloons, a containermarked PAPER and a container markedCARDBOARD
Plastic Group – two pieces of construc-tion paper, two straws, two bar magnets,a cookie sheet, two balloons, a containermarked PLASTIC # 1 and a containermarked PLASTIC #2
Glass Group – two pieces of construc-tion paper, two straws, two bar magnets,a cookie sheet, two balloons, a containermarked CLEAR GLASS, a containermarked GREEN GLASS and a containermarked BROWN GLASS
ProcedureDivide the class into six groups.
Give each group a small bag, as previ-ously prepared, with two or three sam-ples of each material (steel paper clips,aluminum tabs, newspaper pieces, card-board pieces, #1 plastic pieces, #2 plasticpieces, clear, green and brown floralvase marbles). Give each student in eachgroup the handout, Similar andDifferent?, to complete by observing thematerials and discussing potentialanswers with their groups. Discuss theanswers as a class.
Discuss recycling concepts fromthe background information with the
2
1
Inquiries● What types of machines are
part of recycling technology?
● How can different solid wastematerials be separatedmechanically to prepare themfor recycling?
Content DomainScience – General science,physical science
Learning OutcomesScience, Grade 4, #2, #6, #12and Grade 6, #7
DurationTwo 50-minute class periods
MaterialsSample items for conveyorbelt: newspaper (no comics orsports); masking tape; severalempty paper towel or wrap-ping paper tubes; scissors,desks lined up in a row (10´ orlonger); long rectangular trayor box the width of the paperconveyor (about 27˝ maxi-mum) to collect the items thatdrop off the end of the belt
Sample items for five sortingmachines: 10 pieces (two pergroup) of heavy constructionpaper; 10 straws (two pergroup – do not share or reuse);10 bar magnets (two pergroup); five (one per group)pieces of cardboard or otherrigid material (about 27˝ longby 12˝ wide) that can be cutwith scissors; nine large-mouthed containers (i.e. whipcream containers); numbersper group, 10 balloons (twoper group)
Separation ManiaObjectivesStudents will be able to: (a) explain how technology and principles of physical sci-
ence can be applied to sort and separate materials with different physical character-
istics; and (b) explain the importance of technological processes for recycling.
Act
ivity
1SEPARATION MANIA
continued next page

Windows on Waste - SEPARATION MANIA VI Help Contents Back
▼
▼
184©Ohio Department of Natural Resources Help Contents Back
▼
▼
184
class to explain the importance of theexercise just completed. For example,products that end up in the wastestream are made from materials thathave different physical properties toserve different purposes. In order torecycle these materials, they must beseparated by material. Explain to theclass they will be making a model of amaterials recovery facility – a mini-MRF – which includes a combination ofseparate technologies and processes forsorting materials.
Designate each of the six groupsof the mini-MRF as one of the follow-ing: Conveyor Belt, Aluminum SortingTechnology, Steel Sorting Technology,Paper Sorting Technology, PlasticSorting Technology and Glass SortingTechnology. Give the conveyor groupthe materials they need to make a con-veyor belt. Give each material group itsbag of supplies, which will be used tocreate a sorting technique and simplemachine.
The goal of each of the five materialgroups is to make a technology, fromthe sorting machine supplies in theirbags, that will sort out the group’s spe-cific material from all of the otherscommingled together on the conveyorbelt. Each group may use any numberof items from its bag.
The conveyor belt group’s goal is tomake a moving conveyor belt using thetables and its assortment of supplies,and decide the order of each of the sort-ing technologies along the conveyor belt(i.e. where students stand, etc.).
Allow 20 minutes for each group todiscuss how it will create a machine toperform its function within the MRF.Share the mini-MRF rules (and hints, ifneeded) with the groups.
RULES ● Only two students from each material
group can operate the sorting tech-nology, (either together or one oneach side) depending upon how theyuse the technology. Other students in
the group can stand nearby and makeadditional manual sorts by hand, ifneeded. Four students can operate theconveyor belt. Other members of thegroups should observe standing closeto their representatives.
● Once an item (or items) has beenmoved off or lifted off the conveyor, itmay then be manually handled toplace it in the container for that spe-cific material. Otherwise, studentsmay not touch any of the materials onthe conveyor belt.
● Once a material is moved or lifted offthe conveyor, it cannot be put back onthe belt, even if it is not the correctmaterial for that group. Students can-not pick up an item once it has fallen.Tell students it is better to collect a“contaminating” material in theircontainer than to let it fall to the floor.
HINTSDo not make any suggestions to stu-dents unless they are unable to think ofideas after a certain amount of time.
● Magnets taped to cardboard will pulloff steel.
● Construction paper or straws cangenerate a force of air to remove itemsby weight.
● Cardboard can be used to make sizesorters.
● Balloons can be used to generate staticelectricity to pick up light (newspa-per) objects.
● Scoops can be made of cardboardand/or straws to guide materials offthe line.
Begin assembling the mini-MRFby having the Conveyor Belt group con-struct the belt and designate the orderof the sorting groups on the belt. Placea box on the floor at the end of the belt.Have all students assemble at the belt intheir designated places.
Tell the Conveyor Belt group tostart moving the conveyor belt. In ran-
6
5
4
3
Containers for each group ofsorting machine items: sixbrown paper grocery bags,black permanent marker
Tools to make the sortingmachines: six scissors and tapedispensers (one each pergroup); Optional: extra con-struction paper and cardboard
Items to represent commin-gled recyclable materials: 50aluminum soft drink tabs; 50large steel paper clips; 100pieces of newspaper (1⁄2˝squares); 50 pieces of card-board (about 4˝ squares); plas-tic (100 pieces) including 50-2˝circles cut from plastic (#1)soda bottles and 50-2˝ circlescut from plastic (# 2) milk jugs;glass (100 pieces) including 40clear flat floral marbles, 30green flat floral marbles and 30brown flat floral marbles(Make sure the floral marblesare the flat oval variety; theymay be obtained at craft or gar-den supply centers.); bag orother container to store all therecycled materials together
Before all of the items go in thebag, make six group collectionsof two or three samples of eachmaterial (steel paper clips, alu-minum tabs, scrap paperpieces, cardboard pieces, #1plastic pieces, #2 plastic pieces,and clear, green and brown flo-ral vase marbles) and put themin six small ziplock bags or othercontainers. Place the remainingquantities in the large bag andmix them up.
Handouts● Similar and Different?
● Mini-MRF Evaluation
Materials, continued
SEPARATION MANIA

Windows on Waste - SEPARATION MANIA VI Help Contents Back
▼
▼
185©Ohio Department of Natural Resources Help Contents Back
▼
▼
185
dom amounts, deposit handfuls of thecommingled material onto the conveyorbelt. Start at the beginning of the lineand continue as the belt begins to moveand all materials are used. Each groupmust attempt to separate its designatedmaterial as it moves past. After all of thematerials have traveled along the con-veyor belt, have students return to theirseats with the materials they collected intheir group’s containers. Results willvary; containers may contain more thanjust designated materials, or thegroup(s) may not have successfully col-lected any materials.
As a class, have students record theresults of the trial run on the handout,Mini-MRF Evaluation, by completingquestions 1-3. Discuss the answers.
Question 2 involves counting all of thematerials in all of the sorts, includinghow many materials fell to the floor andhow many were left at the end of theconveyor belt in the box. If one type ofmaterial is most prominent at the end,then the last stage of dropping off thebelt could be considered a successfulclassification technique. When dis-cussing Question 3, ask how manymanual sorts had to be made comparedto mechanical sorts.
Have each student individuallyanswer Question 4 on the handout,Mini-MRF Evaluation, to assess eachstudent’s understanding of the conceptsin the activity.
After students share their answersto Question 4 with their groups, haveeach group redesign the entire MRF sothat it will operate more efficiently.Each group should be prepared toexplain in hypothesis fashion why theythink their modifications will lead tobetter results.
After each group presents theirdesign, have the class select whichdesign it believes is best. Conductanother trial run using that design andcompare the results with those from thefirst trial.
Assessment Embedded assessment in Step 8.
Ask students the following: Howmight the comparisons on the handout,Similar and Different, help to make asorting machine? What informationabout the physical properties of materi-als would be useful to create a MRF?How can the success of a MRF be evaluated?
ExtensionsHave students design another
MRF model, but allow them to bring inand use additional materials of theirchoice to make new technologies. Forexample, students could experimentwith flotation devices, fans or simplemachines, such as inclined planes, pul-leys, wheel and axle, etc.
Arrange a tour of a materialsrecovery facility. Identify the simplemachines and manual techniques usedin the operation and compare withthose designed by the class.
2
1
2
1
10
9
8
7

Directions: Explain how the following pairs of materials are similar or different based on their physicalqualities (color, strength, weight, etc.). Observe and handle examples of each material as you completeyour answers.
PLASTIC and PAPERSimilar because: _______________________________________________________________________
Different because: ______________________________________________________________________
GLASS and METAL Similar because: _______________________________________________________________________
Different because: ______________________________________________________________________
PAPER and CARDBOARDSimilar because: _______________________________________________________________________
Different because: ______________________________________________________________________
CLEAR GLASS and GREEN GLASSSimilar because: _______________________________________________________________________
Different because: ______________________________________________________________________
PLASTIC and GLASSSimilar because:________________________________________________________________________
Different because: ______________________________________________________________________
#1 PLASTIC and #2 PLASTICSimilar because: _______________________________________________________________________
Different because: ______________________________________________________________________
ALUMINUM and STEELSimilar because: _______________________________________________________________________
Different because: ______________________________________________________________________
Similar and DifferentWindows on Waste - SEPARATION MANIA VI Help Contents Back
▼
▼
186©Ohio Department of Natural Resources Help Contents Back
▼
▼
186
Student Handout ✐

Windows on Waste - SEPARATION MANIA VI Help Contents Back
▼
▼
187©Ohio Department of Natural Resources Help Contents Back
▼
▼
187
Student Handout ✐
Mini-MRF Evaluation
What type of force or motion did your group use to sort its material?
_____________________________________________________________________________________
_____________________________________________________________________________________
How well did your group succeed in separating only its material from the other materials? (Decide what type of measurements can be made in order to decide how well your group succeeded.)
_____________________________________________________________________________________
_____________________________________________________________________________________
_____________________________________________________________________________________
_____________________________________________________________________________________
_____________________________________________________________________________________
_____________________________________________________________________________________
_____________________________________________________________________________________
Which group had the best results? Why?
_____________________________________________________________________________________
_____________________________________________________________________________________
_____________________________________________________________________________________
_____________________________________________________________________________________
_____________________________________________________________________________________
_____________________________________________________________________________________
_____________________________________________________________________________________
How could the entire MRF be improved for better results? (Explain on back and include a drawing.)
4
3
2
1

Environmental StudiesLearning Concept
Technology can be applied to
resource extraction, industrial
production and waste manage-
ment processes to reduce the generation of
potential pollutants and control their
release into the environment. Technology
can also be used to clean up pollutants
after they have entered the environment.
Preventing the generation of hazardous
materials and emissions costs less finan-
cially and environmentally than treating
and controlling the release of pollutants
or cleaning up pollutants after they have
been released. Governmental policies and
regulations about technology can be
adopted to reduce or prevent pollution.
By using the best available technolo-
gy, solid waste disposal facilities can
reduce the potential for pollutants to
enter the environment or reduce their
harmful potential prior to release.
Technology makes modern landfills and
incineration facilities considerably safer
than in the past; however, despite
technological advances, concerns about
pollution remain.
Vocabularybiodegradation – the decaying of elements or cells of dead plants andanimals into simpler substances
cell – the actual hole, dug in the ground, where waste is buried
clay soil – firm earth, made up of very small particles; used in theconstruction of sanitary landfills
construction – the act of building
corrosive – wearing away by chemical action
leachate – contaminated water that collects after rain runs through alandfill
methane gas – odorless, colorless, flammable gas
sanitary landfill – a facility where garbage is buried to protect ourwater and surrounding environment
technology – a method for handling a specific technical problem
toxic – poisonous
TECHNO-FILLWindows on Waste - TECHNO-FILL VII Help Contents Back
▼
▼
188©Ohio Department of Natural Resources Help Contents Back
▼
▼
188

Windows on Waste - TECHNO-FILL VII Help Contents Back
▼
▼
189©Ohio Department of Natural Resources Help Contents Back
▼
▼
189
1 Summary
This lesson has four activ-
ities. The first activity
serves as an introduc-
tion for the subject matter in
the other three activities;
however, each activity can be
conducted separately.
Overview - TECHNO-FILL
2
Activity 1: Landfill LingoDescriptionStudents read a handout comparing old dumps with modern landfills and interpretthe meaning of vocabulary terms critical to the text. In their own words, or by draw-ing pictures, students compare old methods of garbage disposal with modern wastedisposal technology.
Ohio Proficiency Test Learning OutcomesGrade 4, Reading #14 – Identify and interpret vocabulary (words, phrases or expressions)critical to understanding the text.
Grade 4, Reading #17 – Infer from the text.
Grade 4, Science #14 – Identify and/or describe the relationship between human activityand the environment.
Grade 6, Reading #12 – Infer from the text.
Grade 6, Science #4 – Identify the positive and/or negative impacts of technology onhuman activity.
Activity 2: Does Your Soil Leak?Description Students observe a soil sample and make calculations using fractional analysis to ana-lyze the soil sample. They read a handout about soil and landfill construction andinterpret the meaning of various passages.
Ohio Proficiency Test Learning OutcomesGrade 4, Mathematics #7 – Illustrate or identify fractional parts of whole objects and likefractions greater than one, and add and subtract like fractions with illustrations and symbols.
Grade 4, Reading #14 – Identify and interpret vocabulary (words, phrases or expressions)critical to understanding the text.
Grade 4, Reading #17 – Infer from the text.
Grade 4, Science #2 – Select instruments to make observations and organize observationsof an event, object or organism.
Grade 4, Science #8 – Evaluate observations and measurements made by other people.
Grade 6, Mathematics #6 – Compute with whole numbers, fractions and decimals.
Grade 6, Reading #12 – Infer from the text.
Grade 6, Science #3 – Make inferences from observations of phenomena and/or events.

Windows on Waste - TECHNO-FILL VII Help Contents Back
▼
▼
190©Ohio Department of Natural Resources Help Contents Back
▼
▼
190
4
3Activity 3: Finer LinerDescription Students conduct an experiment to determine the ability of soil and plastic materialto retain water in a simulation of a landfill liner system. They are given a variety ofmaterials (soil samples, plastic samples, etc.) and are required to make inferences toselect the most appropriate materials for a landfill liner system. Afterward, they ana-lyze the experiment to evaluate the procedure.
Ohio Proficiency Test Learning OutcomesGrade 4, Science #6 – Evaluate a simple procedure to carry out an exploration.
Grade 4, Science #7 – Identify and/or discuss the selection of resources and tools used forexploring scientific phenomena.
Grade 6, Science #3 – Make inferences from observations of phenomena and/or events.
Activity 4: Life...Without Pollution PreventionDescriptionStudents conduct an experiment about the effects of pollution on plant life by addingvarious hazardous materials to water, which is then used to water plants. Studentsidentify precautions that must be taken when using hazardous materials in an experi-ment and they observe, collect and analyze data. They evaluate the experiment andmake inferences about how pollution affects the environment.
Ohio Proficiency Test Learning OutcomesGrade 4, Mathematics #24 – Make or use a table to record and sort information (in aproblem-solving setting using simple and complex patterns in nature, art, poetry as set-ting) and make identifications, comparisons and predictions from tables, picture graphs,bar graphs and labeled picture maps.
Grade 4, Science #6 – Evaluate a simple procedure to carry out an exploration.
Grade 4, Science #9 – Demonstrate an understanding of safe use of materials and/ordevices in a science activity.
Grade 4, Science #14 – Identify and/or describe the relationship between human activityand the environment.
Grade 6, Science #2 – Identify the potential hazards and/or precautions involved in scientific investigation.
Grade 6, Science #5 – Evaluate conclusions based on scientific data.
Grade 6, Science #17 – Analyze the impacts of human activity on the ecosystems of theEarth.

Windows on Waste - TECHNO-FILL VII Help Contents Back
▼
▼
191©Ohio Department of Natural Resources Help Contents Back
▼
▼
191
Background Information
Burying garbage is themost popular method ofsolid waste disposal inthe industrialized world,except in a few countriesin Europe where inciner-
ation is widely used.During the past two decades, the
number of landfills and open dumpshas been decreasing in the UnitedStates. Ohio reflects that trend; in1996, there were 75 landfills operatingin the state, down from 300 in 1971.This reduction can be attributed toseveral factors, including stricter envi-ronmental standards that have forcedthe closing of many older landfills;greater difficulty in siting solid wastefacilities; and the development of newlandfills that are larger and mustinclude costly pollution control technology.
As our industrial consumer soci-ety has developed throughout the20th century, governments realizedthat the old technologies for buryingand burning refuse created pollutionproblems, which threatened the quali-ty of life, particularly in densely popu-lated urban ecosystems. Open dump-ing attracted vermin, mosquitoes andpathogenic bacteria. Additionally,run-off from open dumps could con-taminate soil and water, and methanegas migration could create fires andexplosions.
Landfills were initially developedto reduce the hazards of open dumpsby compacting and covering refusewith soil. However, it was soon dis-covered that the potential for groundwater pollution and methane gas migration still existed.
In order to solve the potential
problems of traditional disposal facili-ties, new standards were developed inthe 1970s that motivated waste man-agement businesses and civil engi-neers to develop new technologies forwaste disposal. The modern sanitarylandfill has become an importantcomponent in solid waste management.
However, much of the waste thatis disposed in the U.S. is buried inlandfills that still do not meet thestandards for environmental protec-tion provided by the modern sanitarylandfill. On the other hand, olderfacilities are being closed as states andlocal governments are being pressuredby the U.S. EPA and its supportingagencies to revise their programs.
Ohio has adopted strict standardsfor the construction and operation ofnew landfills including restricting the
Leachate Collection SystemGround WaterMonitoring Well
Lift Station andPumps for Leachate
LeachateTreatment
Daily Cover ➔
MSW (Refuse) ➔
Synthetic Liner ➔
Drainage Layer with Perforated Pipes ➔
Clay ➔
Ground Water ➔
Vent or Flare OR
Gas Recovery
CapSystem
LinerSystem
Vegetation ➔Granular Drainage ➔Recompacted soil ➔

Windows on Waste - TECHNO-FILL VII Help Contents Back
▼
▼
192©Ohio Department of Natural Resources Help Contents Back
▼
▼
192
building of landfills near water supplysources in geologically unfavorablelocations and near recreation areas.Provisions must be made to protectand monitor ground water, inhibitsoil pollution and erosion, and moni-tor methane gas migration. Newrequirements for the construction oflandfills in Ohio include many “bestavailable” technologies and opera-tional methods characteristic of themodern sanitary landfill. Great care istaken in the construction and opera-tion of a sanitary landfill to ensurethat the potential environmental andhealth hazards associated with opendumps and traditional landfills arecontrolled.
A modern state-of-the-art landfillis composed of various systems, eachaddressing specific problems. Covermaterial, usually soil or a syntheticmaterial, is spread over refuse daily toprotect against vermin and blowingdebris. Methane is vented to preventexplosion, and sometimes it is cap-tured and sold as an energy source.
A drainage system is constructedto collect a potentially hazardous sub-stance leachate, which forms insidethe landfill. This system usually con-sists of perforated pipes placed abovea liner in drainage layers filled withsand or gravel. To prevent leachatefrom percolating into aquifers, linersystems of clay and synthetic materi-als are used to trap the liquid. Pipes,connecting to a pump, carry the liq-uid to a holding pond for treatmentand disposal. In order to monitor forsigns of pollution, water wells andmethane probes are dug around the
waste. When a landfill has reachedcapacity, it must be properly cappedto keep moisture from seeping intothe buried material.
Several factors contribute to thepotential for leachate to become haz-ardous in a landfill. Residues andunused portions of household haz-ardous products, such as cleaners, sol-vents, motor oil and antifreeze, aresources of potentially harmful chemi-cals that mix into leachate. As organicwaste breaks down, and as metalseventually oxidize and plasticsdegrade with all their additives, thepotential exists for further contribu-tions of toxic material. However, it isdifficult to know the exact nature ofand potential for pollution problemswithout knowing the specific materi-als and conditions that exist at anygiven site.
Although modern facilities maycontain the best available technologyas required by law, it is not certainhow completely these new landfillsprotect the environment, especially inregards to air quality and groundwater. For example, some laboratorytests reveal that clay liners can crackand plastic liners can tear under pressure.
Finally, modern landfills virtuallyentomb waste because it is very diffi-cult for the waste to decompose,whereas that used to be the naturalprocess at open dumps. By relying onmodern landfills for disposing somuch of our waste material, we areliterally storing our waste, rather thanallowing it to degrade or be recoveredfor reuse.
Bibliography and Additional ResourcesStudent Resources
Science Projects: Local Science projectsthat use recyclables as materials, byGennie Davis, North Central OhioSolid Waste Management District,Lima, Ohio.
Educator Information
The Museum of Solid Waste andEnergy, “Station 8, Landfilling” TheNational Energy EducationDevelopment (NEED) Project.(703) 860-5029.
Rodale’s Illustrated Encyclopedia ofGardening and LandscapingTechniques, Barbara W. Ellis, Ed.,Pennsylvania: Rodale Press, 1990.
Background Information, continued

Windows on Waste - TECHNO-FILL VII Help Contents Back
▼
▼
193©Ohio Department of Natural Resources Help Contents Back
▼
▼
193
ProcedureHave students draw a picture of
the place where their garbage goes andlabel the parts. Collect and set aside forlater use.
Have students read the handout,Techno-Pollution Prevention, and com-plete the handout, Mix and Match WasteGame.
ANSWERS to Mix and Match WasteGame: 1. c, 2. a, 3. b, 4. e, 5. h, 6. g, 7. i,8. d, 9. f, 10. j
After students have completed thehandout, review the words and the cor-rect answers.
Have students complete the WasteWord Search handout. Students shouldbe familiar with the vocabulary wordsby now and able to identify the words ina reasonable amount of time.
Ask students how their lifestylesaffect the environment based on habitsof consumption and waste generated.
See p. VII-8 for ANSWERS to WasteWord Search.
Assessment The handout, Mix and Match
Waste Game, can be used as a pre- andpost-test. Have students complete thehandout before and after they have readthe background information to assesshow much they learned.
Have students draw another pic-ture of the place where their garbagegoes and label the parts of it. Comparewith their original drawings.
2
1
5
4
3
2
1
Inquiry● How can waste be disposed
of safely?
Content DomainReading – Reading compre-hension
Science – General science,physical science, earth science
Learning OutcomesReading, Grade 4, #14, #17 andGrade 6, #12
Science, Grade 4, #14 andGrade 6, #4
Duration45 minutes
Materials Writing and drawing materials
Handouts● Techno-Pollution Prevention
● Mix and Match Waste Game
● Waste Word Search
Landfill LingoObjectivesStudents will be able to: (a) compare the old method of disposing waste to the newtechnology used in a modern waste disposal facility; (b) explain the different compo-nents of a sanitary landfill; and (c) describe how human activity can affect the envi-ronment when waste is improperly disposed.
Act
ivity
1TECHNO-FILL

Windows on Waste - TECHNO-FILL VII Help Contents Back
▼
▼
194©Ohio Department of Natural Resources Help Contents Back
▼
▼
194
B D E G H J L M C A C E G E H I J W X Y
T R T Y A N S D M O A T O V H M E A W O
R L E A C H A T E D N S D I E S C R I P
T I C O N C N O M A L S U S M L E F E R
G H H T O P I O L L B O T O O D G E R T
I O N N I F T L A M A U S R E D G A R B
P L O O N S A O N U O M S R U O R R L E
A C L H G I R E V O E N S O I C E N T I
F I O C O M Y E H T O X I C D P T U R P
O S G E C O L N H A M I N G A T O I N D
I S Y O S L A A S O L A L R O F H A O R
M F U L M I N P R O P S U B S T A N A N
C T I F U E D L W A S E A R B Y P R O C
C L R T G Y F B U R I E S U R R O U N D
A I N A L B I O D E G R A D A T I O N D
F I S C E L L L D U G T H A P L A B A G
E G A R C C L A Y S O I L A F T R L E T
S C C L L A A W H E I S S I C R I A C E
Key to Waste Word Search, page VII-11
Windows on Waste - TECHNO-FILL VII Help Contents Back
▼
▼
195©Ohio Department of Natural Resources Help Contents Back
▼
▼
195
Student Handout ✐
From dumps to landfills
Not long ago the waste created by the averagehousehold was put into a pit or field calleda dump. Most cities or villages had theirown dumps. Trash was trucked daily to the
dump, and occasionally, some soil was thrown on topof the trash to cover it, so rats and other vermin wouldnot be attracted to the site. However, other problemsstill existed.
Toxic materials in trash can seep into the soil and findtheir way into groundwater, contaminating wells andother sources of drinking water. This sometimes hap-pened when trash was placed in an open dump.Because of contamination, the open dumps of the pasthave been replaced with sanitary landfills, which usemodern technology to protect our water supply andprevent other problems.
Because of the hazards of rats, flies, mosquitoes and airand water pollution concerns, laws were enactedrequiring the use of “best available” technology in theconstruction of new landfills.
Trash is still buried in a hole dug in the earth, alsocalled a cell, but the method used to construct and pre-pare the cell before waste is disposed, is very differentfrom the old method.
How do you build a sanitary landfill?It takes several years of planning to design and site asanitary landfill. The landfill’s plan is presented to gov-ernmental agencies and local residents, who must beconvinced of the need for and the safety of the pro-posed landfill. Once approved by local and state agen-cies, construction begins.
Soil and linerFirst, the cell is dug and lined with at least 5 feet ofclay soil along the sides and bottom of the cell. Theclay is then compacted to make it strong and firm.
Then a plastic liner, which must be very strong, isplaced on top of the clay soil. Because heavy equip-ment will drive over the trash to compact it in the cell,the liner must be able to withstand the weight of thetrash and the pressure of the trash being compacted.
The liner must also be waterproof and chemical-proof.It must keep all of the toxic and corrosive chemicalswe throw away (such as bleach, insect spray, householdcleaners, oil, etc.) from destroying the liner. The linermust be able to retain the rainwater that tricklesthrough the trash, because when rainwater mixes withall of the chemicals in the garbage it creates a poten-tially toxic liquid called leachate.
Leachate collection systemA network of pipes collects the leachate at the bottomof the cell and pumps it to the surface of the cell whereit is then transferred into a pond or storage tank. Theleachate is either treated at the landfill or transportedto a sewage treatment plant. At the treatment plant, thetoxic or poisonous substances are removed from thepolluted water so the water is safe to use again.
Methane gas controlLandfills contain organic matter like leaves and food.The process of decaying organic matter is calledbiodegradation. Biodegradation (when microorgan-isms chemically break down dead plant and animalmatter) produces a gas called methane. Methane gas iscolorless and odorless, but it has the potential to bedangerous to people and the environment. Methanegas can catch fire and also explode under certain con-ditions. New rules require that pipes run down into acell, which allows methane gas to escape. Sometimesthe gas is captured and used as a fuel to produce ener-gy. Sometimes it is burned off to keep it from escapinginto the environment.
Now you can understand why we call a modern sani-tary landfill a pollution prevention technology.
Techno-Pollution Prevention

Windows on Waste - TECHNO-FILL VII Help Contents Back
▼
▼
196©Ohio Department of Natural Resources Help Contents Back
▼
▼
196
Student Handout ✐
Mix and Match Waste GameDirections: Match the words in the left column to the descriptions in the right column.
_____ sanitary landfill A. dirty water that collects after rain runs through a landfill
_____ leachate B. the actual hole, dug in the ground, where waste is buried
_____ cell C. a facility where garbage is buried to protect ourwater and surrounding environment
_____ methane gas D. harmful
_____ corrosive E. odorless, colorless, flammable gas
_____ clay soil F. a method of solving a problem by using materials and machines
_____ biodegradation G. firm earth, made up of very small particles used in the construction of sanitary landfills
_____ toxic H. wearing away by chemical action
_____ technology I. the process of natural material breaking down and decaying
_____ construction J. the act of building something10
9
8
7
6
5
4
3
2
1

Windows on Waste - TECHNO-FILL VII Help Contents Back
▼
▼
197©Ohio Department of Natural Resources Help Contents Back
▼
▼
197
Student Handout ✐
Waste Word SearchDirections: The vocabulary words in this unit are hidden below. Circle as many of the waste words asyou can find. WORDS CAN BE DIAGONAL, BACKWARDS, ACROSS, UP OR DOWN. If an answer is twowords (clay soil) the space between words has been left out.
biodegradation
cell
clay soil
construction
corrosive
leachate
methane gas
sanitary landfill
technology
toxic
B D E G H J L M C A C E G E H I J W X Y
T R T Y A N S D M O A T O V H M E A W O
R L E A C H A T E D N S D I E S C R I P
T I C O N C N O M A L S U S M L E F E R
G H H T O P I O L L B O T O O D G E R T
I O N N I F T L A M A U S R E D G A R B
P L O O N S A O N U O M S R U O R R L E
A C L H G I R E V O E N S O I C E N T I
F I O C O M Y E H T O X I C D P T U R P
O S G E C O L N H A M I N G A T O I N D
I S Y O S L A A S O L A L R O F H A O R
M F U L M I N P R O P S U B S T A N A N
C T I F U E D L W A S E A R B Y P R O C
C L R T G Y F B U R I E S U R R O U N D
A I N A L B I O D E G R A D A T I O N D
F I S C E L L L D U G T H A P L A B A G
E G A R C C L A Y S O I L A F T R L E T
S C C L L A A W H E I S S I C R I A C E

Windows on Waste - TECHNO-FILL VII Help Contents Back
▼
▼
198©Ohio Department of Natural Resources Help Contents Back
▼
▼
198
PreparationCollect enough soil from your yard orschool ground to fill as many jars (half-full) as you plan on using. You mightalso obtain soil samples from your localSoil and Water Conservation Districtoffice or Extension office. Use a samplethat includes sand, silt and clay parti-cles. You can usually obtain clay fromaround the foundation of a buildingwhere the soil has been removed for abasement. If you think the soil in yourarea doesn’t contain enough sand, addbuilders or sandbox sand to the sample.
You can do this experiment as a classwith one jar or have each student bringin a jar. The jar should be clear, and thesame size at the top as the bottom andhave a tight-fitting lid.
If you want students to see the differentparticle sizes after you separate the soilparticle types, you can use a microscopeto see the silt and clay particles.
ProcedureRead the handout, It’s Not Just
Dirt, to the class or have students readit. You may want to cover the bottom ofit, and have students make inferencesbefore reading it. Remind students theywill be determining if the soil at a cer-tain site would be suitable soil for use inthe construction of a modern landfill.
Fill the jar two-thirds full of water,add the soil and detergent, and fastenthe lid securely. Shake the jar vigorouslyfor 10 to 15 minutes. The sand particlesare the largest and heaviest and will set-tle to the bottom of the jar within min-utes. Mark the jar with a crayon at theend of one minute to indicate the levelof sand. After two hours most of the siltwill have settled; so make a secondmark on the side of the jar to indicatethe level of silt. Clay particles are tinyand will require a few days to settle;when the water is clear the particleshave all settled. Finally, on the jar, markthe level of clay.
2
1
Does Your Soil Leak?ObjectivesStudents will be able to: (a) identify different types of soil particles; (b) describe whyclay soil is used in the construction of a modern landfill; (c) classify types of soil bytesting soil samples; and (d) determine if soil is suitable for use in landfill construc-tion by measuring and calculating a fractional analysis.
Act
ivity
2Inquiries● What is soil?
● How can different soils bedefined?
● Which type of soil is themost suitable to use in theconstruction of a modernlandfill?
Content DomainLanguage Arts – Reading com-prehension
Math – Arithmetic
Science – Earth science
Learning OutcomesMath, Grade 4, #7 and Grade 6, #6
Reading, Grade 4, #14, #17 andGrade 6, #12
Science, Grade 4, #2, #8 andGrade 6, #3
DurationTwo to three days
Materials To perform your own at-schoolsoil fractional analysis, you’llneed the following supplies:clear jar with a tight-fittinglid; 1 cup of finely pulverizedsoil (use a mallet or rolling pinto pulverize it); 1 teaspoon ofnon-sudsing, low phosphatedishwasher detergent; watchor clock; crayon or greasepencil
Handouts● It’s Not Just Dirt
● Does Your Soil Leak?
TECHNO-FILL

Windows on Waste - TECHNO-FILL VII Help Contents Back
▼
▼
199©Ohio Department of Natural Resources Help Contents Back
▼
▼
199
To determine the percentage ofeach type of particle, use the follow-ing formula:
A equals the thickness of the sand
B equals the thickness of the silt
C equals the thickness of the clay
D equals the thickness of all threedeposits
● To calculate the percentage of sand,multiply A by 100 and divide by D.
● To calculate the percentage of silt,multiply B by 100 and divide by D.
● To calculate the percentage of clay,multiply C by 100 and divide by D.
If your soil sample contains 40-60percent clay particles, it is consideredclay soil. The higher the percentage ofclay particles, the more suitable it isfor lining a landfill.
AssessmentCompleting the fractional analysisproblem correctly. Have studentscomplete the handout, Does Your SoilLeak?
ANSWERS to Does Your Soil Leak? 1. b, 2. d, 3. c, 4. a
3
A + B + C = D
Example:
Sand = A = 1⁄ 2"
Silt = B = 1⁄ 4"
Clay = C = 11⁄ 4"
Total = D = 2"
A = 12
"x
100l =
1002 = 50 ÷ 2 = 25%
B = 14
"x
100l =
1004 = 25 ÷ 2 = 12.5%
C = 114
"x
100l =
54 x
100l =
5004 = 125 ÷ 2 = 62.5%

Windows on Waste - TECHNO-FILL VII Help Contents Back
▼
▼
200©Ohio Department of Natural Resources Help Contents Back
▼
▼
200
Student Handout ✐
When constructing a sanitary landfill, the first step after the cell is dug in the ground is to line the cell
bottom and sides with at least 5 feet of tightly compacted clay soil. Clay soil is used because of its tex-
ture and structure. The particles are very small and pack together tightly. This helps to keep water and
toxins from draining through and polluting ground water.
Constructing a modern landfill where the soil deposits are high in clay content is an advantage,
because there is plenty of soil to use for the soil liner, which acts as a natural buffer between the land-
fill and the surrounding environment.
S oil is composed of organic and inor-
ganic matter. Organic matter in soil
comes from plants and animals as they
die and decay back into the ground.
Inorganic matter comes from minerals that resem-
ble tiny pieces of rock-like material.
The mineral portion of almost every soil contains
sand, silt and clay. The percentage of each of these
types determines the soil’s texture. Texture refers to
the size of particles that make up soil. Structure
refers to the way the soil particles fit together. Soil
particle texture and structure are very important in
determining where a landfill is situated.
Sand particles are the largest and most irregular in
shape and measure from 1⁄ 50 to 1⁄ 500 of an inch.
Sandy soil doesn’t have much clay or organic mat-
ter. Even when wet, the soil particles don't stick
together and have large spaces between them, which
causes it to drain very quickly.
Silt particles range from 1⁄ 500 to 1⁄ 12,500 of an inch.
Silty soil tends to have a large percentage of small
particles although they are generally larger than the
particles in clay soil. The small particles fit together
densely and drain slowly, but more quickly than soil
with a high percentage of clay particles.
Clay particles are the smallest and are less than1⁄12,500 of an inch. Soil dominated by 40 to 60 per-
cent clay, becomes sticky and practically unwork-
able when wet, and hard and cloddy when dry. The
spaces between the particles are so small that clay
soil becomes completely waterlogged when wet.
Clay soil drains slowly. Because of the small size of
the particles, the soil compacts very well and con-
tains very little space for water to drain through.
Clay soil is also generally low in organic matter.
Do you know which type of soil would be the best
to use at the bottom of a landfill?
It’s Not Just Dirt!

Windows on Waste - TECHNO-FILL VII Help Contents Back
▼
▼
201©Ohio Department of Natural Resources Help Contents Back
▼
▼
201
Student Handout ✐
Does Your Soil Leak?Directions: Put the letter of the correct response in the blank space beside each question.
_______1. Soil consists of three major types of soil particles. These soil particles are differentsizes. Which type of soil particle is the smallest?
a. silt
b. clay
c. sand
d. organic matter
_______ 2. When constructing a sanitary landfill, a hole or cell is dug and then lined with thebest type of soil. How many feet of soil are used to line the landfill cell?
a. 2 feet
b. 12 feet
c. 4 feet
d. 5 feet
_______ 3. Look at the jar of soil you used to do your experiment. The lines on the jar mark theseparation of the three different types of soil particles. Which type of soil particleis the heaviest?
a. clay
b. organic matter
c. sand
d. silt
_______ 4. If the soil with the smallest particle size is the best soil to use as the soil liner in the construction of a sanitary landfill, which type of soil particle is used?
a. clay
b. sand
c. silt
d. organic matter
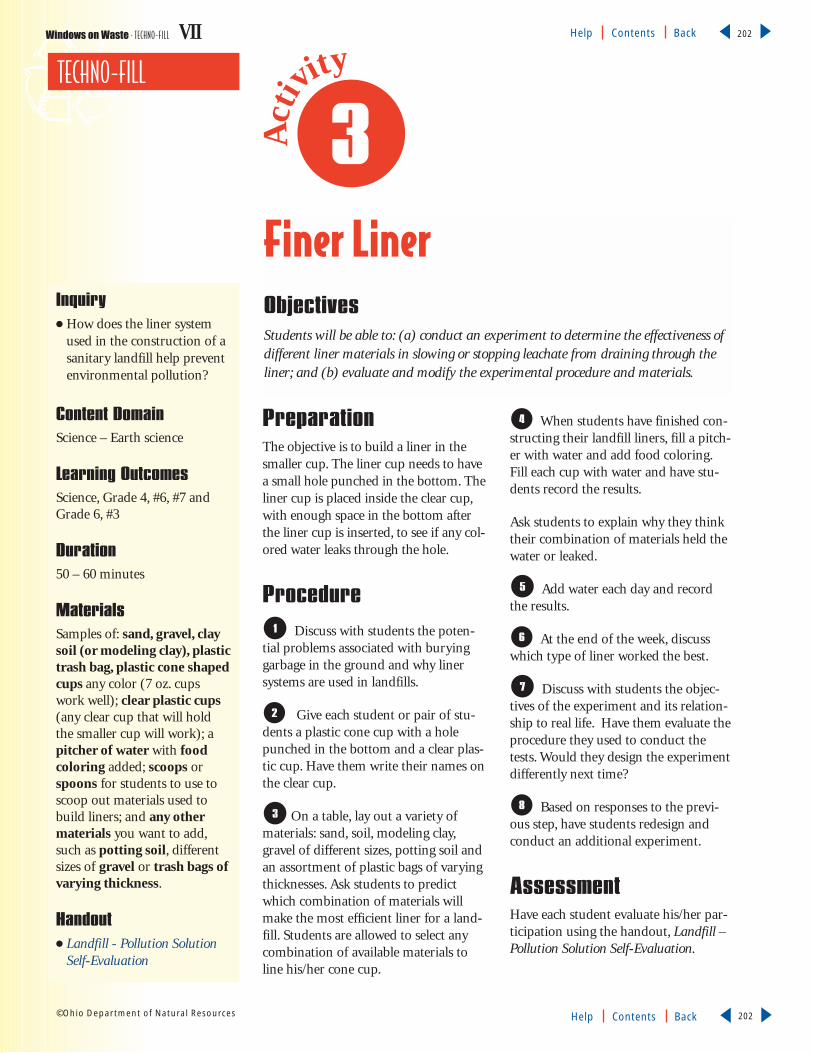
Windows on Waste - TECHNO-FILL VII Help Contents Back
▼
▼
202©Ohio Department of Natural Resources Help Contents Back
▼
▼
202
PreparationThe objective is to build a liner in thesmaller cup. The liner cup needs to havea small hole punched in the bottom. Theliner cup is placed inside the clear cup,with enough space in the bottom afterthe liner cup is inserted, to see if any col-ored water leaks through the hole.
ProcedureDiscuss with students the poten-
tial problems associated with buryinggarbage in the ground and why linersystems are used in landfills.
Give each student or pair of stu-dents a plastic cone cup with a holepunched in the bottom and a clear plas-tic cup. Have them write their names onthe clear cup.
On a table, lay out a variety ofmaterials: sand, soil, modeling clay,gravel of different sizes, potting soil andan assortment of plastic bags of varyingthicknesses. Ask students to predictwhich combination of materials willmake the most efficient liner for a land-fill. Students are allowed to select anycombination of available materials toline his/her cone cup.
When students have finished con-structing their landfill liners, fill a pitch-er with water and add food coloring.Fill each cup with water and have stu-dents record the results.
Ask students to explain why they thinktheir combination of materials held thewater or leaked.
Add water each day and recordthe results.
At the end of the week, discusswhich type of liner worked the best.
Discuss with students the objec-tives of the experiment and its relation-ship to real life. Have them evaluate theprocedure they used to conduct thetests. Would they design the experimentdifferently next time?
Based on responses to the previ-ous step, have students redesign andconduct an additional experiment.
Assessment Have each student evaluate his/her par-ticipation using the handout, Landfill –Pollution Solution Self-Evaluation.
8
7
6
5
4
3
2
1
Finer LinerObjectivesStudents will be able to: (a) conduct an experiment to determine the effectiveness ofdifferent liner materials in slowing or stopping leachate from draining through theliner; and (b) evaluate and modify the experimental procedure and materials.
Act
ivity
3
Inquiry● How does the liner system
used in the construction of asanitary landfill help preventenvironmental pollution?
Content DomainScience – Earth science
Learning OutcomesScience, Grade 4, #6, #7 andGrade 6, #3
Duration50 – 60 minutes
Materials Samples of: sand, gravel, claysoil (or modeling clay), plastictrash bag, plastic cone shapedcups any color (7 oz. cupswork well); clear plastic cups(any clear cup that will holdthe smaller cup will work); apitcher of water with foodcoloring added; scoops orspoons for students to use toscoop out materials used tobuild liners; and any othermaterials you want to add,such as potting soil, differentsizes of gravel or trash bags ofvarying thickness.
Handout● Landfill - Pollution Solution
Self-Evaluation
TECHNO-FILL
Windows on Waste - TECHNO-FILL VII Help Contents Back
▼
▼
203©Ohio Department of Natural Resources Help Contents Back
▼
▼
203
Student Handout ✐
Landfill—Pollution Solution Self-Evaluation
Directions: Read each statement and answer honestly. Using the code, place a 0, 1 or 2 in the space provided by each statement. Write a paragraph about what you learned from completing the activity.
Code: 2 = often1 = sometimes 0 = never
____________ I followed instructions (including safety rules) carefully.
____________ I actively participated in the activity.
____________ I participated in class discussion.
____________ I completed all tasks to the best of my ability.
____________ I helped clean up after the activity.
As a result of completing this activity, I learned the following:
___________________________________________________________________________________
___________________________________________________________________________________
___________________________________________________________________________________
___________________________________________________________________________________
___________________________________________________________________________________
___________________________________________________________________________________
If you need additional space, use the back of the sheet.

Windows on Waste - TECHNO-FILL VII Help Contents Back
▼
▼
204©Ohio Department of Natural Resources Help Contents Back
▼
▼
204
ProcedureDivide students into six groups.
Give each group a label - A through F.Each group will need a cup or contain-er, potting soil, jar with lid, plant, waterand one of the five household chemi-cals. Give one group water only.
Have students label each cup. Forexample: Group A-control, Group B-bleach, Group C-dish soap, Group D-cooking oil, Group E- window cleanerand Group F-drain cleaner. Discusswith students proper safety precautionswhen handling potentially hazardousmaterials in an experiment. Refer toAppendix C in Ohio’s Competency BasedScience Program.
Have groups fill their jars in thefollowing order: Fill Jar A with plainwater. Fill Jar B with 5 parts water to 1part bleach. Fill Jar C with 5 parts waterto 1 part dish soap. Fill Jar D with 5parts water to 1 part cooking oil. Fill
Jar E with 5 parts water and 1 part win-dow cleaner. Fill Jar F with 5 parts waterto 1 part drain cleaner.
Have students fill their cups withpotting soil, and place their plants in thecontainer.
Have students water the plantswith the water jar that matches theirgroup's letter. Water Group A's plantwith water from Jar A, and so on. Waterall of the plants once or twice eachweek, always using the same measure-ment of water for each plant. Keep theplants in a sunny place, such as a win-dowsill, and keep the room temperatureconsistent for each plant.
NOTE: Use extreme caution when han-dling dangerous materials. Keep allwatering jars away from students, dis-tribute them when watering is neededand monitor watering closely. Considerwatering the plants for younger stu-dents.
5
4
3
2
1
Life...Without PollutionPreventionObjectives
Students will be able to: (a) identify potential hazards in scientific investigation anddemonstrate safe use of materials; (b) evaluate a scientific procedure; and (c) collectand evaluate scientific data about potential pollution problems associated with theimproper disposal of waste materials.
Act
ivity
4Inquiry● How can pollutants in our
water affect living organismsin the environment?
Content DomainMath
Science – General science,biology
Learning OutcomesMath, Grade 4, #24
Science, Grade 4, #6, #9, #14and Grade 6, #2, #5, #17
DurationTwo to four weeks
Materials Six plant containers (plasticcups or clean margarine con-tainers), six plants of the samesize and type; six jars withlids; five different commonhousehold chemicals (exam-ples: bleach, dish soap, cookingoil, window cleaner, draincleaner); water; potting soil
Handouts● Toxic Soup
● Toxic Soup Evaluation
● Experiment Group Evaluation
TECHNO-FILL

Windows on Waste - TECHNO-FILL VII Help Contents Back
▼
▼
205©Ohio Department of Natural Resources Help Contents Back
▼
▼
205
Set up a chart listing A throughF for each plant. Keep track of thedates the plants were watered andhow much water was used. Also, mea-sure the growth of the plant (if any).Chart plant growth and general con-ditions of the plant (good, fair, poor,dead). Students in each group shouldtake turns caring for plants and chart-ing. Final data can be represented byhaving students construct a picture,bar or line graph.
Have students continue to waterand chart or graph plant data for twoto four weeks, depending on thelength of time you have to completethe activity.
Discuss the results and followingquestions with the class.
● How many plants are still alive?
● What is the condition of each plant?
● What might happen to the groundwater if appropriate pollution pre-vention technology isn’t used?
● Would plant life be at risk?
● Would people and animals be atrisk?
● What role does the liner at the bot-tom of the landfill cell play in pre-venting pollution?
Discuss the nature of the experi-ment and how the results might varyif different procedures were used.Groups could change variables such asdifferent types of plants, differentconcentrations of water and chemi-cals, different environmental conditions, such as low light, highlight, cool temperatures, hot temperatures, etc.
Give students the handout, ToxicSoup, to read. Then have them com-plete the handout, Toxic SoupEvaluation.
Rubric: Total possible points - 12
0 = inaccurate explanation
1= provides partially accurate explanation
2 = provides accurate explanationbut not well written
3= provides well written and accu-rate explanation
Assessment Assessment is accomplished by com-pleting and charting the experiment’sresults and completing the handout,Experiment Group Evaluation.
10
9
8
7
6

Windows on Waste - TECHNO-FILL VII Help Contents Back
▼
▼
206©Ohio Department of Natural Resources Help Contents Back
▼
▼
206
Student Handout ✐
Toxic Soup
When rain or surface water comes in con-
tact with decomposing waste, a poten-
tially harmful substance called leachate
is created. Leachate, if it drains through
the bottom of a landfill or dump, may
reach ground water. If leachate reaches an impermeable
layer of rock or soil, it may flow on top of the layer and
drain out of the ground into a waterway. Hazardous substances, when disposed at an
improperly maintained landfill or dump, can run along the top of the ground and reach
waterways. In order to protect our underground water sources, it is important that our
landfills are designed and constructed properly.
Ohio law requires the construction of “best available” technology landfills. In a best
available technology landfill, a clay soil liner, plastic liner and a leachate collection sys-
tem are required. The liners are needed to trap leachate and keep it from reaching
ground water sources. Once leachate develops in a landfill cell, it must be drained from
the cell or over time it could eventually fill up and overflow. That is why a leachate
collection system is necessary. It captures leachate through a network of pipes laid on
the bottom of the cell. A pump moves leachate up off the cell floor. The leachate is
either treated on-site or transported to a sewage treatment plant, where harmful chemi-
cals and organisms are removed and the water is made safe to use again.
However, for various reasons, toxic substances are not always
removed or properly treated, and they can be discharged into con-
necting waterways (a creek, stream, river, or lake). In a sewage treat-
ment plant, sometimes hazardous wastes kill the living organisms that
feed on the harmful bacteria in organic waste. Therefore, it is very impor-
tant that pollution be controlled as much as possible at the landfill site, so it does not
spread to the rest of the environment.
Windows on Waste - TECHNO-FILL VII Help Contents Back
▼
▼
207©Ohio Department of Natural Resources Help Contents Back
▼
▼
207
Student Handout ✐
Toxic Soup EvaluationDirections: Read the handout, Toxic Soup, and answer the questions below.
1. How is leachate created?
____________________________________________________________________________________
____________________________________________________________________________________
____________________________________________________________________________________
____________________________________________________________________________________
____________________________________________________________________________________
____________________________________________________________________________________
2. Currently, Ohio law requires that the “best available” technology be used when building new landfills.In the handout, Toxic Soup, three components of “best available” technology are mentioned; one is aclay soil liner. What are the other two components?
(1) _________________________________________________________________________________
(2) _________________________________________________________________________________
3. How is leachate removed from a landfill and what is done with it?
____________________________________________________________________________________
____________________________________________________________________________________
____________________________________________________________________________________
____________________________________________________________________________________
____________________________________________________________________________________
____________________________________________________________________________________
4. How can leachate affect the environment if it isn’t properly contained?
____________________________________________________________________________________
____________________________________________________________________________________
____________________________________________________________________________________
____________________________________________________________________________________
____________________________________________________________________________________

Experiment Group EvaluationCode: 2 = most of the time
1 = sometimes 0 = never
Directions: Read each statement and using the code, place a 0, 1 or 2 in the space provided by eachstatement. Write a paragraph about what your group learned from completing the activity. Discuss withyour group, ways you could improve your work as a group and write in the space provided.
Activity _________________________________________ Date _____________________________
Group Members:
____________ We followed directions carefully.
____________ We used materials safely.
____________ We worked well together and got along as a group.
____________ We all had a role in the group.
____________ We took turns collecting and organizing data on the chart.
____________ We helped clean up after the activity.
Our group acquired the following ideas or skills as a result of this activity:
____________________________________________________________________________________
____________________________________________________________________________________
____________________________________________________________________________________
We could improve our work as a group by:
____________________________________________________________________________________
____________________________________________________________________________________
If you need additional space, use the back of the sheet.
Windows on Waste - TECHNO-FILL VII Help Contents Back
▼
▼
208©Ohio Department of Natural Resources Help Contents Back
▼
▼
208
Student Handout ✐

Windows on Waste - G A R B A G E G O O D S VII Help Contents Back
▼
▼
209©Ohio Department of Natural Resources Help Contents Back
▼
▼
209
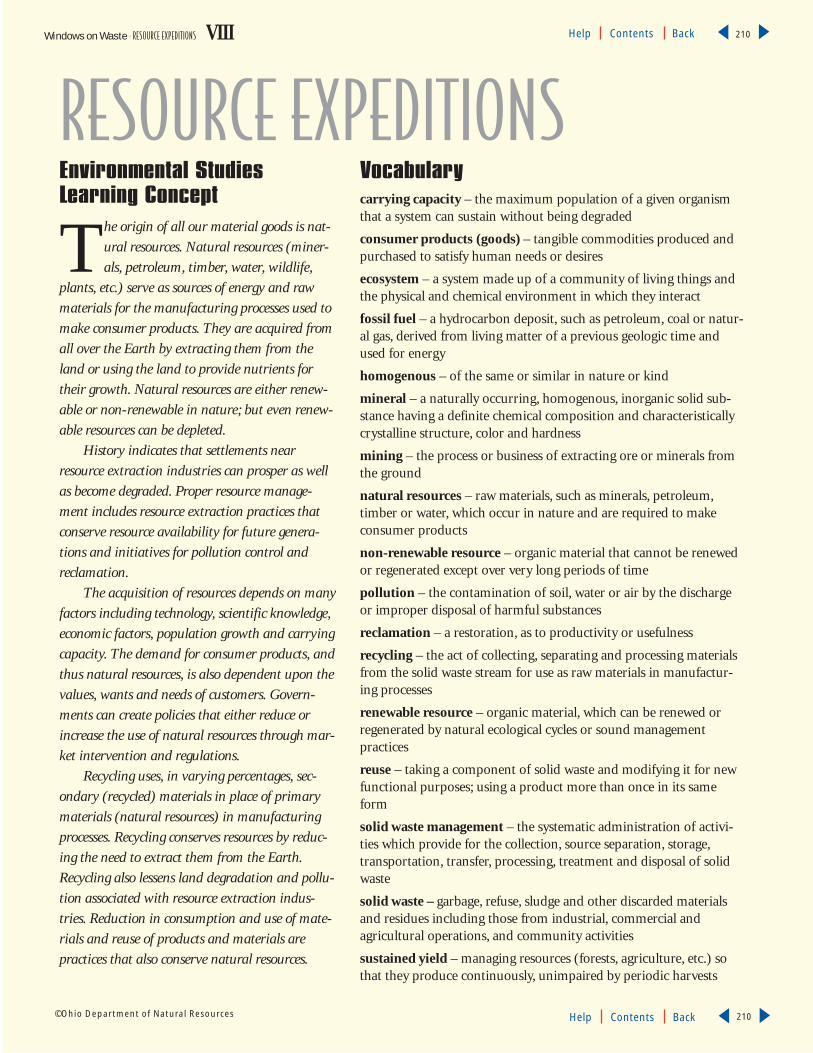
Environmental StudiesLearning Concept
The origin of all our material goods is nat-
ural resources. Natural resources (miner-
als, petroleum, timber, water, wildlife,
plants, etc.) serve as sources of energy and raw
materials for the manufacturing processes used to
make consumer products. They are acquired from
all over the Earth by extracting them from the
land or using the land to provide nutrients for
their growth. Natural resources are either renew-
able or non-renewable in nature; but even renew-
able resources can be depleted.
History indicates that settlements near
resource extraction industries can prosper as well
as become degraded. Proper resource manage-
ment includes resource extraction practices that
conserve resource availability for future genera-
tions and initiatives for pollution control and
reclamation.
The acquisition of resources depends on many
factors including technology, scientific knowledge,
economic factors, population growth and carrying
capacity. The demand for consumer products, and
thus natural resources, is also dependent upon the
values, wants and needs of customers. Govern-
ments can create policies that either reduce or
increase the use of natural resources through mar-
ket intervention and regulations.
Recycling uses, in varying percentages, sec-
ondary (recycled) materials in place of primary
materials (natural resources) in manufacturing
processes. Recycling conserves resources by reduc-
ing the need to extract them from the Earth.
Recycling also lessens land degradation and pollu-
tion associated with resource extraction indus-
tries. Reduction in consumption and use of mate-
rials and reuse of products and materials are
practices that also conserve natural resources.
Vocabularycarrying capacity – the maximum population of a given organismthat a system can sustain without being degraded
consumer products (goods) – tangible commodities produced andpurchased to satisfy human needs or desires
ecosystem – a system made up of a community of living things andthe physical and chemical environment in which they interact
fossil fuel – a hydrocarbon deposit, such as petroleum, coal or natur-al gas, derived from living matter of a previous geologic time andused for energy
homogenous – of the same or similar in nature or kind
mineral – a naturally occurring, homogenous, inorganic solid sub-stance having a definite chemical composition and characteristicallycrystalline structure, color and hardness
mining – the process or business of extracting ore or minerals fromthe ground
natural resources – raw materials, such as minerals, petroleum,timber or water, which occur in nature and are required to make consumer products
non-renewable resource – organic material that cannot be renewedor regenerated except over very long periods of time
pollution – the contamination of soil, water or air by the dischargeor improper disposal of harmful substances
reclamation – a restoration, as to productivity or usefulness
recycling – the act of collecting, separating and processing materialsfrom the solid waste stream for use as raw materials in manufactur-ing processes
renewable resource – organic material, which can be renewed orregenerated by natural ecological cycles or sound management practices
reuse – taking a component of solid waste and modifying it for newfunctional purposes; using a product more than once in its sameform
solid waste management – the systematic administration of activi-ties which provide for the collection, source separation, storage,transportation, transfer, processing, treatment and disposal of solidwaste
solid waste – garbage, refuse, sludge and other discarded materialsand residues including those from industrial, commercial and agricultural operations, and community activities
sustained yield – managing resources (forests, agriculture, etc.) sothat they produce continuously, unimpaired by periodic harvests
RESOURCE EXPEDITIONSWindows on Waste - RESOURCE EXPEDITIONS VIII Help Contents Back
▼
▼
210©Ohio Department of Natural Resources Help Contents Back
▼
▼
210

Windows on Waste - RESOURCE EXPEDITIONS VIII Help Contents Back
▼
▼
211©Ohio Department of Natural Resources Help Contents Back
▼
▼
211
1
2
Activity 1: Show ‘Em SherlockDescriptionStudents cooperate in groups and analyze information in a mystery game to discoverwhich of five recyclable materials is their group’s identity. Each player is given a cluecard for one of the five materials and moves from station to station while student“super sleuths” at each station make inferences about the clue to decide if it representsthe correct material for his/her station. At each station, students share their clues andinterpret information to discover the nature (material) of their homogenous groupand solve the mystery. Students organize information about resources and materialsby using a dichotomous key. They make inferences from the information gatheredabout the effect of recycling upon the environment.
Ohio Proficiency Test Learning OutcomesGrade 4, Citizenship #11 – Name the resources needed to produce various goods and services.
Grade 4, Science #1 – Create and/or use categories to organize a set of objects, organismsor phenomena.
Grade 4, Science #4 – Use a simple key to distinguish between objects.
Grade 4, Science #14 – Identify and/or describe the relationship between human activityand the environment.
Grade 6, Science #1 – Use a simple key to classify objects, organisms and/or phenomena.
Grade 6, Science #17 – Analyze the impacts of human activity on the ecosystems of theEarth.
Activity 2: Mining and RecyclingDescriptionStudents read a list of consumer items and rank order the value of the items. Theyconduct research to identify the natural resources used to make their favorite item andfrom a list of resources used to make an automobile, they identify which materialsare common recyclables. Students manipulate materials to simulate a mining opera-tion using chocolate chip cookies. They analyze information and compute figures todetermine the financial and environmental costs of obtaining natural resources fromthe Earth.
Summary
This lesson includes two
activities. They may be
conducted separately;
however, the first activity pro-
vides a good background for the
second activity.
Overview - RESOURCE EXPEDITIONS
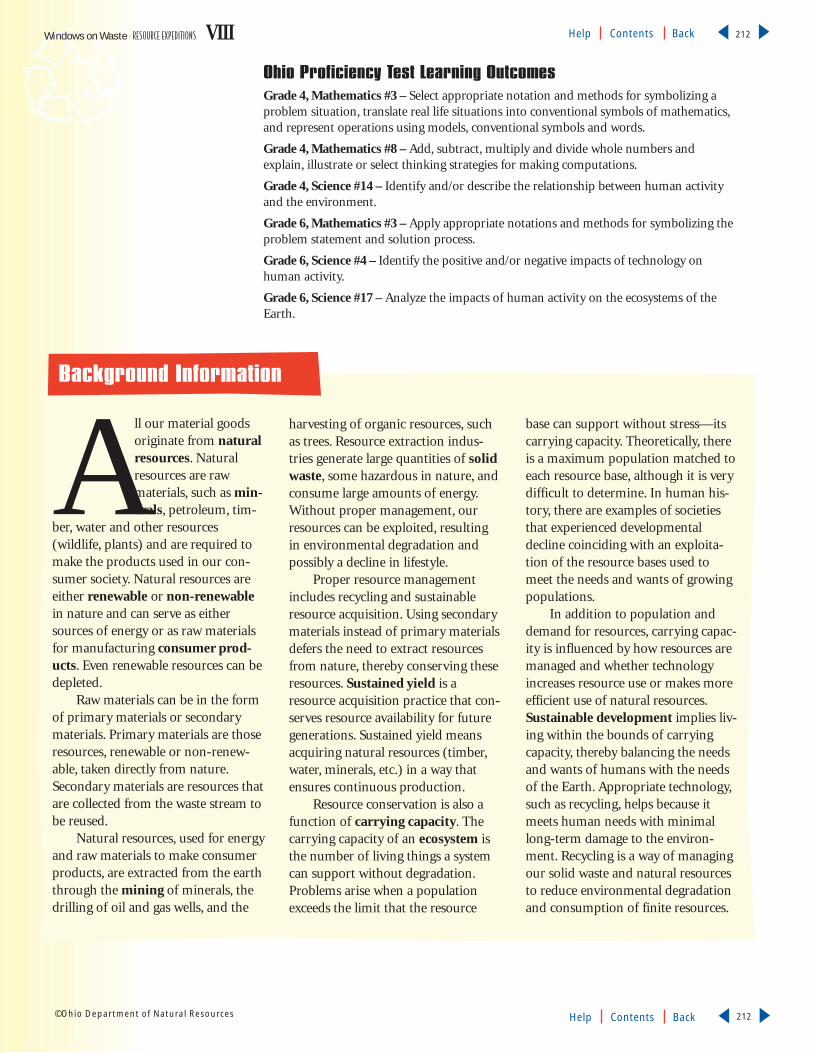
Windows on Waste - RESOURCE EXPEDITIONS VIII Help Contents Back
▼
▼
212©Ohio Department of Natural Resources Help Contents Back
▼
▼
212
All our material goodsoriginate from naturalresources. Naturalresources are rawmaterials, such as min-erals, petroleum, tim-
ber, water and other resources(wildlife, plants) and are required tomake the products used in our con-sumer society. Natural resources areeither renewable or non-renewablein nature and can serve as eithersources of energy or as raw materialsfor manufacturing consumer prod-ucts. Even renewable resources can bedepleted.
Raw materials can be in the formof primary materials or secondarymaterials. Primary materials are thoseresources, renewable or non-renew-able, taken directly from nature.Secondary materials are resources thatare collected from the waste stream tobe reused.
Natural resources, used for energyand raw materials to make consumerproducts, are extracted from the earththrough the mining of minerals, thedrilling of oil and gas wells, and the
harvesting of organic resources, suchas trees. Resource extraction indus-tries generate large quantities of solidwaste, some hazardous in nature, andconsume large amounts of energy.Without proper management, ourresources can be exploited, resultingin environmental degradation andpossibly a decline in lifestyle.
Proper resource managementincludes recycling and sustainableresource acquisition. Using secondarymaterials instead of primary materialsdefers the need to extract resourcesfrom nature, thereby conserving theseresources. Sustained yield is aresource acquisition practice that con-serves resource availability for futuregenerations. Sustained yield meansacquiring natural resources (timber,water, minerals, etc.) in a way thatensures continuous production.
Resource conservation is also afunction of carrying capacity. Thecarrying capacity of an ecosystem isthe number of living things a systemcan support without degradation.Problems arise when a populationexceeds the limit that the resource
base can support without stress—itscarrying capacity. Theoretically, thereis a maximum population matched toeach resource base, although it is verydifficult to determine. In human his-tory, there are examples of societiesthat experienced developmentaldecline coinciding with an exploita-tion of the resource bases used tomeet the needs and wants of growingpopulations.
In addition to population anddemand for resources, carrying capac-ity is influenced by how resources aremanaged and whether technologyincreases resource use or makes moreefficient use of natural resources.Sustainable development implies liv-ing within the bounds of carryingcapacity, thereby balancing the needsand wants of humans with the needsof the Earth. Appropriate technology,such as recycling, helps because itmeets human needs with minimallong-term damage to the environ-ment. Recycling is a way of managingour solid waste and natural resourcesto reduce environmental degradationand consumption of finite resources.
Ohio Proficiency Test Learning OutcomesGrade 4, Mathematics #3 – Select appropriate notation and methods for symbolizing aproblem situation, translate real life situations into conventional symbols of mathematics,and represent operations using models, conventional symbols and words.
Grade 4, Mathematics #8 – Add, subtract, multiply and divide whole numbers andexplain, illustrate or select thinking strategies for making computations.
Grade 4, Science #14 – Identify and/or describe the relationship between human activityand the environment.
Grade 6, Mathematics #3 – Apply appropriate notations and methods for symbolizing theproblem statement and solution process.
Grade 6, Science #4 – Identify the positive and/or negative impacts of technology onhuman activity.
Grade 6, Science #17 – Analyze the impacts of human activity on the ecosystems of theEarth.
Background Information

Windows on Waste - RESOURCE EXPEDITIONS VIII Help Contents Back
▼
▼
213©Ohio Department of Natural Resources Help Contents Back
▼
▼
213
Bibliography and AdditionalResourcesStudent Resources
The Giving Tree, by Shel Silverstein,New York: Harper Collins, 1974.
Window, by Jeannie Baker, New York:Greenwillow Books, 1991.
The Lorax, by Dr. Seuss, New York:Random House, 1971.
Old Turtle, by Douglas Wood, Deluth,Minn.: Pfeifer-Hamilton, 1992.
Brother Eagle, Sister Sky, (words from
Chief Seattle, with paintings by SusanJeffers), New York: Dial Books, 1991.
The Great Kapok Tree, by LynneCherry, San Diego: Harcourt, Brace,Jovanovich, 1991.
Common Ground, by Molly Bang,New York: Blue Sky Press, 1997.
Mother Earth, by Nancy Luenn, NewYork: Maxwell MacMillian, 1992.
The Environment—DistinguishingBetween Facts and Opinions,Greenhaven Press, 1990.
‘Fish Banks, Ltd,’ created by Dennis
Meadows. IPSSR, Hood House,University of New Hampshire,Durham, NH 03824.
Metals in History and The Horn ofPlenty Still Flows, published by theU.S. Bureau of Mines, Office of PublicInformation, 1991 and 1992.
Educator Information
Population Program, NWF, 1400 16thSt. NW, Washington, DC 20036.
The American Coal Foundation, 113017th St., NW, Washington, DC 20036.
Background Information, continued
PreparationPrepare large definition cards, or plan touse space on the blackboard, to definethe following terms: natural resources,renewable natural resources, non-renewable natural resources, plants, ani-mals, fossil fuels, minerals, sandstone,oil, bauxite, iron ore, trees.
Anticipate selecting five students whowill each be assigned one of the follow-ing: paper, plastic, steel, aluminum or
glass. It is important to select studentswho are capable of taking on the role ofsuper sleuth. (This must be top secret -they are the super sleuths and do notknow the product identity of the othersuper sleuths.) Scan Part A of the activi-ty to understand their roles. The role ofSuper Sleuth can be made easier bywriting the answers (to the clues fromthe cards that match their material –glass or plastic or paper, etc.) on theback of their detective lens.
Inquiries● What are natural resources
and how are they used tomake consumer products?
● What are recycled materialsand when can they be usedinstead of natural resources?
Content DomainScience – General science, earthscience
Social Studies – Economics
Learning OutcomesCitizenship, Grade 4, #11
Science, Grade 4, #1, #4, #14and Grade 6, #1, #17
DurationPart A: 50 minutes
Part B: 50 minutes
Show ‘Em SherlockObjectivesStudents will be able to: (a) identify products made from natural resources andfrom recycled materials; (b) distinguish various types of resources and products in adichotomous key; and (c) explain the value of recycling for conserving naturalresources.
Act
ivity
1RESOURCE EXPEDITIONS
continued next page

Windows on Waste - RESOURCE EXPEDITIONS VIII Help Contents Back
▼
▼
214©Ohio Department of Natural Resources Help Contents Back
▼
▼
214
ProcedurePART A
Divide the class into five groups orstations and select five super sleuths, onefor each group. Give each super sleuth adetective lens. It is each super sleuth’sresponsibility to lead their group’s dis-cussion and determine whether the cluesmatch his/her category.
Distribute the clue cards (facedown) to the class and meet privatelywith the super sleuths to give each ofthem their secret identity (written onthe back of their detective lens with orwithout the answers) and instructionsas follows:
As a super sleuth, you must have eachstudent read his/her clue card aloud tothe group. You will select those studentswho hold cards that match your identitywithout telling them why you selectedthem to stay at your station. When a sig-nal is given, the rest of the group at yourstation moves to the next station. Duringthe game, your station may be crowded,or it may have only one student.
Set the scene for the class by read-ing these instructions to them.
Who’s in the mood to solve a mysterytoday? If I say Sherlock, who am I talkingabout? That’s right – Sherlock Holmes.Created by an English writer (Sir ArthurConan Doyle) in 1887, Sherlock Holmeswas a fictional detective who prowled thestreets of London. His trusty assistant, Dr.Watson, helped gather clues, and togetherthey solved countless mysteries. To solvetoday’s mystery, you must become detec-tives like Holmes and Watson, listeningand observing.
Five of you have been chosen to be supersleuths and have been given a secret iden-tity on the back of a magnifying glass.The rest of you have been given clue cardswhich will be read and re-read at five sta-tions. When the super sleuth asks you toread your clue aloud, all of you at the sta-tion need to listen carefully because there
are clues hidden within the clue cards.The super sleuth is trying to find thosewho belong to him/her. When you readyour clue at each station, the super sleuthwill either ask you to stay or leave. Onlythose students the super sleuth thinks donot belong will move on to another sta-tion. This process will be repeated fivetimes. By the end of the game, you willbe in a group where each of you hassomething in common. This is called ahomogenous group. As you play thegame, keep an “eye” on the classroom formore clues.
ANSWERS to Clue Cards:
Aluminum – 1, 9, 15, 17, 21, 29
Glass – 2, 8, 13, 20, 24
Paper/Cardboard – 4, 7, 11, 16, 23, 28, 31
Plastic – 3, 6, 14, 19, 22, 26, 30
Steel – 5, 10, 12, 18, 25, 27
Before beginning the game, dis-play the natural resources definition orwrite "natural resources" on the board.After the third rotation, place the fiveproducts (plastic milk jug, glass jar, alu-minum can, steel can, paper/cardboard,or whatever products you chose) insight. After the fourth rotation, promi-nently display the five natural resource(oil, sandstone, bauxite, iron ore, trees)definitions or write the terms on theboard.
NOTE: It may take at least one rotationfor the students to start “getting it.”Make sure everyone is participating.Remind students they are trying to findmatches and make connections.
After the fifth and final rotation,ask the super sleuths to reveal theiridentities to the students at their sta-tions and then to the class. Identify the“strays” (those who are at the wrongstation) and help everyone find the correct station.
Explain homogenous to the class.Now, within the homogenous groups,have students decide which naturalresource card is theirs and report theirfindings to the class.
6
5
4
3
2
1
RESOURCE EXPEDITIONS
MaterialsThirty printed clue cards(from the handout pages, ClueCards), plus one blank card toadapt to individual needs; fiveprinted “magnifying lenses,”cut out from multiple copies ofthe handout, Super SleuthDetective Lens, with one of thefollowing words written onthe back of each lens: glass,aluminum, steel, paper/card-board or plastic; five exam-ples of products made fromthe resources, sandstone (glassjar), bauxite (aluminum can),iron ore (steel can), trees(paper/cardboard), oil (plas-tic milk jug)
Handouts● Clue Cards (1-8)
● Super Sleuth Detective Lens
● Goods and Resources
● The Nature of NaturalResources

Windows on Waste - RESOURCE EXPEDITIONS VIII Help Contents Back
▼
▼
215©Ohio Department of Natural Resources Help Contents Back
▼
▼
215
PART B
Display the following terms anddefinitions used in Part A: naturalresources, oil, sandstone, bauxite, ironore, trees. Add the following: renewableresource, non-renewable resource, fossilfuel, mineral, plant, animal. Review thedefinitions with students, perhaps hav-ing them record the definitions in theirown words. They will use each of theseterms in the next step to make adichotomous key.
Give each student the handout,Goods and Resources. Explain to stu-dents that the chart on the handout is adichotomous key, which provides a wayto organize natural resources. Have stu-dents begin by placing terms in thespaces numbered 1-8. Instruct themthat each of the four words under nat-ural resources should be used twice inthe answer spaces numbered 1-8.Provide further help to the students,depending on their previous experiencewith dichotomous keys.
ANSWERS to Goods and Resources:1. & 2. trees and sheep (either order);3. & 4. oil and bauxite (either order);5. trees, 6. sheep, 7. bauxite, 8. oil.
Have students continue filling outthe chart by providing additional exam-ples of fossil fuels, minerals, plants andanimals. Based on these examples, havestudents list products (return attentionto the specific products brought intoclass) made from each of these underthe heading, “Products.” Have students add other products and brainstormproducts for animals.
Ask students for another term forthe word “product.” It is the economicword “goods” used in the title of thehandout.
While students look at the chart,ask them which natural resources aresaved when the specific products on thelist are recycled. (Rarely is a productmade from 100 percent recycled
material, however, natural resources are conserved to the degree that recycledmaterials are used.) Ask students toidentify two other ways that resourcescan also be conserved (reduction,reuse).
Engage students in groups (couldbe the same groups used in Part A) in aresearch project by having them useencyclopedias or on-line informationsources to complete the handout, TheNature of Natural Resources. Reviewanswers with students.
The information acquired in Step6 can be used to make a new game withnew clues that were not used in the firstgame.
AssessmentGive students a blank copy of the
handout, The Nature of NaturalResources, and have them fill in theinformation for one of the products oftheir choice without using the complet-ed version of the handout.
Based on the information gath-ered for the handout, The Nature ofNatural Resources, have each studentmake up one clue card for each of thefive product categories.
2
1
7
6
5
4
3
2
1

Windows on Waste - RESOURCE EXPEDITIONS VIII Help Contents Back
▼
▼
216©Ohio Department of Natural Resources Help Contents Back
▼
▼
216
Student Handout ✐ Clue Cards-11
Am
eric
ans
thro
w aw
ay e
noug
hof
me
to re
build
our
com
mer
cial
ai
rline
flee
t ev
ery
thre
e m
onth
s.
2
Not
all
kind
s of
me
can
be
recy
cled
. Fo
r ex
ampl
e, m
irror
s,lig
ht b
ulbs
and
win
dows
sho
uld
not
be p
lace
d in
recy
clin
g bi
ns.
3
It t
akes
1,8
00 o
f me
to m
ake
ave
ry h
eavy
and
col
orfu
l 6-f
oot
picn
ic t
able
.
4
Aft
er w
ritin
g on
me,
Am
eric
ans
thro
w so
muc
h of
me
away
tha
twe
cou
ld b
uild
a 12
-foo
t-hi
gh w
all
from
New
Yor
k to
Los
Ang
eles
!
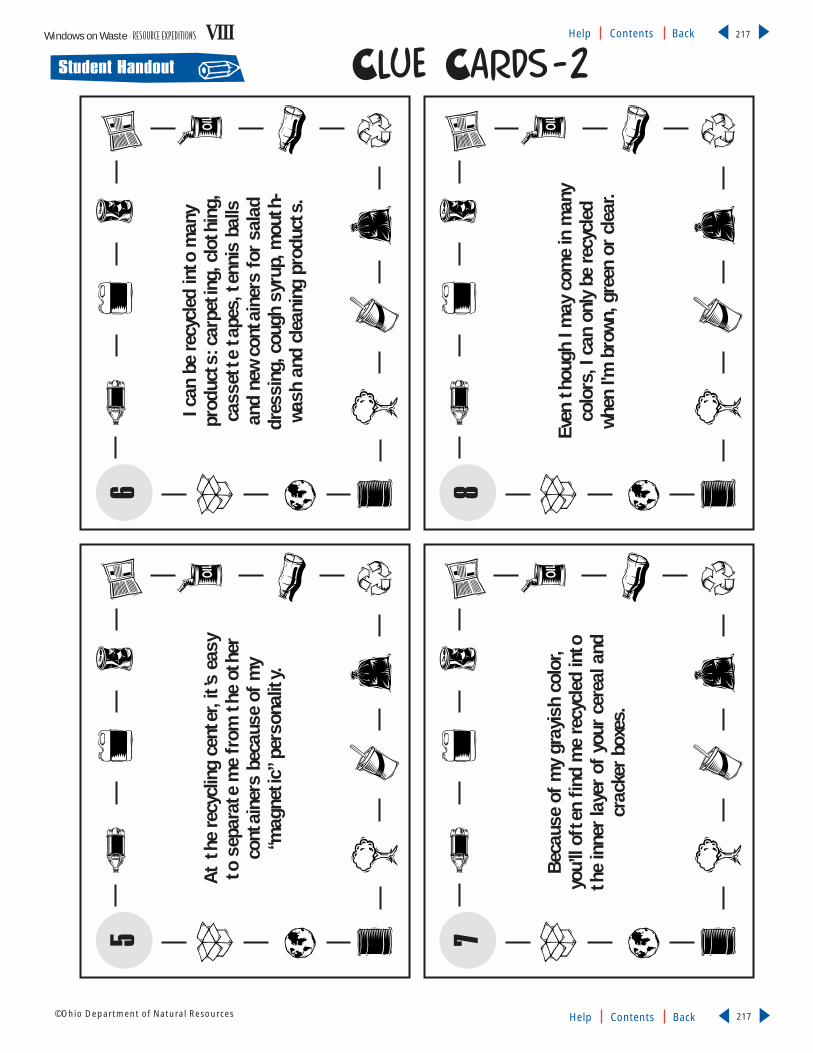
Windows on Waste - RESOURCE EXPEDITIONS VIII Help Contents Back
▼
▼
217©Ohio Department of Natural Resources Help Contents Back
▼
▼
217
Student Handout ✐ Clue Cards-2
5
At t
he re
cycl
ing
cent
er, i
t’s e
asy
to s
epar
ate
me
from
the
oth
erco
ntai
ners
bec
ause
of m
y “m
agne
tic”
per
sona
lity.
6
I can
be
recy
cled
into
man
y pr
oduc
ts: c
arpe
ting
, clo
thin
g,
cass
ette
tap
es, t
enni
s ba
lls
and
new
cont
aine
rs fo
r sa
lad
dres
sing
, cou
gh s
yrup
, mou
th-
wash
and
cle
anin
g pr
oduc
ts.
7
Beca
use
of m
y gr
ayis
h co
lor,
you’
ll of
ten
find
me
recy
cled
into
the
inne
r la
yer
of y
our
cere
al a
ndcr
acke
r bo
xes.
8
Even
tho
ugh
I may
com
e in
man
yco
lors
, I c
an o
nly
be re
cycl
edwh
en I'
m b
rown
, gre
en o
r cl
ear.
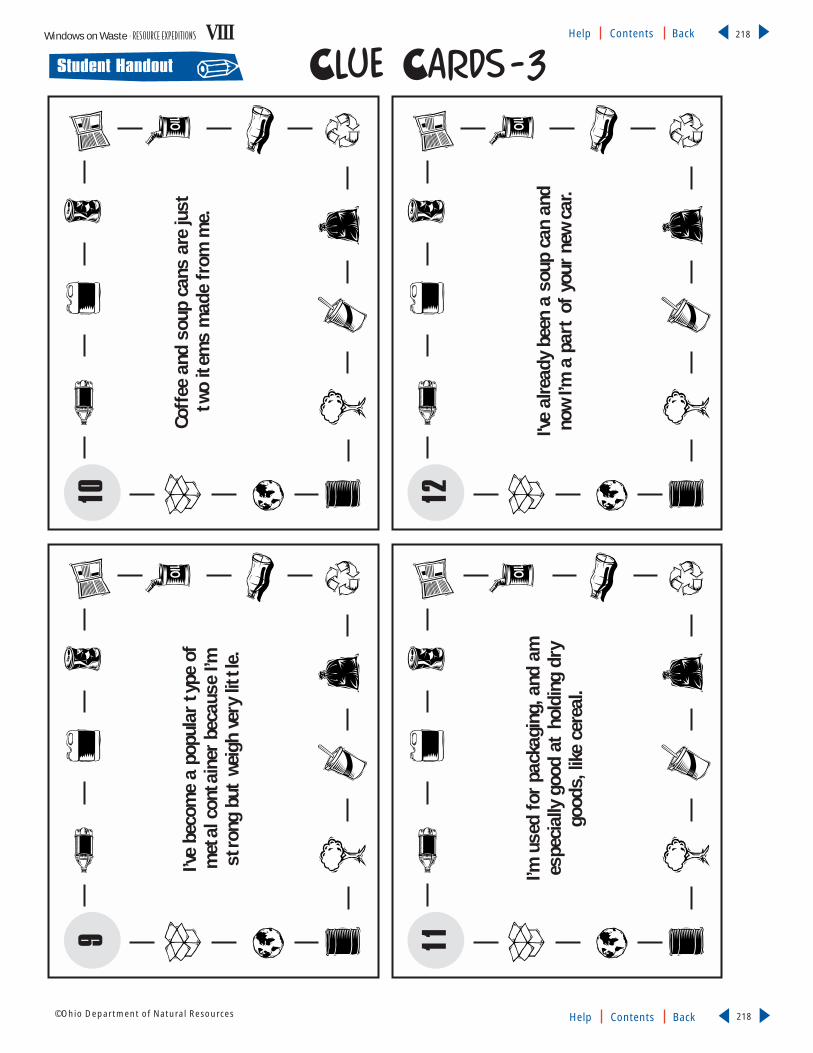
Windows on Waste - RESOURCE EXPEDITIONS VIII Help Contents Back
▼
▼
218©Ohio Department of Natural Resources Help Contents Back
▼
▼
218
Student Handout ✐ Clue Cards-39
I’ve
beco
me
a po
pula
r ty
pe o
fm
etal
con
tain
er b
ecau
se I’
mst
rong
but
wei
gh v
ery
littl
e.
10
Coff
ee a
nd s
oup
cans
are
just
two
item
s m
ade
from
me.
11
I’m u
sed
for
pack
agin
g, a
nd a
mes
peci
ally
goo
d at
hol
ding
dry
good
s, li
ke c
erea
l.
12
I've
alre
ady
been
a s
oup
can
and
now
I’m a
par
t of
you
r ne
w ca
r.

Windows on Waste - RESOURCE EXPEDITIONS VIII Help Contents Back
▼
▼
219©Ohio Department of Natural Resources Help Contents Back
▼
▼
219
Student Handout ✐ Clue Cards-4
13
You’
ll of
ten
find
me
a ha
zard
ifyo
u’re
wal
king
alo
ng t
he ro
ad o
rin
the
woo
ds b
ecau
se o
f my
brok
en a
nd ja
gged
edg
es. W
hat
a sh
ame,
bec
ause
I’m
so
easi
lyre
cycl
ed.
14
It t
akes
five
of m
e to
pro
duce
enou
gh fi
berf
ill t
o st
uff a
ski
jack
et o
r to
mak
e a
T-sh
irt, a
nd25
of m
e to
mak
e a
swea
ter.
15
Som
e pr
oduc
ts t
hat
used
to
bem
ade
from
ste
el, l
ike
beve
rage
cans
, are
now
mad
e ou
t of
me.
16
Aft
er y
ou re
ad m
e on
Sun
day
mor
ning
s, d
on’t
thro
w m
e aw
ay.
Whe
n yo
u re
cycl
e m
e, a
noth
erpe
rson
can
buy
me
at t
he s
tore
.

Windows on Waste - RESOURCE EXPEDITIONS VIII Help Contents Back
▼
▼
220©Ohio Department of Natural Resources Help Contents Back
▼
▼
220
Student Handout ✐ Clue Cards-517
Recy
clin
g m
e re
duce
s en
ergy
use
by a
s m
uch
as 9
5 pe
rcen
t.
18
Mor
e th
an 9
0 pe
rcen
t of
all
food
can
s ar
e m
ade
from
me.
19
Ever
y ye
ar, I
’m u
sed
to re
plac
ebo
dy p
arts
suc
h as
eye
s, e
ars,
elbo
ws, h
ands
, sho
ulde
rs, h
ips,
knee
s, le
gs, a
nkle
s or
toe
s th
atar
e m
issi
ng, i
njur
ed o
r wo
rn o
ut.
20
Cont
aine
rs m
ade
from
me
have
been
aro
und
for
4,00
0 ye
ars.

Windows on Waste - RESOURCE EXPEDITIONS VIII Help Contents Back
▼
▼
221©Ohio Department of Natural Resources Help Contents Back
▼
▼
221
Student Handout ✐ Clue Cards-621
I’m m
ade
from
a re
fined
pro
duct
of b
auxit
e, w
hich
is a
non
-re
newa
ble
reso
urce
.
22
If yo
u re
cycl
e m
e in
to a
new
co
ntai
ner,
it w
ill s
ave
50 p
erce
ntof
the
ene
rgy
need
ed t
o m
ake
me
from
raw
mat
eria
ls.
23
Recy
clin
g on
e to
n of
me
save
s46
2 ga
llons
of o
il an
d sa
ves
mor
e th
an t
hree
cub
ic y
ards
of
land
fill s
pace
, and
kee
ps a
lmos
t6
0 po
unds
of a
ir po
lluta
nts
out
of t
he a
ir.
24
If yo
u fin
d m
e in
a d
itch
, you
shou
ld h
andl
e m
e wi
th g
love
sso
you
don
’t ge
t cu
t.

Windows on Waste - RESOURCE EXPEDITIONS VIII Help Contents Back
▼
▼
222©Ohio Department of Natural Resources Help Contents Back
▼
▼
222
Student Handout ✐ Clue Cards-725
Recy
clin
g on
e to
n of
me
save
sm
inin
g m
ore
than
2,5
00 p
ound
sof
iron
ore
, 1,0
00 p
ound
s of
coa
lan
d 40
pou
nds
of li
mes
tone
.
26
Not
onl
y ca
n I b
e re
cycl
ed a
ndm
ade
into
pla
stic
lum
ber,
but
Ica
n al
so b
e m
ade
into
recy
clin
gbi
ns, m
ilk ju
gs, f
lowe
r po
ts a
ndm
otor
oil
cont
aine
rs.
27
Ohi
o is
the
sec
ond
larg
est
prod
ucer
of m
e in
the
U.S
. and
Am
eric
ans
use
abou
t 10
0 m
illio
n of
me
ever
y da
y.
28
Even
tho
ugh
I am
eas
ily re
cycl
ed,
peop
le s
till
thro
w m
e aw
ay m
ore
than
any
oth
er re
cycl
able
mat
eria
l.

Windows on Waste - RESOURCE EXPEDITIONS VIII Help Contents Back
▼
▼
223©Ohio Department of Natural Resources Help Contents Back
▼
▼
223
Student Handout ✐ Clue Cards-8
29
Mak
ing
me
requ
ires
trem
endo
usam
ount
s of
ele
ctric
ity.
30
I’m u
sed
to m
ake
wet
suit
s, a
irho
ses,
mas
ks, s
nork
els
and
fins
that
som
e di
vers
and
swim
mer
s us
e.
31
It’s
alwa
ys a
goo
d id
ea t
o us
ebo
th s
ides
of m
e be
fore
put
ting
me
in t
he re
cycl
ing
cont
aine
r.
32

Windows on Waste - RESOURCE EXPEDITIONS VIII Help Contents Back
▼
▼
224©Ohio Department of Natural Resources Help Contents Back
▼
▼
224
Student Handout ✐
Super Sleuth Detective Lens
Mak
e Con
nection
s!
Mak
e Con
nection
s!

Windows on Waste - RESOURCE EXPEDITIONS VIII Help Contents Back
▼
▼
225©Ohio Department of Natural Resources Help Contents Back
▼
▼
225
Student Handout ✐
Goods And Resources
5. ____________
PRODUCTS
8. ___________
PRODUCTS
7. ____________
PRODUCTS
6. ___________
PRODUCTS
sheepoil
treesbauxite
NATURAL RESOURCES
RENEWABLE RESOURCES
1. _______________________
2. _______________________
NON-RENEWABLE RESOURCES
3. ______________________
4. _______________________
PLANTS ANIMALS MINERALS FOSSIL FUELS
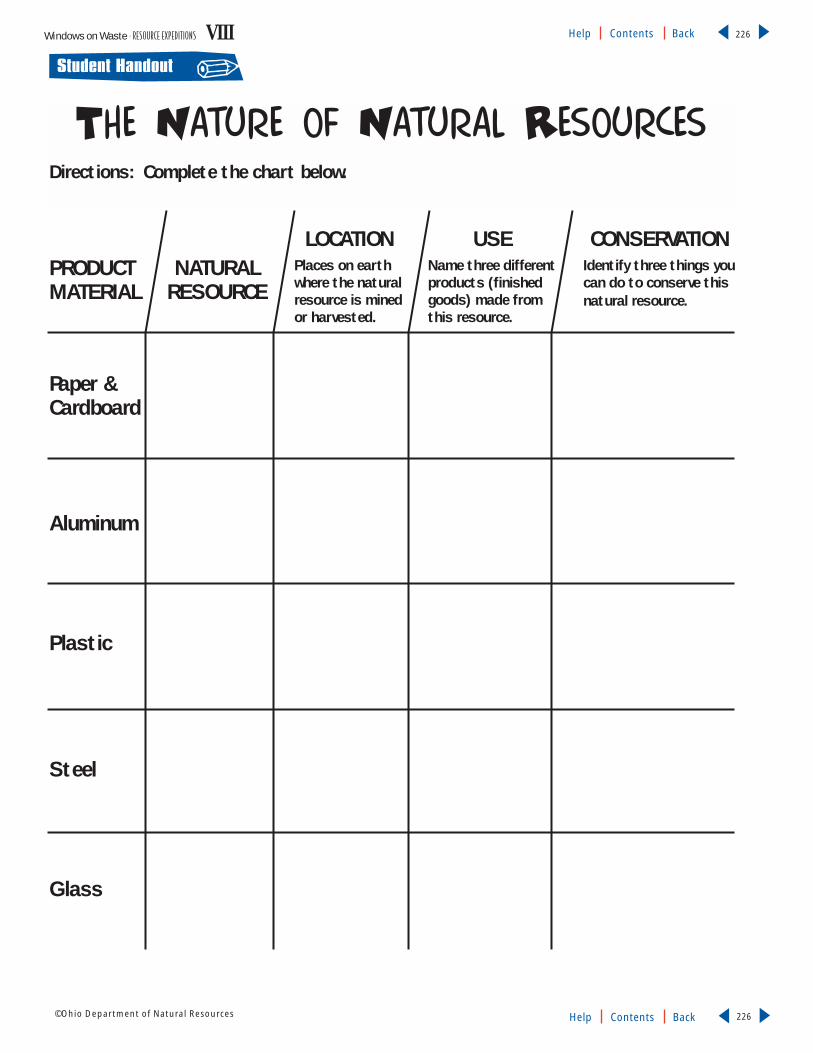
Windows on Waste - RESOURCE EXPEDITIONS VIII Help Contents Back
▼
▼
226©Ohio Department of Natural Resources Help Contents Back
▼
▼
226
Student Handout ✐
The Nature of Natural ResourcesDirections: Complete the chart below.
PRODUCTMATERIAL
Paper &Cardboard
Aluminum
Plastic
Steel
Glass
NATURALRESOURCE
LOCATIONPlaces on earthwhere the naturalresource is mined or harvested.
USEName three differentproducts (finishedgoods) made from this resource.
CONSERVATIONIdentify three things youcan do to conserve thisnatural resource.

Windows on Waste - RESOURCE EXPEDITIONS VIII Help Contents Back
▼
▼
227©Ohio Department of Natural Resources Help Contents Back
▼
▼
227
ProcedurePART A
Prior to conducting the chocolatechip mining activity, have studentscomplete the handout, Things I “GottaHave.” Discuss with students why wemine (needs and wants) and what wemine. After students discuss theiranswers, ask them to research and thenlist on the back of the handout howtheir first choice was manufactured andwhat minerals, energy or metals weremined to make it.
Display the handout, Know YourMinerals, on an overhead projector. Askstudents to count how many unfamiliarminerals and metals make a car. Whichminerals and metals are found in com-mon consumer products that can berecycled?
PART B
Divide the class into groups offour and pair up students in eachgroup. Distribute materials. Before passing out the cookies, tell students:
DO NOT EAT THE CHOCOLATECHIP COOKIE. Using an overheadprojector, look at the handout, MiningActivity Sheet. Together, read throughthe sheet and define any terms that areunfamiliar, such as conglomerate, pro-cessing time, extracted, extruder, bank-rupt, cost, earnings.
Write the following rules on thechalkboard:● Your cookie will earn $1,000 for every
2-cm. straw you fill with chocolatepieces.
● You will be charged $100 for everyminute it takes to process your choco-late (remove all the crumbs).
● The value of your cookie goes down$100 just for digging into it. Themore damage, the more you lose. Thefine: $100 for each cookie piece thatbreaks off.
Have students consider the following:● What is the best way to extract the
chocolate from the cookie? ● Is it better to work in a group of four
or form a conglomerate and combine
3
2
1
2
1
Inquiries● How are resources extracted
from the earth?
● What are the potential envi-ronmental consequences,both positive and negative, ofmining?
● How does recycling lessen thedemand for natural resourcesand protect the environment?
Content DomainMath
Science—General science, earthscience
Learning OutcomesMath, Grade 4, #3, #8 andGrade 6, #3
Science, Grade 4, #14 andGrade 6, #4, #17
DurationPart A: 60 minutes
Part B: 50 minutes
MaterialsChocolate chip cookies (oneper student); toothpicks foruse as extruders (one per stu-dent); straws cut into 2-cm.segments (several per student);paper towels (one per stu-dent); overhead projector
Handouts● Things I “Gotta Have”
● Know Your Minerals
● Mining Activity Sheet
Mining and RecyclingObjectivesStudents will be able to: (a) describe how resources are extracted from the earth; (b)
identify the effects of resource extraction on the environment in terms of land use
and pollution; and (c) infer the ability of recycling to conserve resources and reduce
the harmful effects resource extraction has on the environment.
Act
ivity
2RESOURCE EXPEDITIONS

Windows on Waste - RESOURCE EXPEDITIONS VIII Help Contents Back
▼
▼
228©Ohio Department of Natural Resources Help Contents Back
▼
▼
228
mining results? (This must bedecided before students begin theactual mining process.)
Distribute an activity sheet to eachgroup.
Share the following with stu-dents: Examine your cookie. Howmany chips can you see? Peek “under-ground” by looking at the bottom ofthe cookie. Predict how many strawsyour cookie will fill with chocolate.Also, predict how much money yourcookie will earn. Write these figureson the activity sheet. Have your part-ner time your work. Using yourextruder, carefully dig out the choco-late as your partner times your work.You must dig only from the top. Why?(Applications to real-life considera-tions: practicality, available technolo-gy, safety, expense.)
Share the following computa-tion process for the handout, MiningActivity Sheet, with students.
● Figure land damage by counting thecookie pieces (if your cookie is stillwhole, count it as one piece) andrecord the total under “LandDamage.” Round off the time to thenearest minute and record it under“Processing Time.”
● Measure your chocolate by pickingup the pieces with a 2-cm. straw. Fillas many straws as you need andrecord the number of straws under“Chocolate Extracted.”
● Figure your earnings on the activitysheet to find out how successfulyour digging was.
Questions forDiscussion● Whose cookie made money?● Did anyone go bankrupt?● Did your “conglomerate” bail you
out?● Why do you think you either made
or lost money? (lots of chocolate,careful digging, good planning orlack thereof)
● If you were real miners, what wouldyour cookie represent? (a mine)
● If the cookie is a mine, what is thechocolate? (gold, silver, iron ore,etc.)
● What do the pieces of cookie repre-sent? (waste product, land damage)
● How do you think the process ofmining affects the environment,both positively and negatively?
● What role do you believe miningcompanies can or should take inenvironmental stewardship?
● What does recycling have to do withall of this?
● How is recycling connected toresource management?
● How can recycling help reduce theharmful impacts of resource extrac-tion?
AssessmentCompletion of the handout, MiningActivity Sheet.
5
4

Windows on Waste - RESOURCE EXPEDITIONS VIII Help Contents Back
▼
▼
229©Ohio Department of Natural Resources Help Contents Back
▼
▼
229
Student Handout ✐
Things I “Gotta Have”Directions: Rank-order each of the consumer items listed below, #1 being the item you would be least willing to give up. There is a blank for your favorite item if it is not on the list.
_____ MICROWAVE OVEN _____ SOAP _____ BICYCLE
_____ TELEPHONE _____ TELEVISION _____ ALUMINUM CONTAINERS
_____ PERSONAL COMPUTER _____ MILK _____ CLEAN CLOTHES
_____ FISHING POLE _____ DEODORANT _____ CANDY
_____ WATCH _____ LIGHT BULB _____ TOOTHBRUSH
_____ HAIR DRYER _____ CURRENT FASHION _____ STEREO
_____ NEWSPAPER _____
WHY DO WE MINE?Because people need, want and sometimes demand the products made from minerals, metals and energythat come from the earth.
EVERYTHING IS MADE OF SOMETHINGWhen a person wants something, rarely does he or she think about the source of the materials needed tomake that product. Everything tangible that you want or buy must be made of materials taken fromour natural resources. Most of this material is from minerals, metals and petrochemicals.
Every American born will need…
…3.5 million pounds of minerals, metals and fuels in a lifetime*
*Adapted from materials provided free to teachers from the Mineral Information Institute, web site: www.mii.org
1,725 lbs. copper
568,575 lbs. coal
55,650 lbs. cement
6,975 lbs. aluminum
6.2 million cu.ft. natural gas
45,225 lbs. iron ore
60,308 gallons petroleum
975 lbs. lead
24,450 lbs. clay
1.4 million lbs. stone, sand & gravel 900 lbs. zinc
30,300 lbs. salt

Windows on Waste - RESOURCE EXPEDITIONS VIII Help Contents Back
▼
▼
230©Ohio Department of Natural Resources Help Contents Back
▼
▼
230
Know Your MineralsMore than 8 million new cars are made every year in the United States.In 1995, there were 133,929,661 cars in the United States.
The average weight of an automobile is 2,600-3,000 pounds. It ismade by combining at least 39 different minerals and metals, eachperforming a special function when used in combination with the other.
Aluminum and steel figures overlap in some applications, such as the frame or engine, so the total weight of all components may exceed 3,000 pounds.
What’s in a Car?Material Weight Material WeightAluminum . . . . . . . . . . . . . . .240 lbs. Mica . . . . . . . . . . . . . . . . . . .trace
Antimony . . . . . . . . . . . . . . .trace Nickel . . . . . . . . . . . . . . . . . . .9 lbs.
Asbestos . . . . . . . . . . . . . . ..66 to 1.2 lbs. Niobium . . . . . . . . . . . . . . . . .<.5 lbs.
Barium . . . . . . . . . . . . . . . . .trace Nitrogen . . . . . . . . . . . . . . . .trace
Cadmium . . . . . . . . . . . . . . . .trace Palladium . . . . . . . . . . . . . . . .trace
Carbon . . . . . . . . . . . . . . . . . .50 lbs. Plastics . . . . . . . . . . . . . . . . .250 lbs.
Cobalt . . . . . . . . . . . . . . . . . .trace Platinum . . . . . . . . . . . . . . . ..05 to.1 troy oz.
Copper . . . . . . . . . . . . . . . . . .42 lbs. Phosphorus . . . . . . . . . . . . .<1 lb.
Chromium . . . . . . . . . . . . . . .15 lbs. Potash . . . . . . . . . . . . . . . . . .trace
Fluorspar . . . . . . . . . . . . . . .trace Rubber . . . . . . . . . . . . . . . . . .140 lbs.
Gallium . . . . . . . . . . . . . . . . .trace Sand . . . . . . . . . . . . . . . . . . .89 lbs.
Gold . . . . . . . . . . . . . . . . . . .trace Silicon . . . . . . . . . . . . . . . . . .41 lbs.
Graphite . . . . . . . . . . . . . . . .trace Strontium . . . . . . . . . . . . . . .trace
Halite . . . . . . . . . . . . . . . . . .trace Sulfur . . . . . . . . . . . . . . . . . .2 lbs.
Iron/Steel . . . . . . . . . . . . . . .2,124 lbs. Tin . . . . . . . . . . . . . . . . . . . . .trace
Lead . . . . . . . . . . . . . . . . . . .24 lbs. Titanium . . . . . . . . . . . . . . . .trace
Limestone . . . . . . . . . . . . . . .trace Tungsten . . . . . . . . . . . . . . . .trace
Magnesium . . . . . . . . . . . . . .4.5 lbs. Vanadium . . . . . . . . . . . . . . .<1 lb.
Manganese . . . . . . . . . . . . . .17 lbs. Zinc . . . . . . . . . . . . . . . . . . . .22 lbs.
Molybdenum . . . . . . . . . . . . .1 lb. Zirconium . . . . . . . . . . . . . . .trace
Student Handout ✐
* Adapted from materials provided free to teachers from the Mineral Information Institute, web site: www.mii.org.

Windows on Waste - RESOURCE EXPEDITIONS VIII Help Contents Back
▼
▼
231©Ohio Department of Natural Resources Help Contents Back
▼
▼
231
Student Handout ✐Mining Activity Sheet
PREDICTINGHow many straws do you think you will fill? ________________
How much money do you think you will make? ________________
Will your group need to work as a conglomerate? YES NO
HOW TO FIGURE YOUR EARNINGS• Your cookie will earn $1,000 for every 2-cm straw you fill with chocolate pieces.
• You will be charged $100 for every minute it takes to process your chocolate (remove all the crumbs).
• The value of your cookie goes down $100 just for digging into it. The more damage, the more you lose.The fine: $100 for each cookie piece that breaks off.
Fill in your scores and multiply to get the total amount.
STEPLAND DAMAGE (see above) __________ pieces x $100 = $ __________
PROCESSING TIME __________ minutes x $100 = $ __________
Add dollar values for the PROCESSING TIME and LAND DAMAGE
TOTAL COSTS: $ __________
STEPCHOCOLATE EXTRACTED ___________ straws x $1,000 = $ __________
Are the TOTAL COSTS (Step 1) more than the dollar value of your CHOCOLATE EXTRACTED (Step 2)?
YES Your mine has lost money. Write BANKRUPT below.
NO Subtract the TOTAL COSTS from the CHOCOLATE EXTRACTED
Write answer below.
TOTAL EARNINGS: $__________
TOTAL CONGLOMERATE EARNINGS: $__________(if you chose in the beginning to work as a conglomerate)
1
2

Environmental StudiesLearning Concept
People of the world consume
disproportionate amounts of
the Earth’s resources due to
inequitable geographic distribution of
resources and variations of wealth
within societies and among nations.
As nations continue to develop, there
will be a greater demand for world
resources, thus increasing the need for
the efficient use of these resources,
including solid waste.
Recycling is part of world trade as
secondary materials are bought and
sold in world markets. Recycling and
reuse also promotes national self-
sufficiency by reducing the need for a
country to obtain resources from
another country.
Just as countries possess and
acquire different amounts of resources
for raw materials and energy,
countries differ in their use of
secondary materials and in their solid
waste management practices. Solid
waste management practices often
reflect the development status of a
country as a consumer economy,
which is an important factor in the
types and amounts of waste
generated. Some countries are more
efficient at recycling and reusing waste
materials than others.
Vocabularycomposting – a waste management alternative whereby organic wastes are par-tially decomposed by microorganisms (bacteria and fungi) to produce ahumus or soil-like product
garbage – refuse, or solid waste, consisting of food wastes; animal and vegetablewastes resulting from handling, storage, sale, preparation, cooking and servingof foods; in technical terms it is distinguished from trash and rubbish; but incommon usage it is a synonym for all refuse, including trash and rubbish
incineration – an engineered combustion (or burning process) to thermallyreduce the quantity of waste materials into gases and relatively small amountsof ash; offers potential for energy recovery
landfill – large, outdoor area for waste disposal; in sanitary landfills, waste isspread on land and compacted in layers and covered with soil or other materials daily
municipal solid waste – includes non-hazardous waste and very small quanti-ties of household hazardous waste generated in households, commercial andbusiness establishments, institutions and light industrial process wastes; it isoften contrasted with hazardous waste that requires disposal in permitted hazardous waste disposal sites
non-renewable resource – a natural resource that is not capable of being nat-urally restored; it is either a finite amount in the Earth’s crust, or cannot bereplenished because it is replaced more slowly than it is used
primary material – virgin, raw materials used for manufacturing basic products, such as wood chips, iron ore, silica sand and bauxite.
recycling – the act of collecting and separating materials and products fromthe solid waste stream and reusing them as raw materials in manufacturingprocesses
renewable resource – a naturally-occurring material or form of energy, suchas the sun, wind, falling water, biofuels, fish and trees; it is derived from anendless or cyclical source, where, through management of natural means,replacement roughly equals consumption
rubbish – solid waste (excluding ashes and food waste), consisting of bothcombustible and non-combustible waste materials
secondary material – commercial products recovered from the waste streamfor reprocessing and remanufacturing; includes material from municipal solidwaste streams and waste materials from manufacturing or conversion processes
GOING GLOBALWindows on Waste - GOING GLOBAL IX Help Contents Back
▼
▼
232©Ohio Department of Natural Resources Help Contents Back
▼
▼
232

Windows on Waste - GOING GLOBAL IX Help Contents Back
▼
▼
233©Ohio Department of Natural Resources Help Contents Back
▼
▼
233
Overview - GOING GLOBAL
3
Summary
This lesson
includes three
activities. They
can be done separately,
however the first activ-
ity provides a good
background for the
second activity. The
third activity is
independent of the first
two activities.
1
2
Activity 1: From Ohio to the World…From the World to Ohio
Description Students conduct research about the top 10 countries Ohio imports products and resources fromand organize information to make classroom presentations. The class makes decisions to constructa booklet from this information. Countries are located by using a global map and connected toOhio with string and directional arrows.
Ohio Proficiency Test Learning OutcomesGrade 4, Citizenship #7 – Demonstrate map skills by: (b) locating major land formations and bodiesof water or (c) using a number or letter grid system to locate places on a map, a map key to understandmap symbols, a linear scale to measure distances on a map and a direction finder.
Grade 4, Reading #19 – Choose materials related to purposes, as evidenced in part by the capacity to:(a) choose or identify library resources to locate specific information, and (b) choose appropriateresources and materials to solve problems and make decisions.
Grade 6, Citizenship #9 – Interpret and analyze maps, charts or graphs to formulate geographic ideas.
Grade 6, Citizenship #15 – Use information about global resource distribution to make generalizationsabout why nations engage in international trade.
Activity 2: I Need This…Do You Have Some?Description Students work cooperatively to identify some of the resources that are used to make an item. Theymake inferences to identify whether it was produced from renewable or non-renewable resources,primary or secondary materials or mixed materials.
Ohio Proficiency Test Learning OutcomesGrade 4, Citizenship #11 – Name the resources needed to produce various goods and services.
Grade 6, Citizenship #15 – Use information about global resource distribution to make generalizationsabout why nations engage in international trade.
Activity 3: Trash Around the WorldDescription Students analyze information found on different types of graphs and make inferences about thesolid waste handling practices of different countries.
Ohio Proficiency Test Learning OutcomesGrade 4, Mathematics #24 – Make or use a table to record and sort information, and make identifica-tions, comparisons and predictions from tables, picture graphs, bar graphs and labeled picture maps.
Grade 6, Mathematics #22 – Read, interpret and use tables, charts, maps and graphs to identify pat-terns, note trends and draw conclusions.

Windows on Waste - GOING GLOBAL IX Help Contents Back
▼
▼
234©Ohio Department of Natural Resources Help Contents Back
▼
▼
234
World markets forraw materials, foodand manufacturedgoods link nationaleconomic systems.
People of the world consume dispro-portionate amounts of the earth’sresources due to the inequitable geo-graphic distribution of resources andwealth within societies and amongnations. As nations develop, there willbe a greater demand for worldresources thus increasing the need forthe efficient use of these resources.
Recycling is part of world trade assecondary materials are bought andsold in world markets. Secondarymaterials are those resources derivedfrom the waste stream as opposed to primary materials, which are produced, from renewable or
non-renewable resources takendirectly from nature. Secondary mate-rials markets are as volatile as globaltrade markets for primary materialsand products. The scrap metal indus-try of the Great Lakes region providesa good example. In 1986, 13 milliontons of scrap metal was exported fromthe Great Lakes ports. Since 1994 thataverage has fallen to less than 50,000tons.
The domestic aluminum canmarket suffered similarly in 1998. Theprices paid for aluminum cans fell.This was caused by what has beencalled the “triple ripple” effect. First,Asian countries purchased lessdurable goods made in the U.S., suchas airplanes. Second, Asian countriesshipped more goods made of alu-minum into American markets.Finally, Asian demand for U.S. scrapaluminum was low. The result wasthat aluminum, which should havebeen exported, was available for sale
on the domestic market. This surplusof aluminum in the U.S. resulted inlower prices for recycled aluminumcans.
Trade, both national and interna-tional, is very important to Ohiobecause it is a leading exporter. Forexample, Ohio companies exported to191 foreign destinations in 1994.
Ohio’s leading export industriesinclude transportation, equipment,industrial machinery/computerequipment, chemicals and alliedproducts, electronic equipment, fabri-cated metal products, and rubber andplastic products.
The Cleveland Ohio CustomsDistrict further breaks down theseindustries into categories of products.Below are lists of the types of prod-ucts being exported and importedthrough the Cleveland Ohio CustomsDistrict. The Cleveland Ohio CustomsDistrict encompasses all of Ohio andparts of Indiana and Kentucky.
Background Information
Examples of Ohio’s NaturalResource Exports and Imports
Exports• Oil – for refining as lubricants• Sandstone• Peat• Clay• Gypsum• Shale• Coal – high-sulfur• Sand and gravel• Limestone and dolomite• Fish• Salt – for road de-icing and table
Imports• Iron ore – for iron and steel• Bauxite – for aluminum• Coal – low sulfur• Oil – for refining as fuel• Natural gas*• Marble and granite• Rubber• Timber*– for wood products andpaper* Although Ohio produces much of its own sup-ply of these resources, additional supplies must beimported — Ohio Department of Development
1. electric machinery, sound equip-ment, TV equipment and parts
2. nuclear reactors, boilers,machinery and parts
3. optic, photo equipment, medicalor surgical instruments, etc.
4. aircraft, spacecraft and parts
5. precious stones, precious metals,coins
6. mineral fuel, oil, bituminous substances, mineral wax
7. cereals
8. pharmaceutical products
9. oil seeds, miscellaneous grainseeds, fruit, plants
10. miscellaneous chemical products
1. nuclear reactors, boilers,machinery and parts
2. electric machinery, sound equip-ment, TV equipment and parts
3. vehicles and parts except railwayor tramway
4. apparel articles and accessories,knit or crochet
5. apparel articles and accessories,not knit or crochet
6. optic, photo equipment, medicalor surgical instruments, etc.
7. iron and steel
8. toys, games and sports equipment, parts and accessories
9. articles of steel or iron
10. aircraft, spacecraft and parts
** Massachusetts Institute for Social and Economic Research State Data Center
The top 10 categories ofproducts exported out of Ohio**
The top 10 categories ofproducts imported into Ohio**

Windows on Waste - GOING GLOBAL IX Help Contents Back
▼
▼
235©Ohio Department of Natural Resources Help Contents Back
▼
▼
235
Just as countries possess andacquire different amounts ofresources for raw materials and ener-gy, countries differ in solid wastemanagement practices. Physical size,climate and population of a countryinfluence these practices. A countrymay choose to utilize landfilling,incineration, composting and/orrecycling. Some countries generateless waste and are more efficient atrecycling and reusing waste materialsthan others.
When comparing the solid wastestatistics provided by different coun-tries, it is important to remember thatevery country has its own standardfor reporting solid waste statistics.According to the March 1998 issue ofthe Warmer Bulletin, in Japan, anunknown amount of recycled waste,especially paper, is collected by privatesector recyclers. Since privately col-lected amounts are not counted inofficial solid waste statistics, Japan’srecycling figures are artificially low.
The amount and composition ofwaste generated in each country isdirectly related to urbanization, thetypes and patterns of consumption,household revenue, and lifestyle of itspopulation.
Listed below is further informa-tion about the countries included inthe activity handout.
Bibliography and Additional ResourcesEducator Information
For more information on Ohio as aninternational trade partner, contact:Ohio Department of Development,International Trade Division, 77South High St., Columbus, OH43266-0413 or visit their website at:www.ohio.trade.tpusa.com.
Recycling Today, January 1998
Recycling Today, March 1998
Internet
Solid waste data is often compiled dif-ferently by each country. A variety ofinternational solid waste informationcan be found on the Internet. Onegood site is the Australian WasteDatabase at: www.civeng.unsw.edu.au/water/awd/awdb2.html. This site haslinks to the waste databases of manyother countries.
The U. S. EPA also maintains a web-site with good solid waste statisticalinformation for the United States andmany other countries.www.epa.gov/epaoswer/non-hw/muncpl/factbook.htm.
Warmer Bulletin, an internationalmagazine published by The WorldResource Foundation in Tonbridge,Kent, England contains internationalsolid waste information. The WorldResource Foundation also maintains awebsite at www.wrf.org.uk.
Vital Statistics
Country Population Per Capita Land Size Population DensityGDP* (sq. miles) (per sq. mile)
Canada . . . . . . .29,123,194 . . . . . . .$24,400 . . . . . .3,849,674 . . . . . . . . . . . .8
France . . . . . . . .58,040,230 . . . . . . .$18,670 . . . . . . .210,026 . . . . . . . . .276
Germany . . . . . .84,068,216 . . . . . . .$17,900 . . . . . . .137,830 . . . . . . . . .610
Japan . . . . . . . .125,716,637 . . . . . . .$21,300 . . . . . . .145,850 . . . . . . . . .861
USA . . . . . . . . .267,954,767 . . . . . . .$27,607 . . . . .3,675,031 . . . . . . . . . . .72
*Gross Domestic Product1998 World Almanac and Book of Facts, World Almanac Books

Windows on Waste - GOING GLOBAL IX Help Contents Back
▼
▼
236©Ohio Department of Natural Resources Help Contents Back
▼
▼
236
Inquiries● Which countries are Ohio’s
trade partners?
● Which countries are the citi-zens of Ohio most dependentupon for natural resources?
● Why is it important for Ohioto trade resources and products?
Content DomainLanguage Arts – Reading
Social Studies – Geography
Learning OutcomesCitizenship, Grade 4, #7 andGrade 6, #9, #15
Reading, Grade 4, #19
Duration45-60 minutes
MaterialsGlobal map that students canstick pins into or put tape on,string, small cardboard arrows,push pins, tape
From Ohio to the World…From the World to Ohio
ObjectivesStudents will be able to: (a) locate countries on a global map and (b) distinguishbetween export and import, and explain the importance of global trade for the worldand Ohio.
Background InformationOhio export and import information is compiled by the Cleveland Ohio CustomsDistrict. This district encompasses all of Ohio and parts of Indiana and Kentucky.
Act
ivity
1GOING GLOBAL
The top 10 countries importing products or resources into
the State of Ohio:
Canada Hong Kong
China (Mainland) Japan
China (Taiwan) Korea
France Singapore
Germany United Kingdom
The top 10 countries the Stateof Ohio exports products or
resources to:Australia GermanyBelgium JapanCanada Korea China (Taiwan) MexicoFrance United Kingdom
Ohio Department of Development, International Trade Division, December 1996
PreparationHang a world map in an area where allstudents can see it and have access to it.If a map is not available, create onefrom a large piece of corrugated card-board or paper that can be glued,pinned or otherwise added to. The mapshould include a key indicating mileage.
Whichever map is chosen (prepared orpurchased), there should be room on
the map or bulletin board for a legendexplaining all of the information on themap. This map could hang in the class-room for an extended period. Differentitems could be added to it as studentsstudy other areas of the world.
Assemble reference materials for studentuse, such as a world almanac, Ohioalmanac, encyclopedias and/or booksabout the nations that export to Ohio.

Windows on Waste - GOING GLOBAL IX Help Contents Back
▼
▼
237©Ohio Department of Natural Resources Help Contents Back
▼
▼
237
ProcedureIf the global map being used
does not include an outline of Ohio, itshould be added.
Divide students into 10 groups.Assign each group one importingcountry and one exporting country.Each group should connect theircountries to the state of Ohio withcolor-coded string and small card-board directional arrows. The map’slegend should include a key showingthe coding systems. For example, onecolor of string or directional arrowsfor export and one for import.Students should use the map key toestimate how many miles their coun-tries are from Ohio.
The class will prepare a bookleton Ohio’s connection to the worldusing the import countries they wereassigned. Each group will contributetwo pages that include the followinginformation:
● a map of the importing country anda picture of its flag
● a list of some of the country’s nat-ural resources
● a list of products the countryexports (can be illustrated)
● one fact students learned abouttheir country that they didn’t knowbefore
A good source for comparing statisticson different countries is the UnitedNations Internet site (www.un.org).Other sources the students could useinclude encyclopedias, Ohio almanacor world almanac.
After all the groups are done,have each group report to the classabout the resources of their assignedcountry. The students could put a listof the resources on the board. Thepages the students prepared should be
compiled and assembled into a book.All students should be able to look atthe finished book.
Discussion Questions● Why is it important for Ohio to
trade with other nations?
● What resources or goods do theimporting countries have that youthink we would want in Ohio asconsumers and why?
● Can you think of things you usethat come from other countries?
● How far do resources and productshave to travel to get to Ohio fromthe different countries?
● What types of physical barriers(mountains, deserts, oceans) have tobe crossed?
AssessmentStudent participation in class-
room discussions.
Group pages. Score based on arubric scheme.
Individual student response tothe booklet. After the discussion, andafter the students have reviewed thebooklet, ask students to select threenations they didn’t work on and usethe examples of those nations toexplain what it means to be “connect-ed with another part of the world.”Score this assignment based on arubric scheme. Consider the elementsbelow for the rubric.
3 points- the student uses three dif-ferent examples and shares a clearunderstanding of how the examplesshow connections.
2 points- the student uses three dif-ferent examples and shares an ade-
quate understanding of how theexamples show connections.
1 point- the student uses at least twodifferent examples and shares an ade-quate understanding of how theexamples show connections OR thestudent uses three different examplesbut shares an inadequate understand-ing of how the examples show con-nections.
0 points- the student uses at least twodifferent examples but shares an inad-equate understanding of how theexamples show connections OR thestudent discusses only one example.
ExtensionAn extra large global map is mappedout using a playground. Studentsstand on the importing/exportingcountries and connect to a studentrepresenting Ohio with colored stringor rope.
3
2
1
4
3
2
1

Windows on Waste - GOING GLOBAL IX Help Contents Back
▼
▼
238©Ohio Department of Natural Resources Help Contents Back
▼
▼
238
GOING GLOBAL
Inquiries● What natural resources are
used to make everyday items?
● Which resources are renewable and which arenon-renewable?
● What types of secondarymaterial can be used in products?
● Which countries do some ofour consumer goods comefrom?
● What can we do to conservenatural resources?
Content DomainSocial Studies – Geography
Learning OutcomesCitizenship, Grade 4, #11 andGrade 6, #15
Duration60-120 minutes
MaterialsSeveral products that list thecountry of manufactureincluding some items that list“recycled content” on either thepackaging or on the item orpictures of products, drawingpaper, glue, scissors, pins
Handout● I Need This…Do You Have
Some?
BackgroundInformation Natural resources are either renewableor non-renewable and can serve aseither sources of energy or raw materialswhen manufacturing consumer products. A renewable resource is a naturally-occurring material or form ofenergy, such as the sun, wind, fallingwater, fish and trees. It is important toremember that even some renewableresources can be depleted. A non-renewable resource is not capable ofbeing naturally restored. It is either afinite amount in the Earth’s crust, orcannot be replenished because it isreplaced more slowly than it is used.
The raw materials used for manufactur-ing can be either primary materials orsecondary materials. Primary materialsare resources (renewable or non-renew-able) taken directly from nature.Secondary materials are collected fromthe waste stream to be reused. Secondarymaterials are often collected throughrecycling programs. The use of sec-ondary materials in place of primarymaterials defers the need to extractresources from nature, as well as reducesa country’s need to import naturalresources from another country.
Below is a list of common items and thenatural resources used to manufacturethem.
Act
ivity
2
Stereocase – oiltape – chromium, iron, oilpaint – chromium, oil
Computercase – oil, ironwires – copper, goldcircuit board – claymonitor – rare earth,
silica sand
Carengine – iron or aluminumexhaust system – leadtrim – chromium, zincgasoline – oilbattery – lead
Jewelrymetal – gold, silver, platinummolds – silica sand,
chromiumstones – gemheat – oil, gas, coal
Camerafilm – silver, oilbody – aluminum, ironstrap – oillenses – silica sand, saltspaper – clay, trees
Moneycoins – iron, zinc, copperpaper – clay, trees ink – oilmolds – iron, chromium,
nickel
I Need This...Do You Have Some?ObjectivesStudents will be able to: (a) cooperate in groups to make inferences about the type ofmaterials and resources that are used to manufacture products and (b) identify aproduct and the country in which it was manufactured.

Windows on Waste - GOING GLOBAL IX Help Contents Back
▼
▼239
PreparationMake one copy of the handout, I NeedThis…Do You Have Some?, for eachstudent.
ProcedureDiscuss with students the follow-
ing terms: renewable, non-renewable,primary resources and secondaryresources.
Divide students into groups.Each group should receive one ormore products (or picture of prod-ucts) to examine. The group shouldidentify what resources the item(s)were made from and determinewhether the resources are renewableor non-renewable, and primary orsecondary.
Each group should list the infor-mation they compiled about theiritem on the board. As a class, discussthe choices the groups made.
● Why are most products made fromprimary as opposed to secondaryresources? (Easier to get primaryresources, it’s always been done thisway, subsidies for primary resourceindustries, having to retool manu-facturing equipment to use sec-ondary materials, unreliable marketfor purchasing recycled materials,contamination of recycled materials,
increased cost of items using recy-cled-content materials, etc.)
● What can we do to promote the useof secondary resources? (Recycleproperly, purchase items made fromrecycled materials, etc.)
Each student will select one itemthey use that was imported fromanother country. Have students com-plete the handout, I Need This…DoYou Have Some? The illustrationbelow is an example of a bicycleresource web. Identify for the studentsthe secondary resources that could beused in place of the primaryresources. For example: wheel – aluminum cans, frame – steel cans,junk cars. Look at the students’ websand discuss as a class which secondaryitems could be used as substitutes forprimary materials.
After each student has completedtheir handout, ask them to locate theexporting country (of their item) andpin (or glue) a small picture or draw-ing of it onto the global map createdin the first activity.
Allow students time to look atthe map and see the different itemsand countries that have been added.
Discuss the questions on thehandout, I Need This…Do You HaveSome? Also, discuss the following:
● Is the item you selected somethingyou need or is it something youwant?
● What would happen if everyone inthe world wanted one of your item?What would happen if one of thenatural resources needed to makeyour item was no longer available?
● Could your item be changed to usesecondary materials rather than pri-mary resources?
● Is it fair that someone living in thecountry that made your item maynever be able to afford it?
● What happens to your item whenyou don’t need it, want it or can’tuse it anymore?
AssessmentParticipation in classroom and
small group activity.
Completion of the handout, INeed This…Do You Have Some?
Suggested test questions:
● Define the following terms: renew-able, non-renewable, primaryresources and secondary resources.
● List some of the resources that areused to make a specific item.
● List one item that is a want and oneitem that is a need and explain whyyou chose them.
● What are some of the ways we canreduce the amount of naturalresources used?
ExtensionHave students research the differentitems that can be recycled in yourcommunity, as well as how theseitems should be prepared. Your localsolid waste district will be able to provide this information.
3
2
1
7
6
5
4
3
2
1
wheel frame
iron orebauxite
bicycle
petroleumrubber
tires
aluminumcan steel can
239©Ohio Department of Natural Resources Help Contents Back
▼
▼

Windows on Waste - GOING GLOBAL IX Help Contents Back
▼
▼
240©Ohio Department of Natural Resources Help Contents Back
▼
▼
240
Part Resource Renewable Non- Primary Secondary Renewable Material Material
Student Handout ✐
I Need This...Do You Have Some?1. Think of a favorite object. It could be a toy, tool, machine or another item that you like. Check and see
what country it may have been imported from (there should be a label or sticker on the item that identifies which country manufactured it). Draw a picture of the item in the circle below.
My item is ________________________________ and it was made in ____________________________.
2. List all of the parts to your item. (For example: a camera – body, strap, lens). Then list which naturalresources were used to make the parts. Decide if they are renewable or non-renewable. Finally, decide if the part was made from a primary or secondary material.
3. Make a web of the above information.

Windows on Waste - GOING GLOBAL IX Help Contents Back
▼
▼
241©Ohio Department of Natural Resources Help Contents Back
▼
▼
241
PreparationPost the comparison statistics of the dif-ferent countries (included in theBackground Information on p. IX-5)where all students can see them.
Copy one set of handouts per studentor group of students.
On an average, 4.4 pounds of trash iswhat each person in Ohio throws outper day. Fill a clear plastic bag with 4.4pounds of dry household waste. Thebag should include items such as foodjars and cans, paper, used clothing, cere-al boxes, soda pop cans, toys, assortedplastic products, etc. Be sure to includeproducts representing the seven (#1-7)different plastic codes. (This numericcode is located inside recycling arrowsnear or on the bottom of the container.The number represents a type of plastic.Most communities only accept itemsmade from #1 and #2 plastic.) Thegarbage should include items that canbe recycled locally as well as those thatcan’t. During the activity the studentswill be handling this garbage; please donot include any wet or unsanitaryitems. All former food containersshould be cleaned out and checked forsharp edges.
Determine what types of materials canbe recycled in your community.
Procedure Show students the bag filled with
garbage. Explain to students that whatthey see is the household equivalent tothe amount of waste each personthrows out everyday. Explain that thevolume may differ because the bag onlycontains dry waste. Ask students tovisualize everything they have thrownout that day.
Explain to students that what youare showing them is an example ofmunicipal solid waste. Define the termsrubbish and garbage. Discuss with stu-dents the types of items that are recy-clable in their community, and howsome things could be reused rather thanthrown away.
Divide students into groups andgive each group a small amount of thegarbage from the bag. Explain to stu-dents that the garbage they have beengiven is “clean.” If they were handlingactual garbage, they would have to wearheavy gloves. Have each group tell theclass whether their item(s) could be
3
2
1
Inquiries● How do countries manage
their solid waste in compari-son with the United States?
● Why do the citizens of somecountries throw out moretrash than others?
● What factors affect a coun-try’s waste managementpractices?
Content DomainMath – Arithmetic
Social Studies – Geography
Learning OutcomesMath, Grade 4, #24 and Grade 6, #22
Duration60-120 minutes
MaterialsBag of clean, dry garbageweighing 4.4 pounds. (Thegarbage should be placed in aclear garbage bag.)
Handouts● Tell Me About Your Trash
Graphs
● Tell Me About Your TrashWorksheet
● Trash Around the WorldAssessment
Trash Around the WorldObjectivesStudents will be able to: (a) interpret graphs and data about global solid waste con-
cerns and (b) explain the relationships between a country’s physical geography, per
capita income, population and solid waste disposal methods.
Act
ivity
3GOING GLOBAL
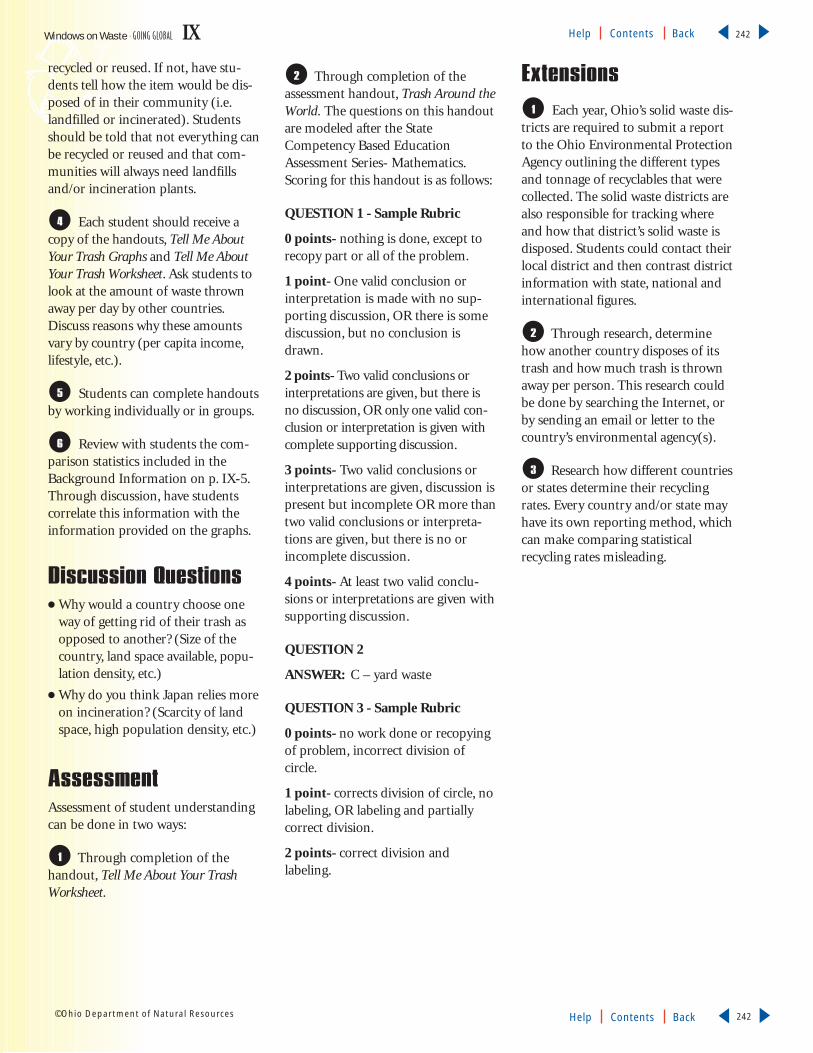
Windows on Waste - GOING GLOBAL IX Help Contents Back
▼
▼
242©Ohio Department of Natural Resources Help Contents Back
▼
▼
242
recycled or reused. If not, have stu-dents tell how the item would be dis-posed of in their community (i.e.landfilled or incinerated). Studentsshould be told that not everything canbe recycled or reused and that com-munities will always need landfillsand/or incineration plants.
Each student should receive acopy of the handouts, Tell Me AboutYour Trash Graphs and Tell Me AboutYour Trash Worksheet. Ask students tolook at the amount of waste thrownaway per day by other countries.Discuss reasons why these amountsvary by country (per capita income,lifestyle, etc.).
Students can complete handoutsby working individually or in groups.
Review with students the com-parison statistics included in theBackground Information on p. IX-5.Through discussion, have studentscorrelate this information with theinformation provided on the graphs.
Discussion Questions● Why would a country choose one
way of getting rid of their trash asopposed to another? (Size of thecountry, land space available, popu-lation density, etc.)
● Why do you think Japan relies moreon incineration? (Scarcity of landspace, high population density, etc.)
AssessmentAssessment of student understandingcan be done in two ways:
Through completion of thehandout, Tell Me About Your TrashWorksheet.
Through completion of theassessment handout, Trash Around theWorld. The questions on this handoutare modeled after the StateCompetency Based EducationAssessment Series- Mathematics.Scoring for this handout is as follows:
QUESTION 1 - Sample Rubric
0 points- nothing is done, except torecopy part or all of the problem.
1 point- One valid conclusion orinterpretation is made with no sup-porting discussion, OR there is somediscussion, but no conclusion isdrawn.
2 points- Two valid conclusions orinterpretations are given, but there isno discussion, OR only one valid con-clusion or interpretation is given withcomplete supporting discussion.
3 points- Two valid conclusions orinterpretations are given, discussion ispresent but incomplete OR more thantwo valid conclusions or interpreta-tions are given, but there is no orincomplete discussion.
4 points- At least two valid conclu-sions or interpretations are given withsupporting discussion.
QUESTION 2
ANSWER: C – yard waste
QUESTION 3 - Sample Rubric
0 points- no work done or recopyingof problem, incorrect division ofcircle.
1 point- corrects division of circle, nolabeling, OR labeling and partiallycorrect division.
2 points- correct division and labeling.
ExtensionsEach year, Ohio’s solid waste dis-
tricts are required to submit a reportto the Ohio Environmental ProtectionAgency outlining the different typesand tonnage of recyclables that werecollected. The solid waste districts arealso responsible for tracking whereand how that district’s solid waste isdisposed. Students could contact theirlocal district and then contrast districtinformation with state, national andinternational figures.
Through research, determinehow another country disposes of itstrash and how much trash is thrownaway per person. This research couldbe done by searching the Internet, orby sending an email or letter to thecountry’s environmental agency(s).
Research how different countriesor states determine their recyclingrates. Every country and/or state mayhave its own reporting method, whichcan make comparing statistical recycling rates misleading.
3
2
1
2
1
6
5
4

Windows on Waste - GOING GLOBAL IX Help Contents Back
▼
▼
243©Ohio Department of Natural Resources Help Contents Back
▼
▼
243
Student Handout ✐
Tell Me About Your Trash Graphs
How much trash do wethrow out every day?
What do people in Ohiodo with their trash?
Where does our trash go?90
80
70
60
50
40
30
20
10
0
54.543.532.521.510.50
Canada France Japan Germany United States
Lbs. per person per day
% of
tot
al w
aste
FranceGermanyJapanCanadaUnited States
Landfill 67%Recycle 32%Incinerate 1%
MSW Factbook, Ver. 4, Office of Solid Waste, U.S. EPA, Washington DC, 1997
1997 Ohio Solid Waste Facility Report, Ohio EPA.Note: The MSW Factbook, Ver.4, Office of SolidWaste, U.S. EPA, 1997, reports Ohio’s recycling rateat 15%, with 83% landfilled.
RecyclingComposting
IncinerationLandfilling
KEY
KEY
KEY

Windows on Waste - GOING GLOBAL IX Help Contents Back
▼
▼
244©Ohio Department of Natural Resources Help Contents Back
▼
▼
244
Student Handout ✐
Tell Me About Your TrashWorksheet
Directions: Look at the graphs and answer the following questions.
1. Which country uses a landfill the most to dispose of its trash? _____________________________
2. On the same graph, which country recycles the most materials? ____________________________
3. Who uses a landfill more to dispose of their trash—people in Ohio or Japan?__________________
4. Who throws out the most trash per day? ________________________________________________
5. Who throws out more trash per day- people in Japan or Canada? ____________________________
6. What percentage of waste is incinerated in Japan? ________________________________________
7. How many pounds of trash does the average person in the United States
throw out per day?___________________________________________________________________
8. What percent of the trash in France is composted? _______________________________________
9. Who does more recycling- people in Ohio or France? _______________________________________
10. What percentage of trash in Germany is recycled? ________________________________________

Windows on Waste - GOING GLOBAL IX Help Contents Back
▼
▼
245©Ohio Department of Natural Resources Help Contents Back
▼
▼
245
Trash Around the World1 People in different countries throw out
different amounts of waste every day. To theright is a list of how much is thrown out infour different countries. Write a paragraphabout two conclusions you can draw from theinformation. Justify your conclusions.
__________________________________________________________________________________
__________________________________________________________________________________
__________________________________________________________________________________
__________________________________________________________________________________
__________________________________________________________________________________
__________________________________________________________________________________
__________________________________________________________________________________
Student Handout ✐
TRASH TRASH COUNTRY RECYCLED LANDFILLED
Spain 13% 64%Sweden 16% 32%Netherlands 16% 48%United States 23% 61%
What’s in the U.S.’s garbage?4035302520151050
% by
wei
ght
pape
r
glas
s
yard
wa
ste
met
al
plas
tic
wood
othe
r
2. Which item is nearly one-half the amount of papergenerated in the U.S.’s garbage?
a. metal c. yard wasteb. plastic d. other
3 What’s in Switzerland’s trash?TYPE OF PERCENT OF WASTE WASTE
Paper 33%Plastic 14%Glass 8%Metal 5%Misc. 40%
The table (left) shows thepercentages of materialspeople in Switzerland throwin their trash. In the circle,make a circle graph to illus-trate the data in the table.Label each part of the circlewith the correct item.

Environmental StudiesLearning Concept
There are many types of environmental
pollutants, some caused by nature and
some by human endeavors. Those
derived from nature are generally intermittent
and dispersed, which lessens their impact upon
the environment. Modern human-made
pollutants are more consistently generated and
concentrated throughout the environment.
They result from a consumer-industrial society
that generates technological processes,
chemicals and materials, and consumer prod-
ucts that have the potential to harm the
environment. Pollution can be reduced in a
number of ways, including resource reduction
and substitution, technological controls and
consumer purchasing habits.
Natural systems have a limited capacity to
cycle or disperse pollutants depending upon
the type and concentration of pollutants. Each
pollutant has its own pathway and effects once
it enters the environment. Pollutants can move
through air, water and soil, and they can
change the balance of biogeochemical cycles.
They can move up the food chain to become
more and more concentrated in animals and
humans, and can adversely affect human
health in various ways.
Waste materials and substances, if
improperly disposed, can be released into the
environment where they follow various path-
ways with various effects. Recycling can reduce
pollution when it reduces the need to extract
resources from the Earth and reduces the
material and energy requirements in
manufacturing processes.
Vocabularycontaminate – to make something impure or unfit for use by contactor mixture with something else
emission – substance discharged into the air, waterways or on land
fossil fuels – a natural resource ultimately derived from living things(coal, oil and natural gas) and converted into energy
hazardous – harmful to living organisms; possesses one or more ofthe following traits: toxic, corrosive, combustible, poisonous,carcinogenic
illegal dumping – disposing of solid waste on public or private property that is not designated as a licensed waste disposal facility
lifecycle analysis – a method of accounting for all the environmentalimpacts from a single product
litter – human-generated solid waste that is put in the wrong place orallowed to escape from a container
manufacturing – the process of turning raw material into finishedproducts, usually with the aid of machines
methane gas – a colorless, odorless, flammable, gaseous hydrocarbonthat is a product of decomposition of organic matter
non-point source pollution – undefined wastewater discharges, suchas runoff from urban, agricultural or strip-mined areas; does not orig-inate from a specific point
particulate – a type of air pollutant made of tiny solids suspended inthe atmosphere
pathway – the route by which a pollutant travels throughout the environment from an original source
pollution – the contamination of soil, water or air by the discharge orimproper disposal of matter, sounds or odors that have a negativeeffect upon the environment and human health
recycle – to collect and process waste materials for use in manufactur-ing new products
resource extraction – the process of taking a resource from the Earthand/or removing or separating it from a particular source
sewage – water that carries organic waste from humans and industry
solid waste – all garbage, refuse and sludge products from agriculture,forestry, industry, mining and municipalities
technology – a method, process or technique that uses machines toprovide society with desired or needed consumer goods
PAYING THE POLLUTION PIPERWindows on Waste - PAYING THE POLLUTION PIPER X Help Contents Back
▼
▼
246©Ohio Department of Natural Resources Help Contents Back
▼
▼
246

Windows on Waste - PAYING THE POLLUTION PIPER X Help Contents Back
▼
▼
247©Ohio Department of Natural Resources Help Contents Back
▼
▼
247
1 Summary
This lesson includes two
activities. They may be
conducted independently;
however, if both are used,
teachers should decide which
activity provides a better
introduction for their students.
Overview - PAYING THE POLLUTION PIPER
2
Activity 1: The Costly “Thing”DescriptionStudents compare using natural resources with using secondary or recycled materialsto make aluminum cans. They cooperate in groups and make inferences about pollu-tion values at various stages of production. Students manipulate materials to modelquantities of pollution at various stages of manufacturing and deduce the environ-mental impact of recycling.
Ohio Proficiency Test Learning OutcomesGrade 4, Citizenship #11 – Name the resources needed to produce various goods and ser-vices, classify each resource by the factors of production, or suggest alternative uses forthose factors.
Grade 4, Science #5 – Analyze a series of events and/or simple daily or seasonal cycles andpredict the next likely occurrence in the sequence.
Grade 4, Science #14 – Identify and/or describe the relationship between human activityand the environment.
Grade 6, Science #4 – Identify the positive and/or negative impacts of technology onhuman activity.
Grade 6, Science #17 – Analyze the impacts of human activity on the ecosystems of theEarth.
Activity 2: Pollution on the MoveDescriptionStudents are introduced to the general concept of pollution, its causes and how it canaffect the environment. Students cooperate in groups to identify causes of pollutionby making inferences from clues supplied on a handout. They observe a communityillustration of potential sources of pollution to infer pathways for pollution. Based ongroup discussion, students generate their own definition for the word pollution, andhypothesize the effects of different types of pollution on the environment.
Ohio Proficiency Test Learning OutcomesGrade 4, Science #14 – Identify and/or describe the relationship between human activityand the environment.
Grade 6, Science #4 – Identify the positive and/or negative impacts of technology onhuman activity.
Grade 6, Science #17 – Analyze the impacts of human activity on the ecosystems of theEarth.
Windows on Waste - PAYING THE POLLUTION PIPER X Help Contents Back
▼
▼
248©Ohio Department of Natural Resources Help Contents Back
▼
▼
248
Background Information
Pollution is somethingthat contaminates theenvironment, affectingair, water and land.Contamination can be ofvarying degrees, from lit-
ter that creates a visual blight to hazardous substances that reachdrinking water sources and threatenhuman health. Contaminates, in theform of pollutants, include wastematerials, litter, noise, heat, gas, radia-tion and particulate matter. Nature,as well as humans, can be the cause ofpollution. However, the intermittentand dispersed nature of natural pollu-tants generally weakens their impacton the environment.
Natural pollutants include partic-ulate matter and gases from volca-noes, wastes and gases from living anddying plant matter, and particulatematter from dust storms and burningforests. Human-generated pollutantsinclude litter and material dumpedillegally, sewage, automobile emissionsand fluids, and various land, waterand air pollutants from extractionindustries (mining, drilling and har-vesting), manufacturing industriesand power plants. Natural andhuman-generated pollutants enter theenvironment from various sourcesand spread throughout the environ-ment in pathways that are influencedby soil porosity, slope of terrain,waterways, and wind and air currents.
Some pollution has a well-definedsource, such as power plant smoke-stacks that release emissions into theair, or factory drain pipes that releasewaste matter into rivers or lakes.Other sources of pollution, referred toas non-point source pollution, arebroader in scope and may originate
from many sources. These includerainwater runoff from parking lots,lawns, driveways, fields and miningareas that can deposit potentiallyharmful substances into soil andwaterways, or cause soil erosion. Bothpoint and non-point source pollu-tants can be hazardous to livingorganisms depending upon theirchemical makeup and/or particle size.
Some human activities reducepollution and its negative impacts onthe environment. Hazardous materialsreduction practices and pollutioncontrol technology can be applied byindustry to reduce pollution. Farmerscan reduce the use of pesticides andfertilizers, and practice tilling methodsthat prevent runoff into waterways.People can avoid littering and reducethe amount of household hazardousmaterials and lawn chemicals theyuse. Recycling is an effective pollutionreduction method involving peopleand industry.
Recycling reduces pollution at theearly stages of a product’s lifecycle.First, it decreases the need to extractand process natural resources.Resource extraction and processingcan pollute air, land and water withhazardous materials. These processesrequire a great deal of energy. Burningfossil fuels (coal, oil, natural gas)releases pollutants (sulfur dioxide,nitrogen oxide and carbon monoxide)into the air. Second, the use of recy-cled materials can reduce the amount
of energy (and air pollution) requiredto manufacture products or consumergoods. Finally, using recycled materi-als also generates less solid waste tobe landfilled or incinerated.
The U.S. EPA provides the follow-ing summation of specific pollutantsreduced by recycling:
A recent analysis of several studiesconcluded that the environmentalimpacts of recycled-content products areless than those of virgin products whenthe two are compared over their entire lifecycles. The analysis found that whencompared to a system based on the useof virgin materials and landfilling orincineration, recycling and manufac-turing products from recovered materials results in a net reduction in10 major categories of air pollutants(aldehydes, ammonia, carbon dioxide,carbon monoxide, hydrocarbons,methane, nitrogen oxides, other organics, particulates and sulfur oxides)and eight major categories of waterquality indicators and water pollutants(biochemical oxygen demand, chemicaloxygen demand, dissolved solids, iron,metal ions, oil, sulfuric acid and sus-pended solids).*
It is important to note that theability of recycling to accomplishreductions in pollution is variable,depending upon the material andmanufacturing processes utilized.Each material and product has aunique lifecycle that must be analyzedin the context of specific conditions.
Recycling reduces pollution at the early stages of aproduct’s lifecycle.
*R. A. Denison, “Environmental life-cycle comparisons of recycling, landfilling, and incineration: A review of recent studies,” Annu.Rev. Energy Environ: 21:191-237; as sited in Puzzled About Recycling’s Value? Look Beyond the Bin, U.S. Environmental ProtectionAgency, EPA530-K-97-008 (January 1998), p. 7.

Windows on Waste - PAYING THE POLLUTION PIPER X Help Contents Back
▼
▼
249©Ohio Department of Natural Resources Help Contents Back
▼
▼
249
Bibliography and AdditionalResourcesStudent Resources
Books
Earthday Activities, HuntingtonBeach, California: Teacher CreatedMaterials, Inc., 1996.
Earth Book For Kids, by LindaSchwartz, California: The LearningWorks, Inc.
EarthSearch, by John Cassidy, PaloAlto, California: Klutz Press, 1994.
Facts on Domestic Waste and IndustrialPollutants, by Hugh Johnstone, NewYork: Aladdin Books Ltd, 1990.
How Cities Work, unknown,California: Ziff-Davis Press, 1995.
Media
Think Earth and “e” (video). A seriesof two videos for grades K-3 and 4-6.May be obtained by contacting theEducational Development Specialists,5505 East Carson Street, Suite 250,Lakewood, CA 90713.
Educator Information
The ABCs of Environmental Education,Can Manufacturers Institute, 1997,1625 Massachusetts Avenue, NW,Washington, DC 20036,(202) 232-4677.
A Breath of Fresh Air, Akron, Ohio:Akron Health Department, 1991.
Cartons, Cans and Orange Peels,Where Does Your Garbage Go?, byJoanna Foster, Clarion Books, 1991.
Common Questions about HealthEffects, Citizens Clearinghouse forHazardous Wastes, 1992.
Earth Science: 100 ReproducibleActivities, Grand Rapids, Michigan:Instructional Fair, Inc., 1991.
Green Teacher – Education for PlanetEarth (quarterly magazine), P.O. Box1431, Lewiston, NY 14092.
Garbage! Where It Comes from, WhereIt Goes, by Evan and JanetHaddingham, Simon & Schuster,1990.

Windows on Waste - PAYING THE POLLUTION PIPER X Help Contents Back
▼
▼
250©Ohio Department of Natural Resources Help Contents Back
▼
▼
250
PreparationPrior to conducting the activity, labeleach of the six containers with six sheetsof paper as follows:
● Manufacturing & Air Pollution
● Manufacturing & Water Pollution
● Manufacturing & Land Pollution
● Recycling & Air Pollution
● Recycling & Water Pollution
● Recycling & Land Pollution
Place all Manufacturing Pollution signson one table or location of the room,and place all Recycling Pollution signsat another table. Place one container oneach sign, with water containers placedon each of the Water Pollution signs.
Procedure Discuss the terms manufacturing
and recycling with students. Tell stu-dents they will be working in pairs todetermine how much pollution is gen-erated in the manufacturing of alu-minum cans, and compare that to howmuch pollution is generated during therecycling process. Review the back-
ground information and explain thevarious types of pollution to students ina manner they will understand. (Note:You may find that using Activity 2 firstprovides a better way of introducingstudents to pollution.) Explain that anypart of the manufacturing process mayor may not affect land, air and waterquality or a combination of all three.The same will be true for recycling.
Have students work in cooperativegroups. Distribute the two-page hand-out, The Thing from Nature, to each student. Have students complete thehandout based on group discussion andconsensus. They should compute andrecord total numbers of pollutionpoints for each column and total allcolumns to indicate total pollutionunits for manufacturing with naturalresources.
Distribute marbles, food coloringand cotton balls to each group. Theseitems will represent the following:
● cotton balls = air pollution
● food coloring = water pollution
● marbles or building blocks = landpollution
3
2
1
The “Costly” ThingObjectivesStudents will be able to: (a) identify sources of pollution in the manufacturingprocess of aluminum cans; (b) explain how recycling processes reduce pollution and conserve natural resources; (c) sequence production stages in manufacturingprocesses; and (d) make inferences about the effect of recycling upon ecosystems.
Act
ivity
1
Inquiries● What types of pollution and
waste are generated by indus-try in the production of con-sumer goods?
● How do industrial processesaffect the environment?
● How can recycling reducepollution?
Content DomainScience – General science, earthscience
Social Studies – Economics
Learning OutcomesCitizenship, Grade 4, #11
Science, Grade 4, #5, #14 andGrade 6, #4, #17
Duration50-75 minutes
continued next page
PAYING THE POLLUTION PIPER

Windows on Waste - PAYING THE POLLUTION PIPER X Help Contents Back
▼
▼
251©Ohio Department of Natural Resources Help Contents Back
▼
▼
251
As you review each group’s answers onthe handout, have a representative fromthe group deposit the number of itemsthat their group assigned to air, landand water pollution in the manufactur-ing containers. (For example, if onegroup has a water pollution value of “3”for any part of the chart, they will addthree drops of red food coloring to theappropriate water pollution container).Chart answers on the chalkboard.
Repeat steps 2 and 3, only thistime use the handout, The ThingReturns, and deposit pollution units inthe recycling containers.
Have students compare the differ-ences between manufacturing with nat-ural resources and manufacturing withrecycled materials. Which of the twoprocesses generates more pollution?Which of the two processes uses themost energy? Most water? Mostresources? Why?
Using two stalks of celery or whitecarnations, place several cuttings in eachcontainer of red food coloring. Using athird container, add clear tap water anda stalk. After an hour, have studentsrecord their observations and discusshow pollution can affect living organisms.
Ask students why aluminum cansare made and what purpose they serve.Have them describe the technologiesrequired to make aluminum cans andhow these technologies affect the envi-ronment. Discuss the technologicalaspects of recycling and how these affectthe environment.
AssessmentMethod A: Have each student draw andlabel the sequential stages in the makingof an aluminum can from a natural
resource and another sequence for mak-ing a can from recycled cans.
Method B: Complete the multiple-choice handout, Questionable Things.
ANSWERS: 1. c, 2. b, 3. b, 4. c
ExtensionsHave students search the Internet
for more information about local recy-cling programs. For information specifi-cally about aluminum cans, use the fol-lowing addresses:
Aluminum Association -www.aluminum.org
Can Manufacturers Institute -www.cancentral.com
Have students create two recyclingwheels. One wheel should depict a nat-ural cycle of their choice (leaves of atree, water cycle, seasons, etc.), the otherwheel should depict the recycling of amaterial. Have them identify how eachare similar and how each differ. Havestudents identify how the cycle is con-tinuous for each. List the things neededto continue each cycle.
Discuss with students other recy-clable products, such as glass bottles,steel cans, newspaper and plastic bot-tles. Have them research these items andgenerate comparative sequential stagesfor pollution, like what was done withaluminum cans in the activity.
3
2
1
7
6
5
4
MaterialsSix large, clear containers(two containers filled half-waywith water); six sheets of note-book or construction paper;couple bags of cotton balls;several bottles of red foodcoloring (one per studentgroup or assign one person perwater container to dispense redfood coloring during the activi-ty); several bags of marbles orcolored building blocks
Handouts● The Thing from Nature
● The Thing Returns
● Questionable Things
PAYING THE POLLUTION PIPER

Windows on Waste - PAYING THE POLLUTION PIPER X Help Contents Back
▼
▼
252©Ohio Department of Natural Resources Help Contents Back
▼
▼
252
Student Handout ✐
The Thing From Nature(Manufacturing Aluminum Cans from Natural Resources)
Directions: Complete the chart below. Guess how much pollution enters the environment during each processby assigning pollution points for land, air and water. Pollution points are based on your group's discussion.Assign 8, 9 or 10 points if you think the pollution highly impacts the environment; 4, 5, 6 or 7 points if youthink the pollution moderately impacts the environment; and 1, 2 or 3 points if you think the pollution has alow impact on the environment. Use your best judgment to determine points for each column.
Note: Some processes may affect only one part of the environment—land, air or water. Other processesmay affect more than one part.
PROCESSES POLLUTION POINTSLand Air Water
1. Aluminum is made from the mineral bauxite, which isfound deep in the Earth’s crust. Bauxite is often mined inother countries, using big machines that strip asideplants and soil.
2. The bauxite ore is shipped to the United States in trucks,ships and railroad cars to processing plants.
3. Large electric currents are used at the processing plantto separate the oxygen from the aluminum. The rest ofthe ore is thrown away.
4. The aluminum is heated at very high temperatures andpoured into large blocks or ingots. Water is used to helpcool the aluminum. The water, which may be very hot,enters streams or lakes.
5. The aluminum ingots are transported to anotherprocessing plant in trucks or railroad cars.
6. Aluminum ingots are coiled into long sheets of aluminum by machine. These coiled sheets will be used to make beverage cans.
7. Aluminum sheets are coated with a protective chemical.Some chemicals spill on the floor, which is cleaned withsoap and water.
8. The aluminum goes through a large, electric cuttingmachine that will shape the can. Scraps may fall on thefloor. The scraps will be thrown away or recycled.
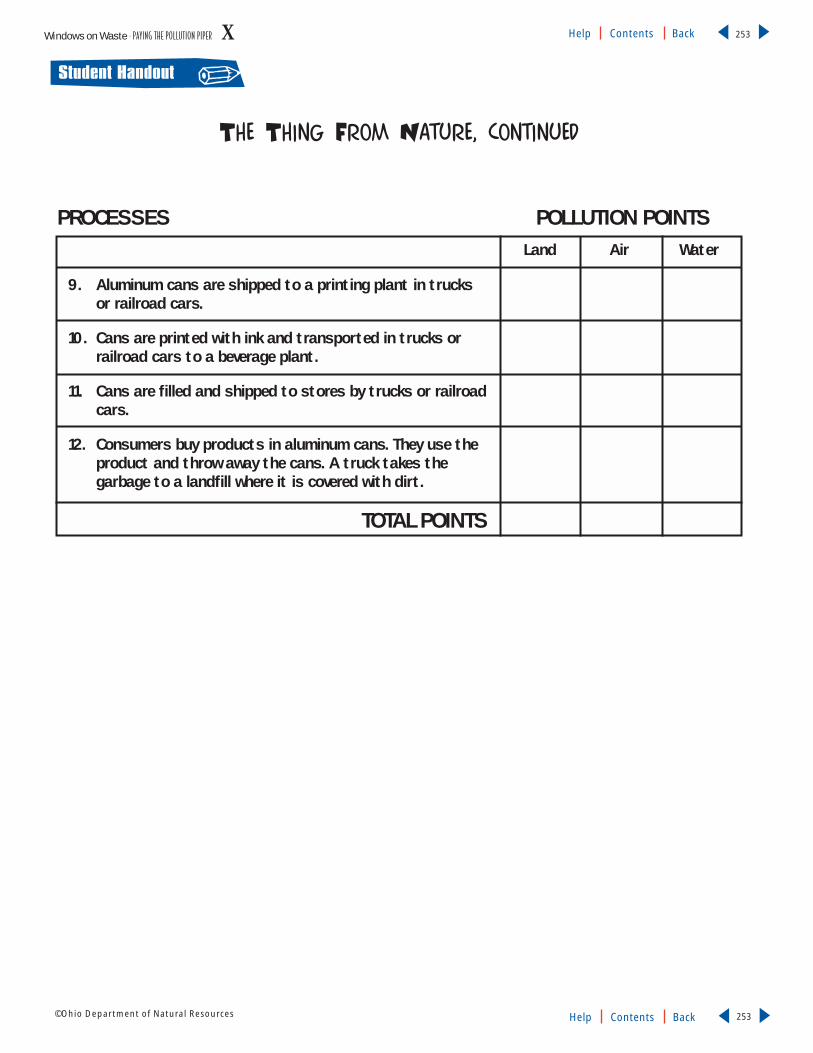
Windows on Waste - PAYING THE POLLUTION PIPER X Help Contents Back
▼
▼
253©Ohio Department of Natural Resources Help Contents Back
▼
▼
253
Student Handout ✐
PROCESSES POLLUTION POINTSLand Air Water
9. Aluminum cans are shipped to a printing plant in trucksor railroad cars.
10. Cans are printed with ink and transported in trucks orrailroad cars to a beverage plant.
11. Cans are filled and shipped to stores by trucks or railroadcars.
12. Consumers buy products in aluminum cans. They use theproduct and throw away the cans. A truck takes thegarbage to a landfill where it is covered with dirt.
TOTAL POINTS
The Thing From Nature, continued

Windows on Waste - PAYING THE POLLUTION PIPER X Help Contents Back
▼
▼
254©Ohio Department of Natural Resources Help Contents Back
▼
▼
254
The Thing Returns(Manufacturing Aluminum Cans Using Old Aluminum Cans)
Directions: Complete the chart below. Guess how much pollution enters the environment during eachprocess by assigning pollution points for land, air or water. Pollution points are based on your group’sdiscussion. Assign 8, 9 or 10 points if you think the pollution highly impacts the environment; 4, 5, 6or 7 points if you think the pollution moderately impacts the environment; and 1, 2 or 3 points if youthink the pollution has a low impact on the environment. Use your best judgment to determine pointsfor each column affected.
Note: Some processes may affect only one part of the environment—land, air or water. Otherprocesses may affect more than one part.
RECYCLING PROCESSES POLLUTION POINTSLand Air Water
1. Aluminum cans are collected by a truck and taken to a recyclingplant where they are baled by machine.
2. Aluminum is shipped in trucks or railroad cars to an aluminumprocessing plant.
3. Baled aluminum is melted using about 95 percent less energythan it takes to melt bauxite ore. The melted aluminum is pouredback into ingots. Water is used to cool the aluminum.
4. The aluminum ingots are transported to another processing plantin trucks or railroad cars.
5. Aluminum ingots are coiled into long sheets of aluminum bymachine. These coiled sheets will be used to make beverage cans.
6. Aluminum sheets are coated with a protective chemical. Somechemicals spill on the floor, which is cleaned with soap and water.
7. The aluminum goes through a large, electric cutting machine thatwill shape the can. Scraps may fall on the floor. The scraps will bethrown away or recycled.
8. Aluminum cans are shipped to a printing plant in trucks or railroad cars.
9. Cans are printed with ink and transported in trucks or railroad cars to a beverage plant.
10. Cans are filled and shipped to stores in trucks or railroad cars.
11. Consumers buy products in recycled aluminum cans. They use theproduct and recycle the cans.
TOTAL POINTS
Student Handout ✐

Windows on Waste - PAYING THE POLLUTION PIPER X Help Contents Back
▼
▼
255©Ohio Department of Natural Resources Help Contents Back
▼
▼
255
Student Handout ✐
Questionable ThingsDirections: Provide the one best answer in the space beside each question.
____1. When aluminum cans are recycled, which process below is not needed to make a new can?
a. aluminum ingots are transportedb. coating aluminum sheets with a protective chemicalc. mining bauxite ored. aluminum sheets are cut into cans
____2. Studies show that recycling reduces the amount of energy needed to manufacture aproduct. Energy saved by recycling reduces emissions of sulfur dioxide, nitrogen oxideand carbon monoxide into _____.
a. waterwaysb. airc. land
____3. Fossil fuels, such as coal and natural gas, are burned to generate lots of energy tomake new aluminum cans. Recycling old aluminum cans to make new aluminum savesenergy. By saving energy, we burn less fuel and reduce the amount of ______.
a. laborb. pollutionc. needsd. wants
____4. Recycling saves energy, saves natural resources and _____.
a. increases pollutionb. wastes people’s timec. saves land space for disposald. reduces consumption

Windows on Waste - PAYING THE POLLUTION PIPER X Help Contents Back
▼
▼
256©Ohio Department of Natural Resources Help Contents Back
▼
▼
256
PreparationExplain to students that they will bestudying pollution. As a pre-assessmentactivity, have each student write his/herown definition of the word pollutionwithout any discussion. Students shouldfold their responses and seal them inenvelopes and write their names on theenvelopes. Collect all envelopes for later use.
Procedure
Divide students into groups, anddistribute the handout, Mapping Pollution,to each student. Explain that the illustration depicts how pollution isgenerated by humans and by nature.Have students identify sources ofnatural pollution and sources ofhuman-made pollution. Collect all theenvelopes for later use.
Discuss the term pathway. Explainthat there are three basic pathways: air,land and water. Identify one source ofpollution on the map and a specific pol-lutant from that source and discusspotential pathways for that pollutant.
Distribute the handout, PollutionClues, to each student in each group.Working in groups, have students com-plete the handout, referring to the illus-tration, Mapping Pollution, if needed. Ifstudents have difficulty making infer-ences to complete the handout,Pollution Clues, you may wish to writethe answers (out of order) on the boardand have students choose the answersthat match the clues.
ANSWERS for handout, Pollution Clues:
1. leaves 2. methane gas 3. non-point source pollution4. people who litter 5. fuel for energy 6. fire7. mining8. illegal dumping
Review group answers and discuss.Have students identify each source ofpollution on the handout, MappingPollution, which is described on thehandout, Pollution Clues. They mighttrace with a different colored marker orcrayon each of the different pathwaysfor each source of pollution.
NOTE: When the word “contamina-
4
3
2
1
Pollution on the MoveObjectivesStudents will be able to: (a) describe pollution; (b) identify sources of natural andhuman-made pollutants; (c) explain how pollutants enter and move throughout theenvironment; and (d) explain how recycling reduces pollution.
Act
ivity
2
Inquiries● What is pollution and how
can pollutants be classified?
● How do pollutants enter and move throughout theenvironment?
● What are the potential effectsof pollution?
Content DomainScience – General science, earthscience, biology
Social Studies – Geography
Learning OutcomesScience, Grade 4, #14 andGrade 6, #4, #17
Duration60 minutes
MaterialsOne envelope (for each student), notebook paper,crayons
Handouts● Mapping Pollution
● Pollution Clues
● Venn Diagram
PAYING THE POLLUTION PIPER

Windows on Waste - PAYING THE POLLUTION PIPER X Help Contents Back
▼
▼
257©Ohio Department of Natural Resources Help Contents Back
▼
▼
257
tion” appears in the clues, discuss withstudents how contamination may repre-sent hazardous materials, some harmfulto human health. You may wish to dis-cuss how some hazardous materialsaccumulate in food chains (algae to fishto larger fish) until they reach humanswho then ingest those chemicals, whichmay cause serious diseases or other dis-orders.
Discuss ways that pollution can beprevented in each of the examples.
Have students identify the recy-cling center in the illustration, MappingPollution. Have them identify threepollutants (sources of pollution) thatare reduced when recycled materials areused to make products.
ANSWERS to teacher inquiry:
● potential water, land and air pollu-tants are reduced by recycling becausethere is less need for mining
● air (energy) pollution and potentialwater pollution from the factory arereduced by recycling
● land, air and potential water pollu-tants from the landfill are reduced byrecycling
If you did not conduct Activity 1, The“Costly” Thing, review the backgroundinformation and explain the recyclingconcepts (how recycling reduces pollu-tion) to students.
AssessmentHave each student write a new
definition for pollution. Returnenvelopes made by students at thebeginning of the activity. Have themcompare their original definition of pol-lution to their new definition.
Have students add a source of pol-lution (not already provided) to theillustration on the handout, MappingPollution, and trace a pathway for it.
Using the handout, Venn Diagram,have students compare and contrast thedifference between natural pollutantsand human-generated pollutants.
ExtensionHave students identify pollution reduc-tion strategies they can employ at homeand at school. Create a pollution actionbulletin board. Have students identifyways to measure their impact.
3
2
1
6
5

Windows on Waste - PAYING THE POLLUTION PIPER X Help Contents Back
▼
▼
258©Ohio Department of Natural Resources Help Contents Back
▼
▼
258
Student Handout ✐M
apping P
ollution

Windows on Waste - PAYING THE POLLUTION PIPER X Help Contents Back
▼
▼
259©Ohio Department of Natural Resources Help Contents Back
▼
▼
259
Student Handout ✐
Pollution CluesDirections: Complete the pollution chart below by writing answers in the first column for eachexample of pollution. The clues in the squares to the right should help you pick the “cause.”
waste material (somemay be hazardous)dumped anywhere inquantity
land, waterways (rivers,lakes, ground water)
may contaminate soil,waterways and attractmice, rats and othervermin
CAUSE SOURCE PATHWAY EFFECT
trees, branches oftrees
land, air (wind) andwaterways (rivers,lakes, storm sewers)
may collect on landand beside buildings,suffocate grass, supplynutrients to soil
cows, termites, landfills (anaerobicbacteria)
air and atmosphere can combust creatingexplosions and fire,may contribute toglobal climate change
rainwater on driveways,parking lots, lawns,fields
land (yards, streets),waterways (sewers,creeks, rivers, lakes)
may contaminatedrinking water andwater habitats forplants and animals
people everywhere air (wind), waterways,land
collects on land, mayattract mice, rats, andmakes the Earth lookugly
factories, automobiles, power plants, homes
air and atmosphere may contaminate theair and contribute toglobal climate change
heat and combustion,volcanoes, lightning
air (wind), land(forests, buildings)
may release particulatematter (and sometimesharmful gases) into theair; may destroy forestland and buildings
digging minerals (ironore, copper, bauxite)out of the land anddrilling for fossil fuels(coal, oil, natural gas)
land, waterways (rivers,lakes)
may cause soil erosion,may contaminatewater and soil
8.
1.
2.
3.
4.
5.
6.
7.

Windows on Waste - PAYING THE POLLUTION PIPER X Help Contents Back
▼
▼
260©Ohio Department of Natural Resources Help Contents Back
▼
▼
260
Student Handout ✐Venn D
iagram
Nat
ural
Pol
luta
nts
Both
nat
ural
an
d hu
man
-mad
epo
lluta
nts
Hum
an-m
ade
pollu
tant
s

Windows on Waste - PAYING THE POLLUTION PIPER X Help Contents Back
▼
▼
261©Ohio Department of Natural Resources Help Contents Back
▼
▼
261

EnvironmentalStudies LearningConcept
The increase in the production
of hazardous materials and
emissions in the past century
has resulted from technological and
scientific advances that led to the
development of numerous consumer
products, which have made life easi-
er, safer and more comfortable. Yet,
there have been environmental con-
sequences of this progress, including
pollution and health risks from pro-
duction processes and chemicals
related to many consumer products.
Household hazardous materials
serve valuable, functional purposes,
such as home cleaning and protec-
tion from pests. However, household
hazardous materials may have
harmful effects when misused by
humans and disposed of improperly.
Sometimes, alternative (less haz-
ardous) materials can be substituted
for the original hazardous
materials.
Vocabularycorrosive chemical – a chemical or its vapor that can destroy a material or livingtissue; capable of wearing away by chemical action
explosive chemical – a chemical that can cause sudden, instantaneous release ofheat and pressure
flammable – catches fire easily and tends to burn rapidly
hazardous material – a material that is toxic, corrosive, reactive and/or explosive
ignitable chemical – can cause sudden, instantaneous release of heat and pressure;flammable
ingestion – to take in by swallowing
inhalation – to take in by breathing
irritant – causes soreness or swelling of skin, eyes, mucus membranes or respiratorysystem
irritation – irritability, soreness, roughness or inflammation of a bodily part
landfill – a site for the burial and decomposition of solid waste
poison – a substance that through chemical action kills or injures an organism
reactive chemical – a chemical that can spontaneously react with air and water,generate toxic gases and become unstable when exposed to heat or shock
toxic – can cause injury or death if swallowed, inhaled or absorbed through theskin; poisonous
HOME, SAFE HOMEWindows on Waste - HOME , SAFE HOME XI Help Contents Back
▼
▼
262©Ohio Department of Natural Resources Help Contents Back
▼
▼
262

Windows on Waste - HOME , SAFE HOME XI Help Contents Back
▼
▼
263©Ohio Department of Natural Resources Help Contents Back
▼
▼
263
Overview - HOME, SAFE HOME
1Activity 1: Home, Safe HomeDescriptionStudents define and discuss the elements of household hazardous waste. They makeinferences from this information to identify potential consequences to human health andthe environment from the misuse and improper disposal of household hazardous mate-rials. They identify products and locations of hazardous materials in their households.Students read text to identify alternatives to hazardous materials and manipulate materi-als to make a “green cleaning wheel” that is a quick reference for alternative products.
Ohio Proficiency Test Learning OutcomesGrade 4, Reading #13 – Demonstrate an understanding of text by retelling the information, inwriting, in own words.
Grade 4, Reading #14 – Identify and interpret vocabulary critical to the meaning of the text.
Grade 4, Reading #17 – Infer from the text.
Grade 4, Science #14 – Identify and/or describe the relationship between human activity andthe environment.
Grade 6, Reading #12 – Infer from the text.
Grade 6, Science #16 – Analyze behaviors and/or activities that positively or negatively influence human health.
Summary
This lesson consists of
a single activity
divided into three
parts. The first part pro-
vides information about
hazardous materials and
the concepts needed to con-
duct the other two parts of
the activity.
When people think ofhazardous waste, theygenerally think of thewaste produced byindustry. But many of
the products in our homes containhazardous substances. Once used, theproduct is thrown out along withother household wastes, and residualamounts of hazardous substancesoften remain in the container. Thesehazardous materials then go to a dis-posal facility, such as a landfill or anincinerator. Sometimes, however, peo-ple dispose of household hazardouswastes on their own by burning them,dumping them on the ground or intowaterways, or by pouring them downa sink, toilet or storm sewer system.These actions have the potential to
threaten human health and the envi-ronment.
In most cities and towns, if a haz-ardous substance is poured down asink or flushed down a toilet, it willflow through the sewer system to asewage plant. There, some hazardouschemical wastes may be removed ortreated to make them less harmful.However, for various reasons, toxicsubstances are not always removed orproperly treated, and these substancescan be discharged or absorbed intoconnecting waterways (creek, stream,river or lake). Sometimes in a sewagetreatment plant, hazardous wastes killthe living organisms that should befeeding on the harmful bacteria inorganic waste.
If the waste from a home flows
into a septic tank, it will eventuallyspread out through a drain field withthe potential to reach groundwater orwaterways. If hazardous substances aredumped on the ground, they can travelto a storm drain, waterway or downinto the groundwater. Groundwater can become contaminated when theground becomes saturated by rainwater.
The act of improperly disposingof household hazardous wastes is sim-ilar to illegally dumping industrialhazardous wastes. It is important toproperly dispose of household prod-ucts that contain hazardous substancesbecause they can potentially threatenhuman health and the environment.
Background Information

Windows on Waste - HOME , SAFE HOME XI Help Contents Back
▼
▼
264©Ohio Department of Natural Resources Help Contents Back
▼
▼
264
ProcedurePART A
Discuss with the class what makesa product a hazardous material. Showstudents examples of potentially haz-ardous products that include the follow-ing traits:
toxic chemical – harms or kills plantsand/or animals by poisoning; can bepoisonous to humans
corrosive chemical – causes visibledestruction of, or irreversible changes in
living tissue; requires appropriate con-tainer to avoid leakage from corrosion
reactive chemical – can spontaneouslyreact with air or water to cause anexplosion; may generate toxic gases andbecome unstable when exposed to heator shock
ignitable chemical – can cause sudden,instantaneous release of heat and pres-sure; poses a fire hazard, is flammable;can burn or catch on fire
Before writing these traits on the board,read the labels of the hazardous prod-ucts used as examples and have students
1
ObjectivesStudents will be able to: (a) identify potential household hazardous products; (b)
describe the potential effect of hazardous products on human life and the
environment; and (c) identify less hazardous alternative products.
Act
ivity
1Inquiries● What is a household
hazardous product?
● How do we come in contactwith these products?
● Are there alternatives to thesematerials?
● Why should we be concernedabout throwing householdhazardous products in ourgarbage?
Content DomainLanguage Arts – Reading
Science – General science,health
Learning OutcomesReading, Grade 4, #13, #14, #17and Grade 6, #12
Science, Grade 4, #14 andGrade 6, #16
HOME, SAFE HOME
Bibliography and AdditionalResourcesEducator Information
Clean House, Clean Planet, by KarenLogan, Pocket Books, 1997.
Ground Water, Ohio EnvironmentalProtection Agency, Columbus, Ohio,1988.
Clean & Green, by Annie Berthold-Bond, 1994.
What to Use Instead, by Carol AnnRinzler, Pharo Books, 1987.
52 Ways to Make Your House LookGreat, by Connie Neal, ThomasNelson Publishers, 1993.
Another Use For…, by Vicki Lansky,The Book Peddlers of Derphaven,Minnesota, 1991.
The Indoor Naturalist, by GaleLawrence, Prentice Hall Press, 1986.
Mary Ellen’s 1000 New Helpful Hints,by Mary Ellen Pinkham, Doubleday,1983.
Home Ecology, by Karen Christensen,Fulcrum Printing, 1990.
The Complete Book of HomeEnvironmental Hazards, by RobertaArtman, Facts on File, 1990.
Down Home Ways, by Jerry MackJohnson, Times Books, 1978.
Clinical Toxicology of CommercialProducts, by Robert E. Gosselin,Williams and Wilkins, 1984.
Toxics in My Home? You Bet!, GoldenEmpire Health Planning Center,Sacramento, California, 1984.
Internet
Life on the Planet:www.cleanhouse.com
Background Information, continued
continued next page

Windows on Waste - HOME , SAFE HOME XI Help Contents Back
▼
▼
265©Ohio Department of Natural Resources Help Contents Back
▼
▼
265
make inferences about how the prod-ucts may be potentially harmful.
Have students write down the fourtraits of hazardous materials, using theirown definitions, based on class discus-sion of the terms. They will need thesedefinitions for a homework assignmentin Part B.
Discuss how hazardous productsbecome waste with the potential toharm the environment. (They can bethrown in household trash with con-tents and residues in the containers andlandfilled; contents are sometimespoured down a storm sewer, dumpedon the ground, poured down the drainor toilet). Explore with students howhazardous materials, once in the envi-ronment, can move throughout theenvironment and have harmful effectsby using the handout MappingPollution, p. X-14, in Lesson X, Payingthe Pollution Piper.
To explore the potential effects ofhazardous materials on people, use thehandout, Unsafe Situations, for discus-sion points.
Discuss the nature of alternativeproducts (potentially safer, use fewerchemical ingredients and may be lessexpensive). Give examples of some ofthese substitutes and their application.
Divide students into groups and giveeach student the handout, GreenCleaning. Give each group the handout,Alternative Products, to complete, usingthe information from the handout,Green Cleaning. Keep in mind that theremay be more than one alternative orcombination of alternatives.
PART B
Have students conduct a homeinventory. You may give each studentthe layout of a generic house on thehandout, Caution! What’s Where in MyHome?, or if time is available, have stu-
dents draw a “blueprint” of their homeand label each room. Make sure theyinclude the garage and basement (ifthese exist in their home), and thekitchen, bathroom and utility room.
Have students take their inventorysheet home. Moving from one room toanother, have students identify one ortwo household products per room, aswell as identify the purpose of eachproduct. Based on reading the label,have students determine how it may bepotentially hazardous. They may needthe definition sheet produced in Part A,Step 1 to decide if the product is hazardous.
NOTE: It may be helpful and precau-tionary to send a letter home with thestudents indicating that parental helpmay be needed to identify and handlehousehold hazardous products and tohelp interpret labels.
Discuss students’ inventories inclass and make a list of all the productsmentioned, giving the generic name foreach, its purpose and any descriptionsthat indicate hazardous potential.
PART C
Have students create a “greencleaning wheel.” Prepare the wheel byreproducing the templates on cardstock. See handouts, Small Wheel andLarge Wheel. Cut out patterns.
Assemble the wheel by punchingout the center holes and securing with abrass fastener.
The Large Wheel includes a sampleanswer. Have students use the handout,Green Cleaning, to research alternativeproducts to complete their wheels.
3
2
1
3
2
1
4
3
2
DurationPart A: 40 minutes
Part B: 20 minutes plus home-work assignment
Part C: 30-40 minutes
Materials1˝ brass fasteners, paperpunch, card stock wheel templates, scissors, fine linemarkers, drawing paper,labels or copies of varioushousehold cleaners
Handouts● Unsafe Situations
● Green Cleaning
● Alternative Products
● Caution! What’s Where in MyHome?
● Small Wheel and Large Wheel
● Home, Safe Home
HOME, SAFE HOME

Windows on Waste - HOME , SAFE HOME XI Help Contents Back
▼
▼
266©Ohio Department of Natural Resources Help Contents Back
▼
▼
266
AssessmentAdminister multiple choice assess-
ment handout, Home, Safe Home.
ANSWERS to Home, Safe Home: 1. d, 2. c, 3. b, 4. d, 5. c
In groups, have students make“green cleaning kits.” Have studentsidentify what and why they includedeach item.
Have students design brochuresthat promote alternative products forthe home and garden.
ExtensionsUsing alternative cleaning meth-
ods is sometimes considered “old fash-ioned.” Have students interview agrandparent or another elder and learnhow the house was cleaned, pests wereeliminated and other household choreswere handled before current productswere available.
Students can try using “green”cleaning for a week. Test some alterna-tive cleaning recipes and compareresults. For example, use baking soda toclean the sink instead of scouring pow-der. Try a carpet freshener made ofcornstarch and cinnamon instead of acommercial product.
NOTE: Students should ask an adult forassistance. To show students how chem-icals react, mix vinegar and baking soda.Discuss the properties and why it ispotentially dangerous to mix householdcleaners.
Examine specific alternative prod-ucts. Research prices of commercialcleaners and alternative products. Havestudents compare the price informationby creating a chart. Remember, mea-surements of weight should be consis-tent for accurate comparisons.
To provide a hands-on example ofan alternative product, students canmake bath salts. Combine 1 cup ofEpsom salts with six drops of scentedoil (rose, vanilla) and six drops of foodcoloring. Shake or stir until blended andpour into a decorative jar.
Sometimes the best way to clean isnot to make a mess in the first place.Have students brainstorm a list ofthings to do to help avoid a mess, elimi-nating the need to use commercialcleaning products, and conserveresources and time. For example, usedoormats inside and out; wipe downthe shower after every use to decreasesoap and shampoo buildup; and usetowels more than once.
5
4
3
2
1
3
2
1

Windows on Waste - HOME , SAFE HOME XI Help Contents Back
▼
▼
267©Ohio Department of Natural Resources Help Contents Back
▼
▼
267
Unsafe SituationsAllow students to predict and brainstorm possible consequences. Share information with students through discussion and use these scenarios as story starters.
PRODUCT SITUATION PREDICTION
Drain cleaner When doorbell rang, the bottle was left on Child could drink it; product is corrosive the bathroom floor. A baby was playing nearby. to skin and eyes.
Lemon furniture oil When polishing some furniture, the cap was Someone might drink it, thinking it was lost. Polish was then placed in a glass near safe; color and scent make it the sink. attractive.
Pills Medicine was left on nightstand to help Children may assume it is candy and eat it.remind the patient to take it.
Antifreeze After changing the antifreeze in a car, someone Pets have died from drinking puddles ofthrew it into a ditch in front of the house. antifreeze; they are attracted by its
sweet taste; environmentally damaging.
Aerosol air fresheners/ A cooking smell was unpleasant so air freshener Fumes make residents sick, or adhere to deodorizers was sprayed in the kitchen. The can was food; the can could explode due to heat.
left sitting on the stove.
Chlorine bleach and The bathroom tile wouldn’t come clean using a Mixing chlorine bleach and ammonia releasesammonia bleach cleanser, so the person cleaning mixed some a toxic gas; the fumes can result in eye,
ammonia with the cleanser to make it stronger. throat and nose irritations and breathing difficulty; products should never be mixed.
Furniture stripper Your neighbor decided to strip the paint off an Using a fan in closed quarters will only old chair. He’s working in his workshop, recirculate the bad air; such products need and turns on the fan. extreme caution and plenty of fresh air.
Hair spray Your sister sprayed her hair to keep the style Fumes from chemical sprays can irritate in place. She left the can on the radiator in and damage skin, eyes and lungs; they can the bathroom. also cause internal harm by entering the
blood stream through the lungs; container can explode from heat.
Pesticides To kill ants in the kitchen, an insect spray was Chemicals can penetrate socks and be applied to the floor. People in the home are absorbed through the skin; health effects often barefoot. of pesticides, especially long-term
effects, are not fully known.
Oven cleaner Although the product called for the use of rubber The chemicals could cause the skingloves, the housekeeper felt they were too clumsy to burn or develop a rash; skin and and used the product without them. eye contact should be avoided.
* Prepared by Dr. Joseph Heimlich, OSU Cooperative Extension; adapted from Oscar’s Options: A Supplementary EnvironmentalEducation Curriculum, by Carole O.Bell and Martha M. Schwartz (Rhode Island State Department of Education, Department ofEnvironmental Management, 1986).

Windows on Waste - HOME , SAFE HOME XI Help Contents Back
▼
▼
268©Ohio Department of Natural Resources Help Contents Back
▼
▼
268
Student Handout ✐
GREEN CLEANING
Hair spray removes ink. Spray stain, let stand andwash as usual.
Denture tablets clean vases. Fill vase about an inchfrom the top with water. Add tablets and let dis-solve completely. Rinse well.
Crayons cover scratches. Rub appropriate color of crayon on scratch.
Toothpaste cleans gold. Rub gold jewelry with paste.Use brush if necessary. Rinse well.
Mayonnaise removes water spots. Spread mayon-naise on water spot. Let soak into wood. Wipe offthoroughly.
Walnuts cover scratches. Scratches on furniture canbe covered by rubbing walnut or other nutmeatdirectly on them.
Soda water cleans carpet stains. Blot stain withsoda water and sponge.
Aluminum foil removes tarnish. Fill a pan with water.Add 1 tbsp. each of salt and baking soda and a fewsheets of aluminum foil. Add silver and let mixtureset for an hour or so. Tarnish goes onto the foil.Rinse the silver in hot water and polish dry.
Lemon juice cleans silver. Soak silver in lemon juice.Rinse well with hot water and polish dry.
Shampoo removes laundry stains. Use shampoo toremove ring around the collar.
Ground spice with cornstarch removes carpet odor.Mix spice (cinnamon, cloves, etc.) and cornstarch,wait several hours or overnight and vacuum.
Vinegar cleans windows. Mix a small amount of vine-gar with 1 cup water and spray as usual.
Green Cleaning
LEMONS
Place cut lemons and water in a tarnished pan orplace tarnished utensils in a pan with lemon water.Stew on low, for about an hour or so, until stains aregone.
Place slices of lemon in a pot of water or potpourriwarmer with water. Simmer gently in the open potfor an hour.
Rub cut lemons into a washed cutting board to eliminate food odors. Set slices of lemons aroundthe kitchen while preparing food.
Pour baking soda into a drain and follow with 1⁄2 cupof lemon juice. Let the mixture stand for 15 minutes(will foam) before rinsing with hot water.
Use lemon juice as a window cleaner.
Lemon juice may be used to clean brass and copper.Add some salt for tough cleaning jobs.
Lighten wood, such as butcher blocks, cuttingboards and raw tabletops, by saturating a spongewith lemon juice and washing the wood. Do not rinse.
Bleach clothes by adding 1⁄4 cup of lemon juice to thewash cycle. It can also be added to the rinse cycle.
Remove ink stains from cloth by soaking in lemonjuice.
Remove mold or rust from cloth by using a pastemade from salt and lemon juice.
Clean chrome with lemon juice or rub a lemon directly on the chrome.
Rinse hands with lemon juice to remove onion odors,berry stains, food coloring, etc.
Remove shampoo residue by rinsing hair with lemonjuice and warm water.

Windows on Waste - HOME , SAFE HOME XI Help Contents Back
▼
▼
269©Ohio Department of Natural Resources Help Contents Back
▼
▼
269
VINEGAR
Running vinegar through a coffeepot will clean it easily. Remember torun clear water through after thevinegar cycle.
Adding 1 cup of vinegar to the rinse cycle will brighten dark colors.
Vinegar and baking soda will keep the drain and toilet bowl clean. Pour 1 cup of baking soda fol-lowed by 1⁄2 cup vinegar, wait, then rinse with hotwater.
For a clean, spotless rinse for dishes, add 1 or 2tbsp. of vinegar to dish water. It also helps to cutgrease.
Clean brass and copper using vinegar and lemonjuice or vinegar and salt, if an abrasive is needed.
Remove soap build-up from shower curtains bycleaning it with a sponge saturated in vinegar.This will also help kill mold and mildew.
Scrub the butcher block with vinegar. Rinse well.
Wash floors with 1 cup of vinegar added to a pailof water.
Carpet stains can be removed by mixing vinegarwith water. Rub with sponge, then rinse well.
Add vinegar to the rinse water to help soften fabric and control static cling and lint.
Remove berry stains by soaking in vinegar.
A solution of half vinegar and half water, whenapplied with a piece of terry cloth, will remove fingerprints and other smears from appliances.
Clean and shine plant leaves of large house plantswith a solution of 1⁄4 cup white vinegar to 1 galloncool water. Apply with a soft cotton cloth.
Pour vinegar on unwanted grass growing betweencracks.
BAKING SODA
Freshen up by placing baking soda in an open container in small areas, such as the refrigera-tor, closets, etc.
Sprinkle baking soda on the carpet to help controlodors. Wait several hours or overnight. Vacuum asusual.
Baking soda and scouring pads will clean an ovenwithout the strong fumes of commercial cleaners.
Baking soda may be used as a scouring powderfor sinks, counter tops, etc.
Control cat litter box odor by sprinkling bakingsoda in the box.
Create spray air freshener by combining 2 tsp. ofbaking soda and 2 tsp. lemon juice with 2 cups ofhot water. Dissolve and use in a spray bottle.
Control garbage odors by adding a sprinkle ofbaking soda to the trash container every time youadd garbage.
Clean and deodorize the microwave with a pasteof baking soda and water. Wash and rinse. Then,to control odors, keep a box of baking soda insidebetween uses.
Baking soda and water makes a cleaning pastefor stainless steel and helps rub away heel or skidmarks.
Odors can be removed from clothes by soakingovernight in the rinse cycle with a box of dissolvedbaking soda.
Use baking soda to clean baby’s things, such astoys, high chair, changing table, etc. Apply todamp sponge, wipe and rinse.
Use baking soda and water to wash off vinyl furniture and car seats.
Baking soda should be kept handy near the grill orstove; it will quickly extinguish flare-ups or sparks.
Keep a box of baking soda in the cooler betweenuses to help eliminate odors; especially helps dur-ing the winter “down” time.
baking soda
vinegar
Green Cleaning, continued

Windows on Waste - HOME , SAFE HOME XI Help Contents Back
▼
▼
270©Ohio Department of Natural Resources Help Contents Back
▼
▼
270
Student Handout ✐
Alternative ProductsDirections: Many of the products we use in our homes are potentially hazardous. Often, safer, lessexpensive alternatives produce similar results. For each of the products below, list an alternativemethod. Remember, there may be more than one answer.
1. room freshener __________________________________________________________________
2. carpet scent __________________________________________________________________
3. drain opener __________________________________________________________________
4. toilet bowl cleaner __________________________________________________________________
5. shower curtain cleaner _______________________________________________________________
6. window cleaner __________________________________________________________________
7. floor cleaner __________________________________________________________________
8. microwave cleaner __________________________________________________________________
9. brass polisher __________________________________________________________________
10. cover scratches __________________________________________________________________
11. coffee pot cleaner __________________________________________________________________
12. laundry stains __________________________________________________________________
13. finger print remover __________________________________________________________________
14. degreaser __________________________________________________________________
15. stainless steel cleaner _______________________________________________________________

Windows on Waste - HOME , SAFE HOME XI Help Contents Back
▼
▼
271©Ohio Department of Natural Resources Help Contents Back
▼
▼
271
Student Handout ✐
bathro
omkitchen
utility
roo
mga
rage
basement
other
room
:
Cau
tion
! W
hat’s
Where in M
y Hom
e?

Windows on Waste - HOME , SAFE HOME XI Help Contents Back
▼
▼
272©Ohio Department of Natural Resources Help Contents Back
▼
▼
272
Small Wheel
PRODUCT
ALTERNATIVE
Student Handout ✐
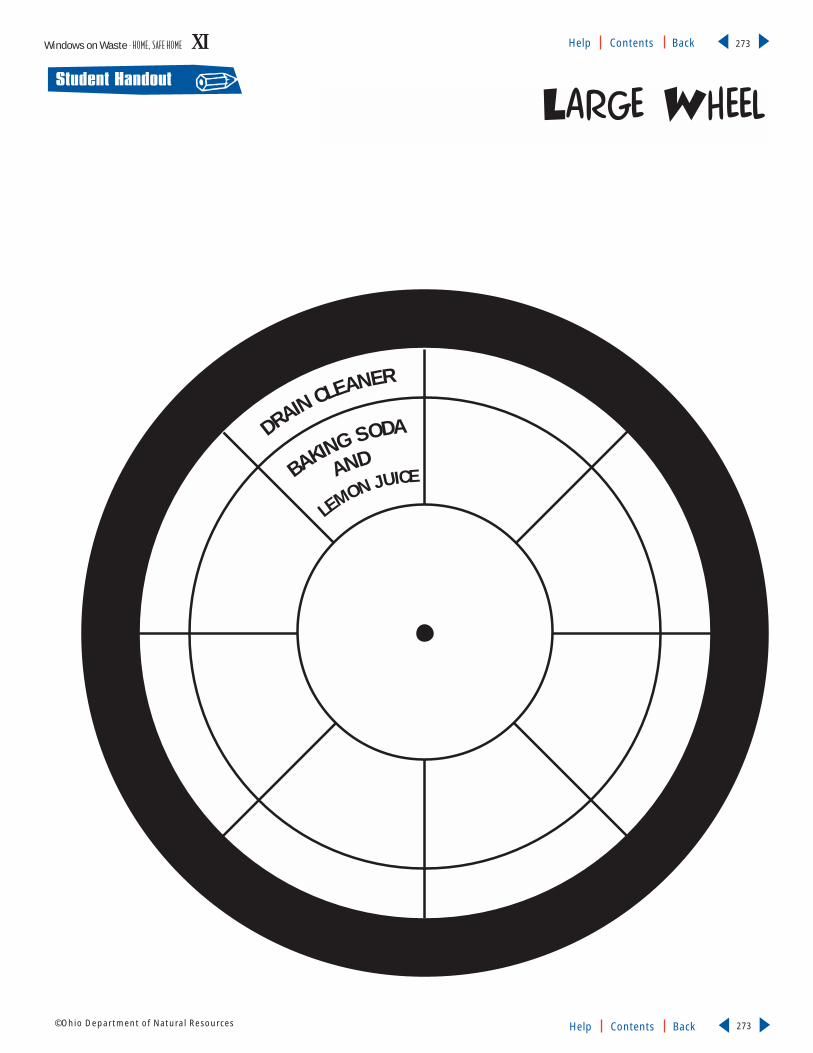
Windows on Waste - HOME , SAFE HOME XI Help Contents Back
▼
▼
273©Ohio Department of Natural Resources Help Contents Back
▼
▼
273
Student Handout ✐Large Wheel
DRAIN CLEANER
BAKING SODA
AND
LEMON JUICE
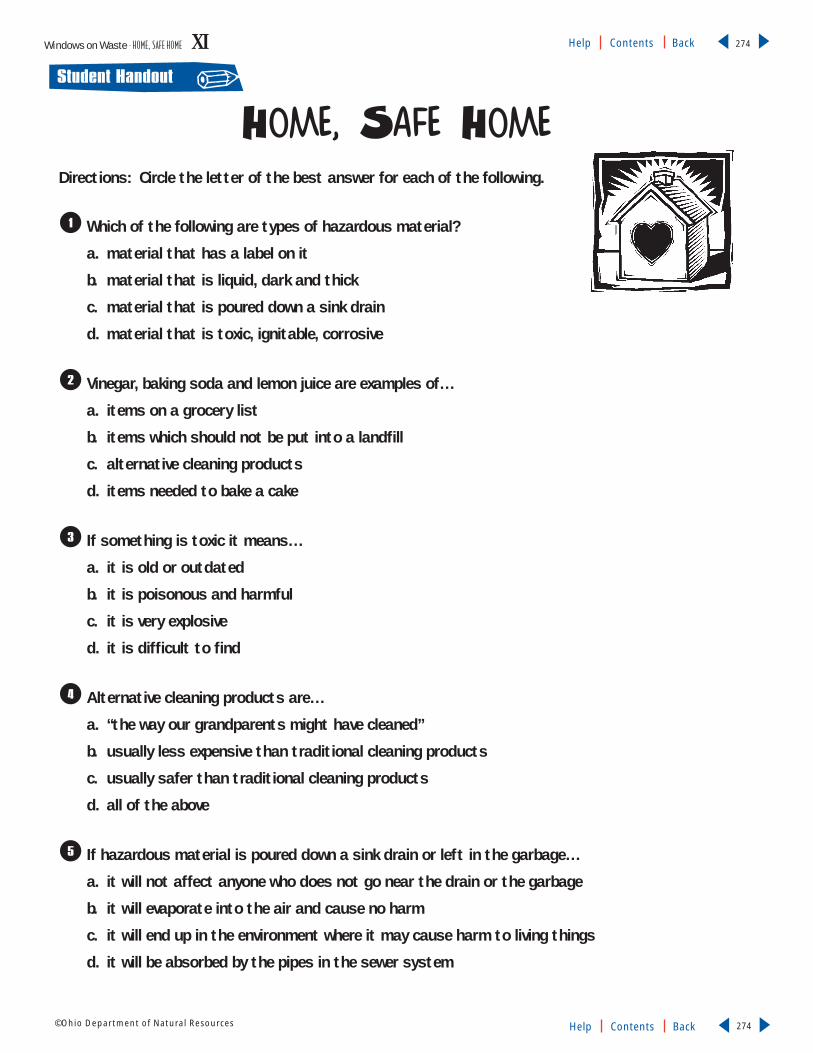
Windows on Waste - HOME , SAFE HOME XI Help Contents Back
▼
▼
274©Ohio Department of Natural Resources Help Contents Back
▼
▼
274
Student Handout ✐
Home, Safe HomeDirections: Circle the letter of the best answer for each of the following.
Which of the following are types of hazardous material?
a. material that has a label on it
b. material that is liquid, dark and thick
c. material that is poured down a sink drain
d. material that is toxic, ignitable, corrosive
Vinegar, baking soda and lemon juice are examples of…
a. items on a grocery list
b. items which should not be put into a landfill
c. alternative cleaning products
d. items needed to bake a cake
If something is toxic it means…
a. it is old or outdated
b. it is poisonous and harmful
c. it is very explosive
d. it is difficult to find
Alternative cleaning products are…
a. “the way our grandparents might have cleaned”
b. usually less expensive than traditional cleaning products
c. usually safer than traditional cleaning products
d. all of the above
If hazardous material is poured down a sink drain or left in the garbage…
a. it will not affect anyone who does not go near the drain or the garbage
b. it will evaporate into the air and cause no harm
c. it will end up in the environment where it may cause harm to living things
d. it will be absorbed by the pipes in the sewer system
5
4
3
2
1

Windows on Waste - HOME , SAFE HOME XI Help Contents Back
▼
▼
275©Ohio Department of Natural Resources Help Contents Back
▼
▼
275

Environmental StudiesLearning Concept
Many sources of pollutants
are irritating to aesthetic
sensibilities. These include
litter (visual pollution), noise (sound
pollution) and odors (olfactory
pollution). There are also natural
irritants, such as storm noises, skunk
odors, and plant and animal litter in
the form of shells and rinds left by
animals, animal dung and dead
plants and animals. Artificial,
human-generated irritants include
noises from machines, odors from
household and industrial solid waste,
and misplaced solid waste in the
form of litter. Sometimes irritants
can threaten the health of living
organisms, such as ingested litter that
causes animals to suffocate or a noise
level that causes hearing loss.
Litter is a special concern in local
communities. It has various sources
associated with human activity that
generate visual and olfactory pollu-
tion. Some forms of litter, such as
waste tires and decomposing food,
can be health hazards depending
upon the location. Governments can
establish laws and policies to reduce
irritating pollutants.
Vocabulary(Note-sources refer to sources or causes of litter)
commercial source – the waste generated by stores and businesses
construction source – scrap building materials that blow away from the construction site
hazard – something that may be dangerous or present peril (usually to thehealth of humans or animals)
household refuse put-outs – improperly covered household trash cans orplastic bags
illegal dumping – improperly disposing unwanted items of garbage or chemicals in the wrong place
litter – human-generated solid waste lying around in disorder, causing a visualand/or health disturbance
loading dock source – the debris scattered by the constant loading andunloading of vehicles
motorist source – waste that is thrown from or falls from cars and trucks
pedestrian source – waste dropped or thrown by people standing or walking
recycle – the act of collecting and separating materials and products from thesolid waste stream and reusing them as raw materials in manufacturingprocesses
recycling bin – a storage receptacle used to collect recyclable materials
uncovered vehicle source – materials that blow out or fall from trucks or trailers if they are not covered or tied down
waste material – something that is no longer wanted or needed
THE TROUBLE WITH LITTERWindows on Waste - THE TROUBLE WITH LIT TER XII Help Contents Back
▼
▼
276©Ohio Department of Natural Resources Help Contents Back
▼
▼
276

Windows on Waste - THE TROUBLE WITH LIT TER XII Help Contents Back
▼
▼
277©Ohio Department of Natural Resources Help Contents Back
▼
▼
277
Summary
This lesson includes three
activities. The activities
may be used separately
and in any order. The back-
ground information should be
presented before conducting any
of the activities.
Overview - THE TROUBLE WITH LITTER
1
2
Activity 1: Fishing for Litter HabitsDescriptionStudents “fish” for litter habits in a fishing game that uses a “pole” made from a ruler,string and magnet. Paper clips attached to the fish are attracted to the magnet at theend of the fishing pole. When students “catch” a litter habit, they read it and inferwhether to place it in the good habit section or the bad habit section. Students graphthe habits at the end of the activity.
Ohio Proficiency Test Learning OutcomesGrade 4, Math #23 – Collect data and create a picture or bar graph representing the data.
Grade 4, Reading #12 – Use graphic aids – a table, graph or illustrations to locate or interpret information.
Grade 4, Reading #14 – Identify and interpret vocabulary words, phrases or expressionscritical to the meaning of the text.
Grade 4, Science #14 – Identify and/or describe the relationship between human activityand the environment.
Activity 2: A Lot of Litter DescriptionA two-act play, read by students in class, teaches the sources of litter. In the play, afamily solves a litter problem in their neighborhood. In Act II of the play, most of thelitter habits are described in litter poems. Students speak clearly and listen carefully asthey communicate their message to the audience.
Ohio Proficiency Test Learning OutcomesGrade 4, Citizenship #15 – Identify or explain the purposes of local government.
Grade 4, Citizenship #17 – Identify and assess the possibilities of group decision making,cooperative activity and personal indemnity in the community.
Grade 4, Citizenship #18 – Identify the elements of rules relating to fair play.
Grade 4, Reading #6 – Infer from the fictional text.
Grade 4, Reading #7 – Compare and/or contrast elements, such as characters, setting orevents.
Grade 4, Reading #8 – Respond to the text.
Grade 4, Science #14 – Identify the relationship between human activity and the environment.

Windows on Waste - THE TROUBLE WITH LIT TER XII Help Contents Back
▼
▼
278©Ohio Department of Natural Resources Help Contents Back
▼
▼
278
3
Background Information
Waste materialcan be foundanywhere peoplelive, work andplay. Waste thatis not properly
contained is called litter. It is impor-tant to learn about litter because peo-ple create the problem. Litter, such aspaper, cans, food scraps, tires andother waste materials improperly dis-posed of, can be unsightly and oftenpresent a health hazard.
Litter can result from a directaction (throwing trash out the carwindow) or an indirect action (failingto secure trash can lids tightly).Deliberate littering is an improperform of waste disposal similar to illegal dumping. In both cases, harmmay be done to the environment inone or more ways, including injury towildlife and threats to human health.
The environmental impact of lit-ter depends on the nature of the littered items and the characteristicsof the land or water where it isdeposited. Food scraps, when left in anatural environment in smallamounts, may not be harmful to theenvironment because they becomepart of nature’s recycling system. Foodwaste on city streets, however, is ahealth hazard.
Human-made materials, such asplastic, glass, steel and aluminum, areboth unsightly to the landscape and apotential hazard to wildlife and peo-ple. These objects may become ahome to disease-spreading insects,such as flies and mosquitoes. Theycan also cause external injury to ani-mals and humans. For example, it iscommon for birds to ingest wastematerials or become trapped, causinginjury or death.
Litter comes from many sources.The following is a list of seven sourcesof litter, as identified by the KeepAmerica Beautiful organization. It isestimated that 80 percent of all litteroriginates from the first five sources.
• Household refuse: Improperly cov-ered household trash cans or trashcontained in plastic bags are apotential source of litter. Animals orpeople can knock over cans andopen bags. Wind can also blow trashfrom open cans.
• Commercial refuse: Stores andbusinesses generate large amounts ofwaste. If garbage cans and dumpstersdo not have tightly-fitted lids orlocks, the waste can be easily scattered.
• Construction/demolition sites:Scrap building materials can beblown or carried away from these
areas to become litter if fences are not put around the site and con-tainers with secure lids are not used.
• Uncovered vehicles: Material canfall or blow from trucks or trailerscreating serious hazards for othermotorists. Loads should be tieddown or covered with a tarp.
• Loading docks: The constant load-ing and unloading of vehicles canproduce all kinds of debris. Storagebins and dumpsters should alwaysbe kept closed.
• Motorists: Drivers and/or passen-gers create litter when they throwwaste from their vehicles. Car litterbags and trash cans convenientlylocated at parks, rest areas, gas sta-tions and fast food stores helpreduce this type of litter.
• Pedestrians: Waste is often droppedor thrown on the ground by peopleon foot. Containers along sidewalksand in recreation areas provide anopportunity to avoid littering.
Littering isn’t just unsightly,unhealthy and wasteful; it’s illegal.Under Ohio law, litter is any trashthrown, discarded or dropped by aperson onto public property, privateproperty not owned by the individual,or into Ohio’s waterways. Littering is aserious offense, punishable by fines up
Activity 3: Don’t Step on LitterDescriptionStudents cooperate in groups as they play a board game. They identify causes of litterand good and bad litter habits as they move from “start” to the “recycling center.”Students make computations to move an appropriate number of spaces during the game.
Ohio Proficiency Test Learning OutcomesGrade 4, Mathematics #8 – Add, subtract, multiply and divide whole numbers and explain,illustrate or select thinking strategies for making computations.
Grade 4, Science #14 – Identify and/or describe the relationship between human activityand the environment.

Windows on Waste - THE TROUBLE WITH LIT TER XII Help Contents Back
▼
▼
279©Ohio Department of Natural Resources Help Contents Back
▼
▼
279
PreparationCopy, cut out and laminate thehandout, Litter Habits Fish 1-4.
Make a “fishing pole” by attachinga 3-ft. long string to a ruler. Attacha magnet to the other end of thestring. Place paper clips on eachcut-out litter habit fish.See illustration at right.
Inquiries● What are some bad litter
habits and why are they bad?
● What are some good litterhabits and why are theygood?
Content DomainLanguage Arts – Reading
Math – Arithmetic
Science – General Science
Learning OutcomesMath, Grade 4, #23
Reading, Grade 4, #12, #14
Science, Grade 4, #14
continued next page
Fishing for Litter HabitsObjectivesStudents will be able to: (a) distinguish between good litter habits and bad ones; (b)create a bar graph to demonstrate results; and (c) read statements aloud pertainingto good and bad litter habits.
Act
ivity
1 THE TROUBLE WITH LITTER
to $500 and 60 days in jail.Law enforcement officers can
issue tickets for casual littering frommotor vehicles as they do for trafficviolations, such as speeding. In addi-tion, the driver of a motor vehicle orwatercraft can be held responsible forlitter discarded onto the roadway orwaterway by passengers.
It is also illegal in Ohio to drive ormove a vehicle on any highway with aload that is not secured. All loads thatcan spill or drop litter on the roadwayrequire a covering. Exceptions to thislaw include farm vehicles used totransport agricultural products andgarbage collection vehicles in theprocess of acquiring their loads.
Illegal dumping is a serious aspectof littering. Not only is dumping waste
on private or public land and water-ways prohibited, but it is illegal to usesomeone else’s dumpster. Citizensshould use licensed disposal facilitiesand insist that trash haulers use legaldisposal methods.
Learning about litter can have apositive impact. Children can do theirpart, by not littering and by pickingup litter when it is safe to handle.Most importantly, they can discourageothers from littering.
Bibliography and AdditionalResourcesStudent Resources
50 Simple Things Kids Can Do to Savethe Earth, by The Earthworks Group,Kansas City, MO: University Press, 1990.
The Environment, by GeraldLeinward, New York: Library ofCongress, 1990.
What We Can Do About Litter, byDonna Bailey, New York: FranklinWatts, 1991.
Educator Resources
Facts Not Fear by Michael San Era andJane S. Shaw, Washington, DC:Regnery Pub. Inc.,1996.
The Environmental Crisis, by DavidBender and Bruno Leone, St. Paul:Greenhaven Press, 1986.
The Environment, by Gerald Leinward,New York: Facts on File Pub., 1990.

Windows on Waste - THE TROUBLE WITH LIT TER XII Help Contents Back
▼
▼
280©Ohio Department of Natural Resources Help Contents Back
▼
▼
280
ProcedureExplain to students that they are
going fishing today, but instead offishing for real fish, they are going tofish for litter habits. Tell students thateach fish represents a habit, and beforethe “fishing” starts, ask them to give anexample of a bad litter habit, followedby an example of a good one.
Tape large, clear ziplock bags tothe chalkboard (one labeled “goodhabits” and one labeled “bad habits”).Students take turns “fishing” for litterhabits. When one is “caught,” the stu-dent reads it to the class and decideswhether it belongs in the good habitsor bad habits bag. Student explainswhy the habit is good or bad.
The student goes to the graphand colors in green for good habit orred for bad habit.
ANSWERS: 1. bad, 2. good, 3. good,4. bad, 5. bad, 6. bad, 7. good, 8. bad,9. bad, 10. good, 11. bad, 12. good,13. bad, 14. good, 15. bad, 16. good,17. bad, 18. good, 19. good, 20. good
AssessmentMethod A: Have students make aposter urging others not to litter.
Method B: Give each student twoblank fish and have him/her createone good litter habit and one bad litter habit.
Extensions This lesson can be used in con-
junction with a magnetism unit.
Students can also make up theirown litter fish and take the game toother classrooms.
2
1
3
2
1
Duration50 minutes (not includingpreparation of “litter fish”)
MaterialsCut-out litter habits (laminat-ed, if possible), paper clips;small stick or ruler; string;magnet; two large, clear plas-tic ziplock bags (labeled “goodhabits” and “bad habits”)
Handouts● Litter Habits Fish 1-4
THE TROUBLE WITH LITTERGood Habit
Bad Habit
1 2 3 4 5 6 7 8 9 10 11 12 13 14 15 16
1 2 3 4 5 6 7 8 9 10 11 12 13 14 15 16
Draw a simple graph on the board, chart or overhead. See example below.

Windows on Waste - THE TROUBLE WITH LIT TER XII Help Contents Back
▼
▼
281©Ohio Department of Natural Resources Help Contents Back
▼
▼
281
Litter Habits Fish 1
FISH #1During the movie, Marie
drops her popcorn box onthe floor of the theater.
FISH #2Vicky picks up paper while
walking in the school hallway,even though the paper
isn’t hers.
FISH #3Construction workers putup a wire fence to prevent
materials from blowingaway.
FISH #4Valerie tries to throw a
wad of paper into the parkwastebasket but misses and
walks away.
FISH #5Boxes are piled up outsideof a grocery store and theybegin to disintegrate when
it rains.
FISH #6An open truck bed is used tomove three college students.
Clothing blows out as it travels down the street.

Windows on Waste - THE TROUBLE WITH LIT TER XII Help Contents Back
▼
▼
282©Ohio Department of Natural Resources Help Contents Back
▼
▼
282
Litter Habits Fish 2
FISH #7Jeff crushes all aluminumcans in his household and
takes them to the recyclingcenter once a month.
FISH #8After eating at a drive-thru
restaurant, Jerry throwshis cup and napkin out the
car window.
FISH #9Mary and Ted go on apicnic and leave theiraluminum cans in the
woods.
FISH #10Scouts go on a hike in
a park. They pick uplitter as they walk.
FISH #11A large dumpster isleft open and trash
blows out.
FISH #12Terry and his fatherpick up litter along a
highway.
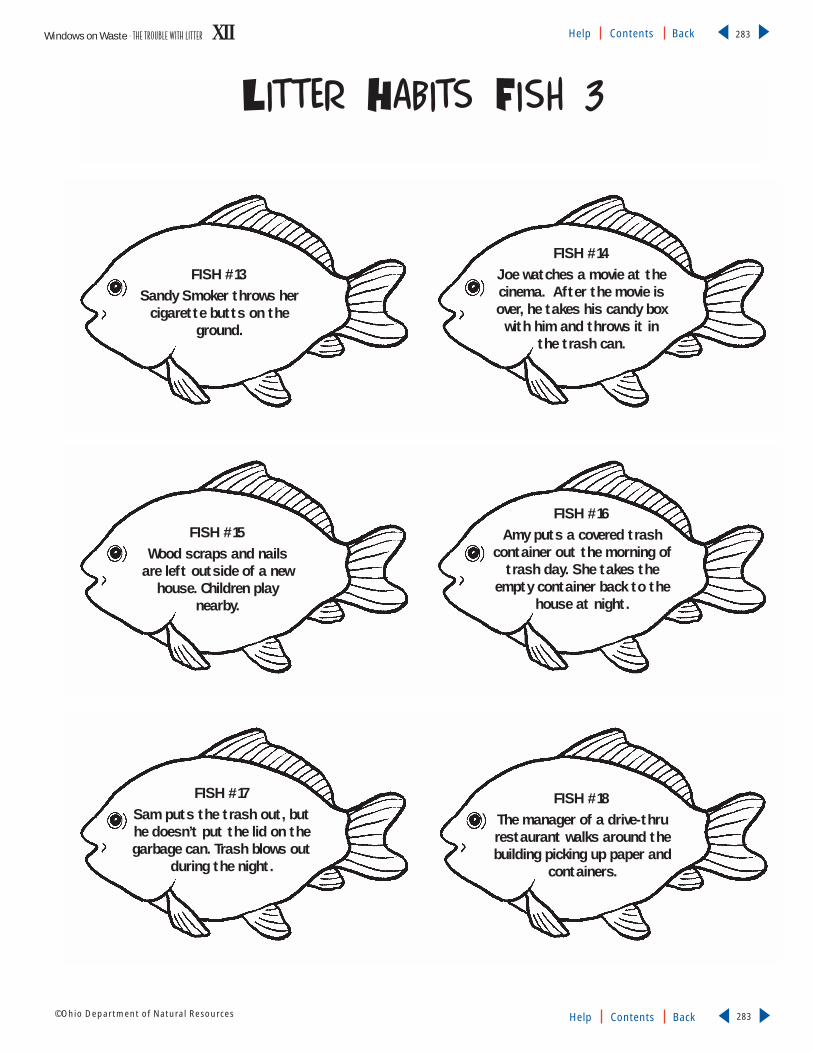
Windows on Waste - THE TROUBLE WITH LIT TER XII Help Contents Back
▼
▼
283©Ohio Department of Natural Resources Help Contents Back
▼
▼
283
Litter Habits Fish 3
FISH #13Sandy Smoker throws her
cigarette butts on theground.
FISH #14Joe watches a movie at thecinema. After the movie isover, he takes his candy box
with him and throws it inthe trash can.
FISH #15Wood scraps and nails
are left outside of a newhouse. Children play
nearby.
FISH #16Amy puts a covered trash
container out the morning oftrash day. She takes the
empty container back to thehouse at night.
FISH #17Sam puts the trash out, buthe doesn’t put the lid on thegarbage can. Trash blows out
during the night.
FISH #18The manager of a drive-thrurestaurant walks around thebuilding picking up paper and
containers.
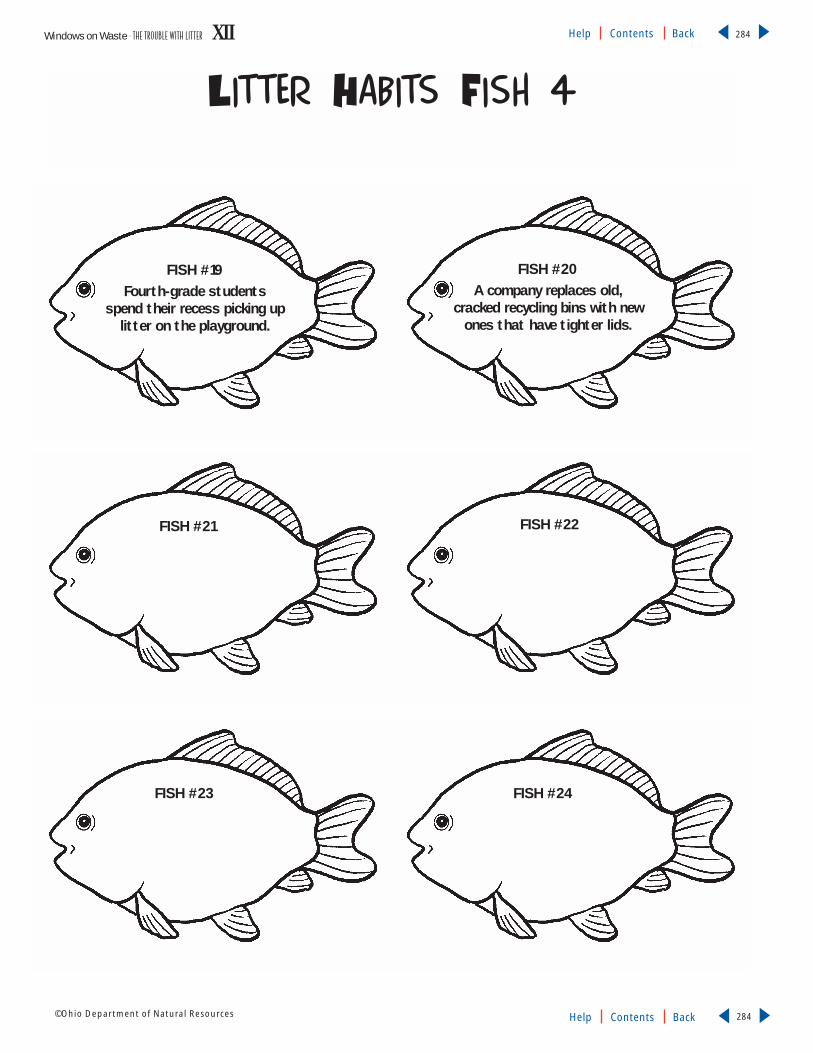
Windows on Waste - THE TROUBLE WITH LIT TER XII Help Contents Back
▼
▼
284©Ohio Department of Natural Resources Help Contents Back
▼
▼
284
Litter Habits Fish 4
FISH #19Fourth-grade students
spend their recess picking uplitter on the playground.
FISH #21 FISH #22
FISH #24FISH #23
FISH #20A company replaces old,
cracked recycling bins with newones that have tighter lids.

Windows on Waste - THE TROUBLE WITH LIT TER XII Help Contents Back
▼
▼
285©Ohio Department of Natural Resources Help Contents Back
▼
▼
285
PreparationCopy the play (one per student). Propsare needed if the play is performed foran audience. Each “source of litter” char-acter will need to hold a sign that has thepoem they'll be reciting on the back. Forexample, on the front of the sign, printtheir character with a bold marker, sowhen the student reads the poem, thename of the character (COMMERCIALSOURCE) faces the audience.
ProcedureUsing the Background Informa-
tion, discuss the causes of litter with theclass.
Distribute copies of the play andassign parts.
Read through the play. Before read-ing Act II, which takes place at a citycouncil meeting, pause for a short dis-cussion. Talk about local governmentand the democratic process. Explain tostudents that the family in the play usesthe city council to help them solve aproblem and improve the community.
Finish reading the play. Discuss thesources of litter emphasized in the play.
Discuss the play and make anyneeded changes that would improve it.
If students will be performing theplay for other classrooms or other audi-ences, discuss props, costumes andencourage creativity in performing theplay. If needed, find and/or make thecostumes and props.
After several practices, perform theplay.
AssessmentAssessment is embedded in the perfor-mance of the play by evaluating thespeaking, listening and delivery of a presentation to peers.
ExtensionsThe play can be performed in one
short period by reading the litter poemsin Act II only.
1
7
6
5
4
3
2
1
Inquiries● What are the sources of litter?
● What can children do to solvea litter problem in theirneighborhood?
Content DomainCitizenship – Government
Language Arts – Reading, oralcommunication
Science – General science
Learning OutcomesCitizenship, Grade 4, #15, #17,#18
Reading, Grade 4, #6, #7, #8
Science, Grade 4, #14
Duration60 minutes
MaterialsCopies of the play (one perstudent); props for the play(litter items, baseball mitts,baseball, etc.); 10 pieces ofcardboard or chart paper (12x 18 in.); markers; two longtables (or use several desks);chairs (one per student)
After reading the litter poemsin Act II, have students write theirown poems to describe the sevenlitter sources.
Students can write to gov-ernment officials and share theirown ideas of reducing littering.
3
2
A Lot of LitterObjectivesStudents will be able to: (a) identify sources of litter as they read through a play; (b)take a leadership role and address public issues as they deliver a presentation to theirpeers; and (c) identify and assess the possibilities of group decision making, coopera-tive activity and the elements of the rules of fair play.
Act
ivity
2THE TROUBLE WITH LITTER

Windows on Waste - THE TROUBLE WITH LIT TER XII Help Contents Back
▼
▼
286©Ohio Department of Natural Resources Help Contents Back
▼
▼
286
Student Handout ✐
A Lot of Litter
Cast of Characters:
ACT I
TIME: Early spring, the present
SETTING: An empty lot, filled with litter and trash items (such as cans,
plastic bottles, newspaper, broken toys, old furniture, tires, boxes, etc.).
STAGE DIRECTIONS: Greg and his younger sister Kelly enter from stage left,
followed by their parents (Mom, Dad). They've been playing baseball at the
ball field, which is next to the littered lot.
Greg
Kelly
Mom
Dad
Kitten
Council President
Council Member 1
Council Member 2
Council Member 3
Council Member 4
Household Refuse Source
Uncovered Vehicle Source
Pedestrian Source
Loading Dock Source
Motorist Source
Commercial Source
Construction Source
Extras
Group Choral ChantMembers (consists of theremainder of the class or groupalong with the “Sources ofLitter” speaking together)

Windows on Waste - THE TROUBLE WITH LIT TER XII Help Contents Back
▼
▼
287©Ohio Department of Natural Resources Help Contents Back
▼
▼
287
GREG:
I think the ball went this way (crosses stage and rummagesthrough junk to locate baseball).
KELLY:
Wow, look at this place. It’s a junkyard.
MOM:
(enters stage left) Greg, did you find...(stops) This placesure has changed.
DAD:
(yelling from off stage) Hey, where did all you guys go?(enters behind Mom) Oh, here you are.
MOM:
(turns to Dad) Adam, look at how run-down this lot is.Remember when we were kids, it was the perfect place toplay kickball?
KELLY:
You and Dad played here? No one plays here anymore.
GREG:
Yeah, we don’t go any farther than the ball field...toomuch junk.
MOM:
You’re right, you shouldn’t play here, but 10 to 15 yearsago, it was as nice as the ball field over there. I guess timeshave changed.
DAD:
It’s a shame when you think about how much more roomkids would have to play ball, if they cleaned up this place.
KELLY:
(walking around the lot) Who let people throw all thisjunk here? Shouldn't there be a law or something?
GREG:
Who cares? Let’s find the baseball and get back to ourgame.
MOM:
That's the problem Greg. No one cared enough to keepthe place clean. All it takes is one person to start litteringand a few years later, you've got an illegal dumpsite.
DAD:
Mom’s right. People tend to litter where they already seelitter. It doesn't take long before a nice grassy lot turnsinto (points around) this.
KELLY:
Yeah, kind of like Greg’s bedroom (everyone laughs, butKelly stops to listen to meowing from stage right)
KITTEN:
Meow (Kitten is curled up in box, not seen by audience).Meow, meow.
KELLY:
Hey, did anyone hear that? I think it’s a cat.
DAD:
Kelly, I hear it. (Dad walks toward the kitten, clearing trashand debris out of his way.) I think it’s coming from overhere in this old box. (Kitten crawls out of box with wire orelectrical cord wrapped around entire body, limps towardDad and Kelly).
KITTEN:
Meow, meow.
KELLY:
(She rushes past Dad to Kitten.) It’s stuck in the wire(cord) and looks hurt. Dad, help me untangle the wire.(Greg also goes over to help, and moves garbage out of theirway.)
MOM:
(She helps too) You kids should learn from this. Litter isn'tjust ugly, it’s dangerous. (She puts the tangled wire back inthe box where Kitten was.)

Windows on Waste - THE TROUBLE WITH LIT TER XII Help Contents Back
▼
▼
288©Ohio Department of Natural Resources Help Contents Back
▼
▼
288
GREG:
(petting Kitten who settles down to nap on the ground) The wire’s all off and the cat looks okay. And, here’s mybaseball.
KELLY:
Can’t we do something so that more animals and peoplewon’t get hurt?
GREG:
I can’t believe I’m saying this, but can’t we clean up thelot?
DAD:
(laughing) I want to see that...no, seriously kids, I thinkcleaning up this lot would be a great community projectand I know just the right place to begin.
GREG:
Me too, with lots of trash bags.
DAD:
Not so fast Greg. I think this land is part of the ball fieldand it belongs to the city. We should go talk to the citycouncil.
KELLY:
Who do we have to call?
MOM:
It’ll take more than a phone call Kelly. We can organize acleanup, but because it’s public land, we need to take ourplan and present it at the next city council meeting.
DAD:
Are you willing to talk about what we saw today in frontof the city council members?
GREG:
I am. Maybe they’ll even turn this lot into a playgroundor something?
DAD:
Now you’ve got the idea, son. Let’s go home and startcalling some of our neighbors. (Mom and Dad start to exitstage left).
KELLY:
But what about the kitten, can we keep her Mom?
MOM:
We’ll have Dr. Evans take a look at her, and then we’ll talkabout it.
KELLY:
Okay, Mom. (turns to coax Kitten off stage) Here, Kitty,Kitty. You’re going home with us.
KITTEN:
Meow! (smiles and purrs) Meow! (Licks paw and followsKelly and the rest of the family as they exit the stage.)
CURTAIN
ACT II
TIME: Two weeks later.
SETTING: City Council meeting. Members of the councilare sitting on the right side of the stage at a long table.(Four desks can substitute for the table.) A podium (thiscan be made from three stacked boxes) is center stage.
Sources of Litter stand in a row on the left – each holdinga sign (i.e., Pedestrian Source of Litter, printed in boldmarker on the front of sign and Pedestrian Source poemtaped to the back – for easier reading during the performance).
STAGE DIRECTIONS: Kelly and Greg sit on chairs infront of the Sources of Litter. Mom and Dad are seated inthe real audience and come up to the podium whencalled.

Windows on Waste - THE TROUBLE WITH LIT TER XII Help Contents Back
▼
▼
289©Ohio Department of Natural Resources Help Contents Back
▼
▼
289
COUNCIL PRESIDENT:
Ladies and Gentlemen, we are ready for comments and/orsuggestions from the citizens in the audience.
DAD:
(Comes up on stage with Mom. Both parents stand at thepodium.) Ladies and gentlemen of the council, thank youfor letting us come here today to present our idea. Ourchildren have been looking into some ways of cleaning upthe vacant lot behind the city ball field.
MOM:
It has turned into an illegal dumpsite and they’d like tochange that. Greg and Kelly, will you come forward?
GREG:
My sister Kelly and I researched the problem of litter andthought a skit could explain it best. Our friends are goingto help us tell you how litter happens. We’re also going todo the skit at school for our Earth Day project.
KELLY:
Greg and I asked each person to be one source or cause oflitter. By learning the causes of a problem, we can preventthe problem from happening again. We’ll start with asource or cause of litter that we all know well- the garbagecan (formally known as the Household Refuse Source).
HOUSEHOLD REFUSE SOURCE:
Hi! I’m household refuse, better known as the garbagecan. This rhyme will help all of us understand the prob-lem with me.
Oh, Michael put the trash out.
The trash was in two bags.
Mom thanked him and he went to bed.
They hadn’t thought of Rags.
Rags was loose that very night.
He came by and smelled food.
He chewed one side and left a mess
Not meaning to be rude.
But then the wind began to blow
And trash began to scatter.
No one meant to cause the mess.
How can we change this matter?
Dad bought covered trash cans
And a nice recycling bin.
The next week when the trash went out
Everything stayed in.
While Haleigh waited for her bus
She saw a shiny can.
It had rolled there from Michael’s yard.
Now Haleigh had a plan.
This good girl took it right to school.
The moment she went in,
She placed it in its proper place
The school recycling bin.
GROUP CHORAL CHANT
(Everyone on stage, except the council, chants)
Change a bad habit.
How can you make it good?
Don’t let it drop- recycle it
And put it where you should.
UNCOVERED VEHICLE SOURCE:
Hi! I’m Uncovered Vehicle Source and this is my story inrhyme:
The truck went down the highway
Heading toward the rummage sale.
The whole rear cab was loaded
Way up above the rail.
The driver didn’t notice
That from the rummage pile
Paper and clothes flew about
Down every single mile.
And these things became litter.
As they landed-there they stayed.
If the driver had just stopped to think
About the mess he’d made.

Windows on Waste - THE TROUBLE WITH LIT TER XII Help Contents Back
▼
▼
290©Ohio Department of Natural Resources Help Contents Back
▼
▼
290
GROUP CHORAL CHANT:
Change a bad habit
How can you make it good?
Don’t let it drop-recycle it
And put it where you should.
PEDESTRIAN SOURCE:
Hello! I’m the Pedestrian Source of Litter, better known aspeople who litter and here is my rhyme:
The teens played ball after school,
They didn’t have a care.
They threw candy wrappers and
Pop cans went everywhere.
A little kitten stopped to play
With pop cans in the field.
Its paw got stuck and badly cut
Don’t litter-we repeat.
GROUP CHORAL CHANT:
Change a bad habit
How can you make it good?
Don’t let it drop-recycle it
And put it where you should.
LOADING DOCK SOURCE:
Hello! I’m the Loading Dock Source and this is my story:
The loading dock was open
As the truck pulled to the gate.
The cartons were unloaded
But the workers couldn’t wait.
They untied all the straps and ropes
And pulled new tables out.
But when the trucker drove away
Debris was strewn about!
GROUP CHORAL CHANT:
Change a bad habit
How can you make it good?
Don’t let it drop-recycle it
And put it where you should.
MOTORIST SOURCE:
Hi! I’m the Motorist Source and this is my story inrhyme:
Sue and Bob drive down the street
They’re hungry so they stop.
They buy two double burgers
And each one drinks a pop.
They should recycle all the trash
But this is what they do;
They throw the garbage on the street
And now it spoils the view.
It changes all it touches
The road is not so nice.
Next time we hope that Sue and Bob
Will please take our advice.
GROUP CHORAL CHANT:
Change a bad habit.
How can you make it good?
Don’t let it drop-recycle it
And put it where you should.
COMMERCIAL SOURCE:
Hi! I’m Commercial Source and this is my story in rhyme:
The sidewalk sale was held in June
And many shoppers came.
But when the sale was over
The place was not the same.

Windows on Waste - THE TROUBLE WITH LIT TER XII Help Contents Back
▼
▼
291©Ohio Department of Natural Resources Help Contents Back
▼
▼
291
They put the leaflets on the cars
They passed them out all day.
But by the time the sun went down,
The leaflets blew away.
The merchants took the clothing in
But much was left behind.
Leaflets, bags and wrappers
Were left for you to find.
GROUP CHORAL CHANT:
Change a bad habit.
How can you make it good?
Don’t let it drop-recycle it
And put it where you should.
CONSTRUCTION SOURCE:
Hi! I’m Construction Source and here’s my rhyme.
The building crew worked all week long,
The house grew straight and tall.
The workers put the shingles on
But let the wrappers fall.
Cartons, twine and boxes
Were left out in the yard.
And some of it was scattered,
The crew was caught off guard.
GROUP CHORAL CHANT:
Change a bad habit
How can you make it good?
Don’t let it fall-recycle it
And put it where you should.
COUNCIL PRESIDENT:
I’m impressed! You children have gone to a lot of troubleto show us how litter happens and how we can correct theproblem. Now, what about that illegal dumpsite?
COUNCIL MEMBER 1:
How can we help you. Do you have any ideas?
KELLY:
After we clean up the lot, we’re asking the city to let us useit as a public playground.
COUNCIL PRESIDENT:
Is there any discussion?
COUNCIL MEMBER 3:
Will the children participating in the cleanup be properlysupervised so no one gets hurt?
DAD:
My wife and I will take responsibility for supervising theclean-up, plus we’ll contact the local litter prevention andrecycling office for their help in organizing the clean-up.
COUNCIL PRESIDENT:
Do I hear a motion to turn the vacant lot into a play-ground if the neighborhood cleans it up?
COUNCIL MEMBER 2:
I move that we let the neighborhood children use theplayground if they organize a cleanup and the place staysa safe and clean play area.
COUNCIL MEMBER 4:
I second that motion and ask that we vote on the motion.
COUNCIL PRESIDENT:
All in favor signify by saying “aye.”
ALL COUNCIL MEMBERS:
Aye.
COUNCIL PRESIDENT:
It’s unanimous! The motion carries.
ALL:
Cheer and shake hands.

Windows on Waste - THE TROUBLE WITH LIT TER XII Help Contents Back
▼
▼
292©Ohio Department of Natural Resources Help Contents Back
▼
▼
292
COUNCIL MEMBER 1:
Council President, at next month’s meeting, I’d like tolook at fencing in the playground and maybe, find a wayto add some playground equipment.
GREG:
Thank you so much.
KELLY:
We hear about it in class all the time, but this really isdemocracy in action.
COUNCIL MEMBER 4:
Thank you all for working together to make our town abetter and cleaner place.
COUNCIL PRESIDENT:
And the next time one of us starts to litter, I’m sure we’llthink of your skit and “don’t let it drop.”
ALL:
(Everyone on stage smiles and chants)
So change a bad habit
How can you make it good?
Don’t let it drop- recycle it.
And put it where you should.
CURTAIN
Credits: A Lot of Litter was written by Beverly Klimp.
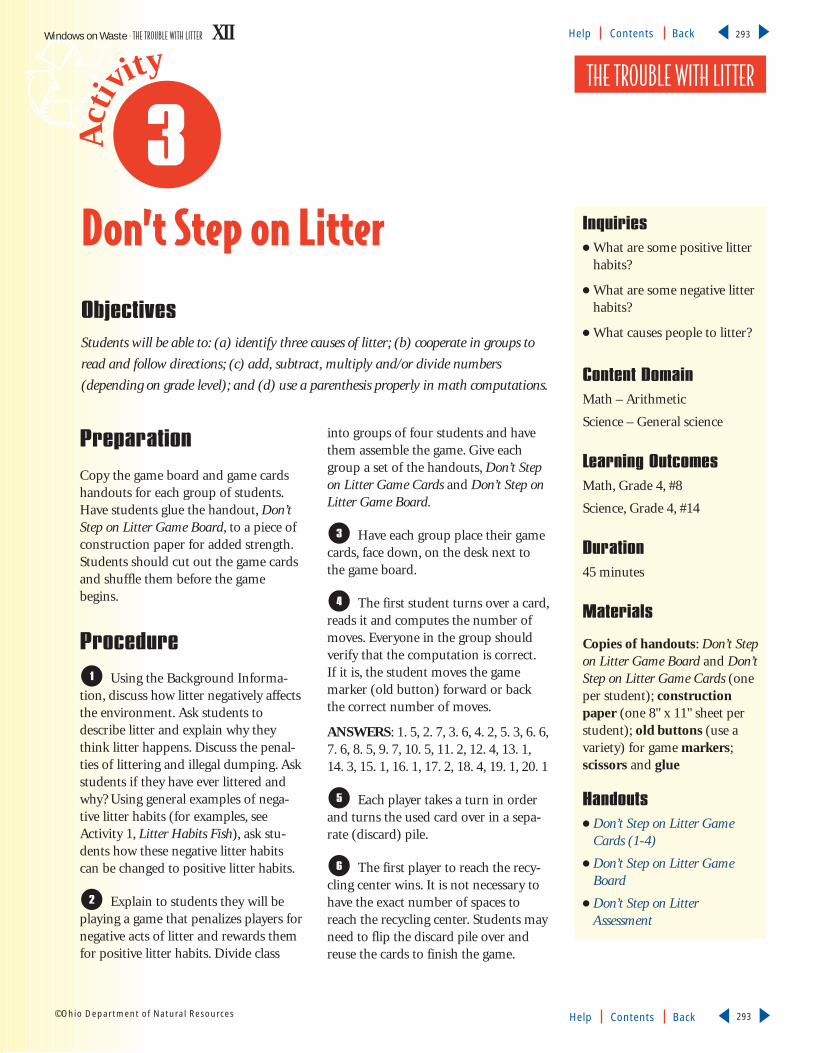
Windows on Waste - THE TROUBLE WITH LIT TER XII Help Contents Back
▼
▼
293©Ohio Department of Natural Resources Help Contents Back
▼
▼
293
PreparationCopy the game board and game cardshandouts for each group of students.Have students glue the handout, Don’tStep on Litter Game Board, to a piece ofconstruction paper for added strength.Students should cut out the game cardsand shuffle them before the gamebegins.
Procedure Using the Background Informa-
tion, discuss how litter negatively affectsthe environment. Ask students todescribe litter and explain why theythink litter happens. Discuss the penal-ties of littering and illegal dumping. Askstudents if they have ever littered andwhy? Using general examples of nega-tive litter habits (for examples, seeActivity 1, Litter Habits Fish), ask stu-dents how these negative litter habitscan be changed to positive litter habits.
Explain to students they will beplaying a game that penalizes players fornegative acts of litter and rewards themfor positive litter habits. Divide class
into groups of four students and havethem assemble the game. Give eachgroup a set of the handouts, Don’t Stepon Litter Game Cards and Don’t Step onLitter Game Board.
Have each group place their gamecards, face down, on the desk next tothe game board.
The first student turns over a card,reads it and computes the number ofmoves. Everyone in the group shouldverify that the computation is correct.If it is, the student moves the gamemarker (old button) forward or backthe correct number of moves.
ANSWERS: 1. 5, 2. 7, 3. 6, 4. 2, 5. 3, 6. 6,7. 6, 8. 5, 9. 7, 10. 5, 11. 2, 12. 4, 13. 1,14. 3, 15. 1, 16. 1, 17. 2, 18. 4, 19. 1, 20. 1
Each player takes a turn in orderand turns the used card over in a sepa-rate (discard) pile.
The first player to reach the recy-cling center wins. It is not necessary tohave the exact number of spaces toreach the recycling center. Students mayneed to flip the discard pile over andreuse the cards to finish the game.
6
5
4
3
2
1
Inquiries● What are some positive litter
habits?
● What are some negative litterhabits?
● What causes people to litter?
Content DomainMath – Arithmetic
Science – General science
Learning OutcomesMath, Grade 4, #8
Science, Grade 4, #14
Duration45 minutes
Materials
Copies of handouts: Don’t Stepon Litter Game Board and Don’tStep on Litter Game Cards (oneper student); constructionpaper (one 8" x 11" sheet perstudent); old buttons (use avariety) for game markers;scissors and glue
Handouts ● Don’t Step on Litter Game
Cards (1-4)
● Don’t Step on Litter GameBoard
● Don’t Step on LitterAssessment
Don’t Step on LitterObjectivesStudents will be able to: (a) identify three causes of litter; (b) cooperate in groups to
read and follow directions; (c) add, subtract, multiply and/or divide numbers
(depending on grade level); and (d) use a parenthesis properly in math computations.
Act
ivity
3THE TROUBLE WITH LITTER

Windows on Waste - THE TROUBLE WITH LIT TER XII Help Contents Back
▼
▼
294©Ohio Department of Natural Resources Help Contents Back
▼
▼
294
Optional: Using the blank game cards,have students create their own cardsand trade their new cards with othergroups. Use the new cards in a secondround.
AssessmentHave students complete the handout,Don’t Step on Litter Assessment.
ANSWERS: 1. d, 2. b, 3. a, 4. b, 5. c, 6. b
Extensions A whole class game can be played
by using the game board on an over-head projector. Before the game begins,make a transparency of the game board.Use shapes to represent team pieces (i.e.triangle team, circle team). Divide theclass into two groups and line up eachgroup on opposite sides of the room.The first student in each line comes for-ward and turns over a game card. Thestudent then moves the game markeron the overhead and goes to the end ofthe line.
Have each student make a set(game board and cards) to take home.
2
1

Windows on Waste - THE TROUBLE WITH LIT TER XII Help Contents Back
▼
▼
295©Ohio Department of Natural Resources Help Contents Back
▼
▼
295
Student Handout ✐
Don’t Step on Litter Game Cards-1
You recycled your plastic milk jugs.Move ahead (3+4) - 2 spaces.
You recycled your old aluminumcans. Move ahead (3-1) + 5 spaces.
You recycled empty glass jars. Move ahead (3+5) - 2 spaces.
You recycled a cardboard box. Moveahead (6+6) - 10 spaces.
You stacked and recycled your family’s old newspapers.
Move ahead (10-5) - 2 spaces.
You rinsed and recycled a dozen steelcans. Move ahead (6+8) - 8 spaces.
1 2
3 4
5 6

Windows on Waste - THE TROUBLE WITH LIT TER XII Help Contents Back
▼
▼
296©Ohio Department of Natural Resources Help Contents Back
▼
▼
296
Student Handout ✐
Don’t Step on Litter Game Cards-2
You reused the back of old notebookpaper. Move ahead (9-4) + 1 spaces.
You packed your lunch in reusable containers. Move ahead (9-7) +3 spaces.
You sold your old toys at a garagesale instead of throwing them away.
Move ahead (2+2) + 3 spaces.
Your family bought paper towels made from recycled paper.
Move ahead (6+3) -4 spaces.
You picked up the litter along yourstreet. Move ahead (14-7) - 5 spaces.
You dropped your candy box on themovie theater floor.
Move back (7-5) + 2 spaces.
7 8
9 10
11 12

Windows on Waste - THE TROUBLE WITH LIT TER XII Help Contents Back
▼
▼
297©Ohio Department of Natural Resources Help Contents Back
▼
▼
297
Student Handout ✐
Don’t Step on Litter Game Cards-3
You pitched your hamburger wrap-per out the car window.
Move back (9-6) - 2 spaces.
Sandy Smoker throws cigarettebutts on the ground.
Move back (8-6) + 1 spaces.
At the picnic in the park, you leftyour paper plates and cups on the
ground. Move back (9-5) - 3 spaces.
When you moved, your family forgotto cover the back of the truck and
your clothes fell on the road. Move back (6-4) - 1 spaces.
You set out open, plastic garbagebags for trash pickup.
Move back (8-4) - 2 spaces.
You gave away old magazines andbooks to your local library.
Move ahead (9-4) - 1 spaces.
13 14
15 16
17 18

Windows on Waste - THE TROUBLE WITH LIT TER XII Help Contents Back
▼
▼
298©Ohio Department of Natural Resources Help Contents Back
▼
▼
298
Student Handout ✐
Don’t Step on Litter Game Cards-4
After fishing, you leave the extra fishing line along the bank of the river.
Move back (9-3) - 5 spaces.
After Randy Roofer put a new roof on your house, he left packaging
and nails in your yard. Move back (6-3) - 2 spaces.
19 20
21 22
23 24

Windows on Waste - THE TROUBLE WITH LIT TER XII Help Contents Back
▼
▼
299©Ohio Department of Natural Resources Help Contents Back
▼
▼
299
Recycling Center
START
Student Handout ✐ Don’t Step on LitterGame Board
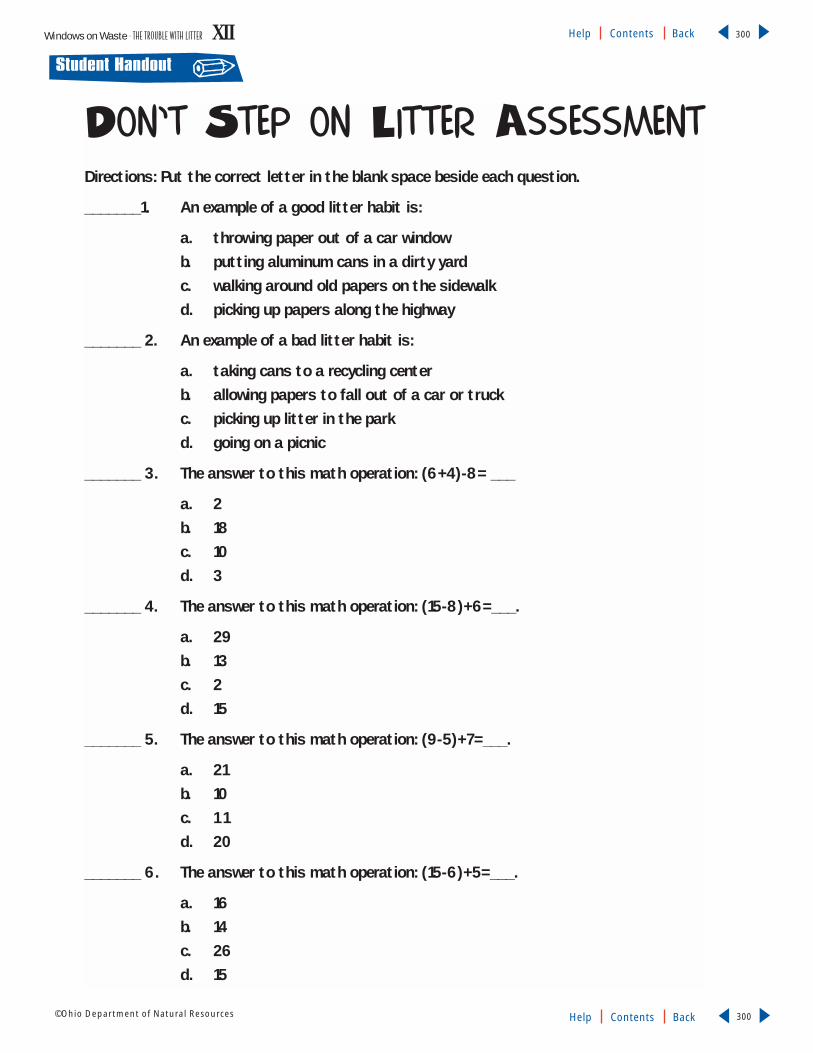
Windows on Waste - THE TROUBLE WITH LIT TER XII Help Contents Back
▼
▼
300©Ohio Department of Natural Resources Help Contents Back
▼
▼
300
Student Handout ✐
Don’t Step on Litter AssessmentDirections: Put the correct letter in the blank space beside each question.
_______1. An example of a good litter habit is:
a. throwing paper out of a car windowb. putting aluminum cans in a dirty yardc. walking around old papers on the sidewalkd. picking up papers along the highway
_______ 2. An example of a bad litter habit is:
a. taking cans to a recycling centerb. allowing papers to fall out of a car or truckc. picking up litter in the parkd. going on a picnic
_______ 3. The answer to this math operation: (6+4)-8= ___
a. 2b. 18c. 10d. 3
_______ 4. The answer to this math operation: (15-8)+6=___.
a. 29b. 13c. 2d. 15
_______ 5. The answer to this math operation: (9-5)+7=___.
a. 21b. 10c. 1 1d. 20
_______ 6. The answer to this math operation: (15-6)+5=___.
a. 16b. 14c. 26d. 15

Windows on Waste - THE TROUBLE WITH LIT TER XII Help Contents Back
▼
▼
301©Ohio Department of Natural Resources Help Contents Back
▼
▼
301

Environmental StudiesLearning Concept
Human settlements have
developed over time from
simple cultures of hunters
and gatherers and pioneers to more
complex cultures defined by industri-
al technology and the growth of
cities. Technology and the socio-cul-
tural values that determine people’s
wants and needs play a major role in
determining a society’s relationship
with the environment. Historically,
social and technological development,
or “progress,” has led to greater mate-
rial abundance and increased the
potential for environmental degrada-
tion and the exploitation of natural
resources. However, historical devel-
opment alone is not a necessary cause
of environmental problems.
Throughout the history of human
settlements, some societies that expe-
rienced increasing wealth and popu-
lation growth eventually exploited
resources and degraded the land in
ways that diminished the society’s
ability to sustain development.
Waste disposal, much like sanita-
tion, is an urban environmental con-
cern that has a long history dating
from the development of the first
cities. Recycling, which is part of this
history, is a resourceful economic
activity and a method of solid waste
management, resource conservation
and pollution prevention.
Vocabularycommercial waste – waste discarded from businesses and institutions, such asschools, hospitals and governments, including non-process industrial waste
consumption – the act of buying and using a resource or product
developing society – a society where farming is the main way of life and industry isonly growing slowly
disposal – the process by which waste is prepared for its final containment ordestruction
dump – a site where mixed wastes are deposited without controls or regard for theprotection of the environment
environment – the sum total of conditions, physical and biological, in which organisms live
garbage – organic refuse consisting of food waste
hazardous waste – waste that may pose a threat to human health or the environment
incineration – solid waste disposal method whereby refuse is burned
industrial pollution – waste and emissions from factories, including hazardousmaterials, particulate matter and waste water that generates land, air and water pollution
industrial society – a society where large-scale industrial technology is applied tomanufacturing and agriculture to represent the main source of jobs and wealth creation
land disposal – the most widely used method of solid waste disposal wherebygarbage and trash are dumped in the open, or buried and covered with soil in alandfill
municipal solid waste – solid waste generated at residences, commercial establishments and institutions
natural resources – living and non-living matter that provide energy and materialsto sustain life on Earth
pollution – any substance added to the environment that interferes with and/orharms natural processes
primitive society – the earliest societies where technology takes the form of simpletools made from materials found in the natural environment
recycling – using or processing materials (or energy) more than once
residential waste – trash and garbage discarded from homes
reuse – using a product in the same form more than once
solid waste – discarded solid materials from community activities, industrial andcommercial operations
trash – dry waste materials considered worthless
TRASH MAKES HISTORYWindows on Waste - TRASH MAKES HISTORY XIII Help Contents Back
▼
▼
302©Ohio Department of Natural Resources Help Contents Back
▼
▼
302

Windows on Waste - TRASH MAKES HISTORY XIII Help Contents Back
▼
▼
303©Ohio Department of Natural Resources Help Contents Back
▼
▼
303
1
2
Activity 1: Everybody is an ExpertDescriptionStudents cooperate in groups and conduct research to identify and describe socio-cul-tural phenomena in four cultures in American history: Native American culture, pio-neer culture, industrial culture and modern (contemporary) culture. Students recordresearch information to answer questions (on a handout) about social life, naturalresource use and waste management. This information can also be used by studentsto construct a timeline. They manipulate materials and write passages to make dis-plays about the cultures and their relationships with the environment.
Ohio Proficiency Test Learning OutcomesGrade 4, Citizenship #1 – Demonstrate knowledge of an ability to think about the rela-tionship among events by: (a) identifying sequence of events in history; (b) groupingevents by broad historical eras on a timeline; and (c) recognizing that changes occur inhistory, identifying cause and effect relationships.
Grade 4, Citizenship #2 – Identify and use sources of information about a given topic inthe history of Ohio and the United States.
Grade 4, Reading #19a – Choose materials related to purpose, as evidenced in part by thecapacity to choose or identify reference resources to locate specific information.
Grade 4, Science #14 – Identify and/or describe the relationship between human activityand the environment.
Grade 6, Citizenship #1 – Demonstrate knowledge of and ability to think about relation-ships among events.
Grade 6, Citizenship #2 – Utilize a variety of resources to consider information from dif-ferent perspectives about North America.
Grade 6, Reading #16 – Select information from a variety of resources to support ideas,concepts and interpretations.
Grade 6, Science #4 – Identify the positive and/or negative impacts of technology onhuman activity.
Activity 2: Secrets in a Garbage CanDescriptionStudents develop group discussion skills to make inferences about “secrets” revealed byitems from a family’s trash. In groups, they examine different waste items and com-plete a chart to analyze what each item says about social wants and needs, the tech-nology of society and the relationship of society to the environment (includingresource use, waste management and environmental degradation). The same processcan be applied to four historical societies by using waste items specific to each of thesocieties.
Summary
This lesson includes three
activities. Although
they may be conducted
separately, the activities follow a
logical order for understanding
the various concepts.
Overview - TRASH MAKES HISTORY

Windows on Waste - TRASH MAKES HISTORY XIII Help Contents Back
▼
▼
304©Ohio Department of Natural Resources Help Contents Back
▼
▼
304
Background Information
Waste disposal is aconcern that has along history, datingback to the estab-lishment of the first
cities. Prior to the development ofcities, human beings in primitive soci-eties disposed of trash by leaving itwhere it fell. That practice was ade-quate because hunter-gatherers fre-quently moved their camps in orderto follow game or to find a newgrowth of plants. When people settledin groups by practicing farming anderecting cities and towns, the manage-ment of garbage and trash becameproblematic.
Early urbanites developed fourmethods of managing waste that arestill used today. They include: land
disposal (open dump or landfill); dis-posal by incineration (burningwaste); recycling (turning waste intosomething useful, including recycled-content products and compost); andsource reduction (minimizing thevolume of goods to be discarded).
Technology and social develop-ment dictates how a society generatesand manages waste. The types ofwaste products and materials generat-ed by a society can tell us a lot aboutthe nature of a society including itspeople’s wants and needs; the state oftechnology; and its relationship withthe environment, including naturalresource use and environmentaldegradation. Four types of socialdevelopment in American and Ohio
history can be identified and analyzed, beginning with NativeAmericans.
Native Americans, possessing thetechnology of primitive societies,had a minimal effect on the environment. They hunted animalsfor food and fur, gathered plants forfood and dye, used plant and animalproducts to make their shelters, usedclay from the Earth to make pots, andchiseled stones for weapons. Theysometimes changed the landscape todevelop trails and clear areas for agri-culture.
As early European settlers inAmerica established agricultural set-tlements and cities, they had a biggerimpact upon the environment. This
3
Ohio Proficiency Test Learning OutcomesGrade 4, Science #1 – Create and use categories to organize phenomena.
Grade 4, Science #14 – Identify and/or describe the relationship between human activityand the environment.
Grade 6, Science #3 – Make inferences from observations of phenomena and/or events.
Grade 6, Science #4 – Identify the positive and/or negative impacts of technology onhuman activity.
Activity 3: Throwaway SocietiesDescriptionStudents read and speak parts of a script that describes how various societies inWestern culture have managed their wastes. They make inferences about informationfrom the script to design props and manipulate materials to make the props.Following the presentation of the skit, students make deductions to sequence culturalwaste management information onto a timeline. They discuss the effects of each dis-posal method upon the environment.
Ohio Proficiency Test Learning OutcomesGrade 4, Citizenship #1 – Demonstrate knowledge of an ability to think about the rela-tionship among events by: (a) identifying sequence of events in history; (c) recognizingthat changes occur in history; and (d) identifying cause and effect relationships.
Grade 4, Science #14 – Identify and/or describe the relationship between human activityand the environment.
Grade 6, Citizenship #6 – Draw inferences about the experiences, problems and opportu-nities that cultural groups have encountered in the past.

Windows on Waste - TRASH MAKES HISTORY XIII Help Contents Back
▼
▼
305©Ohio Department of Natural Resources Help Contents Back
▼
▼
305
developing society harnessed waterpower, animal power and used toolsnot known to primitive societies. Afterthe Revolutionary War ended in 1781,westward expansion began; forestswere cleared, wetlands were drainedand grasslands were plowed to permitfarming. By 1820, much of the landeast of the Mississippi River was beingfarmed and cities were cropping upalong major land and water trans-portation routes.
With the advent of the IndustrialRevolution in the nineteenth century,settlers began to change the environ-ment in ways earlier pioneers couldnot have foreseen. As our countrydeveloped into an industrial society,businesses burned coal to producesteam to power machines to makemore consumer goods. Ready-madeclothes, commercial packaging (tincans, corrugated cardboard, glassjars), factory-cut lumber and othermass-produced items were developedby the end of the nineteenth centuryto generate a consumer society com-patible with industrial production.
An abundance of waste materialsand pollution followed in the wake ofthis development. Industrial pollu-tion and hazardous wastes were gen-erated during mining and manufac-turing operations that affected water,air and land. Polluted water killed fishand other aquatic life forms andreduced the amount of clean water fordrinking, cleansing and recreationalpurposes. Polluted land reduced thefertility and productivity of the soil.Polluted air accumulated in the lungsof humans and animals, and causedhealth problems. In addition to indus-trial wastes, residential waste andcommercial waste was generated inincreasing amounts in cities andtowns and became known as munici-pal solid waste. These are all prob-lems, related to technology and theenvironment, not experienced byprimitive and pioneer societies.
Modern society, or contempo-rary society, has continued industrialdevelopment. Since 1945, the develop-ment of new technologies, such asatomic power and computers, haveled many historians to conclude weare entering a new age – a post-mod-ern or post-industrial era. As newtechnologies and chemicals are intro-duced, they may pose new threats tothe environment and demand mod-ern management practices.
To meet the challenges posed bypollution in the modern era, newtechnologies have been developed tocontrol pollution in mining, manufac-turing and waste disposal. Businessesand consumers are helping to changethe way they operate by consumingless, reusing and recycling morematerials and purchasing environ-mentally-friendly products.
Bibliography and AdditionalResourcesStudent Resources
Common Ground: The Water, Earthand Air We Share, by Molly Bang,New York: The Blue Sky Press, AnImprint of Scholastic, Inc., 1997.
Miss Rumphius, by Barbara Cooney,New York: Viking Press, 1982.
A River Ran Wild, by Lynne Cherry,New York: Harcourt, Brace, andCompany, 1992.
The Lorax, by Dr. Seuss, New York:Random House, 1971.
Brother Eagle, Sister Sky, by SusanJeffers (Chief Seattle's Words), NewYork: Dial Books-Penguin, 1991.
And Still the Turtle Watched, by SheilaMacGill-Callahan, New York: DialBooks for Young Readers-Penguin,1991.
Farewell to Shady Glade, by Bill Peet,Boston: Houghton-Mifflin Company,1966.
The Wump World, by Bill Peet, Boston:Houghton-Mifflin Company, 1970.
Dear Children of the Earth, by SchimSchimmel, Minocqua,Wisconsin:North Word Press, 1994.
The Giving Tree, by Shel Silverstein,New York: Harper & Row, 1974.
Just a Dream, by Chris Van Allsburg,Boston: Houghton-Mifflin Company,1990.
Trash, by Charlotte Wilcox,Minneapolis: Carolrohda Books, Inc.,1988.
Old Turtle, by Douglas Wood, Duluth:Pfiefer-Hamilton Publishers, 1992.
Educator Information
Keepers of the Earth, by MichaelCanduto and Joseph J. Bruchac,Golden, Colorado: Fulcrum, Inc.,1989.
The Young Gaia Atlas of Earth Care, byMiles Litvinoff, New York: Facts onFile, Inc., 1996.
Environment and Pollution, by EdwardP. Ortleb and Richard Cadice, St.Louis: Milliken Publishing Company,1986.
Global Environmental Awareness, byAmy Taplin (Editor), St. Louis:Milliken Publishing Company, 1991.
Ecology for Every Kid, by Janice VanCleave, New York: John Wiley & Sons,Inc., 1996.
The Earth Science Book, by DinahZike, New York: John Wiley & Sons,Inc., 1993.

Windows on Waste - TRASH MAKES HISTORY XIII Help Contents Back
▼
▼
306©Ohio Department of Natural Resources Help Contents Back
▼
▼
306
PreparationUsing the information from theBackground Notes on p. XIII-8, make aset of “expert” cards for each of the fourhistorical periods (Native American,Pioneer, Industrial, Modern). Each 3˝x 5˝ or 4˝x 6˝ card should carry onebit of information about one historicalperiod in relation to one or more of thefollowing categories: land and naturalresource use, occupations, things madefrom natural resources, types of wastecreated, waste disposal practices andpeople’s relationships to the environ-ment. See sample cards on p. XIII-7.
ProcedurePART A
If the Pre- and Post-Test is used,have students complete it.
Divide the class into historicalgroups. Each group should representone of the following socio-cultural timeperiods: Native American, Pioneer,Industrial and Modern. Historically,these eras represent the growth ofOhio and America from a simple to acomplex culture.
NOTE: The group(s) that have ModernCulture should examine cultural phe-nomena from 1945 to today, althoughquestions and concepts in the activityare past tense.
Give each student the handout,You are the Expert, one or two of thepre-made “expert cards” from his/herhistorical period, and several blankindex cards. Also, indicate to studentswhich reference materials are availableabout Ohio and U.S. history.
Have each student share the infor-mation from his/her “expert cards” withthe group. Students can use this infor-mation to answer questions on thehandout, You are the Expert.
Have students use the availablereference materials to acquire moreinformation to answer the questions onthe handout, You are the Expert. Havestudents write questions on their blankcards that will help them complete thehandout, You are the Expert. After theyrecord information from the referencematerial onto their cards, students canshare their new information with theirgroup and complete the handout.
5
4
3
2
1
Everybody is an ExpertObjectivesStudents will be able to: (a) identify specific features of social life in various timeperiods in Ohio and U.S. history; (b) compare resource use and waste managementpractices in four socio-historical periods in Ohio and U.S. history; and (c) sequencephenomena and events about society and environmental concerns on a timeline.
Act
ivity
1Inquiries● How have people living in
different time periods, inOhio and North America,used the land and naturalresources?
● How have different societiesmanaged their waste in Ohioand U.S. history?
● How has the relationshipbetween people and the envi-ronment changed in Ohioand U.S. history?
Content DomainScience – General science
Social Studies – American history, Ohio history
Learning OutcomesCitizenship, Grade 4, #1, #2and Grade 6, #1, #2
Reading, Grade 4, #19a andGrade 6, #16
Science, Grade 4, #14 andGrade 6, #4
DurationPart A: 45-60 minutes, plusresearch time
Part B: 45 minutes, plus display development time
MaterialsPart A: index cards, pen orpencil for each student, refer-ence material about Ohio andU.S. history
Part B: various items (arti-facts) to represent each of thefour historical time periods
Handouts● You are the Expert
● Pre- and Post-Test
● Trash Timeline
TRASH MAKES HISTORY

Windows on Waste - TRASH MAKES HISTORY XIII Help Contents Back
▼
▼
307©Ohio Department of Natural Resources Help Contents Back
▼
▼
307
In chronological order, askgroups to present their information.Discuss with students how the pio-neer culture shared certain traits withNative American culture in regards tonatural resource use and waste gener-ation, which sharply contrasts withthe industrial and modern cultures’experiences.
Have the entire class construct atimeline using the information fromtheir expert cards. Integrate this time-line with others used in class or con-struct it as part of a multiple-tiertimeline. Have students identify causeand effect relationships and the signif-icance of environmental actions in thecontext of other events.
PART B
Have groups create tabletop dis-plays by designing informative posters
and artifacts representative of eachsocio-cultural time period.
To help give students ideas fortheir displays, collect and display avariety of artifacts representative ofdifferent time periods. For example:arrow head, pieces of flint, sharpenedstick, Indian beads or needle made ofbone from Native American culture;iron skillet, patchwork quilt, tin cup,from pioneer culture; newspaper, oldtypewriter, tin can, glass soda bottlefrom industrial culture; packing foam(peanuts), video tape, plastic bottle,push button telephone, pesticidespray from modern culture.
Students observe and identifyeach type of society that might haveused and discarded each item. Theyshould choose the society (NativeAmerican, Pioneer, Industrial orModern) that reflects the earliest his-torical use of the item.
Discuss the following: What canthese artifacts tell us about the soci-eties they are from? What do they sayabout their use of natural resources,their relationship with the environ-ment and the waste they generated?
AssessmentCollect the handout, You are the
Expert, and grade them for completeness.
Administer the Pre- and Post-Test.
ExtensionsConstruct a timeline using the
information on the teacher page,Trash Timeline. Discuss each fact andhave students, in their own words,
1
2
1
4
3
2
1
7
6
Sample “Expert” Cards - Consider using a different color card for each historical period, so the cards can be easilyseparated at the end of the activity.
NATIVE AMERICAN CULTURE
Q. What types of things were created using natural resources?
A. cooking utensils and baskets
PIONEER CULTURE
Q. What types of things were created using natural resources?
A. homes and furniture
MODERN CULTURE
Q. What types of things were created using natural resources?
A. computers and plastic toys
INDUSTRIAL CULTURE
Q. What types of things were created using natural resources?
A. automobiles and radios

Windows on Waste - TRASH MAKES HISTORY XIII Help Contents Back
▼
▼
308©Ohio Department of Natural Resources Help Contents Back
▼
▼
308
transfer the information onto cardsthat can be put on a timeline. Ask stu-dents why most of these facts andevents relate to industrial and moderntimes.
Have students write a poem orsong that tells how resources havebeen used and how people managedtheir wastes throughout history.
Read The Patchwork Quilt, byValerie Flournoy. Have students makea “recycled” patchwork quilt with eachpatch representing environmentalinformation from one of the historicalperiods, or make one that includes allof the periods.
3
2
NATIVE AMERICAN CULTURE (in Ohio) – 1600-1800
● Waste is organic and biodegradable.
● Waste is burned, buried or left behind.
● Native people hunt and fish to provide basic needs.
● Population density is small.
● Native people make simple tools from wood and stone.
● Native people believe there are spirits in nature.
● Respect for environment; all life is sacred.
PIONEER CULTURE (in Ohio) – 1781-1840
● Most waste is organic and biodegradable.
● Pollutants include sawdust and chimney ash.
● Pigs are used to eat garbage.
● Fabric is made from sheep’s wool.
● People farm crops and hunt animals to provide basicneeds.
● Crops are grown without pesticides and herbicides.
● People do not believe there are spirits in nature.
● Respectful of environment because of people’s depen-dence on their physical surroundings.
INDUSTRIAL CULTURE – 1840-1945
● Complex machines make products.
● Mining for coal and other minerals, and drilling for oilprovides energy and materials to make products.
● Expansion of homes, factories and roads reduces farmland.
● Rapid growth of cities.
● More and more workers enter manufacturing and service occupations.
● Natural surroundings viewed as resources for unlimiteduse by man.
MODERN CULTURE – 1945-present
● Unregulated or abandoned hazardous waste facilitiesbecome a problem.
● Natural resources are processed into plastic and othersynthetic materials.
● Litter is a problem.
● Non-point source pollution (run-off from fields, parkinglots, etc.) is a problem.
● Urban waste is buried in sanitary landfills.
● Municipalities develop sewage treatment plants.
● Very few people are employed in agriculture as compared to those in industry and service occupations.
● There is some concern about the long-term effects ofmodern civilization on the environment.
Background NotesNOTE: These notes are meant to be suggestions only. Language and concepts should be made age-appropriate.
Add items and revise the list to help students answer questions on the handout, You are the Expert.
Directions for Making a Patchwork Quilt
MATERIALS
Assorted colors of stiff paper or card stock (old file folders); hole punch;yarn or colored string cut in 8˝ lengths; scissors; crayons or markers; picturesor drawings representing aspects of the historical period
DIRECTIONS
Cut the stiff paper into 6˝ squares. Paste a picture or drawing on eachsquare. Lay out the card pictures in the sequence you want. Punch two holesin tops, bottoms and sides to join the squares.
Pull the yarn through the holes to join the squares; tie on the back. Hang ona bulletin board or wall, or display flat on a table.

Windows on Waste - TRASH MAKES HISTORY XIII Help Contents Back
▼
▼
309©Ohio Department of Natural Resources Help Contents Back
▼
▼
309
Student Handout ✐You are the Expert
Directions: Complete the following questions as directed by your teacher.
GROUP HISTORICAL CULTURE ____________________________________________________________________
EXPERT’S NAME _______________________________________________________________________________
What did people do to make a living and provide for their wants and needs?
_____________________________________________________________________________________________
_____________________________________________________________________________________________
_____________________________________________________________________________________________
_____________________________________________________________________________________________
How were natural resources and the land used by this historical culture?
_____________________________________________________________________________________________
_____________________________________________________________________________________________
_____________________________________________________________________________________________
_____________________________________________________________________________________________
What types of things did people make and what types of tools or machines did they use to make these things?
_____________________________________________________________________________________________
_____________________________________________________________________________________________
_____________________________________________________________________________________________
_____________________________________________________________________________________________
What types of things did people throw away and what did they do with their waste?
_____________________________________________________________________________________________
_____________________________________________________________________________________________
_____________________________________________________________________________________________
_____________________________________________________________________________________________
What can be inferred about the relationship between these people and the environment? How did these people change the environment (land, air, water, plants and animals)?
_____________________________________________________________________________________________
_____________________________________________________________________________________________
_____________________________________________________________________________________________
_____________________________________________________________________________________________
5
4
3
2
1
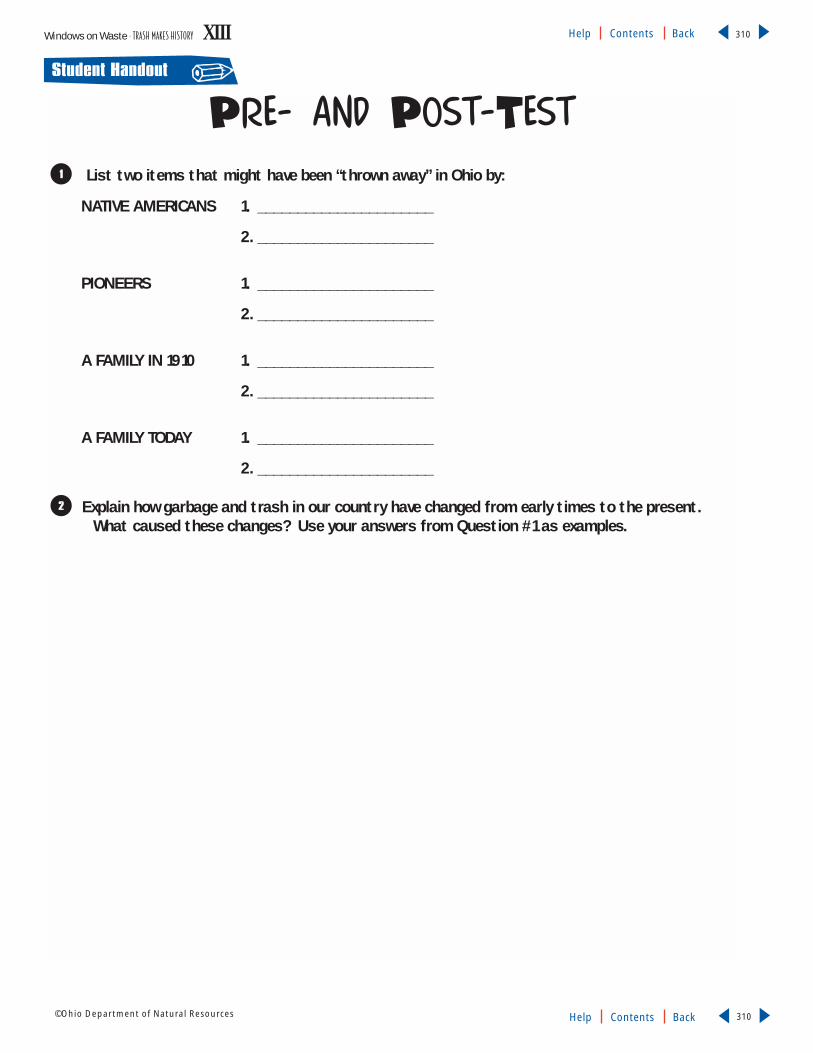
Windows on Waste - TRASH MAKES HISTORY XIII Help Contents Back
▼
▼
310©Ohio Department of Natural Resources Help Contents Back
▼
▼
310
Pre- and Post-Test
List two items that might have been “thrown away” in Ohio by:
NATIVE AMERICANS 1. ______________________
2. ______________________
PIONEERS 1. ______________________
2. ______________________
A FAMILY IN 1910 1. ______________________
2. ______________________
A FAMILY TODAY 1. ______________________
2. ______________________
Explain how garbage and trash in our country have changed from early times to the present. What caused these changes? Use your answers from Question #1 as examples.
2
1
Student Handout ✐

Windows on Waste - TRASH MAKES HISTORY XIII Help Contents Back
▼
▼
311©Ohio Department of Natural Resources Help Contents Back
▼
▼
311
500 BC The first municipal dump in the westernworld was established in Athens, Greece.Waste had to be dumped at least onemile from the city walls.
1388 English Parliament banned waste disposal in public waterways and ditches.
1400 Garbage was piled so high outside Paris,France that it interfered with the city’sdefenses.
1690 The first paper mill in the United Stateswas established near Philadelphia. TheRittenhouse Mill made paper from wastepaper and old rags.
1757 Benjamin Franklin instituted the firstmunicipal street cleaning service in theUnited States in Philadelphia.
1842 A report in England linked disease tofilthy environmental conditions.
1850 Paper began being manufactured fromwood.
1874 The first garbage incinerator went intooperation in Nottingham, England. Itwas called “the destructor.”
1885 The first incinerator in the United Stateswas built on Governors Island in NewYork City.
1889 A Washington, D.C. health officerreports that “appropriate places for(refuse) are becoming scarcer year byyear...”
1894 The first comprehensive system of publicsector garbage management in theUnited States was started in New YorkCity.
1896 Waste reduction plants that compressedorganic wastes to extract grease, oils andother by-products were introduced tothe United States from Vienna, Austria.(The plants were later closed because oftheir noxious emissions.)
1898 The first rubbish-sorting plant in theUnited States was organized in New YorkCity.
1900 “Piggeries” were developed in small-to-medium-sized towns. Pigs were fed rawor cooked garbage.
1902 A Massachusetts Institute of Technologysurvey found that 79 percent of 161 U.S.cities provided regular collection ofrefuse.
1904 The first two major aluminum recyclingplants opened in Chicago and Cleveland.
1904, The first modern landfills were opened1906, in Champaign, Illinois; Dayton, Ohio;1916 and Davenport, Iowa.
1916 Cities began switching from horse-drawn vehicles to motorizedrefuse collection equipment.
1920s Using wetlands near cities became apopular landfilling disposal method.Landfill layers alternated garbage, ashand dirt.
1930s Jean Vincenz, the public works commissioner in Fresno, California,coined the term “sanitary landfill.”
1942- During World War II, Americans 1945 collected rubber, paper, scrap metal, fats
and tin cans to help the war effort.
Trash Timeline

Windows on Waste - TRASH MAKES HISTORY XIII Help Contents Back
▼
▼
312©Ohio Department of Natural Resources Help Contents Back
▼
▼
312
Student Handout ✐
Mid- Public health departments prohibited1950s the use of raw garbage in animal feed.
1965 The first federal solid waste managementlaw, the Solid Waste Disposal Act,authorized research and provided stategrants.
1970 The U.S. Environmental ProtectionAgency was created. The first Earth Daywas celebrated on April 22.
1972 The first international environmentalconference was held in Stockholm,Sweden.
1976 The U.S. Resource Conservation andRecovery Act (RCRA) created a signifi-cant role for the federal government inwaste management. It emphasized recy-cling, conservation of energy and otherresources, and launched the nation'shazardous waste management program.
1978 The U.S. Supreme Court ruled that statescannot ban shipments of waste fromother states because garbage is protectedby the Interstate Commerce Clause.
1979 The U.S. Environmental ProtectionAgency issued landfill criteria prohibiting open dumping.
1986 Fresh Kills Landfill on Staten Island,New York became the largest landfill inthe world. It is 25 times larger than theGreat Pyramid of Khufu in Gisa, Egyptand 40 times larger than the Temple ofthe Sun in Mexico.
Rhode Island enacted the nation’s firststatewide mandatory recycling law forcing citizens and businesses to sepa-rate recyclables from their trash.
1987 The infamous “garbage barge” from Islip,New York, was rejected by six states andthree countries. The publicity drew public attention to the landfill capacityshortage in the Northeast. (The garbagewas finally incinerated in Brooklyn, NewYork and the ash was landfilled nearIslip.)
1988 House Bill 592 of the Ohio Legislaturecreated solid waste districts, and recycling was added to community stategrant programs.
1992 The “Earth Summit” was hosted byBrazil. The United Nations Conferenceon Environment and Development created Agenda 21, a blueprint for sustainable development in the 21st century.
Trash Timeline, continued

Windows on Waste - TRASH MAKES HISTORY XIII Help Contents Back
▼
▼
313©Ohio Department of Natural Resources Help Contents Back
▼
▼
313
PreparationDecide how many groups you want toorganize. Put three or more items fromthe Materials list into a container; eachgroup should receive their own separatecollection of items.
NOTE: This activity may be conductedusing a single collection of items.
ProcedureDivide students into groups. Give
each group a collection of trash items ormake the items easily observable to theentire class. In their groups, have stu-dents discuss what each item revealsabout the people who lived in the homethat discarded the item. Responses canbe recorded using the handout, StoriesTrash Can Tell. Each student in eachgroup can be responsible for a separateitem.
For example, a steel vegetable can indi-cates a “need” for food and a desire, or“want,” to preserve the food item for along time; the can is an example oftechnology (food preservation technol-ogy and steel fabrication); and in orderto produce the can, natural resources(iron ore and coal) had to be taken(mined) from the environment. Miningmay have affected the environment by
causing land, air and/or water pollution.The vegetable contents indicate a farm-ing culture that probably cleared forestland in the past to plant crops.
Discuss group answers. Summarizewhat the class has learned about thefamily by looking at its trash. What dowe know about them? What do weknow about how they interact withtheir environment? Explore the mean-ing of the recycling symbol on theitem(s) made from recycled material.
Also discuss the following: If wecan learn “secrets” by looking at a fami-ly’s trash, what might we learn by look-ing at a community’s trash or trashfrom a society in the past?
OPTIONAL: Refer to the itemsused in Part B, #2 of the previous activi-ty, Everybody is an Expert. Put theseitems in plastic tubs covered with dirtand have students “unearth” them, dust-ing them off with old paintbrushes.Students should examine each artifact,discuss it and analyze it by completingthe chart, Stories Trash Can Tell, for eachitem. Point out that archaeology is basi-cally a study of trash remaining fromearlier civilizations. What do studentsthink archaeologists in the future willlearn about our society by looking inour landfills?
4
3
2
1
Inquiry● What can be learned about
people and societies, and theirrelationships to the environ-ment, by analyzing trash?
Content DomainScience – General science
Social Studies – Sociology,anthropology
Learning OutcomesScience, Grade 4, #1, #14 andGrade 6, #3, #4
DurationTwo 50-minute class periods
MaterialsFor each group of students,obtain products that are dis-carded in the trash. The follow-ing is a sampling of recom-mended items: lipstick tube,disposable diaper, screwdriveror paint brush, tooth brush,plastic bottle, glass bottle, alu-minum or steel can, greetingcard, newspaper, toaster orother old small electric appli-ance, pill container, small toyor other action figure. In eachgroup, try to include containersor packaging items that have therecycling symbol.
Handout● Stories Trash Can Tell
Secrets in a Garbage Can ObjectiveStudents will be able to explain what discarded materials may reveal about a familyor a society and their relationship to the environment.
Act
ivity
2
AssessmentHave each student select an item(artifact) not previously discussedin class and complete the chart,Stories Trash Can Tell, for that item.
TRASH MAKES HISTORY

Windows on Waste - TRASH MAKES HISTORY XIII Help Contents Back
▼
▼
314©Ohio Department of Natural Resources Help Contents Back
▼
▼
314
Stories Trash Can Tell
Identify the trash item or “artifact” in the first column. In the other three columns, infer what the item can tell us about the people or society that generated this item in their trash.
1
Student Handout ✐
ARTIFACT● What is the object?● Describe it, if you
are not certainwhat it is.
SOCIETY● What want or need
does this objectappear to repre-sent?
● How might thisobject help satisfythat want or need?
TECHNOLOGY● How was the object
made? ● What types of
tools or machinesare necessary tomake this object?
● What type of ener-gy is required touse the tools ormachines?
ENVIRONMENT● What natural
resources weretaken from theenvironment tomake this object?
● How might theenvironment beaffected orchanged by makingthis object?
On the back of this page describe in paragraph form the people (culture) that generated this trash? 2

Windows on Waste - TRASH MAKES HISTORY XIII Help Contents Back
▼
▼
315©Ohio Department of Natural Resources Help Contents Back
▼
▼
315
PreparationMake single-sided copies of the scriptfor each student. Posters can be madeand/or costume material can bebrought in for students to use.
ProcedureDistribute scripts and assign parts:
Narrator, Prehistoric Person, CaveDweller, Roman, Briton, AmericanSettler, American Colonist, fourIndustrialists, three Scientists, NativeAmerican and Chorus (as many in thechorus as needed so each student has apart).
Have each student make a posterto illustrate the content of his/her part.Chorus members should make the fol-lowing posters: THROW IT, BURY IT,BURN IT TO ASH, REUSE, RECY-CLING. (More than one poster of eachcan be used.) Narrator should make aposter of the title of the skit.
Students should fasten theirscripts on the back of their posters andhighlight or underline their lines.
Perform the skit with each studentholding up his/her poster as they readthe lines. Students should be arrangedin speaking order, and all should standat the beginning of the skit.
Follow the performance with a
discussion of how each culture disposedof their trash. Ask students why somesocieties have had more problems withtrash than others (i.e. urban settingscreate problems of space for disposal).How might different disposal methodsaffect the environment? Are the threemethods still being used today?
Scramble the six types of charac-ters/societies (Prehistoric Society, NativeAmerican Society, Roman Society, BritonSociety, Colonial American Society,Industrial Society) on the board andhave students write the correct historicalsequence of the societies without lookingback at the script. If you have a class-room timeline, add these societies with adescription of their solid waste practices,in the appropriate places.
AssessmentChoose six statements or passages
from the script, one for each of the sixsocieties. Read each of these (withouttelling students the name of the charac-ter/society of each) and have studentsidentify which society made the state-ments.
Have students list each of the sixcultures on a piece of paper and writean appropriate passage for each thatcould be added to the skit, reflectingsome unique aspect about each culture.
2
1
6
5
4
3
2
1
Inquiry● How have people disposed of
waste throughout history?
Content DomainScience – General science
Social Studies – History, sociolo-gy, anthropology
Learning OutcomesCitizenship, Grade 4, #1 andGrade 6, #6
Science, Grade 4, #14
Duration30-45 minutes, plus additionaltime for construction of set,costumes and designs if included
MaterialsOptional: poster board, mark-ers, crayons or paint, glueand/or transparent tape, cos-tume items
Handout● Throwaway Societies (script)
Throwaway SocietiesObjectivesStudents will be able to: (a) cooperate as a class to read and dramatize a historicalreview of waste disposal practices; (b) explain how societies of the past disposed oftheir wastes; and (c) identify the sequence of social evolution in Western culture.
Act
ivity
3
ExtensionsAfter the skit is presented in
the classroom, consider presentingthe skit to another class, schoolassembly or PTO meeting.
Have students identify anddescribe where their waste is takenfor disposal and/or recycling in thecommunity by making drawings ofmajor places in the community ona map and tracing the route theirgarbage takes on the map. Makesimilar maps based on inferencesand any information that can bediscovered about the local commu-nity during the 1920s, 1850s andthe 1700s (by Native Americansand early settlers).
2
1
TRASH MAKES HISTORY

Windows on Waste - TRASH MAKES HISTORY XIII Help Contents Back
▼
▼
316©Ohio Department of Natural Resources Help Contents Back
▼
▼
316
Student Handout ✐
NARRATOR (1)
This is the tale of the Throwaway Three,
Of man and his garbage throughout his-to-ry.
Now they’re very nice people, just like you and me
Who all have a problem, as you will soon see:
What shall they do with their garbage and trash?
CHORUS (2)
Why, throw it! Or bury it! Or burn it to ash!
PREHISTORIC PERSON (3)
I represent people when we lived very free.
I get rid of garbage so easily!
It’s a snap! It’s no problem! It’s tossed on the ground,
And when things get smelly, we just move around!
CAVE DWELLER (4)
I am a cave dweller; I use all I see.
What I do with old stuff is all up to me.
I burn it, like meat, burn it up in the fire
Or bury it, like bones, in the muck and the mire.
CHORUS (5)
Yes, throw it, or bury it, or burn it to ash!
That’s how we always get rid of our trash!
ROMAN (6)
I am a Roman who lives in a town;
New laws won’t allow me to just throw trash down.
I am required to take it a full mile away
Before I can dump it. This happens each day!
BRITON (7)
I am a Briton, wary and quick;
Down on my street, trash gets pretty thick.
When housewives upstairs want to pitch out their goo,
Out the window it goes as they yell: “Gardy-loo!”
The garbage will stay there until the next rain,
Or until our fair London should burn down again.
CHORUS (8)
Oh, what do we do with our garbage and trash?
We throw it, or bury it, or burn it to ash!
SETTLER (9)
I am a settler. I came without much:
Only my tools, my clothing and such.
Everything else I must make all by hand;
So I don’t throw out much – I use all I can.
Cloth scraps become quilts; I reuse my bent nails.
It will be a long time ’fore the next trade ship sails.
COLONIST (10)
I am a colonist. Now, life’s not so tough.
We have trade between cities that brings lots of stuff,
And some things are made by our townsfolk. Today
I could buy a new harness, throw this one away.
We have pigs and hogs running loose in our street;
If I toss garbage out there, they’ll eat it up neat.
Or I might bury it right over there –
Or I might burn it. Nobody would care.
You see, the New World is the same as the Old!
We trashmakers come from a time-honored mold.
Throw-Away SocietiesAdapted from A-Way With Waste, Washington State Department of Ecology.

Windows on Waste - TRASH MAKES HISTORY XIII Help Contents Back
▼
▼
317©Ohio Department of Natural Resources Help Contents Back
▼
▼
317
CHORUS (11)
What are we still doing with garbage and trash?
You guessed it! Throw it, or bury it, or burn it to ash!
INDUSTRIALIST #1 (12)
I’m the industrial person, new on the scene;
I mass produce goods with my trusty machine.
This sweater, handmade, took a week years before,
But now, in one hour, I can make forty-four.
I make things so cheaply, you can now afford two,
And discard twice as much trash as you need to do.
SCIENTIST #1 (13)
I am a scientist in the new post-war age.
We learned a few tricks while war shortages raged.
When we couldn’t get natural stuff to process,
We invented synthetics to replace them. Oh, yes!
INDUSTRIALIST #2 (14)
Your old woolens and silks, leather and cotton,
Wooden toys and washboards will all be forgotten.
We’ll use rayon and nylon, acrylics and plastic
To make furniture, clothing and even elastic.
SCIENTIST #2 (15)
Our new stuff will last ’til forever, you see
Even when it’s worn out to you and to me.
Permanent pressed, pre-sized and pre-shrunk,
When dingy and old, it’s permanent “junk!”
INDUSTRIALIST #3 (16)
We make instant menus that come in a pack;
You just boil the food in its own plastic sack.
And our TV dinner in its disposable tray –
It’s quick! You don’t wash it, just throw it away!
SCIENTIST #3 (17)
We make lots of TVs and clothes dryers, too.
Don’t ask for a trade-in, you’re kidding, aren’t you?
INDUSTRIALIST #4 (18)
Each year, new cars have a different design;
So repairs will be costly to yours and to mine.
Soon we won’t bother to make last year’s parts
For Skylarks, Novas, Cougars and Darts.
SCIENTIST #5 (19)
It’s the new gadget, the new style that Americans crave;
So out with the old stuff! Away to a grave!
INDUSTRIALIST #5 (20)
So what, if more of us are buying more goods?
So what, if they won’t rot away as they should?
NATIVE AMERICAN (21)
Now wait just a minute! You cannot fail
To include me in your historic trash tale!
We Indians lived simply, on prairies, in woods,
We made no high trash piles, nor mass-produced goods.
Let me be your critic, show you just where you stand,
And how you’re defiling our wonderful land.
Your newfangled goods will not rot away -
When you throw them down, they remain where they lay.
You say you will bury them deep in the ground,
The trash from your cities will make quite a mound!
And sometimes you burn things in smoldering masses
That fill up the air with hot, deadly gases!
Oh, all of your answers have faults everywhere:
And pollute the water, the land or the air.
What’s more, your resources - your oil and your ore
Get smaller each year...and Earth’s not making more!
Throw-Away Societies Page 2

Windows on Waste - TRASH MAKES HISTORY XIII Help Contents Back
▼
▼
318©Ohio Department of Natural Resources Help Contents Back
▼
▼
318
INDUSTRIALIST #6 (22)
You’re right. Our resources are shrinking away
While our throwaway problems grow bigger each day.
We convert our resources to wants, wishes and needs;
When reuse and recycling should be our new creeds.
SCIENTIST #6 (23)
Oh, stop it! Don’t drop it! We’ll think of a way
To make food for cows that’s better than hay.
Don’t burn it! Return it! We’ll make something new:
A vase for your mother, a new hat for you.
Don’t bury it. Carry it back to the mill;
We’ll make a new blanket to ward off the chill.
CHORUS (24)
Yes, it’s time we progressed past the Disposal Age
To make reuse and recycling the popular rage!
We’ll have to give up old solutions for trash
And realize its pure balderdash - to just
Throw it, or bury it, or burn it to ash!
NARRATOR (25)
This was the tale of the Throwaway Three,
Of man and his garbage throughout history.
We hope that you’ve learned a lesson from us
And will change waste disposal without any fuss.
Don’t throw it, or bury it, or burn it outside;
Reuse and recycle, it will fill you with pride.
Throw-Away Societies Page 3

Windows on Waste - TRASH MAKES HISTORY XIII Help Contents Back
▼
▼
319©Ohio Department of Natural Resources Help Contents Back
▼
▼
319

Environmental StudiesLearning Concept
How land and resources are
used is a function of laws,
customs and practices gov-
erning the rights, duties and relation-
ships of people to the land. Land is
both a public and private commodity
with economic value related to com-
mercial actions. Resources, in the
form of natural resources and fin-
ished goods, have economic value
related to commercial actions.
Governments can regulate industry
and commerce to serve the public
interest. Environmental legislation
frequently involves conflicts between
public and private business interests
and between local, state and federal
governments.
Solid waste management is a
local community concern that has
progressively been regulated by state
and federal governments through
legislation. As an aspect of solid
waste management, recycling may be
enhanced or hindered by economic
market conditions and by local, state
and national laws, regulations,
ordinances and policies.
VocabularyGeneral Assembly – a body of legislators; in Ohio this body, which is alsocalled the state legislature, includes members of the House of Representativesand the Senate
governor – the most important person in the executive branch of state govern-ment; responsible for administering and enforcing the laws of the state
House Bill 592 – an Ohio law that provides rules and regulations for managingeveryone’s garbage or solid waste
House of Representatives – one of two groups or chambers that make up theOhio Legislature or Ohio General Assembly; its 99 members propose and makelaws
Senate – one of two groups or chambers that make up the Ohio Legislature orOhio General Assembly; its 33 members propose and make laws
solid waste – garbage and trash from residences, businesses and institutions(schools, hospitals, etc.)
solid waste management districts – districts made up of one or more countygovernments in Ohio for the purpose of complying with the statutes of HouseBill 592, Ohio’s solid waste management law
standing committee – a group of state legislators, within the House ofRepresentatives and the Senate, who are assigned to consider a specific publicconcern, such as agriculture, education, transportation and the environment;they hold public hearings on bills, debate them and revise them
JOURNEY OF A GARBAGE BILLWindows on Waste - JOURNEY OF A GARBAGE BILL XIV Help Contents Back
▼
▼
320©Ohio Department of Natural Resources Help Contents Back
▼
▼
320

Windows on Waste - JOURNEY OF A GARBAGE BILL XIV Help Contents Back
▼
▼
321©Ohio Department of Natural Resources Help Contents Back
▼
▼
321
1Activity 1: Journey of a Garbage BillDescriptionStudents write entries in a journal detailing the legislative process, using a solid wastemanagement bill as an example. A role-playing exercise reenacts the process of how abill becomes a law through the testimony of citizens, public officials and experts.Students listen carefully to make inferences from the testimony read by other studentsin order to define important terms, summarize the major idea of each passage anddistinguish fact from opinion. At the end of each round, students develop group dis-cussion skills to make decisions about which provisions, based on testimony, should beincluded in the bill. After the exercise, they discuss the roles of state and local govern-ments and how citizens and local and state governments must cooperate to solveproblems and make choices.
Ohio Proficiency Test Learning OutcomesGrade 4, Citizenship #13 – Identify the function of each branch of state government.
Grade 4, Citizenship #14 – Identify the purposes of state government.
Grade 4, Citizenship #15 – Identify or explain the purposes of local government.
Grade 4, Citizenship #16 – Differentiate between statements of fact and opinionfound in information about public issues and policies.
Grade 4, Citizenship #17 – Identify and assess the possibilities of group decisionmaking, cooperative activity and personal involvement in the community (e.g., van-dalism, school rules and recycling).
Grade 6, Citizenship #17 – Interpret how examples of political activity illustratecharacteristics of American democracy.
Grade 6, Citizenship #19 – Analyze information on civic issues by organizing keyideas with their supporting facts.
Grade 6, Citizenship #20 – Identify and analyze alternatives through which civicgoals can be achieved and select an appropriate alternative based upon a set of crite-ria (e.g., fire hydrant repair, use of public buildings, recycling programs).
SummaryThis lesson consists of
one activity.
Overview - JOURNEY OF A GARBAGE BILL

Windows on Waste - JOURNEY OF A GARBAGE BILL XIV Help Contents Back
▼
▼
322©Ohio Department of Natural Resources Help Contents Back
▼
▼
322
Background Information
Garbage issues are oftenmore complex thanthey first appear. Assolid waste manage-ment issues became
more complex during the past decade,local, state and federal governmentshave intervened. Ohio House Bill 592 (H.B. 592), passed in 1988, is anexample of how state governmentintervened locally to deal with solidwaste management problems.H.B. 592 reflects the intentions oflocal and state governments to providepublic services while protecting thehealth and safety of citizens.Implementing H.B. 592 has requiredcooperation among citizens, businessesand local and state governments.
The legislative branch of govern-ment in Ohio, referred to as theGeneral Assembly, is made up of twohouses – the House of Representativeswith 99 members, and the Senatewith 33 members. It is the responsi-bility of the General Assembly, as withany legislative branch of government,to write laws. A proposed new law iscalled a bill until it is approved by amajority in both houses.
Once introduced, a bill isreviewed and assigned to a standingcommittee. Standing committees areextremely important in the process ofpassing laws. These committeesdebate, refine and rewrite the bill andhold public hearings throughout thestate when needed. Although thenumber and titles of standing com-mittees may vary in each house, bothhouses generally have ongoing com-mittees that focus on importantissues, such as agriculture, health andhuman services, the environment andeducation.
Once passed the bill is referred toas an act. The act then goes to thegovernor who may sign it into law,allow it to become law without his
signature, or veto it. If the governorvetoes an act, it is possible for theGeneral Assembly to override the vetoby obtaining a three-fifths vote ofapproval in each house.
H.B. 592 was developed becauseof concerns about out-of-state wastecoming into Ohio for disposal. By thetime it became law, it includednumerous statutes and establishedsolid waste management districts(SWMDs) at the county governmentlevel. H.B. 592 requires the OhioEnvironmental Protection Agency andlocal SWMDs to develop and imple-ment a solid waste management planthat meets the mandates of H.B. 592.These mandates include:
● Reduce reliance on landfills byreducing the amount of waste gen-erated and by reusing, compostingand recycling waste materials.
● Promote markets for recycled mate-rials so there will be an economicincentive to recycle.
● Improve landfill construction andmanagement so the potential forpollution is reduced and the envi-ronment and public health are pro-tected (through the application oftechnology to prevent ground watercontamination, surface water runoffand explosions of methane gas).
● Restrict the dumping of some haz-ardous waste materials, such as bat-teries and industrial process wastes.
● Establish a program for the properseparation and disposal of haz-ardous waste generated by house-holds.
● Plan for future disposal needs.
H.B. 592 could not resolve theoriginal concerns about the exportingof waste into the state from otherstates. That issue remains disputed,although the U.S. Supreme Court
recently ruled that it is a violation ofinterstate commerce to restrict theflow of solid waste. States cannotimpose excess fees on incoming waste,and they cannot outlaw the exporta-tion of solid waste. Controlling theflow of solid waste is also a local issuewithin solid waste management dis-tricts and has led to disputes betweenbusinesses and local governments overrestricting the flow of waste withinand between Ohio counties.Therefore, solid waste issues haveinvolved all three branches of govern-ment: legislative, executive andjudicial branches.
Bibliography and AdditionalResourcesStudent Resources
The Environmental Crisis: OpposingViewpoints, edited by Neal Bernards,Greenhaven Press, Inc., 1991.
Garbage, by Karen O’Connor, LucentBooks, Inc., 1989.
Recycling, by Don Nardo, San Diego:Lucent Books, Inc., 1992.
Recycling, by Rebecca Stefoff, NewYork: Chelsea House Publishers, 1991.
Educator Information
State Solid Waste Management Plan,Columbus, Ohio: OhioEnvironmental Protection Agency,1995.
The Ohio Almanac: An Encyclopedia ofIndispensable Information About theBuckeye Universe, edited by MichaelO’Bryant, Orange Frazer Press, 1997.

PreparationCut out the speaking roles from thehandout, The Story of a Bill: ClassroomRoles. Keep a complete copy to followalong with as students read the individ-ual passages. Before the class activity,review the testimony passages to acquirean understanding of the roles.
ProcedureHave students prepare a journal
for the role-playing exercise. On thecover of their journals, have studentswrite the title “Journey of a Bill” andtheir names. Tell students they will findout what a “bill” is when conducting theexercise.
Show students a bag of trash andexplore briefly what its contents mightinclude. Mention that it seems like sucha simple thing – “just a bag of trash.”Ask students: Who decides what hap-pens to this bag of trash? Familiesdecide who should take the garbage outto the curb, but who decides what hap-
pens to it once it is at the curb? Explainto students that the role-playing activitywill try to answer the question: Whodecides what happens to this bag oftrash?
Have students write on the firstpage of their journal the followingquestion: Who decides what happens toa bag of trash? Have them make a list ofanswers based on the class discussion inStep 2. This can be used as a pre-assess-ment by comparing their initial answerswith their answers to this same questionat the end of the journal. Or, you maypre-assess students’ understanding oflaws and lawmaking, in the context ofsolid waste management, by using themodel tests described in the Assessmentsection. If students already have a basicunderstanding of the structure of gov-ernment and laws, skip Step 4 and pro-ceed to Step 5.
Ask students to define “govern-ment.” Ask them to define a “law.”Discuss these two concepts briefly. (Ingeneral, government makes rules, or
4
3
2
1
Inquiries● What is the nature of state
and local governments inOhio?
● What is the role of state andlocal governments in solidwaste management?
● How does a bill become a lawin Ohio?
Content DomainSocial Studies – Government,civics
Learning OutcomesCitizenship, Grade 4, #13, #14,#15, #16, #17 and Grade 6, #17,#19, #20
DurationFour to five 50-minute classperiods
MaterialsWriting and drawing materi-als, notebook or notebookpaper for making a journal(about 20 pages)
Handouts● The Story of a Bill: Classroom
Roles
● Words of Citizenship
● A Bill
● Decisions, Decisions
Journey of a Garbage BillObjectivesStudents will be able to: (a) make inferences from written and oral information
about the organization and purposes of local and state governments; (b) explain
how a bill becomes a law; and (c) identify controversial issues in solid waste
management.
Act
ivity
1JOURNEY OF A GARBAGE BILL
Windows on Waste - JOURNEY OF A GARBAGE BILL XIV Help Contents Back
▼
▼
323©Ohio Department of Natural Resources Help Contents Back
▼
▼
323

Windows on Waste - JOURNEY OF A GARBAGE BILL XIV Help Contents Back
▼
▼
324©Ohio Department of Natural Resources Help Contents Back
▼
▼
324
laws, to live by and provides servicesthat people need and/or want, such aspolice protection, garbage collection,etc.)
Using a pencil, have students con-struct a model of “circles of govern-ment” on a page in their journal. Havethem draw a small circle in the middleof the page and write the word“house” in the circle. Briefly discusssome rules and services that exist inhouseholds, then have students drawanother circle around the house circleand label it “school.” Briefly discusssome rules and services that exist inschools. Identify what type of localgovernment exists in the communityfor the next ring or rings. (This couldbe one or more rings to designatetownship board of trustees and/orcity, village or town council, and/orboard of county commissioners.)Briefly explore what types of rules andservices local governments provide.Next, have students add a ring forstate government, followed by a ringfor the federal (U.S.) government.Briefly explore what type of rules(laws at this level of government) aremade by state and federal govern-ments.
Engage students in the role-reading exercise from the handout,The Story of a Bill: Classroom Roles.These roles portray how Ohio’s solidwaste bill, H.B. 592, became a law. Itincludes 20 passages of testimony tobe read in sequence by different stu-dents.
NOTE: The passages of testimony arenot from any specific testimony actually presented in the making ofH. B. 592, but they summarize manyof the concerns discussed anddebated.
The exercise is to be conducted inthree separate parts. These parts are:PART A: A county in Ohio; PART B:The Ohio House of Representatives inColumbus; and PART C: The SenateChamber in Columbus. Before you
begin each part, have students writethese headings in their journals.
Students who are not reading passagesof testimony are to role-play the following for each part.
Part A: writers who draft H.B. 592 forthe sponsor of the bill in the House ofRepresentatives.
Part B: Members of the House ofRepresentatives’ standing committeedebating and rewriting the bill.
Part C: Members of the Senate’sstanding committee debating andrewriting the bill.
Part D consists of one passage only.There is no follow up to Part D.
After each passage of testimony isread, review the passage and clarifycomplex issues. Then, have all stu-dents record the following in theirjournals:
(a) important terms – In the pas-sages, vocabulary words are listed inbold. When a passage contains a high-lighted word, have the student whoread the passage write the word(s) onthe board. (Some passages do notcontain any highlighted vocabularywords.) Discuss the meaning of thevocabulary words based on makinginferences from the passage. Have stu-dents record these inferred definitionsin their journals. The teacher page,Words of Citizenship, contains defini-tions for all of the highlighted wordsin the passages.
NOTE: As the exercise continues, pas-sages may reveal additional informa-tion about previously identifiedvocabulary words. This new informa-tion should be added to each vocabu-lary word; therefore, have studentswrite the meanings of vocabularywords in pencil and leave severalspaces below each definition to makechanges.
(b) main idea of the passage –Discuss this as a class and then have
students write in their journals a sen-tence that describes the main idea ofthe passage.
(c) facts – Discuss and have studentswrite facts from the passage in theirjournals.
(d) opinions – Discuss and have stu-dents write opinions from the passagein their journals.
As each of the three parts iscompleted, have students meet ingroups to write proposals for the billon the handout, A Bill. Discuss eachgroup’s proposals and how well theyexpressed the “main ideas” of the tes-timony (numbered passages).
Write a single classroom H.B. 592based on the discussion and have astudent record these proposals on ablank copy of the handout, A Bill.Students should record a summary ofthis classroom version of the bill intheir journal before proceeding to thenext part. Students who speak at thebeginning of parts B, C and D willread the classroom versions of H.B.592.
NOTE: On the handout, A Bill, theformat at the top of the page resem-bles what a real bill looks like whenpassed by legislators. The space indi-cated “as proposed” should bechecked when preparing the initial bill in Part A; the space indicated “as passed by the House ofRepresentatives” should be checkedwhen rewriting the bill at the end ofPart B; the space indicated “as passedby the Senate” should be checkedwhen rewriting the bill at the end ofPart C.
After the governor reads thefinal passage, have students reconsiderthe question: Who decides what hap-pens to this bag of trash? (Ultimatelyit is the people or citizens who eitherbecome actively involved or who par-ticipate through the government rep-resentatives they vote for.) Have themdraw and label a diagram about how a
7
6
5

Windows on Waste - JOURNEY OF A GARBAGE BILL XIV Help Contents Back
▼
▼
325©Ohio Department of Natural Resources Help Contents Back
▼
▼
325
bill becomes a law at the end of thejournal. Discuss with students thecomplexities of trying to decide whathappens to a bag of trash.
Compare the classroom H.B. 592with provisions of the real H.B. 592 asdescribed in the background informa-tion to this lesson.
Review other aspects of theexercise.
(a) Explore the role of the variousbranches of government in the exer-cise. Make a list of words that arerelated. For example, the words “leg-islative branch,” “Ohio GeneralAssembly,” “legislation,” “Ohio Houseof Representatives,” and “OhioSenate” are related because they allrepresent the legislative branch ofgovernment. Words such as “court”and “judge” refer to the judicialbranch of government. Words such as
“state agency” and “governor” refer tothe executive branch of government.
(b) Explore facts and opinions andhow they may help or hinder a deci-sion-making process.
(c) Discuss the roles of state and localgovernments.
(d) Discuss how citizens and local andstate governments must cooperate tosolve solid waste problems andexplore alternatives.
Review aspects of the exercisethat are examples of democracy inaction.
AssessmentReview student summaries at
the end of their journals about how alaw is passed.
Give students the handout test,Decisions, Decisions, to complete.
ANSWERS: 1. b, 2. d, 3. a, 4. b, 5. b,6. c
The last two questions require arubric grading scheme.
ExtensionHave students identify a solid waste orlitter problem in their community.Have them write to a local officialand/or state representative to sharethe problem and possibly offer somesuggestions for solving the problem.
2
1
10
9
8

Windows on Waste - JOURNEY OF A GARBAGE BILL XIV Help Contents Back
▼
▼
326©Ohio Department of Natural Resources Help Contents Back
▼
▼
326
Student Handout ✐
PART A: (A county in Ohio, 1987) . . . . . . . . . . . . . . . . . . . . . . . . . . . . . . . . . . . . . . . . . . . . . . . . . . . . . . . . . . . . . . . . . . . . . . . . . . . . . . . . . . . . . . . . . . . . . . . . . . . . . .
My name is Mr./Ms._________________. I am a concerned citizen. I have lived in Ohio all my life. Ibelong to a public interest group called Save the Land. We have 800 members in Ohio and we think there is agarbage problem. People in New Jersey, New York and other states in the East are dumping a lot of their trash inlandfills in my county. Did you know that many of the landfills in Ohio are closing because they are too full? It’snot easy finding places to build new landfills. We need the government to do something. We should not allowout-of-state waste in Ohio, if we are running out of space to bury our own trash.
. . . . . . . . . . . . . . . . . . . . . . . . . . . . . . . . . . . . . . . . . . . . . . . . . . . . . . . . . . . . . . . . . . . . . . . . . . . . . . . . . . . . . . . . . . . . . . . . . . . . . .
My name is Mr./Ms. ________________. I am part of local government. I am a county commissioner,elected by the people of my county to the county government. Our old landfill will be full in one year. Manypeople in my county are worried about where we will build the next landfill when our old one fills up. Our land-fill is filling up faster because it accepts garbage from other counties in Ohio and from other states.
. . . . . . . . . . . . . . . . . . . . . . . . . . . . . . . . . . . . . . . . . . . . . . . . . . . . . . . . . . . . . . . . . . . . . . . . . . . . . . . . . . . . . . . . . . . . . . . . . . . . . .
My name is Mr./Ms. _______________. I am a state government representative in the Ohio House ofRepresentatives in the General Assembly in Columbus. There are 99 of us in the House, representing districtsthat include all of the people of Ohio. In my district, many people are concerned about the garbage problem.Because the people in my district voted me into office to represent their interests, I will propose a bill to dealwith the solid waste problem. This bill will be called House Bill 592, or just H.B. 592. This bill has to be accept-ed by the General Assembly in order to become a law. This is because the General Assembly is the legislativebranch of government in Ohio.
. . . . . . . . . . . . . . . . . . . . . . . . . . . . . . . . . . . . . . . . . . . . . . . . . . . . . . . . . . . . . . . . . . . . . . . . . . . . . . . . . . . . . . . . . . . . . . . . . . . . . .
PART B: House Bill 592 “as proposed”Directions: Have students work in groups to write proposals on the handout, A Bill. Check the space marked “as pro-posed.” Discuss these group proposals and write a single classroom bill to be given to the first speaker (#4) in Part B.
3
2
1
The Story of a Bill: Classroom Roles

Windows on Waste - JOURNEY OF A GARBAGE BILL XIV Help Contents Back
▼
▼
327©Ohio Department of Natural Resources Help Contents Back
▼
▼
327
PART B: (The Ohio House of Representatives in Columbus)
. . . . . . . . . . . . . . . . . . . . . . . . . . . . . . . . . . . . . . . . . . . . . . . . . . . . . . . . . . . . . . . . . . . . . . . . . . . . . . . . . . . . . . . . . . . . . . . . . . . . . .
My name is Mr./Ms. _________________. I am a state representative in the Ohio House of Representativesand the chairman of a standing committee in the House, called the House Energy and EnvironmentCommittee. There are many standing committees in the House, each one deals with a different subject, such aseducation or the environment. The House Energy and Environment Committee considers problems and issuesabout our environment in Ohio. Since garbage is an environmental problem, the House Energy andEnvironment Committee will examine and discuss House Bill 592. Then we’ll hold public hearings. Peoplefrom all over the state will have a chance to tell us what they think about the new bill. First I will read whatHouse Bill 592 says. (Read classroom H.B. 592 as proposed in Part A.) Now let us hear what other people have tosay about this bill.
. . . . . . . . . . . . . . . . . . . . . . . . . . . . . . . . . . . . . . . . . . . . . . . . . . . . . . . . . . . . . . . . . . . . . . . . . . . . . . . . . . . . . . . . . . . . . . . . . . . . . .
My name is Mr./Ms. ___________________. I own and operate a landfill and I make money when peopleand trash haulers bring garbage to me. This is because I charge them a tipping fee to dump their garbage in mylandfill. Right now, I charge $26 a ton. If trash haulers cannot bring me a lot of garbage, including trash fromout-of-state, I will lose money. So, I do not think we should restrict the flow of waste. I should be able to acceptgarbage from anyone and from anywhere.
. . . . . . . . . . . . . . . . . . . . . . . . . . . . . . . . . . . . . . . . . . . . . . . . . . . . . . . . . . . . . . . . . . . . . . . . . . . . . . . . . . . . . . . . . . . . . . . . . . . . . .
My name is Mr./Ms. ___________________. I am a waste hauler and a business person. I collect garbagefrom many different places including Pennsylvania and New Jersey. I feel I should be able to take garbage to thelandfill that is the cheapest for me. If a landfill operator charges me $50 a ton in Pennsylvania to dump mygarbage and one in Ohio charges only $25 a ton, then I would rather go to the landfill in Ohio. By the way, didyou know that garbage from some Ohio communities is taken to landfills in Kentucky and Michigan?
. . . . . . . . . . . . . . . . . . . . . . . . . . . . . . . . . . . . . . . . . . . . . . . . . . . . . . . . . . . . . . . . . . . . . . . . . . . . . . . . . . . . . . . . . . . . . . . . . . . . . .
My name is Dr. _________________. I am a doctor and a member of a public interest group called OurHealth First. We are concerned about having enough landfill space, but we think health and safety issues areimportant too. Many of Ohio’s old landfills were shut down by local governments because of the pollution theycreated. Over the years, all types of garbage have been dumped in local landfills; some of it is hazardous waste,such as batteries, motor oil and chemicals from factories and businesses. Did you know that chemicals fromburied trash can seep into the ground water or into rivers and lakes? Those are all sources of drinking water.Also, some local landfills have caught on fire from methane gas that builds up inside them. It is very importantthat public health is protected by this bill!
. . . . . . . . . . . . . . . . . . . . . . . . . . . . . . . . . . . . . . . . . . . . . . . . . . . . . . . . . . . . . . . . . . . . . . . . . . . . . . . . . . . . . . . . . . . . . . . . . . . . . .
My name is Mr./Ms. ___________________. I am a civil engineer. You should know that we can buildlandfills so they are safe. Today’s new landfills are designed to prevent fires and to prevent pollution. We do thisby making landfills with liner systems that keep liquids from leaking into ground water. We engineers can alsobuild vents to release or capture methane gas so it does not collect and become dangerous.
8
7
6
5
4
The Story of a Bill: Classroom Roles, continued
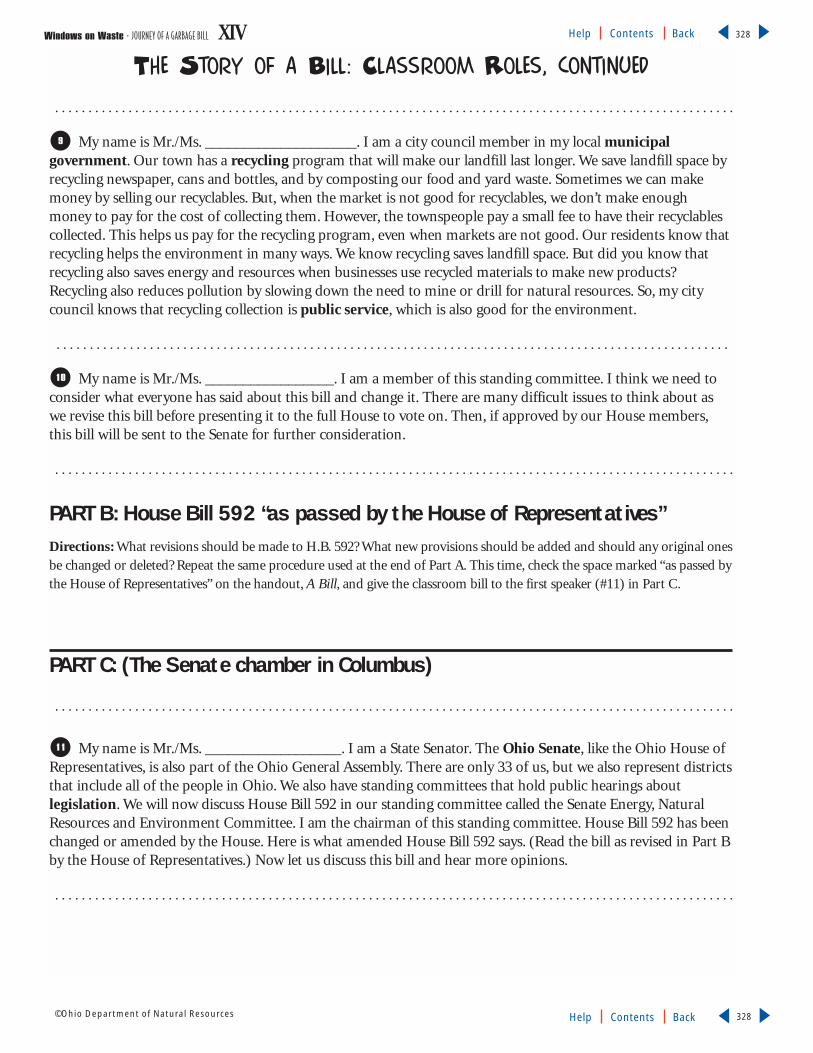
Windows on Waste - JOURNEY OF A GARBAGE BILL XIV Help Contents Back
▼
▼
328©Ohio Department of Natural Resources Help Contents Back
▼
▼
328
. . . . . . . . . . . . . . . . . . . . . . . . . . . . . . . . . . . . . . . . . . . . . . . . . . . . . . . . . . . . . . . . . . . . . . . . . . . . . . . . . . . . . . . . . . . . . . . . . . . . . .
My name is Mr./Ms. ____________________. I am a city council member in my local municipal government. Our town has a recycling program that will make our landfill last longer. We save landfill space byrecycling newspaper, cans and bottles, and by composting our food and yard waste. Sometimes we can makemoney by selling our recyclables. But, when the market is not good for recyclables, we don’t make enoughmoney to pay for the cost of collecting them. However, the townspeople pay a small fee to have their recyclablescollected. This helps us pay for the recycling program, even when markets are not good. Our residents know thatrecycling helps the environment in many ways. We know recycling saves landfill space. But did you know thatrecycling also saves energy and resources when businesses use recycled materials to make new products?Recycling also reduces pollution by slowing down the need to mine or drill for natural resources. So, my citycouncil knows that recycling collection is public service, which is also good for the environment.
. . . . . . . . . . . . . . . . . . . . . . . . . . . . . . . . . . . . . . . . . . . . . . . . . . . . . . . . . . . . . . . . . . . . . . . . . . . . . . . . . . . . . . . . . . . . . . . . . . . . .
My name is Mr./Ms. _________________. I am a member of this standing committee. I think we need toconsider what everyone has said about this bill and change it. There are many difficult issues to think about aswe revise this bill before presenting it to the full House to vote on. Then, if approved by our House members,this bill will be sent to the Senate for further consideration.
. . . . . . . . . . . . . . . . . . . . . . . . . . . . . . . . . . . . . . . . . . . . . . . . . . . . . . . . . . . . . . . . . . . . . . . . . . . . . . . . . . . . . . . . . . . . . . . . . . . . . .
PART B: House Bill 592 “as passed by the House of Representatives” Directions: What revisions should be made to H.B. 592? What new provisions should be added and should any original onesbe changed or deleted? Repeat the same procedure used at the end of Part A. This time, check the space marked “as passed bythe House of Representatives” on the handout, A Bill, and give the classroom bill to the first speaker (#11) in Part C.
PART C: (The Senate chamber in Columbus)
. . . . . . . . . . . . . . . . . . . . . . . . . . . . . . . . . . . . . . . . . . . . . . . . . . . . . . . . . . . . . . . . . . . . . . . . . . . . . . . . . . . . . . . . . . . . . . . . . . . . . .
My name is Mr./Ms. __________________. I am a State Senator. The Ohio Senate, like the Ohio House ofRepresentatives, is also part of the Ohio General Assembly. There are only 33 of us, but we also represent districtsthat include all of the people in Ohio. We also have standing committees that hold public hearings about legislation. We will now discuss House Bill 592 in our standing committee called the Senate Energy, NaturalResources and Environment Committee. I am the chairman of this standing committee. House Bill 592 has beenchanged or amended by the House. Here is what amended House Bill 592 says. (Read the bill as revised in Part Bby the House of Representatives.) Now let us discuss this bill and hear more opinions.
. . . . . . . . . . . . . . . . . . . . . . . . . . . . . . . . . . . . . . . . . . . . . . . . . . . . . . . . . . . . . . . . . . . . . . . . . . . . . . . . . . . . . . . . . . . . . . . . . . . . . .
11
10
9
The Story of a Bill: Classroom Roles, continued

Windows on Waste - JOURNEY OF A GARBAGE BILL XIV Help Contents Back
▼
▼
329©Ohio Department of Natural Resources Help Contents Back
▼
▼
329
My name is Mr./Ms. _________________. I am a proud member of this state legislature, but I want youto know that I am also concerned about local governments. This piece of legislation may have so many rules andregulations that local governments will lose control over how to manage their own solid waste. I hope local gov-ernments will be free to decide what they want to do with their garbage. I hope the state government is not goingto tell local governments what they must do. Every local government situation is different. Some have good recy-cling programs while others don’t have any at all. Some communities have landfills that pollute and others havebuilt new landfills that don’t pollute. We should not tell local governments with good programs what to do.
. . . . . . . . . . . . . . . . . . . . . . . . . . . . . . . . . . . . . . . . . . . . . . . . . . . . . . . . . . . . . . . . . . . . . . . . . . . . . . . . . . . . . . . . . . . . . . . . . . . . .
My name is Mr./Ms. _________________. I am a member of the Ohio Chamber of Commerce, which rep-resents businesses in Ohio. We do not want government making a lot of rules that will hurt businesses, such astrash haulers and landfill operators. Some counties in Ohio want to build large recycling facilities and require thetrash haulers to bring all the garbage they collect to the recycling facility. This will help the county pay for therecycling facility because they will charge the trash haulers a tipping fee to dump their garbage at the recyclingfacility, just like at a landfill. But what if the trash haulers can pay less to dump their waste at a landfill in anothercounty? This means they will have to pay more to dump their garbage at the recycling facility. This is not fair. Asa business, they need to haul the garbage they collect and dump it where it is the least expensive, so they canmake a profit.
. . . . . . . . . . . . . . . . . . . . . . . . . . . . . . . . . . . . . . . . . . . . . . . . . . . . . . . . . . . . . . . . . . . . . . . . . . . . . . . . . . . . . . . . . . . . . . . . . . . . . .
My name is Mr./Ms. ________________. I am a concerned citizen. I want you to know that we make toomuch waste. We need to recycle and reuse more, before throwing our waste away. What is the most importantissue here? Should we just look at the cheapest way of getting rid of our garbage? I don’t think so. We shouldconsider doing something that is good for the environment, even if it means paying more. A lot of people sup-port recycling because it is good for the environment. In fact, I have a survey that says 80 percent of all Ohioanssay they are concerned about the environment and would pay more to protect the environment.
. . . . . . . . . . . . . . . . . . . . . . . . . . . . . . . . . . . . . . . . . . . . . . . . . . . . . . . . . . . . . . . . . . . . . . . . . . . . . . . . . . . . . . . . . . . . . . . . . . . . . .
My name is Mr./Ms. ________________. I am a township trustee in my local township government. Ithink many of us in local governments across Ohio are worried that if the State regulates how to build landfillsand requires recycling and other programs, there won’t be enough money to run the new programs. No one hastalked about raising state taxes to pay for the proposals in this legislation. People may say they will pay more toprotect the environment, but no one wants to pay more taxes.
. . . . . . . . . . . . . . . . . . . . . . . . . . . . . . . . . . . . . . . . . . . . . . . . . . . . . . . . . . . . . . . . . . . . . . . . . . . . . . . . . . . . . . . . . . . . . . . . . . . . . .
My name is Mr./Ms. ________________. I am a senator who is concerned that our bill may include provisions that conflict with laws already in place, especially laws related to the United States constitution. Ithink we need to hear from someone in the judicial branch of state government to give us some advice.
. . . . . . . . . . . . . . . . . . . . . . . . . . . . . . . . . . . . . . . . . . . . . . . . . . . . . . . . . . . . . . . . . . . . . . . . . . . . . . . . . . . . . . . . . . . . . . . . . . . . . .
16
15
14
13
12
The Story of a Bill: Classroom Roles, continued

Windows on Waste - JOURNEY OF A GARBAGE BILL XIV Help Contents Back
▼
▼
330©Ohio Department of Natural Resources Help Contents Back
▼
▼
330
My name is Mr./Ms. ________________. I am a judge in a state court. We often interpret laws when peo-ple or groups disagree with a law. I think if you make a law restricting out-of-state waste, you may be in conflictwith the United States constitution. The constitution says that no state shall prohibit commerce between states.Waste hauling is a form of commerce because people are buying and selling a service to get rid of trash. Thissame rule may apply to the other issue raised by the Chamber of Commerce person. Some county governmentsmay want to make all of the trash haulers within the county dump their waste at a recycling center or landfill inthe county to make enough money to operate the facility. If a trash hauler cannot choose where to take his/hertrash, that may also be a form of restricting commerce. This issue may have to be settled at local county courts,state courts or even federal courts, depending upon the dispute.
. . . . . . . . . . . . . . . . . . . . . . . . . . . . . . . . . . . . . . . . . . . . . . . . . . . . . . . . . . . . . . . . . . . . . . . . . . . . . . . . . . . . . . . . . . . . . . . . . . . . . .
My name is Mr./Ms. ___________________. I work for the Ohio Environmental Protection Agency, alsocalled the Ohio EPA. As part of the executive branch of the state government, our public agency is responsiblefor carrying out laws that protect the environment. We also collect information about the environment. Manycounties in Ohio will run out of landfill space in the future. It is also true that some older landfills in Ohio aregenerating pollution. Many of the proposals in this bill will be sent to us to carry out and enforce. We await yourdecisions.
. . . . . . . . . . . . . . . . . . . . . . . . . . . . . . . . . . . . . . . . . . . . . . . . . . . . . . . . . . . . . . . . . . . . . . . . . . . . . . . . . . . . . . . . . . . . . . . . . . . . . .
My name is Mr./Ms. _________________. As a member of this Senate committee, I think we need to con-sider what everyone has said about this bill and revise it again. There are many difficult issues to think aboutbefore we present it to the full Senate to vote on. Then, if passed by the Senate, this bill will be sent to the gover-nor for approval.
. . . . . . . . . . . . . . . . . . . . . . . . . . . . . . . . . . . . . . . . . . . . . . . . . . . . . . . . . . . . . . . . . . . . . . . . . . . . . . . . . . . . . . . . . . . . . . . . . . . . . .
PART C: House Bill 592 “as passed by the Senate”Directions: How should H.B. 592 be revised? Repeat the same procedure used at the end of Part A. This time, check the spacemarked “as passed by the Senate” on the handout, A Bill, and give the classroom bill to the next speaker (#20) in Part D.
PART D: (The governor’s office)
. . . . . . . . . . . . . . . . . . . . . . . . . . . . . . . . . . . . . . . . . . . . . . . . . . . . . . . . . . . . . . . . . . . . . . . . . . . . . . . . . . . . . . . . . . . . . . . . . . . . . .
My name is Mr./Ms. __________________. I am the governor of Ohio and the leader of the executivebranch of state government. The General Assembly has given me House Bill 592 to review. Here is what it says.(Read the bill as revised in Part C by the Senate.) If I do not like this bill, I do not have to sign it and it can stillbecome law. If I really do not like the bill, I can veto it. If I veto it, it must go back to the General Assembly. Ifthey pass the bill a second time, it will become a law, even if I do not agree with it. However, I like this bill and soI will sign it into law. (Sign the page at the bottom.) House Bill 592 is now a law. It represents democracy inaction because many voices were heard and compromises were made. This law, even if it’s not perfect, can helpus deal with our garbage problems. Citizens and local and state governments will still have to cooperate to makethis law work. And as we all know, the law can be changed in the future, if the people want it to be changed.
20
19
18
17
The Story of a Bill: Classroom Roles, continued

Windows on Waste - JOURNEY OF A GARBAGE BILL XIV Help Contents Back
▼
▼
331©Ohio Department of Natural Resources Help Contents Back
▼
▼
331
bill – a proposal to make a law; a bill becomes a state law
in Ohio when it is accepted (passed) by both chambers
(House of Representatives and Senate) of the Ohio
General Assembly
citizen – a person in a community who can affect what
government does by voting and civic action
commerce – the buying and selling of goods and services
constitution – a plan or framework for government that
establishes branches of government (legislative, executive,
judicial), their duties and the fundamental laws and
principles of government
county government – a local form of government that is
run by the board of county commissioners; it makes ordi-
nances and provides public services to comply with state
and federal regulations, laws and mandates; each Ohioan
lives in one of the state’s 88 counties
democracy – a form of government that provides a way
for citizens to vote and take civic actions that determine
what local, state and national governments do; citizens are
the source of all authority
executive branch – one of three branches of government;
in Ohio it includes the governor and agencies that admin-
ister and enforce state and federal laws
General Assembly – a body of legislators; in Ohio this
body, also called the state legislature, includes members of
the House of Representatives and the Senate
government – a group of people and agencies that make
laws, resolve conflicts and provide services that people
want and need
governor – the most important person in the executive
branch of state government; responsible for administering
and enforcing the laws of the state
health and safety – provided by governments in the form
of laws, ordinances and public services that make life safer
for people (e.g., food inspection, pollution laws, fire and
police protection)
House Bill 592 (H.B. 592) – an Ohio law that provides
rules and regulations for managing garbage or solid waste
in the state
judge – an elected or appointed official who makes deci-
sions in courts of law
judicial branch – one of three branches of government;
responsible for resolving conflicts between people and
groups and for interpreting the law
court – a place where conflicts between people and groups
can be resolved with the aid of a judge or judges
landfill – a place where garbage and trash are buried and
covered with soil; may include pollution control
technology
law – a bill that was passed by a majority vote by members
in both houses or chambers of the Ohio General
Assembly, and may or may not be signed by the governor;
it contains rules about human activity that may be
enforced by authority or expected to be generally observed
in the interest of order
legislation – laws or the process of making laws
legislative branch – one of three branches of government
that is in charge of making laws; in Ohio it is called the
General Assembly
local government – makes rules and ordinances, provides
systems of justice, and makes provisions for various public
services through county, municipal and township forms of
government
municipal government – a local form of government for
cities and villages run by a mayor and city or village coun-
cil members to provide public services for people and to
make local ordinances
Ohio Environmental Protection Agency (Ohio EPA) – astate agency that is part of the executive branch of govern-
ment that administers and enforces laws designed to pro-
tect the environment
Ohio House of Representatives – one of two groups or
chambers that make up the Ohio Legislature or Ohio
General Assembly; its 99 members propose and make laws
Ohio Senate – one of two groups or chambers that make
up the Ohio Legislature or Ohio General Assembly; its 33
members propose and make laws
Words of Citizenship
continued next page

Windows on Waste - JOURNEY OF A GARBAGE BILL XIV Help Contents Back
▼
▼
332©Ohio Department of Natural Resources Help Contents Back
▼
▼
332
out-of-state waste – solid waste that is transported from
one state to another for disposal
public agency – a group of people who work to help
governments enforce laws, provide services and resolve
conflicts
public hearing – an event sponsored by the legislature or
public agency to hear what people have to say about a
particular issue
public interest group – a group of citizens who are con-
cerned about a problem and try to persuade lawmakers
and others to take action to solve the problem
public service – something that is done by local and state
governments that provides a service people want or need,
often through the collection of taxes (e.g., police and fire
protection, libraries, courts of law, food stamps)
recycling – a method of reducing the amount of solid
waste that must be disposed of and a process for collecting
and sorting waste materials so they may be reused in
manufacturing processes
solid waste – garbage and trash from residences, business-
es and institutions (schools, hospitals, etc.)
standing committee – a group of state legislators who are
assigned to consider a specific public concern such as agri-
culture, education, transportation, the environment; they
hold public hearings on bills, debate them and revise
them; each chamber, the House of Representatives and the
Senate, has its own separate committees
state government – composed of three parts or branches:
legislative, executive and judicial
state legislature – made up of a group of people called
legislators who make laws based on the wants and needs of
people; in Ohio it is composed of two houses or chambers,
the House of Representatives and the Senate
township government – a form of local government not
incorporated as municipalities that represent subdivisions
of counties; it is run by a board of trustees who provide
public services for people
Words of Citizenship, continued

Windows on Waste - JOURNEY OF A GARBAGE BILL XIV Help Contents Back
▼
▼
333©Ohio Department of Natural Resources Help Contents Back
▼
▼
333
Student Handout ✐
A Bill 117th General AssemblyRegular Session1987-1988
House Bill 592
_____ as proposed
_____ as passed by the House of Representatives
_____ as passed by the Senate
_____________________________________________________________________________________
LIST OF PROPOSALS:

Windows on Waste - JOURNEY OF A GARBAGE BILL XIV Help Contents Back
▼
▼
334©Ohio Department of Natural Resources Help Contents Back
▼
▼
334
Student Handout ✐
Directions: For numbers 1 – 6, place the letter of the correct answer in the space provided.
_____ If a law is made that requires every community in Ohio to recycle 35 percent of their waste, whowould make this law?
a. the local government
b. the state legislative branch of government
c. the state executive branch of government
d. the state judicial branch of government
_____ A local community has decided to start a recycling program. As part of this program, each familyis asked to separate recyclable materials from the rest of the garbage and place them in a sepa-rate container. The family puts the container at the curb for pick up once a week by the local gov-ernment collection service. This is an example of:
a. families taking care of their waste by themselves
b. community cooperation with local government to make streets cleaner and dump more trash in the local landfill
c. state government making a law to reduce waste disposal and save resources
d. community cooperation with local government to reduce waste disposal and save resources
_____ Why does the Ohio government make laws about how landfills must be constructed and maintained?
a. to protect the health and safety of citizens
b. to protect people’s right to live where they want
c. to provide a public service for the collection of garbage
d. to make money selling landfill designs
_____ Which of the following statements is an opinion?
a. Many communities have recycling programs in Ohio.
b. There should be more recycling programs in Ohio.
c. Forty percent of all landfills will close in five years.
d. Cincinnati has a large landfill.
4
3
2
1
Decisions, Decisions

Windows on Waste - JOURNEY OF A GARBAGE BILL XIV Help Contents Back
▼
▼
335©Ohio Department of Natural Resources Help Contents Back
▼
▼
335
_____ When the Ohio General Assembly passed House Bill 592, this was an example of:
a. citizens voting on a law that protects them
b. citizens making a law by voting for representatives in the legislature
c. citizens making a law by voting for judges in state government
d. local government in action
_____ Deciding what to do with garbage is more complex than people think. Some local community groupsbelieve they should have the right to forbid waste haulers from bringing out-of-state trash intotheir community landfill. That way, the landfill will not fill up so fast. On the other hand, some land-fill operators want to make waste haulers use their landfill so they can make enough money to payfor operating the landfill. Of course, this will fill it up faster. Waster haulers believe they should beable to dump their garbage where it is cheapest whether it is in their own state or another.
Which of the following statements supports the main idea of this paragraph?
a. Solid waste issues can be difficult to resolve because there are too many laws telling waste haulers what they have to do.
b. State government can resolve solid waste issues by making laws.
c. Solid waste issues can be difficult to resolve because of the conflicting interests of local government control and economic and business affairs.
Short Answer
One purpose of local government is to provide solid waste management. Name two places or activi-ties provided by local government to make sure that garbage and trash are taken care of.
(1) ________________________________________________________________________________
__________________________________________________________________________________
(2) ________________________________________________________________________________
__________________________________________________________________________________
There are a lot of people in the community who believe that recycling is important. However, thelocal township trustees have not paid attention to the people’s requests to start a local recyclingprogram. The supporters of recycling hold a meeting to discuss what they should do to get a recy-cling program started in their community. Here are some suggestions:
• march outside the township trustees offices
• write letters in support of recycling
• work to elect one of their own supporters to the township board of trustees
Which of these suggestions do you think is the best one to get the results the recycling supporters want? Choose one and explain. (Answer on a separate sheet of paper.)
8
7
6
5
Decisions, Decisions, continued