Embed Size (px)
Citation preview

Technical Report NREL/TP-500-46191 February 2010
Wind Turbine Generator System Power Performance Test Report for the ARE442 Wind Turbine Jeroen van Dam and Dave Jager
National Renewable Energy Laboratory 1617 Cole Boulevard, Golden, Colorado 80401-3393 303-275-3000 • www.nrel.gov
NREL is a national laboratory of the U.S. Department of Energy Office of Energy Efficiency and Renewable Energy Operated by the Alliance for Sustainable Energy, LLC
Contract No. DE-AC36-08-GO28308
Technical Report NREL/TP-500-46191 February 2010
Wind Turbine Generator System Power Performance Test Report for the ARE442 Wind Turbine Jeroen van Dam and Dave Jager
Prepared under Task No. WE102211

NOTICE
This report was prepared as an account of work sponsored by an agency of the United States government. Neither the United States government nor any agency thereof, nor any of their employees, makes any warranty, express or implied, or assumes any legal liability or responsibility for the accuracy, completeness, or usefulness of any information, apparatus, product, or process disclosed, or represents that its use would not infringe privately owned rights. Reference herein to any specific commercial product, process, or service by trade name, trademark, manufacturer, or otherwise does not necessarily constitute or imply its endorsement, recommendation, or favoring by the United States government or any agency thereof. The views and opinions of authors expressed herein do not necessarily state or reflect those of the United States government or any agency thereof.
Available electronically at http://www.osti.gov/bridge
Available for a processing fee to U.S. Department of Energy and its contractors, in paper, from:
U.S. Department of Energy Office of Scientific and Technical Information P.O. Box 62 Oak Ridge, TN 37831-0062 phone: 865.576.8401 fax: 865.576.5728 email: mailto:[email protected]
Available for sale to the public, in paper, from: U.S. Department of Commerce National Technical Information Service 5285 Port Royal Road Springfield, VA 22161 phone: 800.553.6847 fax: 703.605.6900 email: [email protected] online ordering: http://www.ntis.gov/ordering.htm
Printed on paper containing at least 50% wastepaper, including 20% postconsumer waste

iii
Notice This report was prepared by the National Renewable Energy Laboratory (NREL), operated for the United States Department of Energy (DOE) by the Alliance for Sustainable Energy, LLC (Alliance), as an account of work sponsored by the United States government. The test results documented in this report define the characteristics of the test article as configured and under the conditions tested.
THIS REPORT IS PROVIDED "AS IS" AND NEITHER THE GOVERNMENT, ALLIANCE, NREL NOR ANY OF THEIR EMPLOYEES, MAKES ANY WARRANTY, EXPRESS OR IMPLIED, INCLUDING THE WARRANTIES OF MERCHANTABILITY AND FITNESS FOR A PARTICULAR PURPOSE, OR ASSUMES ANY LEGAL LIABILITY OR RESPONSIBILITY FOR THE ACCURACY, COMPLETENESS, OR USEFULNESS OF ANY SUCH INFORMATION DISCLOSED IN THE REPORT, OR OF ANY APPARATUS, PRODUCT, OR PROCESS DISCLOSED, OR REPRESENTS THAT ITS USE WOULD NOT INFRINGE PRIVATELY OWNED RIGHTS.
Neither Alliance nor the U. S. Government shall be liable for special, consequential or incidental damages. Reference herein to any specific commercial product, process, or service by trade name, trademark, manufacturer, or otherwise does not necessarily constitute or imply its endorsement, recommendation, or favoring by the United States government or any agency thereof. The views and opinions of the authors expressed herein do not necessarily state or reflect those of the United States government or any agency thereof or Alliance.
NREL is a DOE Laboratory, and as an adjunct of the United States government, cannot certify wind turbines. The information in this report is limited to NREL’s knowledge and understanding as of this date.
NREL is accredited by the American Association for Laboratory Accreditation (A2LA) and the results shown in this test report have been determined in accordance with the NREL’s terms of accreditation unless stated otherwise in the report.
This report shall not be reproduced, except in full, without the written approval of Alliance or successor operator of NREL.
Approval By: __________________________________________________________ Jeroen van Dam, NREL Test Engineer Date
Review By: ___________________________________________________________ Amy Bowen, NREL Test Engineer Date
iv
Contents
Contents ..................................................................................................................................... iv
Table of Tables ............................................................................................................................ v
Table of Figures ......................................................................................................................... vi
1. Background .......................................................................................................................... 1
2. Test Summary ...................................................................................................................... 1
3. Test Turbine Configuration ................................................................................................. 3
4. Test Site Description ........................................................................................................... 6
5. Description of Test Equipment ........................................................................................... 8
6. Description of Test Procedure ......................................................................................... 10
7. Test Results ....................................................................................................................... 11
7.1. Tabular Results of Power Performance Test ................................................................. 11
7.2. Graphical Results ........................................................................................................... 15
8. Deviations and Exceptions ............................................................................................... 22
8.1. Deviations from the Standard ........................................................................................ 22
8.2. Exceptions to NWTC-CT Quality Assurance System .................................................... 22
Appendix A. Pictures of the Test Site ..................................................................................... 23
Appendix B. Equipment Calibration Sheets .......................................................................... 29

v
Table of Tables
Table 1. Test turbine configuration ............................................................................................... 3
Table 2. Structures close to test turbine ...................................................................................... 7
Table 3. Criteria for test site without site calibration .................................................................... 7
Table 4. Equipment used in the power performance test ............................................................ 8
Table 5. Uncertainty values used in the analysis ....................................................................... 10
Table 6. Performance at sea-level air density; 1.225 kg/m3 ....................................................... 12
Table 7. Performance at site average density; 1.05 kg/m3 ........................................................ 13
Table 8. Annual energy production (AEP) at sea-level density; 1.225 kg/m3 ............................. 14
Table 9. Annual energy production at site average density; 1.05 kg/m3 .................................... 14

vi
Table of Figures
Figure 1. Power curve summary .................................................................................................. 2
Figure 2. Electrical diagram of the ARE 442 installation .............................................................. 4
Figure 3. ARE 442 test turbine at the NWTC ............................................................................... 5
Figure 4. Map of the test site ....................................................................................................... 6
Figure 5. Meteorological tower and instruments .......................................................................... 9
Figure 6. Power curve at sea-level density; 1.225 kg/m3 ........................................................... 15
Figure 7. Power curve at site average density; 1.05 kg/m3 ........................................................ 16
Figure 8. Scatter plot of mean, standard deviation, minimum, and maximum power data. 1 Hz samples with 1 minute averaging. ........................................................................................ 17
Figure 9. Coefficient of performance at sea level density; 1.225 kg/m3 ..................................... 18
Figure 10. Wind turbulence intensity as a function of wind speed ............................................. 19
Figure 11. Wind speed and turbulence intensity as a function of wind direction........................ 20
Figure 12. Rotor speed as a function of wind speed (1-minute averages) and binned values .. 21

1
1. Background This test is being conducted as part of the U.S. Department of Energy’s (DOE) Independent Testing project. This project was established to help reduce the barriers of wind energy expansion by providing independent testing results for small turbines. In total, four turbines are being tested at the National Wind Technology Center (NWTC) as a part of this project. Power performance testing is one of up to 5 tests that may be performed on the turbines, including duration, safety and function, noise, and power quality tests.
2. Test Summary Figure 1 is a summary of the results of a power performance test that NREL conducted on the ARE 442 wind turbine. For this test, the ARE 442 turbine was installed at the NWTC, close to Boulder, Colorado. This test was conducted in accordance with the International Electrotechnical Commission’s (IEC) standard, Wind Turbine Generator Systems Part 12: Power Performance Measurements of Electricity Producing Wind Turbines, IEC 61400-12-1 Ed.1.0, 2005-12. However, because the ARE 442 is a small turbine as defined by IEC, NREL also followed Annex H that applies to small wind turbines. This test report refers to these procedures as the Standard.
In these summary results, wind speed is normalized to sea-level air density. Additional results are given in Section 7. This test was begun on December 9, 2008 and was ended on December 28, 2008. 303.7 hours of valid data were collected during that time. The highest bin filled was the 18.0 m/s bin. The amount of test data is sufficient to meet the requirements of the Standard, Annex H.

2
Figure 1. Power curve summary
Power Performance Test Bin Wind Bin Number
ARE442 Speed Power Data Cp(m/s) (kW) Points
Sea-Level Density Power Curve 0.51 -0.03 1,000 -9.00
1.00 -0.04 1,210 -1.61Report Created: 31-Dec-08 1.50 -0.04 1,339 -0.53
1.99 -0.05 1,423 -0.27Turbine Specifications: 2.50 -0.05 1,196 -0.13
2.98 -0.01 1,061 -0.02Serial number: Y08-001C 3.49 0.08 861 0.08Rated Power: 10000 W 4.00 0.30 713 0.19Cut-in Wind Speed: 2.2 m/s 4.49 0.59 647 0.26Cut-out Wind Speed: - m/s 5.00 0.91 579 0.29Rated Wind Speed: 12 m/s 5.51 1.35 604 0.32Rotor Diameter: 7.2 m 6.00 1.86 586 0.35
6.50 2.42 624 0.35Control Type: Active 7.00 3.04 647 0.35Pitch Setting: Fixed 7.49 3.70 599 0.35
8.00 4.41 535 0.358.49 5.19 544 0.34
Site Conditions: 9.00 6.02 478 0.339.50 6.81 416 0.32
Location: NWTC Boulder, CO 10.00 7.70 404 0.31Average Air Density: 1.035 kg/m^3 10.49 8.47 384 0.29Measurement Sectors: 214-74 °T 10.99 9.17 362 0.28
11.50 9.69 340 0.2612.01 10.10 289 0.23
Test Statistics: 12.49 10.05 245 0.2112.97 9.91 243 0.18
Start Date: 13.50 9.42 186 0.15End Date: 14.00 9.00 162 0.13Amount of Data Collected: 303.70 hours 14.48 8.58 138 0.11Highest Bin Filled: 18.0 m/s 15.00 8.28 124 0.10Test Completed? Yes 15.54 7.86 74 0.08
15.99 7.85 78 0.0816.49 7.59 47 0.0716.95 7.33 33 0.0617.51 7.48 27 0.0618.01 7.57 24 0.05
9-Dec-200828-Dec-2008
Sea-Level Air Density Normalized Power Curve ARE 442
-2
0
2
4
6
8
10
12
0 2 4 6 8 10 12 14 16 18 20
Normalized Wind Speed, m/s
Ele
ctric
Pow
er, k
W
0.00
0.05
0.10
0.15
0.20
0.25
0.30
0.35
0.40
Cp
PowerCp

3
3. Test Turbine Configuration
Table 1. Test turbine configuration
Turbine make, model, serial number, production year
Abundant Renewable Energy, ARE 442, Y08-001C, 2008
Rotor diameter (m) 7.2 Hub height (m) 30.9 Tower type Free standing lattice, Valmont U4.5 x 100’ Rated electrical power (kW) 10 Rated wind speed (m/s) 12 Rotor speed range (rpm) 0-140 Fixed or variable pitch Fixed Number of blades 3 Blade-tip pitch angle (deg) 0°, blade root flat on alternator Blade make, type, serial number Aero Energy 089-028, 089-029, 089-030 Description of control system (device & software version)
Side furling with gravity return; VCL442-HV Voltage Clamp pulse-width modulated resistor-loading; Windy boy
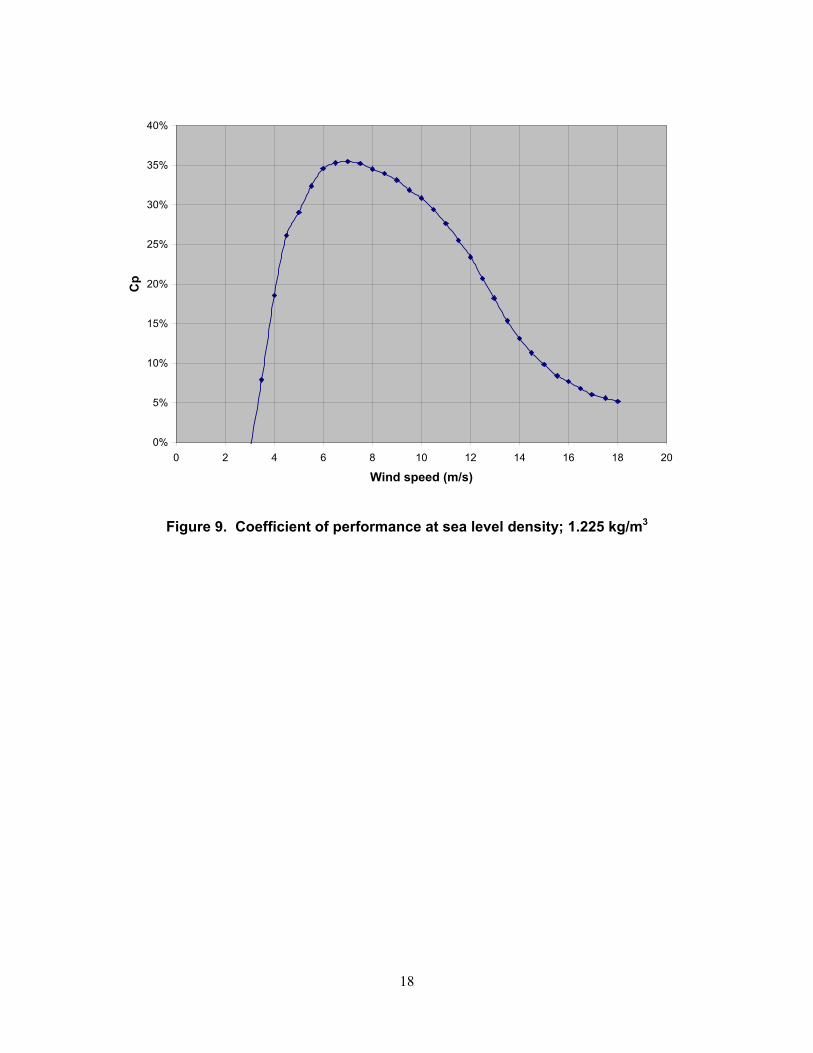
6000US NREL measured the distance of the blade tip to the center of the rotor as 3.7 m, which would make the diameter 7.4 m. If the turbine has this measured rotor diameter of 7.4m instead of the specified diameter of 7.2m, this would reduce the peak Cp from 0.42 to 0.40.
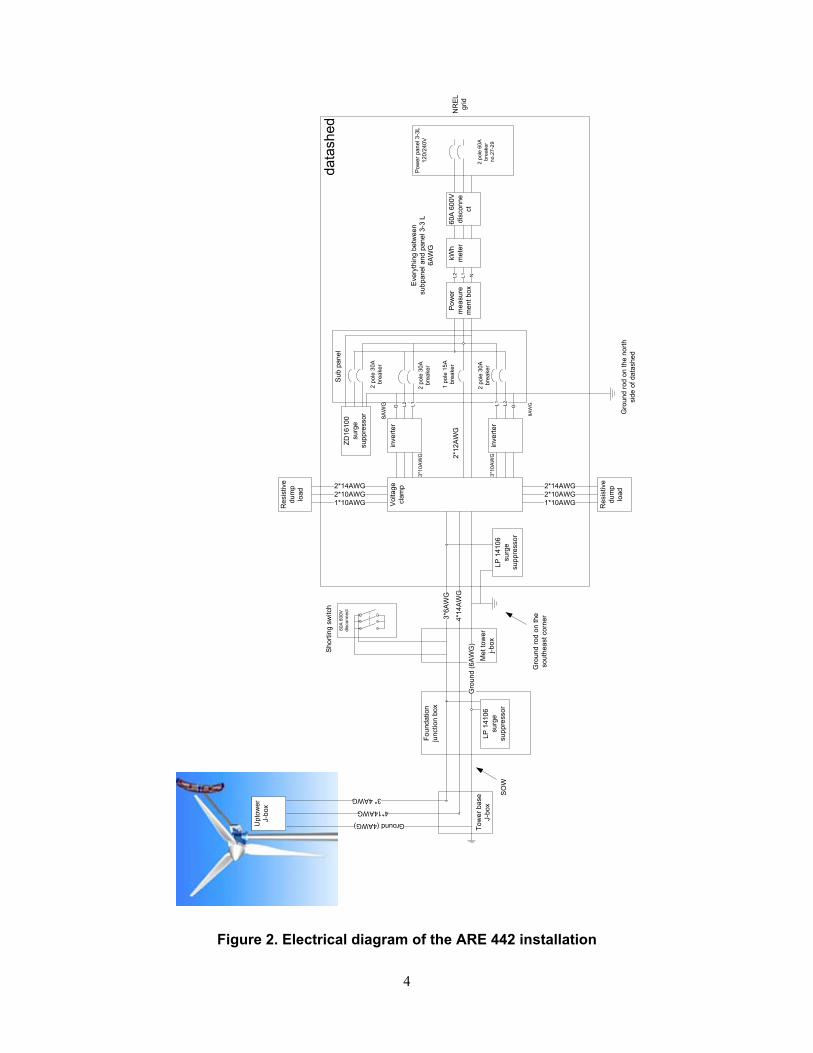
The power transducer was connected between the NREL grid and the subpanel (Figure 2) to which the voltage clamp and the inverters are connected. It thus captures the combined consumption/production of all three components.
4
Figure 2. Electrical diagram of the ARE 442 installation
Tow
er b
ase
J-bo
x
Upt
ower
J-
box
Foun
datio
n ju
nctio
n bo
x
Met
tow
er
j-box
Vol
tage
cl
amp
Res
istiv
e du
mp
load
Res
istiv
e du
mp
load
inve
rter
inve
rter
Sub
pan
el
Pow
er
mea
sure
men
t box
60A
600
V
disc
onne
ct
kWh
met
er
Pow
er p
anel
3-3
L 12
0/24
0V
2*10AWG
L1
data
shed
3*6A
WG
4*14
AW
G
3* 4AWG
4*14AWG
LP 1
4106
su
rge
supp
ress
or
Ground (4AWG)
Gro
und
(6A
WG
)
LP 1
4106
su
rge
supp
ress
or
Gro
und
rod
on th
e so
uthe
ast c
orne
r
G L1 L1 L2 G
Gro
und
rod
on th
e no
rth
side
of d
atas
hed
ZD16
100
surg
e su
ppre
ssor
L2
2 po
le 3
0A
brea
ker
3*10
AW
G
3*10
AW
G
1*10AWG
2*14AWG2*10AWG1*10AWG
2*14AWG2
pole
30A
br
eake
r
1 po
le 1
5A
brea
ker
2 po
le 6
0A
brea
ker
no.2
7-29
Eve
ryth
ing
betw
een
subp
anel
and
pan
el 3
-3 L
6A
WG
NL2
8AW
G
8AW
G
NR
EL
grid
2*12
AW
G
2 po
le 3
0A
brea
ker
60A
600
V
disc
onne
ct
Sho
rting
sw
itch
SO
W

5
Figure 3. ARE 442 test turbine at the NWTC

6
4. Test Site Description The test turbine is located at site 3.3a at the NWTC located 8 miles south of Boulder, Colorado. The terrain primarily consists of mostly flat terrain with short vegetation. The test site has prevailing wind bearing 292° relative to true north. For measurements where it is important to accurately measure wind speed, NREL used data obtained when wind direction is between 214° and 74° true. In this measurement sector, the influence of terrain and obstructions on the anemometer is small. Figure 4 shows the turbine and meteorological tower locations. This figure also shows nearby obstructions and topographical features of the site. A circle indicating 20 rotor diameters is drawn on the map. Sizes and distances of nearby obstructions are provided in Table 2.
Figure 4. Map of the test site
North

7
Table 2. Structures close to test turbine
Obstacle or Relative Distance Bearing Equiv. Dia. Obstructed Sector Turbine to: Start End
(m) (deg T) (m) (deg T) (deg T) Met A Test Turbine 18.3 290 0.8 Data Shed Test Turbine 62.8 250.6 4.3 0 0 Gaia Test Turbine 48.0 182.3 N/A 152 213 Met B Test Turbine 49.2 221.7 0.8 0 0 Mariah Test Turbine 92.0 205.6 N/A 0 0 Met C Test Turbine 93.3 211.2 0.7 0 0 Test Turbine Met Tower 18.3 110 N/A 73 147 Data Shed Met Tower 50.0 237 4.3 0 0 Gaia Met Tower 56.4 164 N/A 136 193 Met B Met Tower 45.7 200 0.8 0 0 Mariah Met Tower 92.0 194 N/A 0 0 Met C Met Tower 91.5 200 0.7 0 0
Based upon this analysis, NREL has established a measurement sector from 214° to 74°. NREL completed a site assessment to determine if the site fails the requirements of Annex A of the Standard and would therefore require a site calibration. Table 3 shows the results from the site assessment. Based on the site assessment results, a site calibration is not required.
Table 3. Criteria for test site without site calibration
Description Distance Sector (deg)
Test Site Condition
Pass/Fail
Maximum slope of best fit plane < 3% <2L 360 2.3% Pass Maximum variation from best fit plane < 0.08 D <2L 360 0.02 Pass Maximum slope of best fit plane < 5% 2-4L In 2.7% Pass Maximum variation from best fit plane < 0.15 D 2-4L In 0.02 Pass Steepest slope maximum < 10% 2-4L Out 3.1% Pass Maximum slope of best fit plane < 10% 4-8L In 2.7% Pass Maximum variation from best fit plane < 0.15 D 4-8L In 0.02 Pass No neighboring and operating turbines <2Dn 360 0 Pass No obstacles <2De 360 0 Pass D = test turbine rotor diameter L = distance between test turbine and meteorological tower De = equivalent diameter of obstacle In = inside preliminary measurement sector Out = outside preliminary measurement sector
The ARE442 was connected to the electrical grid at a nominal voltage of 240 VAC at a frequency of 60 Hz. The grid tolerances are 5% for voltage amplitude and 1% for frequency.

8
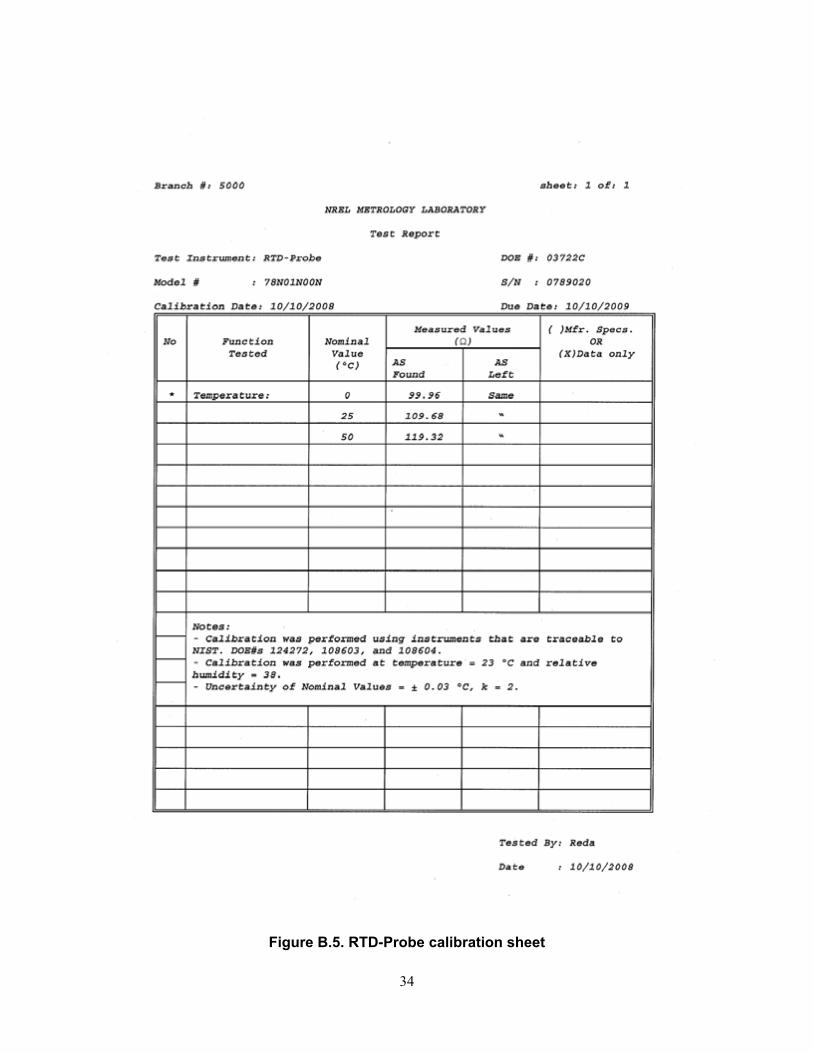
5. Description of Test Equipment All test equipment was calibrated; calibration sheets are included in Appendix B. Table 4 shows the equipment used and calibration due dates. Figure 5 shows placement of the meteorological instruments on the tower. The anemometer was sent out for recalibration after the test period. The difference between the two calibrations was within the tolerances allowed by the Standard. The data acquisition modules were out of calibration during the test period. They were sent out for post-test calibration and found to be within specification. The post-test calibration sheets are included in Appendix B as well.
Table 4. Equipment used in the power performance test
Instrument Make, Model Serial Number Calibration Due Date Power transducer Secondwind Phaser 5FM-4A20 02663 28 Apr 2009 Current transducers OSI 12974 001235408
001235411 Calibrated with power transducer
Primary anemometer Thies, First Class 0707886 28 Feb 2009 Reference anemometer NRG, Max 40 179500049022 In situ Wind vane Met One, 020C with aluminum
vane G4706 28 Feb 2009
Pressure sensor Vaisala, PTB101B T4730007 26 Aug 2009 Temperature sensor Met One, T-200 0789020 10 Oct 2009 Precipitation sensor Campbell Scientific, 237 None In situ Data acquisition system
Compact DAQ w/LabView-based data acquisition cDAQ-9172 NI 9229 NI 9217 NI 9205
12EAE14 12A2037 12C73B4 12ECB77
31 May 2008 3 Aug 2008 9 Oct 2008

9
Figure 5. Meteorological tower and instruments
Figure 5 shows placement of the meteorological instruments on the tower. (Note that the Primary Anemometer is within the allowable 2.5% of hub height. To ensure that only data obtained during normal operation of the turbine are used in the analysis, and to ensure data are not corrupted, data sets are excluded from the database under the following circumstances:
• external conditions other than wind speed are out of the normal range for turbine operation,
• turbine cannot operate because of a turbine fault condition, and, • turbine is manually shut down or in a test or maintenance operating mode.
Two methods were used to track when any of these conditions occur during the test. With the first method, the logbook was checked for such events. For the second, the turbine controller had a status signal which was measured that indicates when the turbine is available or braked. A copy of the logbook is available upon request. No maintenance was performed during the test period.

10
6. Description of Test Procedure The test was conducted according to the procedures in the Standard. The sampling rate was 10 kHz, which was then decimated to 1 Hz data. The averaging time was 1 minute for the mean values. Standard deviation, minimum, and maximum values for each averaging period were also collected.
The turbine status signal for the ARE 442 was obtained by checking the release of the up-tower brake relay. The status signal indicated if the turbine was braked or not.
Only database A is reported since the ARE 442 does not have a cut-out wind speed.
Table 5. Uncertainty values used in the analysis
Component Uncertainty Source Power (Inverter) voltage transducer NA current sensor/signal
12 W Specifications (specs)
power transducer * 0.12% Specs data acquisition 17 W +0.08% Specs resistor 0.01% Specs Wind Speed calibration 0.02 m/s Calibration sheet operational characteristics 0.05 m/s +0.52% IEC mounting effects 1.00% Assumption terrain effects 2.00% IEC data acquisition < 0.01 m/s Assumption Temperature temperature sensor 0.15 °C Specs radiation shielding 1.15 °C Assumption mounting effects 0.11 °C IEC method algorithm 0.00 °C Included in DAS data acquisition 0.35 °C Specs Air Pressure pressure sensor 0.20 kPa Instrument specs. mounting effects < 0.01 kPa IEC method data acquisition 0.06 kPa Specs

11
7. Test Results
7.1. Tabular Results of Power Performance Test Table 6 through 9 provide the power performance test results in tabular format.

12
Table 6. Performance at sea-level air density; 1.225 kg/m3
Measured power curve (database A) Reference air density: 1.225 kg/m3 Category A Category B Combined
Bin Normalized Power Cp Number of Standard Standard Standard Wind Speed Output 1-Minute Uncertainty Uncertainty Uncertainty
(m/s) (m/s) (kW) Data Sets (kW) (kW) (kW) 0.5 0.51 -0.03 -9.00 1000 0.00 0.16 0.16 1 1.00 -0.04 -1.61 1210 0.00 0.16 0.16
1.5 1.50 -0.04 -0.53 1339 0.00 0.16 0.16 2. 1.99 -0.05 -0.27 1423 0.00 0.16 0.16 2.5 2.50 -0.05 -0.13 1196 0.00 0.16 0.16 3 2.98 -0.01 -0.02 1061 0.00 0.16 0.16
3.5 3.49 0.08 0.08 861 0.01 0.16 0.16 4 4.00 0.30 0.19 713 0.01 0.17 0.17
4.5 4.49 0.59 0.26 647 0.01 0.18 0.18 5 5.00 0.91 0.29 579 0.02 0.18 0.18
5.5 5.51 1.35 0.32 604 0.02 0.20 0.20 6 6.00 1.86 0.35 586 0.02 0.23 0.23
6.5 6.50 2.42 0.35 624 0.02 0.24 0.24 7 7.00 3.04 0.35 647 0.02 0.27 0.27
7.5 7.49 3.70 0.35 599 0.02 0.29 0.29 8 8.00 4.41 0.35 535 0.02 0.32 0.32
8.5 8.49 5.19 0.34 544 0.02 0.36 0.36 9 9.00 6.02 0.33 478 0.02 0.39 0.39
9.5 9.50 6.81 0.32 416 0.03 0.39 0.39 10 10.00 7.70 0.31 404 0.03 0.45 0.45
10.5 10.49 8.47 0.29 384 0.04 0.42 0.42 11 10.99 9.17 0.28 362 0.04 0.40 0.40
11.5 11.50 9.69 0.26 340 0.05 0.32 0.33 12 12.01 10.10 0.23 289 0.05 0.29 0.29
12.5 12.49 10.05 0.21 245 0.06 0.17 0.19 13 12.97 9.91 0.18 243 0.06 0.20 0.21
13.5 13.50 9.42 0.15 186 0.06 0.33 0.34 14 14.00 9.00 0.13 162 0.05 0.33 0.33
14.5 14.48 8.58 0.11 138 0.04 0.34 0.34 15 15.00 8.28 0.10 124 0.06 0.26 0.27
15.5 15.54 7.86 0.08 74 0.11 0.33 0.35 16 15.99 7.85 0.08 78 0.06 0.17 0.18
16.5 16.49 7.59 0.07 47 0.05 0.26 0.27 17 16.95 7.33 0.06 33 0.14 0.28 0.31
17.5 17.51 7.48 0.06 27 0.14 0.20 0.25 18 18.01 7.57 0.05 24 0.08 0.18 0.20

13
Table 7. Performance at site average density; 1.05 kg/m3
Measured power curve (database A) Reference air density: 1.05 kg/m3 Category A Category B Combined
Bin Normalized Power Cp Number of Standard Standard Standard Wind Speed Output 1-Minute Uncertainty Uncertainty Uncertainty
(m/s) (m/s) (kW) Data Sets (kW) (kW) (kW) 0.5 0.52 -0.03 -10.29 928 0.00 0.16 0.16 1 1.00 -0.04 -1.84 1129 0.00 0.16 0.16
1.5 1.50 -0.05 -0.63 1254 0.00 0.16 0.16 2 2.00 -0.05 -0.29 1376 0.00 0.16 0.16
2.5 2.50 -0.05 -0.16 1175 0.00 0.16 0.16 3 2.99 -0.03 -0.05 1079 0.00 0.16 0.16
3.5 3.49 0.04 0.05 862 0.00 0.16 0.16 4 3.99 0.19 0.14 714 0.01 0.17 0.17
4.5 4.50 0.46 0.24 646 0.01 0.17 0.17 5 5.00 0.73 0.27 574 0.01 0.18 0.18
5.5 5.50 1.11 0.31 549 0.02 0.19 0.19 6 6.00 1.53 0.33 585 0.02 0.21 0.21
6.5 6.50 2.04 0.35 546 0.02 0.23 0.23 7 7.00 2.59 0.35 605 0.02 0.25 0.25
7.5 7.49 3.19 0.35 618 0.02 0.27 0.27 8 7.99 3.84 0.35 550 0.02 0.30 0.30
8.5 8.50 4.51 0.34 503 0.02 0.32 0.32 9 8.98 5.25 0.34 514 0.02 0.36 0.37
9.5 9.50 6.06 0.33 459 0.02 0.39 0.39 10 10.00 6.82 0.32 398 0.03 0.39 0.39
10.5 10.51 7.67 0.31 388 0.03 0.45 0.45 11 11.00 8.41 0.30 361 0.04 0.42 0.42
11.5 11.49 9.04 0.28 344 0.04 0.39 0.39 12 12.00 9.62 0.26 327 0.05 0.36 0.37
12.5 12.50 10.02 0.24 283 0.06 0.29 0.30 13 12.98 10.06 0.22 250 0.06 0.17 0.19
13.5 13.49 10.03 0.19 243 0.06 0.17 0.19 14 13.99 9.61 0.16 186 0.06 0.32 0.33
14.5 14.50 9.16 0.14 166 0.05 0.34 0.34 15 14.99 8.83 0.12 143 0.05 0.29 0.29
15.5 15.48 8.44 0.11 126 0.05 0.33 0.33 16 15.98 8.14 0.09 89 0.07 0.28 0.29
16.5 16.52 7.80 0.08 80 0.10 0.30 0.32 17 16.98 7.77 0.07 64 0.07 0.17 0.18
17.5 17.48 7.56 0.07 43 0.05 0.24 0.24 18 17.94 7.24 0.06 27 0.20 0.33 0.39
18.5 18.48 7.60 0.06 26 0.10 0.33 0.34 19 18.98 7.53 0.05 22 0.08 0.18 0.20

14
Table 8. Annual energy production (AEP) at sea-level density; 1.225 kg/m3
Table 9. Annual energy production at site average density; 1.05 kg/m3
Reference air density: 1.225 kg/m^3Cut-out wind speed: 25.00 m/s
Hub height annual average
wind speed (Rayleigh)
AEP-measured AEP-extrapolated
Complete if AEP measured is at least
95% of AEP extrapolated
m/s kWh kWh % kWh4 7,884 1,717 22% 7,884 Complete5 15,327 1,948 13% 15,329 Complete6 23,516 2,144 9% 23,572 Complete7 30,967 2,271 7% 31,330 Complete8 36,718 2,325 6% 37,924 Complete9 40,459 2,314 6% 43,158 Incomplete10 42,350 2,254 5% 47,049 Incomplete11 42,770 2,160 5% 49,696 Incomplete
Estimated annual energy production, database A (all valid data)
Standard Uncertainty in AEP-measured
AEP measured assumes zero power between highest bin and cutoutAEP extrapolated assumes power in last bin between last bin and cutout
Reference air density: 1.050 kg/m^3Cut-out wind speed: 25.0 m/s
Hub height annual average
wind speed (Rayleigh)
AEP-measured AEP-extrapolated
Complete if AEP measured is at least
95% of AEP extrapolated
m/s kWh kWh % kWh4 6,608 1,670 25% 6,608 Complete5 13,321 1,887 14% 13,322 Complete6 21,066 2,086 10% 21,091 Complete7 28,513 2,230 8% 28,714 Complete8 34,658 2,310 7% 35,419 Complete9 39,036 2,329 6% 40,886 Complete10 41,641 2,297 6% 45,046 Incomplete11 42,734 2,228 5% 47,953 Incomplete
Estimated annual energy production, database A (all valid data)
Standard Uncertainty in AEP-measured
AEP measured assumes zero power between highest bin and cutoutAEP extrapolated assumes power in last bin between last bin and cutout

15
7.2. Graphical ResultsFigure 6 through 9 show the results of the power performance test in graphical format. The 12-kW ceiling of the power maxima in Figure 8 is caused by the maximum output capability of the inverters. Figure 10 through 12 show plots of turbulence intensity and rotor speed.
Figure 6. Power curve at sea-level density; 1.225 kg/m3
-2
0
2
4
6
8
10
12
0 2 4 6 8 10 12 14 16 18 20
Normalized Wind Speed (m/s)
Pow
er (k
W)

16
Figure 7. Power curve at site average density; 1.05 kg/m3
-2
0
2
4
6
8
10
12
0 2 4 6 8 10 12 14 16 18 20
Normalized Wind Speed (m/s)
Pow
er (k
W)

17
Figure 8. Scatter plot of mean, standard deviation, minimum, and maximum power data. 1 Hz samples with 1 minute averaging.
18
Figure 9. Coefficient of performance at sea level density; 1.225 kg/m3
0%
5%
10%
15%
20%
25%
30%
35%
40%
0 2 4 6 8 10 12 14 16 18 20
Wind speed (m/s)
Cp

19
Figure 10. Wind turbulence intensity as a function of wind speed

20
Figure 11. Wind speed and turbulence intensity as a function of wind direction

21
Figure 12. Rotor speed as a function of wind speed (1-minute averages) and binned values
Wind speed [m/s] 0.5 1.0 1.5 2.0 2.5 3.0 3.5 4.0 4.5 5.0 5.5 6.0 6.5 7.0 7.5 8.0 8.5 9.0 9.5 10.0Rotor speed [rpm] 0 0 1 5 10 17 31 48 71 81 89 97 101 105 108 111 114 117 120 123
Wind speed [m/s] 10.5 11.0 11.5 12.0 12.5 13.0 13.5 14.0 14.5 15.0 15.5 16.0 16.5 17.0 17.5 18.0 18.5 19.0 19.5 20.1Rotor speed [rpm] 127 130 134 137 140 142 144 145 145 145 145 146 147 147 148 148 150 154 152 153

22
8. Deviations and Exceptions
8.1. Deviations from the Standard The current transformers are not listed as compliant to IEC 60044-1, but do exceed the minimum accuracy required by the Standard.
8.2. Exceptions to NWTC-CT Quality Assurance System During the test period, the data acquisition system was out of calibration. A post test calibration has been performed which showed that the system was within specification without adjustment. Thus, it can be assumed the system was within specification during the test period and no additional uncertainty needs to be applied.

23
Appendix A. Pictures of the Test Site

24
Figure A.1. West
Figure A.2. Southwest

25
Figure A.3. South-south-west
Figure A.4. South southeast

26
Figure A.5. East
Figure A.6. Northeast

27
Figure A.7. North northeast
Figure A.8. North

28
Figure A.9. Northwest

29
Appendix B. Equipment Calibration Sheets

30
Figure B.1. Power transducer calibration sheet

31
Figure B.2. Primary anemometer calibration sheet I

32
Figure B.3. Primary anemometer calibration sheet II

33
Figure B.4. Wind vane calibration report
34
Figure B.5. RTD-Probe calibration sheet

35
Figure B.6. Pressure transmitter calibration sheet

36
Figure B.7. NI 9217 data acquisition module calibration sheet I

37
Figure B.8. NI 9229 data acquisition module calibration sheet I

38
Figure B.9. NI 9205 data acquisition module calibration sheet I

39
Figure B.10. NI 9229 data acquisition module calibration sheet II

40
Figure B.11. NI 9217 data acquisition module calibration sheet II

41
Figure B.12. NI 9205 data acquisition module calibration sheet II

F1147-E(10/2008)
REPORT DOCUMENTATION PAGE Form Approved OMB No. 0704-0188
The public reporting burden for this collection of information is estimated to average 1 hour per response, including the time for reviewing instructions, searching existing data sources, gathering and maintaining the data needed, and completing and reviewing the collection of information. Send comments regarding this burden estimate or any other aspect of this collection of information, including suggestions for reducing the burden, to Department of Defense, Executive Services and Communications Directorate (0704-0188). Respondents should be aware that notwithstanding any other provision of law, no person shall be subject to any penalty for failing to comply with a collection of information if it does not display a currently valid OMB control number. PLEASE DO NOT RETURN YOUR FORM TO THE ABOVE ORGANIZATION. 1. REPORT DATE (DD-MM-YYYY)
February 2010 2. REPORT TYPE
Technical report 3. DATES COVERED (From - To)
4. TITLE AND SUBTITLE
Wind Turbine Generator System - Power Performance Test Report: ARE442 Wind Turbine
5a. CONTRACT NUMBER DE-AC36-08-GO28308
5b. GRANT NUMBER
5c. PROGRAM ELEMENT NUMBER
6. AUTHOR(S) J. van Dam and D. Jager
5d. PROJECT NUMBER NREL/TP-500-46191
5e. TASK NUMBER WE102211
5f. WORK UNIT NUMBER
7. PERFORMING ORGANIZATION NAME(S) AND ADDRESS(ES) National Renewable Energy Laboratory 1617 Cole Blvd. Golden, CO 80401-3393
8. PERFORMING ORGANIZATION REPORT NUMBER NREL/TP-500-46191
9. SPONSORING/MONITORING AGENCY NAME(S) AND ADDRESS(ES)
10. SPONSOR/MONITOR'S ACRONYM(S) NREL
11. SPONSORING/MONITORING AGENCY REPORT NUMBER
12. DISTRIBUTION AVAILABILITY STATEMENT National Technical Information Service U.S. Department of Commerce 5285 Port Royal Road Springfield, VA 22161
13. SUPPLEMENTARY NOTES
14. ABSTRACT (Maximum 200 Words) This report summarizes the results of a power performance test that NREL conducted on the ARE 442 wind turbine. This test was conducted in accordance with the International Electrotechnical Commission’s (IEC) standard, Wind Turbine Generator Systems Part 12: Power Performance Measurements of Electricity Producing Wind Turbines, IEC 61400-12-1 Ed.1.0, 2005-12. However, because the ARE 442 is a small turbine as defined by IEC, NREL also followed Annex H that applies to small wind turbines. In these summary results, wind speed is normalized to sea-level air density.
15. SUBJECT TERMS ARE442 wind turbine; power performance; small wind turbine
16. SECURITY CLASSIFICATION OF: 17. LIMITATION OF ABSTRACT
UL
18. NUMBER OF PAGES
19a. NAME OF RESPONSIBLE PERSON a. REPORT
Unclassified b. ABSTRACT Unclassified
c. THIS PAGE Unclassified 19b. TELEPHONE NUMBER (Include area code)
Standard Form 298 (Rev. 8/98) Prescribed by ANSI Std. Z39.18