Embed Size (px)
Citation preview

1
Wind-induced internal pressures in buildings with large façade openings
Panagiota Karava1, Ted Stathopoulos2
1Assistant Professor, Civil and Environmental Engineering, University of Western OntarioLondon, Ontario, Canada, [email protected]
2 Professor, Building, Civil and Environmental Engineering, Concordia UniversityMontreal, Quebec, Canada, [email protected]
ABSTRACT
The present study investigates the effect of wall porosity, inlet-to-outlet-ratio (A1/A2), openinglocation, and blockage on internal pressure in buildings with cross-ventilation through largeopenings, considering data from simultaneous measurements on multiple internal pressure taps.The study found that the internal airflow field has a significant impact on mean and peak valuesof the internal pressure, which is not uniform for configurations with wall porosity higher than10% and openings located on adjacent walls. Peak internal pressure coefficients were found toexceed the recommended design value for building category 3 (NBCC, 2005), for configurationswith openings located above the mid-height of the building, leeward wall outlets, and A1/A2 ≥ 2.
INTRODUCTION
In the context of sustainable development, innovative components such as bioclimatic façades,with motorized building envelope vents or operable windows are often found in modernbuildings. These innovative systems present further challenges for wind and structural engineersas they replace conventional cladding (Cochran and Peterka, 2001; Irwin et al., 2007; Karava etal., 2007, Karava, 2008). For example, internal pressures form a large portion of cladding designpressures on a building where an envelope breach has occurred as a result of flying debrisdamage. Also severe external pressures could be transmitted to the internal space if windows areleft open during a storm or motorized openings are subject to a power failure (Cochran andPeterka, 2001). Although internal pressures play an important role in the design of structures andcladding, they are insufficiently described in existing building codes and design standards mainlydue to complexities involved in their evaluation.
Internal pressure coefficients in buildings with dominant openings in one wall received a lot ofattention starting in the 70’s. Aynsley et al. (1977) and Stathopoulos et al. (1979) reported thatthe internal pressure is uniform and its value does not depend on the measurement point. Wu etal. (1998) carried out a comparison among various studies for mean and peak internal pressuresfor buildings with a dominant opening while a more recent state of the art review was reportedby Oh et al. (2007). Internal pressure coefficients for buildings subject to cross-ventilation havebeen reported by Munarin (1978), Holmes (1979), Liu (1991), Choiniere et al. (1992), Murakamiet al. (1991), Womble (1994), Womble et al. (1995), Ginger et al. (1995), Straw et al. (2000),Sawachi et al. (2004), and Hu et al. (2005). The studies by Womble et al. (1995) and Ginger etal. (1995) reported peak internal pressures but considered configurations with relatively smallopenings. There have been relatively few studies on the effects of compartmentalization(Saathoff and Liu, 1983; Sharma, 2003). Both studies found that fluctuating internal pressurescan be increased due to the effects of compartmentalization and the resulting reduction of theinternal volume. Kopp et al. (2008) investigated the effect of compartmentalization of the attic

2
space from the living space in a house considering the effects of leakage and venting as well asvolume scaling.
The category of the building with a single dominant opening is usually considered critical forwind load design; however, the correct assessment of internal pressure behaviour for buildingswith cross-openings of realistic wall porosities is essential. The present study focuses on internalpressures in buildings with large façade openings (wall porosity higher than 2.5%) around aconnected internal space (e.g. open floor plan). The study considers data from simultaneousmeasurements on multiple internal pressure taps, as well as different values of blockage of theinternal volume due to partition walls, furniture etc. The configurations examined include theeffects of (1) wall porosity; (2) inlet-to-outlet-ratio; and (3) opening location.
METHODOLOGY
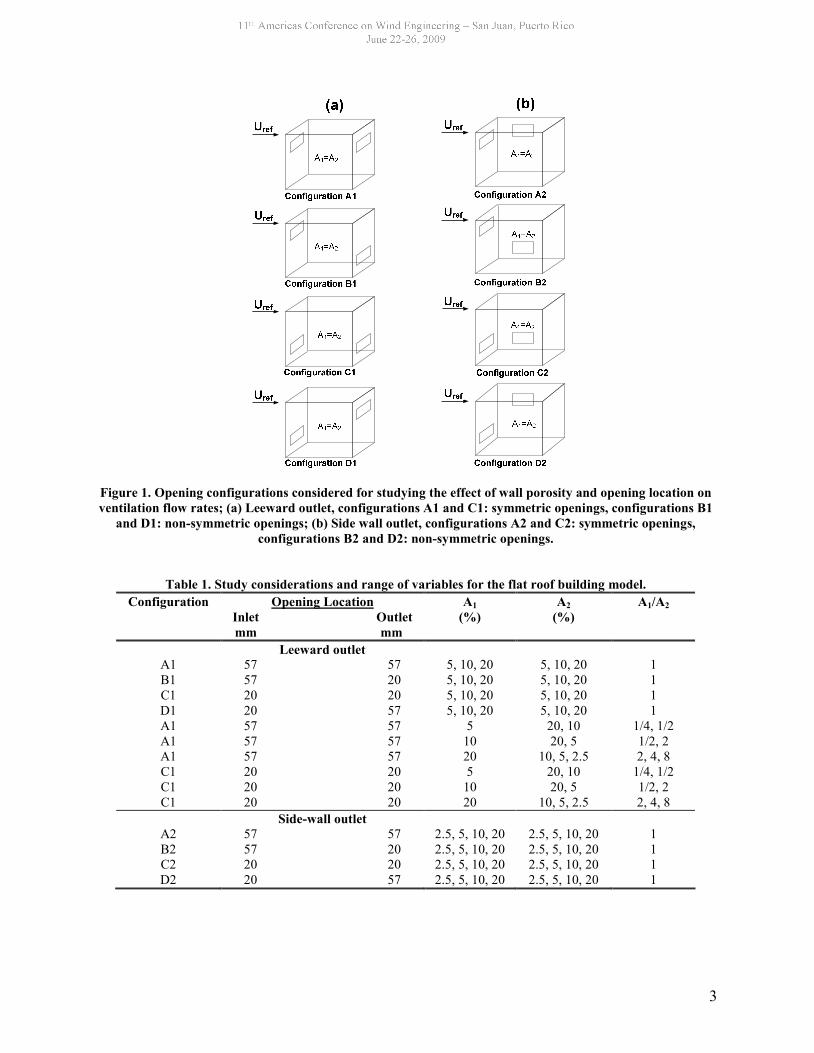
A 10 10 8 cm flat roof building model with 20 m 20 m, 16 m high equivalent full-scaledimensions - corresponding to a 4 or 5-storey building - according to a 1:200 geometric scalewas considered. The geometric model scale of the BLWT of Concordia University is equal to1/400 ~ 1/500, however, previous work has shown that a scale equal to 1:200 can be safely usedfor pressure measurements (Stathopoulos and Surry, 1983). Inlets and outlets, which are simplerectangular openings of the same height (18 mm – 3.6 m), were located at the bottom (openingmid-height at 20 mm – 4 m from ground) or top (opening mid-height at 57 mm – 11.4 m fromground) of the walls. Configurations with inlets and outlets located at the same height(symmetric openings, configurations A1, A2 and C1, C2) or at different heights (non-symmetricopenings, configurations B1, B2 and D1, D2), wall porosity ranging form 2.5% to 20%, inlet-to-outlet ratio varying from 0.25 to 8, blockage ratio from 5 to 35% and 0.13% background leakagewere tested. The opening configurations tested are shown in Figure 1 and the range of variablesconsidered is summarized in Table 1.
In buildings, blockage of the internal volume may be created due to partition walls, furniture, etc.Due to the significant complexity in modeling interconnected internal volumes, this effect wasmodelled using the plastic tubes that connect the pressure taps to the Scanivalve and theblockage ratio on each cross-section was estimated using the following equation:
area covered by the tubing in cross-section ABlockage ratio of cross-section A8 cm 10cm
(1)
“Overall blockage ratios” ranging from 5% to 35% were estimated in this study by averaging theblockage ratios of the different cross-sections. Figure 2 shows an exploded view of the buildingmodel and the locations of the pressure taps (12 external and 20 internal used in this study).Internal pressures were measured at different locations within the model depending on theblockage ratio of the internal volume. Selected pressure taps for the different cases are presentedin Figure 2.
Holmes (1979) introduced the method of internal volume scaling in wind tunnel experiments tomaintain similarity of the dynamic response of the volume at model scale to that in full scale,which is critical for obtaining the correct natural frequency for Helmholtz resonators. A sealedvolume chamber is usually installed, fit to the bottom of the model, so that the internal volume isincreased in order to achieve model to full scale internal volume similarity. The scalingparameter for the internal pressure dynamics has been applied in the experimental studies for theevaluation of internal pressures in buildings with a dominant opening by Liu and Rhee (1986),
3
Figure 1. Opening configurations considered for studying the effect of wall porosity and opening location onventilation flow rates; (a) Leeward outlet, configurations A1 and C1: symmetric openings, configurations B1
and D1: non-symmetric openings; (b) Side wall outlet, configurations A2 and C2: symmetric openings,configurations B2 and D2: non-symmetric openings.
Table 1. Study considerations and range of variables for the flat roof building model.Configuration Opening Location
Inlet Outlet mm mm
A1(%)
A2(%)
A1/A2
Leeward outletA1 57 57 5, 10, 20 5, 10, 20 1B1 57 20 5, 10, 20 5, 10, 20 1C1 20 20 5, 10, 20 5, 10, 20 1D1 20 57 5, 10, 20 5, 10, 20 1A1 57 57 5 20, 10 1/4, 1/2A1 57 57 10 20, 5 1/2, 2A1 57 57 20 10, 5, 2.5 2, 4, 8C1 20 20 5 20, 10 1/4, 1/2C1 20 20 10 20, 5 1/2, 2C1 20 20 20 10, 5, 2.5 2, 4, 8
Side-wall outletA2 57 57 2.5, 5, 10, 20 2.5, 5, 10, 20 1B2 57 20 2.5, 5, 10, 20 2.5, 5, 10, 20 1C2 20 20 2.5, 5, 10, 20 2.5, 5, 10, 20 1D2 20 57 2.5, 5, 10, 20 2.5, 5, 10, 20 1

4
Blockageratio (%) Internal pressure taps
5 2, 8, 10, 12, 14*, 16
20 2, 4, 6, 8, 10, 12, 14, 16, 18, 20
352, 4, 6, 8, 10, 12, 14, 16, 18, 20,
22, 23, 24, 25, 26, 28, 30, 31,32, 33
* Tap 14 was used only for configurations with a side
wall outlet
Figure 2. Exploded view of flat roof building model with pressure taps locations (left) and internal pressuretaps used for blockage ratios (right).
Womble (1994), Womble et al. (1995), Pearce and Sykes (1999), Ho et al. (2004), Oh et al.(2007), and Kopp et al. (2008). Womble (1994) reported that scaling of internal volume has noeffect in the internal pressure fluctuations in buildings with cross-openings. It should be notedthat scaling of internal volume has been considered for buildings with a single dominant openingwhere the actual flow patterns inside the building are not significant. However, for the evaluationof internal pressures in buildings with more than one large façade openings, model to full scaleairflow patterns similarity is also required. This similarity may be violated if the shape and sizeof the internal volume is modified. Hence, considering the uncertainties involved in the presentstudy, it was decided not to consider scaling of internal volume.
A honeywell 163 PC differential pressure transducer was used to measure mean and fluctuatingpressures. The pressure signals from each tap were sampled at 500 Hz for 32 s (averaging periodused to obtain the mean, STDEV and peak value of the pressure coefficient at each tapping)using a data acquisition system (DATA6000). All measured pressures were referenced to thedynamic pressure at the boundary layer height (~ 600mm) in the wind tunnel measured using apitot tube. These were then converted to a roof height reference by multiplying them byconversion factors. A standard wind velocity profile over open terrain was simulated with apower-law exponent equal to 0.13, turbulence intensity at the eave height equal to 13% and areference wind speed equal to 12.4 m/s. The roughness length (Zo) was about 2.25 cm.
RESULTS AND DISCUSSION
Figure 3 shows mean and peak Cpin values measured in various internal pressure taps forconfigurations with leeward outlets (A1, B1, C1, and D1), 5% blockage and different wallporosities. Results show variations among the different taps, i.e., smaller Cpin values measuredon taps 2 and 12 that may be affected by the stream tube and higher Cpin values on taps 8, 10 and16 that are outside the stream tube. Differences among taps can be up to Cp = 0.13 (factor of1.3) for the means and Cp = 0.3 (factor of 1.4) for the peaks (configuration B1). Murakami etal. (1991) and Straw et al. (2000) measured mean internal pressures on two points inside a

5
building (on the floor and the inlet/outlet wall respectively) with cross-ventilation and largeopenings (wall porosity 2.5-30% and 2.7% respectively) and reported small differences in meanCpin values. Choiniere et al. (1992) reported mean Cpin variations in buildings with largecontinuous sidewall, ridge or chimney, and end wall openings, for different wind directions. Itwas concluded that detailed studies are needed to evaluate the number of internal pressure tapsrequired and their locations in order to obtain an accurate picture of the Cpin variations. Munarin(1978), Womble et al. (1995) and Ginger et al. (1995) reported uniform mean and peak internalpressures. Generally, in studies related to wind load design of buildings (e.g. Womble et al.,1995; Ginger et al., 1995), internal pressure is traditionally measured with a single tap.
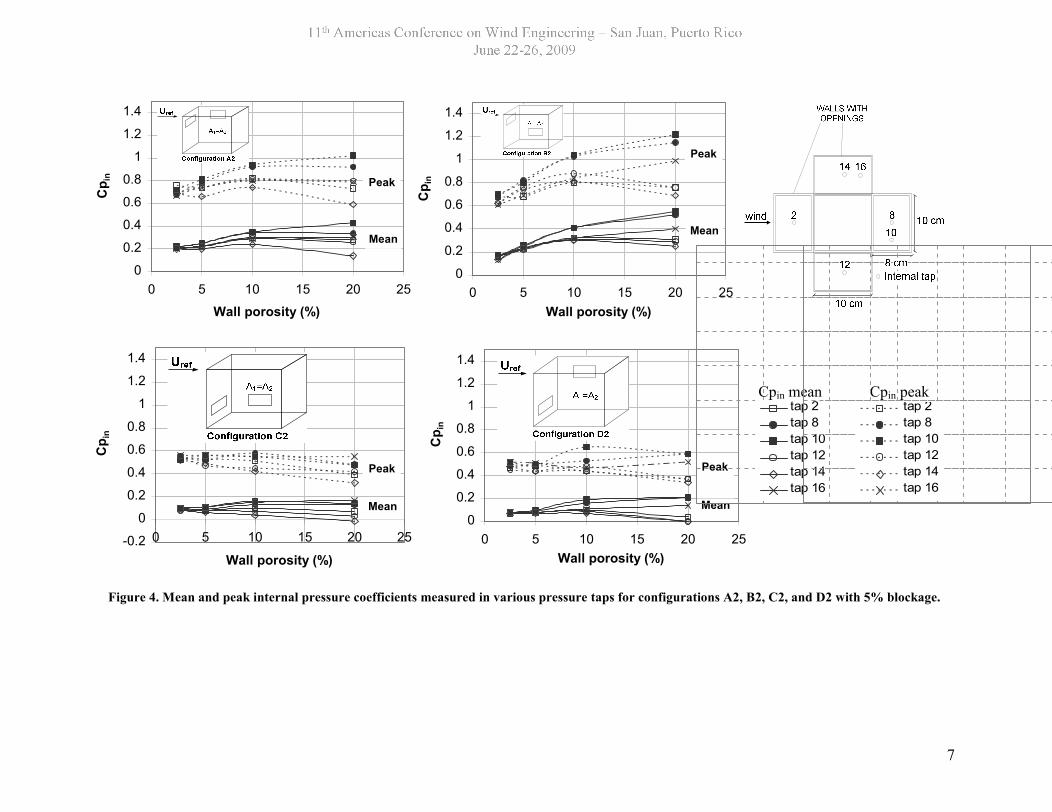
Similar results for configurations with inlets and outlets located on adjacent walls (A2, B2, C2,and D2) are shown in Figure 4. In this case, differences among taps can be up to Cp = 0.3 formeans and Cp = 0.53 for peaks with configuration B2. Thus, for a reference velocity at buildingheight equal to 2 m/s there is a gradient of 0.7 and 1.3 Pa in the mean and peak value of theinternal pressure inside the building. Internal pressure gradients of this magnitude (in the order of1 Pa) create discomfort of building occupants. It should be noted that configurations with side-wall outlets have been considered only by Murakami et al. (1991) for A1/A2 = 2, where theinternal pressure was measured on two floor taps. CFD simulations by Seifert et al. (2006)considered side wall outlets but the study does not report internal pressure coefficient values.These findings should be considered in the selection of measurement points for futureexperiments and they might have implications on wind load design of buildings.
Figure 5 shows spatially-averaged mean and peak internal pressure coefficients as a function ofwall porosity for configurations B1 and B2 (outlets located below the mid-height of the building)with blockage ratios equal to 5%, 20%, and 35%, A1 = A2, and for = 0°. The spatially-averaged mean and peak internal pressure coefficient was the average reading of 5, 10 and 21internal pressure taps for 5, 20, and 35% estimated blockage respectively (see Figure 2). Higherinternal pressure coefficients, up to about 60%, are observed for blockage ratios increasing from20 to 35% for configuration B1 (leeward outlet) while mean and peak internal pressurecoefficients increase by 30 and 40% respectively for configuration B2 (sidewall outlet) withblockage ratio increasing from 5% to 35%. Almost identical mean and peak internal pressurecoefficients were found for other configurations for all blockage ratios.
The effect of wall porosity and opening location was investigated and results for the spatially-averaged mean and peak internal pressure coefficient are shown in Figure 6 for configurationsA1, B1, C1, and D1 (leeward outlet) with 5% blockage, A1 = A2 and = 0°. The internalpressure was measured on taps 2, 8, 10, 12, and 16 (see Table 2). Cpin values are higher (up toCp = 0.29 - factor of 2.5 - for the means and 0.41 -factor of 1.65 - for the peaks) forconfiguration B1 (non-symmetric openings) compared to configuration A1 (symmetric openings)mainly due to the larger curvature of the air stream (higher flow resistance) for configuration B1.Higher Cpin values (up to Cp = 0.2 for the means and 0.36 -factor of 2.3 - for the peaks) areobserved for configuration D1 compared to those for C1. Similar results for configurations withinlet and outlets on adjacent walls (A2, B2, C2, D2) are shown in Figure 7.
Results indicate that for cross-openings with large porosities (i.e. higher than 10%) the internalairflow field has a significant impact on mean and peak values of the internal pressure. For the

6
0
0.2
0.4
0.6
0.8
1
1.2
1.4
0 5 10 15 20 25Wall porosity (%)
Cp i
n
Mean
Peak
0
0.2
0.4
0.6
0.8
1
1.2
1.4
0 5 10 15 20 25Wall porosity (%)
Cp i
n
Mean
Peak
-0.2
0
0.2
0.4
0.6
0.8
1
1.2
1.4
0 5 10 15 20 25Wall porosity (%)
Cp i
n
Mean
Peak
0
0.2
0.4
0.6
0.8
1
1.2
1.4
0 5 10 15 20 25Wall porosity (%)
Cp i
n
Mean
Peak
Cpin mean Cpin peak
0
0.2
0.4
0.6
0.8
1
1.2
1.4
0 5 10 15 20 25Wall porosity
Cpi
n pe
ak
tap 2tap 8tap 10tap 12tap 16
0
0.2
0.4
0.6
0.8
1
1.2
1.4
0 5 10 15 20 25Wall porosity
Cpi
n pe
ak
tap 2tap 8tap 10tap 12tap 16
Figure 3. Mean and peak internal pressure coefficients measured in different pressure taps for configurations A1, B1, C1, and D1 with 5% blockage.
7
0
0.2
0.4
0.6
0.8
1
1.2
1.4
0 5 10 15 20 25
Wall porosity (%)
Cp i
n
Mean
Peak
0
0.2
0.4
0.6
0.8
1
1.2
1.4
0 5 10 15 20 25Wall porosity (%)
Cp i
n
Mean
Peak
-0.2
0
0.2
0.4
0.6
0.8
1
1.2
1.4
0 5 10 15 20 25
Wall porosity (%)
Cp i
n
Mean
Peak
0
0.2
0.4
0.6
0.8
1
1.2
1.4
0 5 10 15 20 25Wall porosity (%)
Cp i
n
Mean
Peak
Cpin mean Cpin peak
0
0.2
0.4
0.6
0.8
1
1.2
1.4
0 5 10 15 20 25Wall porosity
Cpi
n pe
ak
tap 2tap 8tap 10tap 12tap 14tap 16
0
0.2
0.4
0.6
0.8
1
1.2
1.4
0 5 10 15 20 25Wall porosity
Cpi
n pe
ak
tap 2tap 8tap 10tap 12tap 14tap 16
Figure 4. Mean and peak internal pressure coefficients measured in various pressure taps for configurations A2, B2, C2, and D2 with 5% blockage.

8
0
0.2
0.4
0.6
0.8
1
1.2
1.4
0 5 10 15 20 25Wall porosity (%)
Cp i
n
Blockage (%) Cpin mean Cpin peak5
0
0.2
0.4
0.6
0.8
1
1.2
1.4
0 5 10 15 20 25Wall porosity
Cpi
n pe
ak
Conf. A
Conf. B
Conf. C
Conf. D
0
0.2
0.4
0.6
0.8
1
1.2
1.4
0 5 10 15 20 25Wall porosity
Cpi
n pe
ak
Conf. A
Conf. B
Conf. C
Conf. D
20
0
0.2
0.4
0.6
0.8
1
1.2
1.4
0 5 10 15 20 25Wall porosity
Cpin
pea
k
Conf. A
Conf. B
Conf. C
Conf. D
0
0.2
0.4
0.6
0.8
1
1.2
1.4
0 5 10 15 20 25Wall porosity
Cpi
n pe
ak
Conf. A
Conf. B
Conf. C
Conf. D
35
0
0.2
0.4
0.6
0.8
1
1.2
1.4
0 5 10 15 20 25Wall porosity
Cpi
n pe
ak
Conf. A
Conf. B
Conf. C
Conf. D
0
0.2
0.4
0.6
0.8
1
1.2
1.4
0 5 10 15 20 25Wall porosity
Cpi
n pe
ak
Conf. A
Conf. B
Conf. C
Conf. D
0
0.2
0.4
0.6
0.8
1
1.2
1.4
0 5 10 15 20 25Wall porosity (%)
Cp i
n
Mean
Peak
Figure 5. Mean and peak internal pressure coefficients for configurations B1 |(top) and B2 (bottom) withdifferent blockage ratios.
same inlet-to-outlet-ratio, the mean internal pressure coefficient is considerably higher forconfigurations with non-symmetric openings compared to configurations with symmetricopenings. Experimental results are compared with mean internal pressure coefficients evaluatedby using Equation 2, which can be derived from the mass balance equation for a building withtwo large openings, assuming the same leakage characteristics for the inlet and outlet as well asuniform internal pressure (Liu, 1991):
22 1
in 2Cp CpCp
1
(2)
where, Cp1 = external pressure coefficient in opening 1, Cp2 = external pressure coefficient inopening 2, and = A1/A2. As shown in Figures 6 and 7 variations of the internal pressurecoefficient with porosity, as well as differences among configurations with symmetric and non-symmetric openings of the same area - mainly attributed to the internal flow patterns - cannot bepredicted by this simplified equation.
Measured peak internal pressure coefficients for configurations with windward wall (A1, B1, C1,and D1) and side wall outlets (A2, B2, C2, and D2) with 5% blockage and A1/A2 = 1 are shownin Figures 6 and 7. NBCC provisions for building category 3 (buildings with large or significantopenings) are also included. The code does not specify wall porosities or opening locations forwhich a gust effect factor (equal to 2 for internal pressures) should be used, hence, the lower(without considering an internal gust effect factor) and upper (considering an internal gust factor

9
-0.2
0
0.2
0.4
0.6
0.8
1
0 5 10 15 20 25Wall porosity (%)
Cp i
n mea
n
Analytical, Conf. A1 & B1 (Cpw = 0.75, Cpl = - 0.15)
Analytical, Conf. C1 & D1 (Cpw = 0.60, Cpl = - 0.15)
-0.2
0
0.2
0.4
0.6
0.8
1
-5 5 15 25
Wall porosity (%)C
pin
mea
n
Conf . A
Conf . B
Conf . C
Conf . D
A naly tical, Conf . A & B (Cpw= 0.75, Cpl = -0.15)
A naly tical, Conf . C & D (Cpw =0.6, Cpl = -0.15)
-0.2
0
0.2
0.4
0.6
0.8
1
-5 5 15 25
Wall porosity (%)C
pin
mea
n
Conf . A
Conf . B
Conf . C
Conf . D
Analytical, Conf . A & B (Cpw= 0.75, Cpl = -0.15)
Analytical, Conf . C & D (Cpw =0.6, Cpl = -0.15)
0
0.2
0.4
0.6
0.8
1
1.2
1.4
0 5 10 15 20 25Wall porosity (%)
Cp i
n pea
k
NBCC (2005)
Figure 6. Mean and peak internal pressure coefficients for configurations A1, B1, C1, and D1 with 5%blockage – comparison with theory (mean values) and NBCC (2005) (peak values).
00.10.20.30.40.50.60.70.80.9
1
0 5 10 15 20 25Wall porosity (%)
Cp i
n m
ean
Analytical, Conf. A2 & B2 (Cpw = 0.75, Cpl = -0.46)
Analytical, Conf. C2 & D2 (Cpw = 0.6, Cpl = -0.46)
-0.2
0
0.2
0.4
0.6
0.8
1
1.2
1.4
0 5 10 15 20 25
Wall porosity (%)
Cpi
n m
ean
Conf. ALeeward outletSide wall outletConf. BLeeward outletSide wall outletConf A leeConf B leeconf A sideConf B sideConf C leeeconf C sideconf C -leeconf C -side
-0.2
0
0.2
0.4
0.6
0.8
1
-5 5 15 25
Wall porosity (%)
Cp
in m
ean
Conf . A
Conf . B
Conf . C
Conf . D
A naly tical, Conf . A & B (Cpw= 0.75, Cpl = -0.15)
A naly tical, Conf . C & D (Cpw =0.6, Cpl = -0.15)
-0.2
0
0.2
0.4
0.6
0.8
1
-5 5 15 25
Wall porosity (%)
Cpi
n m
ean
Conf . A
Conf . B
Conf . C
Conf . D
Analytical, Conf . A & B (Cpw= 0.75, Cpl = -0.15)
Analytical, Conf . C & D (Cpw =0.6, Cpl = -0.15)
0
0.2
0.4
0.6
0.8
1
1.2
1.4
0 5 10 15 20 25Wall porosity (%)
Cp i
n pe
ak
NBCC (2005)
Figure 7. Mean and peak internal pressure coefficients for configurations A2, B2, C2, and D2 with 5%blockage.

10
equal to 2) boundary of the code (see Table 2) is considered. For configurations with inletopenings located above the mid-height of the building (A1, B1, A2, B2) measured peak Cpinvalues are higher than 0.7 but less than the upper code limit of 1.4, therefore consideration of angust effect factor (equal to 2 as specified by the code) may be more appropriate. Forconfigurations with inlet openings located below the mid-height of the building (C1, D1, C2 andD2), measured peak Cpin values are lower than 0.7, therefore, using a gust effect factor for theseconfigurations may be a conservative approach.
Peak internal pressure coefficients for configurations A1 and C1 with Aw = 5%, 10%, and 20%,different inlet-to-outlet ratios and 20% blockage are presented in Figure 8 together with results ofprevious studies, as well as NBCC provisions for building category 3. Measured peak Cpinvalues are significantly lower compared to previous studies mainly due to the lower intensitylevels at the building height (13% vs. 20%). Previous work of Wu et al. (1998) has shown thatpeak internal pressure coefficients are significantly affected by the turbulence intensity. PeakCpin values were found to exceed the recommended design value, i.e. 1.4 for configurations with
-1.5
-1
-0.5
0
0.5
1
1.5
2
2.5
3
0.1 1 10A1/A2
Cp i
n pea
k
Womble (1994), BLWT, T.I. = 20%, 0.025%Aw = 5%Aw = 33%Ginger et al. (1995), field, T.I. = 20%, 0.025%Aw = 5%
NBC (2005)
NBCC (2005)
Figure 8. Peak internal pressure coefficients for configurations A1 and C1 with Aw = 5%, 10%, and 20%,different inlet-to-outlet ratios, and 20% blockage - comparison with previous studies and NBCC (2005).
Table 2. Internal pressure coefficients, after NBCC (2005).Category Cpin Comments
1 -0.15 to 0Buildings without large or significant openings but havingsmall uniformly distributed openings amounting to less than
0.1% of total surface area
2 -0.45 to 0.3Buildings in which significant openings are expected to be
closed during a storm but in which background leakagemay not be uniformly distributed
3 0.7 to – 0.7Buildings with large or significant openings (through which
gusts are transmitted to the interior) which have a highprobability of being open during a storm

11
A1/A2 ≥ 2 and large openings located above the mid-height of the building (configuration A1).Peak Cpin values for configuration A1 with A1/A2 < 2 and configuration C1 (for all inlet-to-outletratios) are within the limits specified by the code. An internal gust effect factor should be usedfor configurations A1 and C1 with A1/A2 > 1, while consideration of a gust effect factor forA1/A2 < 1 may be too conservative.
SUMMARY AND CONCLUSIONS
The present study investigates the effect of wall porosity, inlet-to-outlet-ratio, opening location,and blockage on internal pressure in buildings with large façade openings, considering data fromsimultaneous measurements on multiple internal pressure taps. The study found that internalpressures are not uniform in buildings with cross-openings, particularly for configurations withwall porosity higher than 10%. Differences among taps can be up to Cp = 0.3 for the means andCp = 0.53 for the peaks for configurations with inlet and outlets located on adjacent walls, non-symmetric openings, and 20% wall porosity.
Results show that blockage of the internal volume may significantly affect mean and peakinternal pressure coefficients, particularly for configurations with blockage ratio higher than20%, and outlets located on leeward wall and/or below the mid-height of the building. It isimportant to note that different blockage ratios were modelled using a rather approximatemethod; thus, further testing should consider a more realistic approximation of blockage of theinternal volume so as results can be generalized to real building conditions.
The internal airflow field has a significant impact on mean and peak values of the internalpressure in buildings with cross-ventilation. For example, for the same inlet-to-outlet-ratio, themean and peak internal pressure coefficient is higher up to a factor of 2.6 and 1.65 respectivelyfor configurations with non-symmetric openings compared to configurations with symmetricopenings. It should be noted that these influences cannot be predicted by the existing theory andshould be introduced in the theoretical equation.
The study found that peak internal pressures in buildings with cross-openings may be critical,particularly for configurations with large porosities and/or high blockage ratios. Peak valueswere found to exceed the recommended design value for building category 3 (NBCC, 2005), forconfigurations with openings located above the mid-height of the building, leeward outlets, andA1/A2 ≥ 2. A gust factor should be considered for configurations with openings above the mid-height of the building and configurations with openings below the mid-height of the buildingwith A1/A2 > 1. Results presented in this paper are limited to upstream open terrain simulation.Future work should involve sensitivity analysis tests for other velocity and turbulence intensityprofiles. Comparisons with ASCE 7-05(2005) should be performed in order to establish aframework for the development of design guidelines that could be potentially added in windcodes / standards.
REFERENCES
ASCE, 2005. Minimum design loads for buildings and other structures. ASCE 7-05, Reston, Va.
Aynsley, R.M., Melbourne, W., Vickery, B.J., 1977. Architectural Aerodynamics. Applied SciencePublishers LTD, London.

12
Choiniere, Y., Tanaka, H., Munroe, J.A., Suchorski-Tremblay, A., 1992. Prediction of wind inducedventilation for livestock housing. Journal of Wind Engineering and Industrial Aerodynamics 41-44, 2563-2574.
Cochran, L., Peterka, J., 2001. On breached building envelopes and increased internal pressures.International conference on Building envelope systems and technologies (ICBEST-2001), Ottawa,Canada.
Ginger, J.D., Yeatts, B.B., Mehta, K.C., 1995. Internal pressures in a low-rise full-scale building.Proceedings of the 9th International Conference on Wind Engineering 3, 512-523, New Delhi, India,January 9-13.
Ho, T. C. E., Surry, D., Morrish, D., Kopp, G. A., 2005. The UWO contribution to the NIST aerodynamicdatabase for wind loads on low buildings. 1: Archiving format and basic aerodynamic data. Journal ofWind. Engineering and Industrial Aerodynamics 93 (1), 1–30.
Holmes, J.D., 1979. Mean and fluctuating internal pressures induced by wind. Proceedings of 5thInternational Wind Engineering Conference, 435-450, Fort Collins, Colorado, July 8-13.
Hu, C-H., Kurabuchi, T., Ohba, M., 2005. Numerical study of cross-ventilation using two-equation RANSturbulence models. International Journal of Ventilation 4 (2), 123-132.
Irwin, P.A., 2007. Wind engineering challenges of the new generation of super-tall structures. 12thInternational Conference on Wind Engineering, Cairns, Australia.
Karava, P., 2008. Airflow prediction in buildings for natural ventilation design – wind tunnelmeasurements and simulation. Ph.D. Thesis, Department of Building, Civil and EnvironmentalEngineering, Concordia University, Montreal, Canada.
Karava, P., Stathopoulos, T., Athienitis, A.K., 2007. Wind-driven natural ventilation analysis.International Journal of the Solar Energy Society 81, 20-30.
Kopp, G. A., Oh, J. H., Inculet, D. R.,2008. Wind-Induced Internal Pressures in Houses. ASCE Journal ofStructural Engineering 134, 1129-1138
Liu, H., 1991. Wind Engineering – A handbook for structural engineers. Prentice-Hall, New Jersey.
Liu, H., Rhee, K.H., 1986. Helmholtz oscillation in building models. Journal of Wind Engineering andIndustrial Aerodynamics 24, 95-115.
Munarin, J., 1978. Wind tunnel measurements on internal pressures in a two storey house. B.E. thesis,Department of Civil and Systems Engineering, James Cook University.
Murakami, S., Kato, S., Akabashi, S., Mizutani, K., Kim, Y-D., 1991. Wind tunnel test on velocity-pressurefield of cross-ventilation with open windows. ASHRAE Transactions 97 (1), 525-538.
NBCC, 2005. National Building Code User’s Guide, National Research Council of Canada, Ottawa.
Oh, J.H., Kopp, G.A., Inculet, D.R., 2007. The UWO contribution to the NIST aerodynamic database forwind loads on low buildings: Part 3. Internal pressures. Journal of Wind Engineering and IndustrialAerodynamics 95, 755–779.

13
Pearce, W., Sykes, D.M., 1999. Wind tunnel measurements of cavity pressure dynamics in a low-riseflexible roofed building. Journal of Wind Engineering and Industrial Aerodynamics 82, 27-48.
Saathoff, P.J., Liu, H., 1983. Internal pressure of multi-room buildings. ASCE Journal of EngineeringMechanics 109 (EM3), 908-919.
Sawachi. T., Narita, K., Kiyota, N., Seto, H., Nishizawa, S., Ishikawa, Y., 2004. Wind pressure and airflowin a full-scale building model under cross ventilation. International Journal of Ventilation 2 (4), 343-357.
Seifert, J., Li, Y., Axley, J., Rosler, M., 2006. Calculation of wind-driven ventilation in Buildings withlarge openings. Journal of Wind Engineering and Industrial Aerodynamics 94, 925-947.
Sharma, R. N. (2003).” Internal pressure dynamics with Internal Partitioning”. Proceedings of, 11thInternational Conference of Wind Engineering, 705–712, Lubbock, Texas.
Stathopoulos, T., Surry, D., 1983. Scale effects in wind tunnel testing of low buildings. Journal of WindEngineering and Industrial Aerodynamics 13 (1-3), 313-326.
Stathopoulos, T., Surry, D., Davenport, A.G. (1979). “Internal pressure characteristics of low-risebuildings due to wind action”. Proceedings of the 5th International Wind Engineering Conference 1, 541-463, Forth Collins, Colorado USA.
Straw, M.P., Baker, C.J., Robertson, A.P., 2000. Experimental measurements and computations of thewind-induced ventilation of a cubic structure. Journal of Wind Engineering and Industrial Aerodynamics88, 213-230.
Womble, J.A., 1994. Wind-induced internal building pressures. Master’s thesis, Department of CivilEngineering, Colorado State University, Fort Collins, Colorado.
Womble, J.A., Yeatts, B.B., Cermak, J.E., Mehta, K.C., 1995. Internal wind pressures in a full and small-scale building. Proceedings of the 9th International Conference on Wind Engineering, 3, 1079-1090, NewDelhi, India, January 9-13.
Wu, H., Stathopoulos, T., Saathoff, P., 1998. Wind-induced internal pressure revisited: low-rise buildings.In: Srivastava, N.K., (Ed.), Proceeding of Structural Engineers World Congress, ISBN: 0-08-042845-2,San Francisco, CA, U.S.A., July 19-23.