Embed Size (px)
Citation preview

Wind Dispatch Down Reports
User guide
29 July 2016

Wind Dispatch Down Reports – User Guide V1.1 • 29/07/2016
Page 1
1. PURPOSE OF DOCUMENT
The purpose of this document is to provide information on the data inputs, the calculation
methodology and the outputs for the wind dispatch down reports which use information
from the Wind Dispatch Tool in use in the Belfast and Ireland and Northern Ireland
control rooms.
2. BACKGROUND
The EU Renewable Energy Directive (2009/28/EC) requires TSOs to prioritise renewable
energy generation. Sometimes measures are taken to turn-off or dispatch-down
renewable energy for system security reasons. In these circumstances TSOs must
report this to the regulatory authorities.
In 2011 the TSOs began publishing an annual renewable dispatch down report to satisfy
the requirements set out in the EU Renewable Energy Directive. This report used data
available from the Single Electricity Market (SEM) for a certain type1 of controllable
windfarm in Ireland and Northern Ireland. The data in SEM did not define whether
dispatch down was due to curtailment or constraint, therefore this was estimated by the
TSOs based on an agreed set of assumptions with industry, as outlined in the annual
reports.
Since 2013 the TSOs have issued quarterly reports to a certain type1 of controllable
windfarm in Ireland and Northern Ireland. The reports and the assumptions were
developed in conjunction with industry through the DS3 Advisory Council in order to aid
transparency on the level of curtailment and constraint applied to windfarms. Similar to
the annual reports, the differentiation of the level of curtailment and constraint is
estimated based on available data. These reports were issued one quarter in arrears as
the full data set was not available until then.
In late 2014 a new all-island wind dispatch tool went operational in both control centres in Ireland and Northern Ireland. This new wind dispatch tool introduced a number of improvements over the existing systems which were in use to dispatch down-wind as follows:
1. Improved distribution of curtailment levels for controllable windfarms was achievable;
2. Clear categorisation between curtailment or constraint; 3. Clear reasons for why a curtailment or constraint was applied called a ‘reason
code’ was now available; 4. Easier access to dispatch instructions and windfarm data; 5. Each instruction is timestamped with instruction time.
1 The data obtained was for windfarms which were registered in the SEM as Variable Price
Taking Generators (VPTGs). The level of constraint and curtailment for Autonomous Price Taking Generators (APTGs) was estimated based on the level of constraint and curtailment applied to VPTGs.

Wind Dispatch Down Reports – User Guide V1.1 • 29/07/2016
Page 2
Due to these improvements the TSOs committed to investigating whether a more
accurate report could be issued to all controllable windfarms, therefore removing the
need to estimate the level of curtailment and constraint applied. Over the last nine
months the TSOs have engaged with Industry on developing a new report template and
calculation methodology using more accurate data from the Wind Dispatch Tool used by
the control centres in Ireland and Northern Ireland.

Wind Dispatch Down Reports – User Guide V1.1 • 29/07/2016
Page 3
3. OVERVIEW OF WIND DISPATCH DOWN REPORTS
3.1. Data Inputs
Active Power Output: The one minute SCADA MW signal of the active power output received from the windfarm will be used in the calculation as this real-time signal received from the windfarm is used by the Wind Dispatch Tool when calculating the level of pro-rata dispatch down to be applied to an individual windfarm. This one minute value is then averaged to a 30 minute value which will be made available in the excel report due to the volume of data. Note that this 30 minute aggregated value will differ from the metered active power output as it is based on the windfarms own SCADA value; Available Active Power: The one minute SCADA MW signal of the available active power received from the windfarm will be used in the calculation as this real-time signal received from the windfarm is used by the Wind Dispatch Tool when calculating the level of pro-rata dispatch up to be applied to an individual windfarm. This one minute value is then averaged to a 30 minute value which will be made available in the report due to the volume of data. For the avoidance of doubt this signal is subject to minimum quality standards as set out by the TSOs. If the windfarm signal is outside of the minimum quality standards as reported by the TSOs for any one month period during a reporting period then this could result in the level of curtailments and/or constraints applied to this windfarm being disproportional when compared to other windfarms, due to the inaccuracies in the signal sent by the windfarm to the TSOs. This windfarm should cross check the signal accuracy reports in the first instance if there are any queries in relation to the level of dispatch down applied; Dispatch Instruction: The instructed curtailment or constraint MW value, with the exact date and time, will be used in the calculation as per that issued by the Wind Dispatch Tool. Each curtailment and constraint also has a corresponding reason code applied by the control rooms which will also be included in the report. Dispatch Down by the TSOs is considered applicable if the following reason codes are used:
Curtailment o System Non-Synchronous Penetration (SNSP) Issue o Rate of Change of Frequency (RoCoF)/Inertia o High Frequency/Minimum Generation
Constraint o TSO Constraints
TSO Testing
If the following reason codes are utilised the dispatch down is considered to be outside of the control of the TSOs:
Developer Testing
Developer Outage
DSO Constraints

Wind Dispatch Down Reports – User Guide V1.1 • 29/07/2016
Page 4
Windfarm Capacity: The minimum of the installed capacity (MW) and Maximum Export Capacity (MW) will also be used in the reports;
Region: The geographical region in which the windfarm is located will be reported as follows:
Ireland: North West (NW), West (W), South West (SW), South East (SE), North East (NE) and Midlands (M).
Northern Ireland A list of the windfarms and the corresponding categories can be found in Appendix A. Contact Details: The reports will be issued by email to all controllable distribution and transmission windfarms in Ireland and Northern Ireland. The TSOs will keep a contact list for each windfarm and it will be the responsibility of the windfarm to ensure their contact details are kept up to date. Any changes should be notified to [email protected].

Wind Dispatch Down Reports – User Guide V1.1 • 29/07/2016
Page 5
3.2. Calculation The dispatch down energy level of a windfarm is generally defined as the difference between its Available Active Power and Dispatch Instruction. In the case of simultaneous constraint and curtailment Dispatch Instructions the TSOs propose using a methodology called fixed horizontal slicing for dispatch down and dispatch up, with a minor difference for removing an active curtailment.
3.2.1. Dispatch Down The wind dispatch tool issues Dispatch Down Instructions to windfarms on a pro-rata basis according to their Active Power output at that point in time. The type of dispatch down, either curtailment or constraint, therefore applies to the Active Power values only below this point and down to the new Dispatch Instruction and hence the fixed horizontal slicing approach. The fixed horizontal slicing is shown in Figure 1 and a worked example of this is included in Table 1. In Figure 1 the curtailment layers are coloured green and constraints blue. The Dispatch Instructions are listed along with every Dispatch Instruction (layer), e.g. “CURL 20” indicates a curtailment Dispatch Instruction issued to the windfarm down to 20 MW and LOCL 15 indicates a local constraint Dispatch Instruction issued to the windfarm down to 15 MW. In the case of reduction of the Active Power Output, the layers above the new Dispatch Instruction remain categorised as they were initially i.e. colour on the way down.
3.2.1. Dispatch Up When an active Dispatch Instruction is relaxed then the horizontal slicing cuts through the layers. As shown in Figure 1 when a constraint Dispatch Instruction to 27 MW (LOCL 27) is issued i.e. do not colour on the way up. Note that if a curtailment is relaxed then this is limited by the lowest active constraint if applicable. There is however an exception to this approach when there was both curtailment and constraint on a windfarm and the active curtailment is fully removed. In this instance it would not be appropriate to continue to categorise some of the dispatch down volume as curtailment. In this instance the volume of dispatch down will be categorised as constraint. An example of this is shown in Figure 2.

Wind Dispatch Down Reports – User Guide V1.1 • 29/07/2016
Page 6
Figure 1 – Horizontal Slicing Methodology
Time Available
Active Power (MW)
Dispatch Instruction
Total Constraint (MW) Total Curtailment (MW)
15:00 47 NA 0 0
15:30 47 CURL 30 0 (47 – 30) = 17
16:00 47 LOCL 25 (30 – 25) = 5 (47 – 30) = 17
16:30 47 CURL 20 (30 – 25) = 5 (47 – 30) + (25-20 ) = 22
17:00 47 LOCL 15 (30 – 25) + (20 -15) = 10 (47 – 30) + (25-20 ) = 22
20:30 47 LOCL 27 (30-27) = 3 (47 – 30) = 17
Table 1: Worked example of Horizontal Slide example in Figure 1
Figure 2 – Horizontal Slicing Methodology during Curtailment removal
Windfarm Capacity = 50MW
Availabile Active Power = 47MW
Curtailment - Reason Code 1
Constraint - Reason Code 2
Curtailment - Reason code 3
Constraint - Reason Code 4
AAP 47
CURL 30
LOCL 25
CURL 20
LOCL 15
Curtailment Removal
Constraint Reason Code 2
Constraint Reason Code 4
Time
Act
ive
Po
we
r (M
W)

Wind Dispatch Down Reports – User Guide V1.1 • 29/07/2016
Page 7
The following calculations are carried out for each minute in the reporting period: Where DD is the Dispatched Down Volume in MWh
AO is the Actual Output in MW AV is the Available Active Power in MW MX: Variables used to store intermediate DD levels for each layer in MW.
DD is initially calculated in MW for each minute and these values are aggregated at the end and converted to MWh. If there is no active dispatch instruction then:
Available Active Power is reset to Active Power Output and DD = 0 MW. If there are n active setpoints, denoted by M1, M2… Mn then:
Total DD = Max[AV – Max[AO, Mn], 0]
The DD amount of each layer is aggregated into its own category as well depending on type (Curtailments / constraints) and reason (SNSP issue, transmission constraint, inertia, etc.) These DD layers are calculated individually every minute as follows:
DDLayer X = Max[ Min[MX-1, AV] – Max[AO, MX], 0] Where M0 = Available Active Power
Finally, all DD values are converted to energy equivalents (MWh) and aggregated for the duration of the reporting period. This is achieved by dividing the total one-minute MW values by 60 in order to convert to MWh.

Wind Dispatch Down Reports – User Guide V1.1 • 29/07/2016
Page 8
3.3. Reporting The reports will be issued quarterly to each controllable windfarm on the distribution and
transmission system. The quarterly reports will be issued from 2016 and will be issued
one month following the end of each quarter2.
The reports will consist of three aspects as follows:
A. Individual Windfarm Report (PDF)
This will be a .pdf containing a monthly breakdown of the dispatch down
of the windfarm and also the quarterly average. A sample is included in
Appendix B;
A comparison to the previous quarter will also be shown (from Q1 2016);
A comparison to the overall all-island dispatch down of controllable
windfarms. Note that this figure does not contain uncontrollable wind,
therefore this figure is not the definitive all-island dispatch down figure
and is included here for comparison purposes only. The overall all-island
dispatch down is included in the Overall Wind Dispatch Down Report;
B. Individual Windfarm Report (Excel .xls)
This contains the aggregated 30 minute Available Active Power, Active
Power Output and breakdown of the dispatch down reason codes;
The individual dispatch instructions with the effective time, broken down
into curtailment and constraints, are also included;
Note that periods in which there were no active Dispatch Instructions will
be adjusted so that Available Active Power is set equal to the Active
Power Output so to avoid the calculation of incorrect dispatch down
volumes.
C. Overall Wind Dispatch Down Report (PDF)
This contains the aggregated dispatch down figures for Ireland, Northern
Ireland and all-island. A sample is included in Appendix B;
The figures include all wind i.e. it includes non-controllable wind;
Contains the definitive dispatch down percentages.
2 The first reports for Q1 2016 were issued two months following the end of the quarter to allow the TSOs further time to test the new system being used to prepare these reports.

Wind Dispatch Down Reports – User Guide V1.1 • 29/07/2016
Page 9
4. QUERIES
The TSOs will be freezing the calculation methodology and reporting templates for 12
months following the publication of the first batch of reports in May 2016.
If you have any questions on the calculation methodology or report template which is not
covered within this user guide please contact [email protected].

Wind Dispatch Down Reports – User Guide V1.1 • 29/07/2016
Page 10
APPENDIX A
Windfarm Region
Windfarm Region
Windfarm Region
Bruckana M
Athea SW
Altahullion 1 NI
Garracummer M
Ballincollig Hill SW
Altahullion 2 NI
Glenough M
Ballybane 1 SW
Bessey Bell 1 NI
Gortahile M
Ballybane 2 SW
Bessey Bell 2 NI
Hollyford M
Bawnmore SW
Bin Mountain NI
Kill Hill M
Boggeragh 1 SW
Callagheen NI
Lisheen 1 M
Boggeragh 2 SW
Carn Hill NI
Lisheen 2 M
Caherdowney SW
Carrickatane NI
Monaincha Bog M
Carraigcannon SW
Churchill NI
Mountlucas M
Clahane SW
Corkey NI
Mountain Lodge NE
Cloghboola SW
Crighshane NI
Mullananalt NE
Coomacheo SW
Crockagarran NI
Ratrussan NE
Coomagearlahy 1 SW
Curryfree NI
Beam Hill NW
Coomagearlahy 2 SW
Dunbeg NI
Binbane 1 NW
Coomagearlahy 3 SW
Dunmore NI NI
Corkermore NW
Coomatallin SW
Elliots Hill NI
Drumlough Hill NW
Dromada SW
Garves NI
Flughland NW
Dromdeeveen SW
Gruig NI
Golagh 1 NW
Garranereagh SW
Hunters Hill NI
Loughderryduff NW
Glanlee SW
Lendrums Bridge NI
Meenachullalan NW
Gneeves SW
Lough Hill NI
Meentycat NW
Grouse Lodge SW
Molly Mountain NI
Sorne Hill NW
Kealkil SW
Monnaboy NI
Spaddan NW
Knockacummer SW
Owenreagh 1 NI
Altagowlan W
Knockaneden SW
Owenreagh 2 NI
Black Banks 2 W
Knockawarriga SW
Rigged Hill NI
Booltiagh 1 W
Knocknagoum SW
Screggagh NI
Booltiagh 2 W
Muingnaminnane SW
Seegronan NI
Carrickheeney W
Rathcahill West SW
Slieve Divena NI
Carrowleagh W
Taurbeg SW
Slieve Kirk NI
Derrybrien W
Tournafulla 1 SW
Slieve Rushen NI
Faughary W
Tournafulla 2 SW
Snugborough NI
Garvagh 1 W
Arklow 1 SE
Tappaghan NI
Garvagh 2 W
Ballycadden 1 SE
Thornog NI
Kingsmountain 1 W
Ballycadden 2 SE
Wolf Bog NI
Kingsmountain 2 W
Ballymartin 1 SE
Knockastanna W
Ballymartin 2 SE
Lackan W
Ballywater SE
Leitir Guingaid W
Barranafaddock SE
Raheen Barr 2 W
Castledockrell SE
Spion Kop W
Cronelea 1 SE
Tullynamoyle W
Cronelea 2 SE
Gibbet Hill SE
Knocknalour SE
Richfield SE
Woodhouse SE

Wind Dispatch Down Reports – User Guide V1.1 • 29/07/2016
Page 11
APPENDIX B
Individual Windfarm Report Template
Qtr1, 2016
MWh % MWh % MWh % MWh %
1,500 6.0% 2,200 11.0% 4,000 19.0% 7,700 11.7%
1,000 4.0% 1,500 7.5% 3,000 14.3% 5,500 8.3%
500 2.0% 700 3.5% 1,000 4.8% 2,200 3.3%
MWh % MWh % MWh % MWh %
300 30.0% 1,000 66.7% 1,000 33.3% 2,300 41.8%
500 50.0% 1,500 100.0% 1,500 50.0% 3,500 63.6%
200 20.0% 500 33.3% 500 16.7% 1,200 21.8%
200 40.0% 400 57.1% 450 45.0% 1,050 47.7%
300 60.0% 200 28.6% 550 55.0% 1,050 47.7%
0 0.0% 100 14.3% 0 0.0% 100 4.5%
MWh % MWh % MWh % MWh %
200 40.0% 150 10.0% 1,500 100.0% 1,850 52.9%
200 40.0% 350 23.3% 500 33.3% 1,050 30.0%
100 20.0% 0 0.0% 0 0.0% 100 2.9%
48%
3% DSO Constraints
(1,050 MWh)
Other Reductions
(2,200 MWh)
48%
Developer Outage
(1,050 MWh)
5%
Developer Testing
(100 MWh)
30%
Curtailments
(3,500 MWh)
ROCOF / Inertia
(1,050 MWh)
22% 3%
Testing
(1,200 MWh)
High Freq / Min Gen
(100 MWh)
64%
Total Generation
(42,000 MWh)
42% 53%
Total Available
Energy
(66,000 MWh)
8% TSO Constraints
(2,300 MWh)
SNSP Issue
(1,850 MWh)
TSO Dispatch
Down
(5,500 MWh)
64%
TSO Dispatch Down - Same Region (SW) Controllable Wind 7.1% 6.8% 3.7% 6.1%
TSO Dispatch Down - All Island Controllable Wind 4.1% 3.7% 2.4% 3.5%
All Island and Regional Comparison:
Developer Testing
Curtailments:
SNSP Issue
ROCOF / Inertia
High Freq / Min Gen
TSO Constraints
Curtailments
TSO Testing
Other Reductions:
DSO Constraints
Developer Outage
Total Energy Reduction from Availability:
TSO Dispatch Down
Other Reductions
TSO Dispatch Down:
Total Generation (MWh) 23,500 17,800 58,300 42,000
Total Available Energy (MWh) 25,000 20,000 21,000 66,000
Month / Quarter Jan Feb Mar Qtr1
Windfarm A TSO 100 Ireland SW
Year 2016 2016 2016 2016
Windfarm A Quarterly Dispatch Down ReportDRAFT
Windfarm Connection Size (MW) Jurisdiction Region
Wind Dispatch Down Reports – User Guide V1.1 • 29/07/2016
Page 12
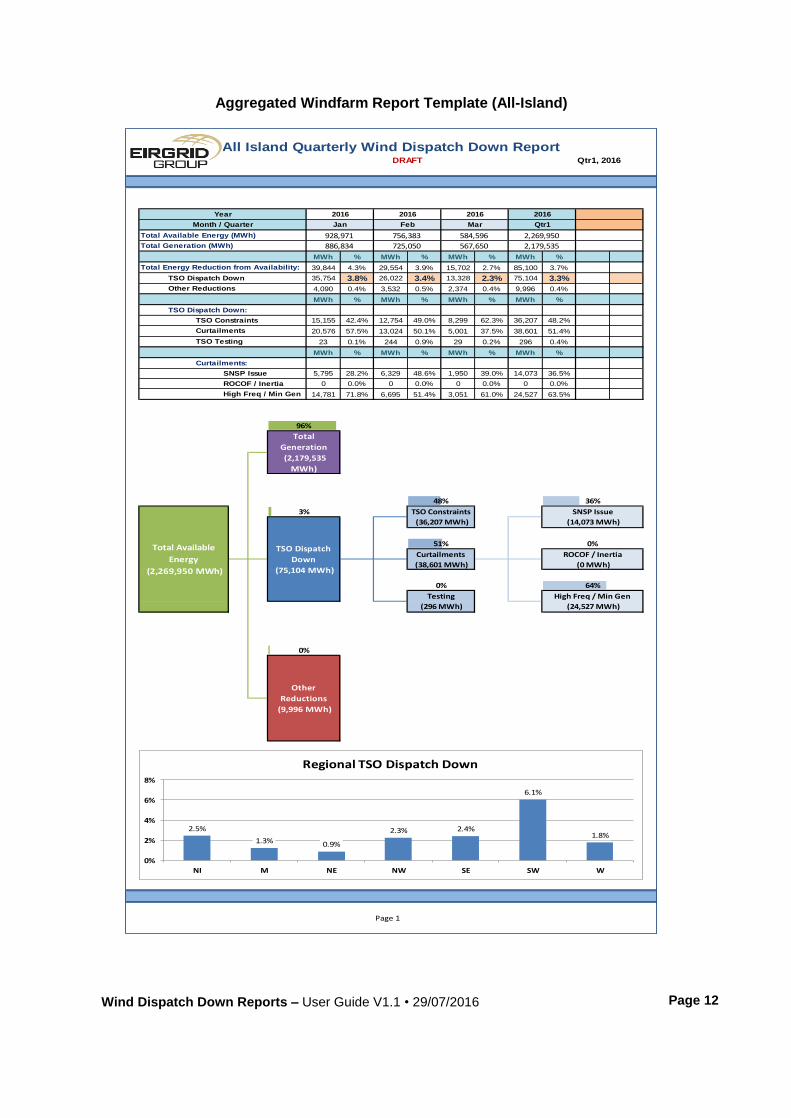
Aggregated Windfarm Report Template (All-Island)
Qtr1, 2016
MWh % MWh % MWh % MWh %
39,844 4.3% 29,554 3.9% 15,702 2.7% 85,100 3.7%
35,754 3.8% 26,022 3.4% 13,328 2.3% 75,104 3.3%
4,090 0.4% 3,532 0.5% 2,374 0.4% 9,996 0.4%
MWh % MWh % MWh % MWh %
15,155 42.4% 12,754 49.0% 8,299 62.3% 36,207 48.2%
20,576 57.5% 13,024 50.1% 5,001 37.5% 38,601 51.4%
23 0.1% 244 0.9% 29 0.2% 296 0.4%
MWh % MWh % MWh % MWh %
5,795 28.2% 6,329 48.6% 1,950 39.0% 14,073 36.5%
0 0.0% 0 0.0% 0 0.0% 0 0.0%
14,781 71.8% 6,695 51.4% 3,051 61.0% 24,527 63.5%
Page 1
All Island Quarterly Wind Dispatch Down ReportDRAFT
Month / Quarter Jan Feb Mar Qtr1
Year 2016 2016 2016 2016
Total Generation (MWh) 886,834 725,050 567,650 2,179,535
Total Available Energy (MWh) 928,971 756,383 584,596 2,269,950
TSO Dispatch Down:
TSO Constraints
Curtailments
TSO Testing
Total Energy Reduction from Availability:
TSO Dispatch Down
Other Reductions
96%
Total
Generation
(2,179,535
MWh)
48% 36%
SNSP Issue
ROCOF / Inertia
High Freq / Min Gen
Curtailments:
0%
Other
Reductions
(9,996 MWh)
Total Available
Energy
(2,269,950 MWh)
3% TSO Constraints
(36,207 MWh)
SNSP Issue
(14,073 MWh)
TSO Dispatch
Down
(75,104 MWh)
51% 0%
Curtailments
(38,601 MWh)
ROCOF / Inertia
(0 MWh)
0% 64%
Testing
(296 MWh)
High Freq / Min Gen
(24,527 MWh)
2.5%
1.3% 0.9%
2.3% 2.4%
6.1%
1.8%
0%
2%
4%
6%
8%
NI M NE NW SE SW W
Regional TSO Dispatch Down

Wind Dispatch Down Reports – User Guide V1.1 • 29/07/2016
Page 13
FREQUENTLY ASKED QUESTIONS (FAQ)
1. Why does the Available Energy ≠ Generation + TSO Dispatch Down + Other
Reductions?
The purpose of the reporting is to quantify the volume of dispatch down instructed by the TSOs. In certain instances a windfarm may not correctly follow the dispatch instruction issued by the TSOs due to issues with their control system. These issues are outside of the control of the TSO, therefore as outlined in Section 3.2 the calculation of the volume of the dispatch down is:
Total DD = Max[AV – Max[AO, Mn], 0] 3
A graphical example of uninstructed dispatch is shown in Figure 3.
Figure 3 – Uninstructed Dispatch Down
2. Can I get the data prior to 2016?
The new dispatch down reports were designed to utilise data from the all island wind dispatch tool and the new Energy Management System (EMS). The data is readily available from 2016 onwards. Prior to 2016 the data is contained in several different databases with different sampling rates. The extraction of this data is manual and resource intensive. Prior to the freeze of the application design no feedback was received from windfarms that information prior to 2016 was required, therefore these requests cannot be facilitated at present.
3 A detailed description of this calculation is provided in Section 3.2.
0
10
20
30
40
50
60
05:00:00 07:00:00 09:00:00 11:00:00 13:00:00 15:00:00 17:00:00
Act
ive
Po
wer
(M
W)
Available Active Power (MW)
Active Power Output (MW)
Dispatch Instruction (MW)
Uninstructed Dispatch Up
Uninstructed Dispatch Down

Wind Dispatch Down Reports – User Guide V1.1 • 29/07/2016
Page 14
3. Can greater resolution data be provided for 2016? One minute data for the Available Active Power and Active Power Output are utilised in the application used to create the report. Due to the volume of data per windfarm per quarter (over 250,000 rows of data) it was decided to aggregate this data to 30 minute to reduce the size of the .xls files issued to windfarms. Prior to the freeze of the application design no feedback was received from windfarms that higher resolution data was required, therefore these requests cannot be facilitated at present. The Enhanced Performance Monitoring system is due to go-live in Q4 2016 and this will provide all generating units with access to higher resolution data.
4. Why is the data in the previous report different to the most recent version? Once the quarterly reports are issued we may be notified of an issue with data for certain windfarms e.g. Available Active Power signal may be incorrect. This data is checked and corrected where appropriate and when we carry out the next batch of quarterly reports there may therefore be minor changes in volumes and percentages of dispatch down. The customer should also therefore use the most recent version of the reports issued.

Wind Dispatch Down Reports – User Guide V1.1 • 29/07/2016
Page 15
ABBREVIATIONS
TSO Transmission System Operator
SEM Single Electricity Market
VPTG Variable Price Taking Generator
APTG Autonomous Price Taking Generator
SCADA Supervisory Control and Data Acquisition
MW Megawatt
MWh Megawatt Hour
CURL Curtailment
LOCL Constraint
AAP Available Active Power
DD Dispatch Down
AO Actual Output
AV Available Active Power
MX Variables used to store intermediate DD levels for each layer in MW