Embed Size (px)
Citation preview

D Lindley: Energy 2100. 08.05.06 1
Wind and Tidal Energy
- a vision of the future ??
Dr David Lindley: Ocean Power Delivery Ltd
Energy 2100: The Royal Academy of Engineering: 8 May 2006

World wind energy capacity (MW)
0
10000
20000
30000
40000
50000
60000
70000
1996 1997 1998 1999 2000 2001 2002 2003 2004 2005
Cumulative
Annual
D Lindley: Energy 2100. 08.05.06 2

% electricity produced by wind energy
0
2
4
6
8
10
12
14
16
18
Denmar
kSpa
in
German
y
Portu
gal
Irelan
d
Greec
e NL
Austri
aIta
ly
Luxem
bourg
Latvia UK
Sweden
Estonia
Norway
EU25
D Lindley: Energy 2100. 08.05.06 3

The sixteen leading wind countries
0
2000
4000
6000
8000
10000
12000
14000
16000
18000
20000
German
yUSASpa
inIndia
Denmar
kChin
aIta
ly UK NLPor
tuga
lAus
tralia
Canad
aAus
tria
Franc
eGre
ece
Sweden
D Lindley: Energy 2100. 08.05.06 4

Wind Energy as a % of total installed capacity
-2.000.002.004.006.008.00
10.0012.0014.0016.0018.0020.00
1975 1980 1985 1990 1995 2000 2005 2010
Spain USA Germany UK
D Lindley: Energy 2100. 08.05.06 5

The largest owners of wind farms
D Lindley: Energy 2100. 08.05.06 60
500
1000
1500
2000
2500
3000
FPLIberdrolaEHNPPM SPEurusShellEndesaEnergi E2NuonAlliantElsamENEL

D Lindley: Energy 2100. 08.05.06 7
Current Practice and Future Trends
Offshore wind (Round II) c.7GW
Wind - 2020?
Existing wind farms c. 890MW to date
IrelandGB
Applications for connection c. 18GW
Also 1GW offshore (Round I)plus onshore in England and Wales
UPDATE: As of May 2006 operational wind farms ~1400 MW and 1100MW under construction

^
^̂^
^
^
^^
^ ^ ^
^
^
^^
^^Lely
Emden
Blyth
Nysted
Samsoe
VindebyHorns Rev
Tuno KnobUtgrunden
Arklow Bank
Bockstingen
Scroby Sands Irene Vorrink
Middelgrunden
Frederikshaven
North Hoyle
Yttre Stengrund
Existing Offshore Wind farms: 2004
606.6 MW
D Lindley: Energy 2100. 08.05.06 8

^
^̂
^̂
^
^
^̂
^^
^
^̂^
^
^
^^
^ ^ ^
^
^
^^
^^Lely
Emden
Blyth
Nysted
Samsoe
VindebyHorns Rev
Tuno KnobUtgrunden
Arklow Bank
Bockstingen
Scroby Sands Irene Vorrink
Middelgrunden
Frederikshaven
Q7
Lynn
BarrowButendiek
Robin Rigg
Borkum West
Thornton Bank
Inner Dowsing
Kentish Flats
North Hoyle
Yttre Stengrund
Nordzeewind
Gunfleet Sands
Offshore Wind Farms : 2009 ?
>2000MW
D Lindley: Energy 2100. 08.05.06 9

Offshore turbines will be “different”
5m per annum
15 MW205 m
316 kW per annum 170m10 MW
2004 …………20201990
D Lindley: Energy 2100. 08.05.06 10

Wind Energy Development Trends
0
500
1,000
1,500
2,000
2,500
1981
1982
1983
1984
1985
1986
1987
1988
1989
1990
1991
1992
1993
1994
1995
1996
1997
1998
1999
2000
2001
2002
2003
2004
2005
2006
2007
2008
2009
2010
kW
1,000
10,000
DKK/
kWh
Average rated power of w ind turbines installed (kW) Specific price of w ind turbines (DKK/kWh) relative to 2000 prices
Until 1985– Concept
development– Unit size < 100kW– Single units
1985-1995– Many small companies,
strong competition– Unit size quadruples in 10
years– Small w ind farms c.10MW
1995-today– Average unit size grows >
1MW, w ind farms up to c.100MW
– Growth of offshore wind, business consolidation
Future– Unit size grows >
5MW, w ind power plants up to c.1000MW
– Market diversif ied geographically
– Continued expansion of offshore w ind
Cumulative global capacity1,000MW 2,000MW 5,000MW 18,000MW 60,000MW 75,000MW
D Lindley: Energy 2100. 08.05.06 11

Capital Costs of existing offshore wind farms
5
2
5
17
3
4
1040
160
23
60158
6090
10
200
0.00
0.20
0.40
0.60
0.80
1.00
1.20
1.40
1.60
1.80
1990 1995 2000 2005
Cap
ital c
ost [
£m/M
W]
Onshore wind farms
Onshore wind farms
D Lindley: Energy 2100. 08.05.06 12

D Lindley: Energy 2100. 08.05.06 13
Marine Renewables - Wave & Tidal Power
Tidal Power Barrage• Use of a Barrage to Impound the Tide & extraction of the
Potential Energy to drive Turbines (similar to Hydropower)
Marine Current (Tidal Stream)• Extraction of the Kinetic Energy in Tidal Currents
Wave Power• Extraction of Energy from Wave motion
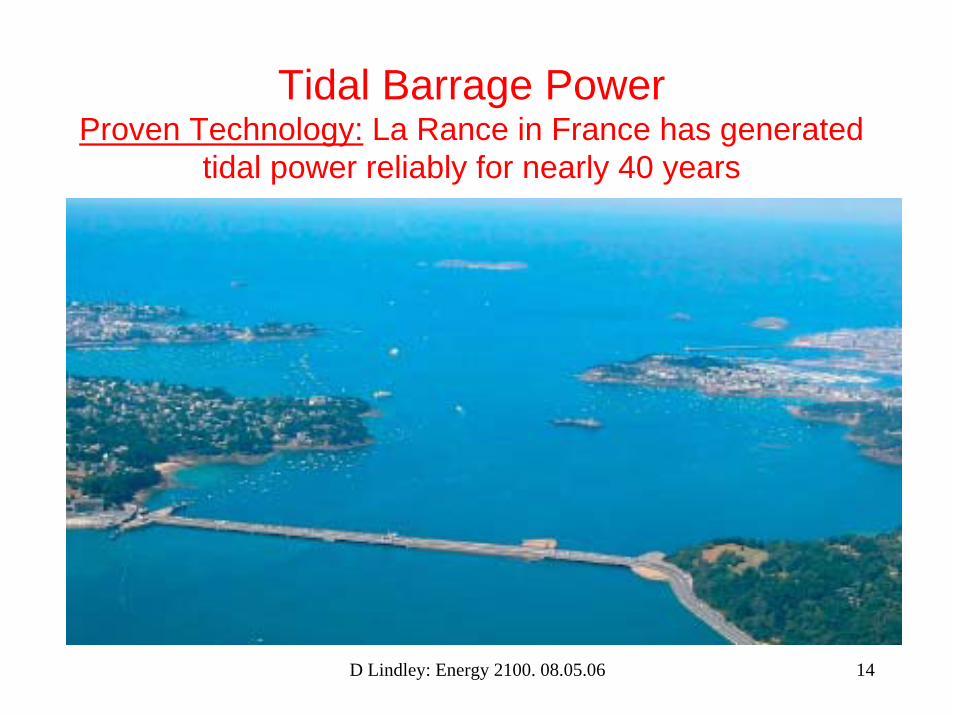
Tidal Barrage PowerProven Technology: La Rance in France has generated
tidal power reliably for nearly 40 years
D Lindley: Energy 2100. 08.05.06 14

Operational and proposed Marine energy projects worldwide
D Lindley: Energy 2100. 08.05.06 15

D Lindley: Energy 2100. 08.05.06 16
Severn Tidal Barrage
• UK potential mainly from Severn Estuary
• 17TWh = 5% of UK electricity supply
• Rated at 8640MW• 7p/kWh (incl. financing &
grid upgrade)• Estimated capital cost
=£14 billion (2006)• Constraints
- Project financing- Environmental issues

Tidal Power Barrage operation
D Lindley: Energy 2100. 08.05.06 17Tidal Power Barrage Operation

Severn Barrage Layout (1989 Report)Severn Barrage Layout (1989 report)
• 216 Turbines 40MW each
• 166 Sluices
• Ship Locks
• Small Locks
• Public Road
• Railway (possibly)
•216 turbines (40MW each)
•166 sluices
•Ship locks
•Small locks
•Public Road
•Railway (possibly)
D Lindley: Energy 2100. 08.05.06 18

Mersey Barrage Proposal 1992700MW capacity & 1.45TWh/year output
Mersey Barrage Proposal 1992700 MW capacity & 1.45 TWh/year output
Estimated Capital cost (1992) = £900 million
D Lindley: Energy 2100. 08.05.06 19

Tidal Stream Resource (Black & Veitch - for Carbon Trust - 2004-5)
Location Total TWh/year
ExtractableTWh/year
EconomicTWh/year
UK 90 18 ~12
?
?
Europe(excl. UK)
90 17
Worldwide(remainder)
600 ? 120 ?
D Lindley: Energy 2100. 08.05.06 20

Tidal Stream Sites around the UK
• Tidal Streams around the UK with Spring Tide > 2 m/s
• Water 800 times denser than air• Water flow of 1m/s carries the
same energy density as a wind flow of 9m/s
• Constraints- Technology at an early stage- Best sites are remote ( e.g Orkneys
and Channel Isles)- Costs uncertain at present
>9p/KWh for first farmsD Lindley: Energy 2100. 08.05.06 21

D Lindley: Energy 2100. 08.05.06 22
2004
UK Tidal Currents at Mean Spring TideFrom Atlas of Marine Renewable Energy Resources – Dti 2004
UK Tidal Current at Mean Spring TideFrom Atlas of Marine Renewable resources – DTI 2004

Tidal Current Device Types
• Horizontal axis Turbines
• Vertical axis Turbines
• Oscillating Hydrofoil Devices
• Venturi Devices
•Vertical axis Turbines
•Oscillating Hydrofoil Devices
•Venturi devices
•Horizontal axis Turbines
D Lindley: Energy 2100. 08.05.06 23

Tidal Stream Development
Seagen – 1MW deviceMarine Current TurbinesProposal -Approved 2006 for installation in Strangford LoughNorthern Ireland
D Lindley: Energy 2100. 08.05.06 24

D Lindley: Energy 2100. 08.05.06 25
Lunar Energy – seated on the seabed – 1MW Prototype planned for 2006/7
Lunar Energy – seated on the seabed – 1MW Prototype planned for 2006/7
Buoyant device, moored at mid water depth
TidEl by Hydrovision –Buoyant device, moored at mid water depth

Summary of Constraints to Development of Marine
RenewablesFor Tidal Barrages• Environmental Consents• Financing & lack of long term market• Construction risk & cost consequences
For Tidal Stream & Wave• The need for successful demonstration projects• Need to reduce costs • Costs of grid connection• Need for additional support (ROC’s + ) after
Demonstration projects and during Development stageD Lindley: Energy 2100. 08.05.06 26

D Lindley: Energy 2100. 08.05.06 27
Integration of Intermittent energy
sources and Forecasting

The “Virtual” Power System –Challenges of managing a distributed Power System
Source: EWE, Germany D Lindley: Energy 2100. 08.05.06 28

Wave & Wind Energy are intermittent but not unpredictable.
Tidal energy is predictable
D Lindley: Energy 2100. 08.05.06 29

The “Virtual “ Power system -A challenge to manage integration of intermittent sources
D Lindley: Energy 2100. 08.05.06 30

D Lindley: Energy 2100. 08.05.06 31

Range of findings related to additional reserves with increasingpenetration of intermittent supplies
D Lindley: Energy 2100. 08.05.06 32
Source: UK Energy Research Centre: “The costs and impacts of Intermittency - an assessment of the evidence”March 2006

Range of findings on the cost of additional reserve requirements
D Lindley: Energy 2100. 08.05.06 33
Source: UK Energy Research Centre. “The costs and Impacts of Intermittency – an assessment of the evidence”March 2006

Range of findings on capacity credit of intermittent generation
D Lindley: Energy 2100. 08.05.06 34
Source: UK Energy Research Centre: “The costs and Impacts of Intermittency – an assessment of the evidence”. March 2006

Aggregate costs of Intermittency for 20% wind penetration
•Short –run balancing costs = £2 to £3 /MWh
•Maintaining a higher system margin = £3 to £5 /MWh
•Total costs = £5 to £8 /MWh
•This is to be compared with direct costs of wind generation of between £30 to £55/MWh. If shared between all consumers the impact of intermittency on electricity prices = 0.1 to 0.15p/kWh.
Source: UK Energy Research Centre: The costs and impacts of intermittency. March 2006
D Lindley: Energy 2100. 08.05.06 35

D Lindley: Energy 2100. 08.05.06 36

EU and IEA reference scenarios for wind energy
D Lindley: Energy 2100. 08.05.06 37
The 1999 Commission base scenario projections for wind, solar and geothermal was 9.4 GW in 2000, 16 GW in 2005, 23 GW in 2010, 34.4 GW in 2015 and 46.2 GW in 2020.
•The 2015 figure had already been reached at the end of 2004 by wind alone.
In 2003 the Commission Baseline scenario projections for wind and solar were 28.6 GW in 2005, 74 GW in 2010, 92.6 GW in 2015, 105.3 GW in 2020, 126.4 GW in 2025 and 149.4 GW in 2030
•Between 1996 and 2003, the Commission’s estimate of how much wind power would be built in 2010 was increased ninefold.
In 2004 the Commission Baseline scenario projections for wind and solar were 28 GW in 2005, 73.2 GW in 2010, 91.7 GW in 2015, 104.1 GW in 2020, 125.2 GW in 2025 and 149.2 GW in 2030.

300 (2003)
Future forecasts for wind power in Europe(IEA, EU and EWEA_
D Lindley: Energy 2100. 08.05.06 38

What is possible in 2100• 20% of electricity from Wind power ( cf. Energy White
paper/Innovation review target of 10% from renewables by 2010-which would require ~ 7500MW of new wind capacity and 15% by 2015.)
• 6% of electricity from Tidal Power ( Severn Tidal Barrage and Mersey barrage =9340MW)
• 1% of electricity ( 4TWh) from Tidal streams Energy (ref: Kerr: Proc ICE.Nov 2005). Realisable potential 22TWh. ( ref. UK Marine Renewables Atlas. The Carbon trust)
D Lindley: Energy 2100. 08.05.06 39
Note: At the end of 2004 renewables contributed 3.7% of UK electricity. Currently about 2500MW of wind farms are operational or under construction ~about 1600MW more than existed at end of 2004

Conclusions:A “New” paradigm –”Joined up thinking” is required.
Government Renewables Aspirations will not be met unless:-Government Aspirations will not be met unless:--• A commitment is made now to
invest to remove grid constraints• A mechanism is put in place to deal
more efficiently with the planning process
• A mechanism is put in place to deal with connection applications.
• The “Funding Gap” is closed for New and emerging technology Pathfinder projects”appropriate to their technical and commercial status [viz; Use Marine Fund ASAP] to enable UK companies to take advantage
of current lead ; create IPR value, new industries and jobs
• An augmented or “double ROC”mechanism is put in place to support early Pathfinder Marine RenewablesProjects
• THEN:-• Wind energy could contribute 20% of
UK electricity before 2030• Tidal barrages could contribute 6% by
2030 but need Govt. support for long term ROC type contracts
• Other tidal could contribute 1% by 2030
D Lindley: Energy 2100. 08.05.06 40

D Lindley: Energy 2100. 08.05.06 41
David Lindley thanks you for listening –any questions??

D Lindley: Energy 2100. 08.05.06 42

Meeting the challenge – Opportunities and Barriers
D Lindley: Energy 2100. 08.05.06 43
• Transmission constraintsif real and not fixed this is major constraint to meeting Govt. aspirations
• 13GW of connection applications –needs a prioritisation mechanism [£??]
• Planning –needs a prioritisation mechanism or more resources and greater acceptance of national priorities
• Emerging technologies [e.g marine] - need to lower generation costs via Pathfinder projects
• Offshore SEA could be a “killer blow” to the marine renewablesindustry
• Pathfinder projects need financial support from Marine fund ASAP. Funding should be appropriate to the commercial readiness of the technology
• “Augmented” ROC mechanism or “double ROC’s” needed for early marine projects

Tidal Stream Prototypes
D Lindley: Energy 2100. 08.05.06 44
Seaflow – 300kW at 2.7m/sMarine Current Turbines - installed
2003 in Bristol Channel
Stingray – 150kW at 2m/sThe Engineering Business –
installed 2002 in Shetland Isles
Stingray – 150kW at 2m/s.The Engineering Business –installed 2002 – Shetland Isles

Time history for April@ a 6 hour forecast horizon
GH Forecaster Hourly Power EvaluationForecast Horizon T + 6 hrs
0%
10%
20%
30%
40%
50%
60%
70%
80%
90%
100%
13-Apr 18-Apr 23-Apr 28-Apr 03-May 08-May
Date - Time
Pow
er (%
of c
apac
ity)
GH ForecasterActual
D Lindley: Energy 2100. 08.05.06 45

Power: 3 month time history @ a 12 hour forecast horizon
GH Forecaster Hourly Power EvaluationForecast Horizon T + 12 hrs
0%
10%
20%
30%
40%
50%
60%
70%
80%
90%
100%
13-Feb 23-Feb 04-Mar 14-Mar 24-Mar 03-Apr 13-Apr 23-Apr 03-May 13-May 23-May
Date - Time
Pow
er (%
of c
apac
ity)
GH ForecasterActual
D Lindley: Energy 2100. 08.05.06 46

Capacity penetration (normalised by MD): Future
D Lindley: Energy 2100. 08.05.06 47
System MD Wind capacity anticipated
Germany 75 GW 2012: 29.4 GW (39%)Spain 37 GW 2010: 20 GW (54%)RoI 4.5 GW 2010: 1.1 GW (24%)GB 62 GW 2010: 8 GW (13%)Scotland 5.9 GW 2020: 6 GW (100%)Alberta 7.9 GW 2008: 0.8 GW (10%)Québec 37 GW 2012: 2.2 GW (6%)

D Lindley: Energy 2100. 08.05.06 48

Relationship between capacity credit and reliability cost, GB relevant capacity credits and system characteristics
D Lindley: Energy 2100. 08.05.06 49
Source: UK Energy Research Centre: “The costs and Impacts of Intermittency –an assessment of the evidence”March 2006
Reliability costs of intermittent generation = Fixed costs of energy equivalent thermal plant minus the avoided fixed costs of thermal plant that is displaced by the capacity credit of wind

D Lindley: Energy 2100. 08.05.06 50
Tidal Barrage Projects & ProposalsCountry Location Power
MWEnergy TWh/yr
France La Rance 240 0.5
3.3
2.5
31.0
1.4
3.9
1.1
1.8
18.5
Canada Bay of Fundy – Cumberland basin 1,400
China Various 1,000
Russia Mezan Bay & Tugur 28,000
Korea Siwha & Garolim 740
India Khambat 1,800
Australia Secure Bay & Cape Keraudren 600
Argentina San Jose / Nuevo 600
UK Severn & Mersey 9,300
Tidal Barrage projects and proposals

Proposed elevation and plan of the 16km long Severn Barrage
D Lindley: Energy 2100. 08.05.06 51

Proposed plan of the 2km long Mersey Barrage
D Lindley: Energy 2100. 08.05.06 52

Proposed location of the UK’s 8640 MW Severn Tidal barrage
D Lindley: Energy 2100. 08.05.06 53

Barrage Construction
Caissons built at deep water sites around the UK (& Europe) and towed to the site
Turbine Generators installed at the site with heavy lift crane
Barrage ConstructionCaissons built at deep water sites around the UK(& Europe) and towed to site
Turbine Generators installed at the site with heavy lift crane
D Lindley: Energy 2100. 08.05.06 54

D Lindley: Energy 2100. 08.05.06 55
Ebb Generation (preferred)
Flood Generation
Two-way Generation
Ebb Generation
(preferred)
Flood Generation
Two way Generation
Tidal Barrage Generation
Tidal Barrage Generation

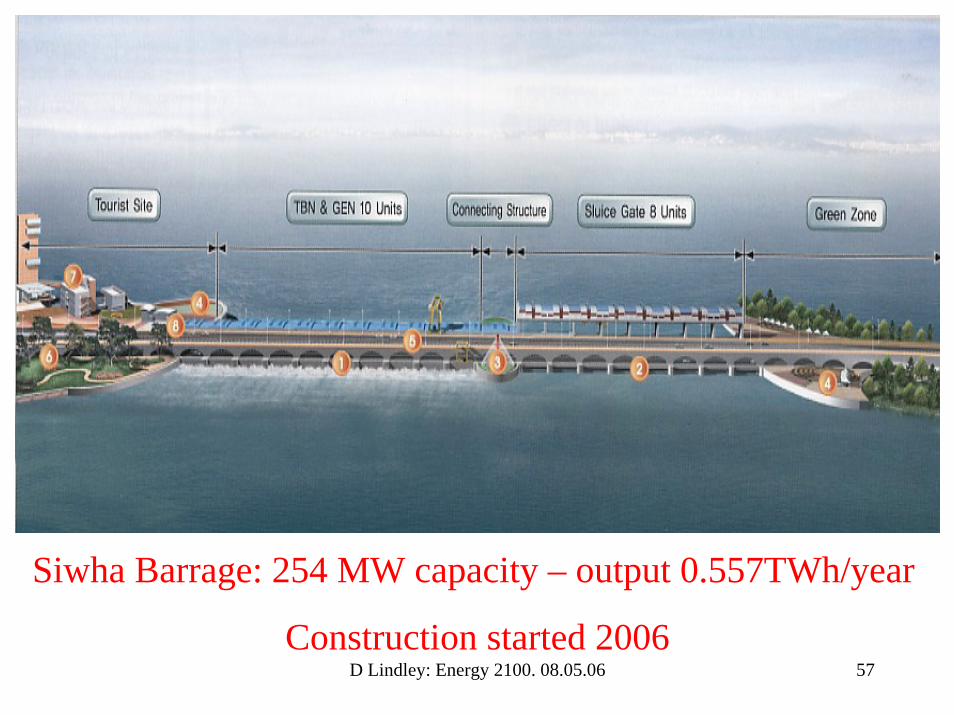
e Proposal 2005 West coast of KoreaFlood generation scheme – to keep basin water levels low & to alleviate pollution in the lake
Siwha Power Barrage proposal 2005 West coast of KoreaFlood generation scheme to keep water levels low & to alleviate pollution in the lake
D Lindley: Energy 2100. 08.05.06 56
D Lindley: Energy 2100. 08.05.06 57
Barrage: 254MW capacity - output 0.55TWh/yr
Construction started 2006
Siwha Barrage: 254 MW capacity – output 0.557TWh/year
Construction started 2006

Proposed location of the UK’s 700MW Mersey Barrage
D Lindley: Energy 2100. 08.05.06 58

Offshore wind farm project size
D Lindley: Energy 2100. 08.05.06 59
020406080
100120140160180200
No.
of u
nits
Bly
th
Mid
delg
rund
en
Utg
rund
en
Yttr
e St
engr
und
Hor
ns R
ev
Sam
so
Nys
ted
N H
oyle
Ark
low
Ban
k
Scro
by S
ands
2010
?

Offshore wind farms : Maximum depth
D Lindley: Energy 2100. 08.05.06 60
0
5
10
15
20
25
30
35
HM
WS
[m]
Bly
th
Mid
delg
rund
en
Utg
rund
en
Yttr
e St
engr
und
Hor
ns R
ev
Sam
so
Nys
ted
N H
oyle
Ark
low
Ban
k
Scro
by S
ands
2010
?

Offshore wind farms : Distance offshore
D Lindley: Energy 2100. 08.05.06 61
0
5
10
15
20
25
30
35
40D
isct
ance
offs
hore
[km
]
Bly
th
Mid
delg
rund
en
Utg
rund
en
Yttr
e St
engr
und
Hor
ns R
ev
Sam
so
Nys
ted
N H
oyle
Ark
low
Ban
k
Scro
by S
ands
2010
?

D Lindley: Energy 2100. 08.05.06 62Current Practice and Future Trends
Wind - 2005
IrelandGB
Existing wind farms c. 890MW to date

Future of Offshore Wind Power in UK
• Capital Costs• Construction Risk• Operations costs and
risks• Contracting• Other technical issues
D Lindley: Energy 2100. 08.05.06 63

g
D Lindley: Energy 2100. 08.05.06 64
The Barrage impounds the tide, then the water is released through a bulb turbine to generate electricity
Tidal Barrage – Typical cross sectionTidal Barrage – Typical Cross SectionThe barrage impounds the tide, then the water is released through
bulb turbines to generate electricity

Overview
D Lindley: Energy 2100. 08.05.06 65
L
Output• Power Forecast
Inputs• Numerical Weather Prediction• SCADA System• Site Measurements
Weather Service

D Lindley: Energy 2100. 08.05.06 66

MW added in 2005
D Lindley: Energy 2100. 08.05.06 67
0
500
1000
1500
2000
2500
German
yUSA
SpainIndia
DenmarkChina
Italy UK NL
Portugal
Australia
Canada
AustriaFranceGreec
eSweden

D Lindley: Energy 2100. 08.05.06 68Source: UK Energy Research Centre: The costs and Impacts of Intermittency” March 2006