Embed Size (px)
Citation preview

Agricultural and Forest Meteorology 106 (2001) 153–168
A comparison of methods for determining forestevapotranspiration and its components: sap-flow, soil water budget,
eddy covariance and catchment water balance
Kell B. Wilsona,∗, Paul J. Hansonb, Patrick J. Mulhollandb,Dennis D. Baldocchic, Stan D. Wullschlegerb
a Atmospheric Turbulence and Diffusion Division, NOAA, P.O. Box 2456, Oak Ridge, TN 37831, USAb Environmental Sciences Division, Oak Ridge National Laboratory, P.O. Box 2008, Oak Ridge, TN 37831, USA
c Department of Environmental Science, Policy and Management, University of California at Berkeley,151 Hilgard Hall, Berkeley, CA 94720, USA
Received 17 February 2000; received in revised form 13 July 2000; accepted 13 July 2000
Abstract
A multi-year, multi-technique study was conducted to measure evapotranspiration and its components within an uneven-agedmixed deciduous forest in the Southeastern United States. Four different measurement techniques were used, including soilwater budget (1 year), sap flow (2 years), eddy covariance (5 years), and catchment water budget (31 years). Annual estimatesof evapotranspiration were similar for the eddy covariance and catchment water balance techniques, averaging 571± 16 mm(eddy covariance) and 582±28 mm (catchment water balance) per year over a 5-year period. There were qualitative similaritiesbetween sap flow and eddy covariance estimates on a daily basis, and sap flow estimates of transpiration were about 50%of annual evapotranspiration estimated from eddy covariance and catchment studies. Soil evaporation was estimated usinga second eddy covariance system below the canopy, and these measurements suggest that soil evaporation explains only asmall portion of the difference between sap flow estimates of transpiration and eddy covariance and catchment water budgetestimates of evapotranspiration. Convergence of the catchment water balance and eddy covariance methods and moderatelygood energy balance closure suggests that the sap flow estimates could be low, unless evaporation of canopy-intercepted waterwas especially large. The large species diversity and presence of ring-porous trees at our site may explain the difficulty inextrapolating sap flow measurements to the spatial scales representative of the eddy covariance and catchment water balancemethods. Soil water budget estimates were positively correlated with eddy covariance and sap flow measurements, but thedata were highly variable and in error under conditions of severe surface dryness and after rainfall events. © 2001 ElsevierScience B.V. All rights reserved.
Keywords:Evapotranspiration; Eddy covariance; Catchment water balance
∗ Corresponding author. Tel.:+1-865-576-2317;fax: +1-865-576-1237.E-mail address:[email protected] (K.B. Wilson).
1. Introduction
Evapotranspiration is an important process acrossa wide range of disciplines, including ecology, hy-drology and meteorology. Because of this multidisci-plinary focus, a number of methodologies have been
0168-1923/01/$ – see front matter © 2001 Elsevier Science B.V. All rights reserved.PII: S0168-1923(00)00199-4

154 K.B. Wilson et al. / Agricultural and Forest Meteorology 106 (2001) 153–168
developed to measure evapotranspiration, or compo-nents of evapotranspiration (transpiration, soil evapo-ration and interception), across a spectrum of spatialscales ranging from individual plants, soil samples andsoil profiles, the atmospheric surface layer, and entirewatersheds. Examples of measurement techniquesinclude soil (Daamen et al., 1993) and plant weigh-ing lysimeters (Edwards, 1986), soil water budgets(Eastham et al., 1988; Jaeger and Kessler, 1997;Cuenca et al., 1997), sap flow (Smith and Allen,1996), plant chambers (Cienciala and Lindroth, 1995),chemical tracing (Calder et al., 1986; Kalma et al.,1998), Bowen ratio (Denmead et al., 1993), eddy co-variance (Baldocchi et al., 1988) and catchment waterbalance (Bosch and Hewlett, 1982; Swift et al., 1988).
All of these methods have been used to estimatewater vapor exchange rates between the surface andatmosphere, but the techniques often vary consider-ably in at least three aspects. First, each technique isonly representative within a particular spatial and tem-poral scale, and either interpolation or extrapolationis necessary to infer evaporation rates outside thesescales. The techniques also differ in whether theymeasure evapotranspiration or just one or several of itscomponents. Thirdly, each of the techniques necessar-ily introduces a unique set of particular assumptions,technical difficulties, measurement errors and biases.As a result, specific inherent advantages and limi-tations are introduced for each of the measurementtechniques. Four of the less intrusive techniques thatare addressed in this study, soil water budget, sap flow,eddy covariance (both above and below canopy) andcatchment water balance, illustrate how these advan-tages and limitations differ with technique. A summaryof the approximate measurement scale, the compo-nent of evapotranspiration measured, and some of the
Table 1Summary of the methods used to estimate evapotranspiration and its components in this studya
Method Component Spatial scale (m2) Time scale
Soil water budget Et + Es 100 DailySap flow Et 102 Half-hourEddy covariance (below canopy) Es 102 Half-hourEddy covariance (above canopy) Et + Es + E i 104 Half-hourCatchment water budget Et + Es + E i 106 Annual
a Shown are the methods, the component of evapotranspiration measured (Et = transpiration;Es = soil evaporation;E i = interception),the approximate representative spatial scale of the measurement and the highest meaningful resolution time scale used to estimate evaporation.
major advantages and limitations of each of the fourmethods are shown in Table 1and discussed below.
A soil water budget is a relatively simple methodfor estimating total water loss from the soil (transpira-tion and soil evaporation). Another advantage of thistechnique is that it can provide insight on the rela-tive contribution of various rooting depths to the totaltranspiration source (Eastham et al., 1988; Teskey andSheriff, 1996). However, closing the soil water balancerequires some estimate of drainage rates (Rutter, 1968;Cuenca et al., 1997), and evapotranspiration estimatesfrom this method do not account for canopy intercep-tion. The measurements are typically representative ofonly a small area, and high spatial variability of soilwater content results in sampling difficulties and prob-lematic extrapolations to larger scales (Dunin, 1991).
Sap flow measurements provide mechanistic detailsat fairly short temporal scales on physiological andenvironmental controls of transpiration at the branchand whole plant level (Wullschleger et al., 1998), andrepresent spatial scales several orders of magnitudelarger than the soil water budget (Table 1). Sap flowmeasurements are versatile because complex terrainand spatial heterogeneity does not limit their applica-bility. In fact, these measurements are especially wellsuited for determining species effects and other typesof variability that occur in highly heterogeneous en-vironments (Barrett et al., 1996; Wullschleger et al.,2000a,b). However, radial gradients of sap flow in thesapwood can result in errors (Clearwater et al., 1999),and stand level estimates require scaling proceduresto extrapolate up from individual trees. Scaling can beparticularly difficult in forests with age and species di-versity. This technique only measures one componentof evapotranspiration (transpiration), a further limita-tion when the overall water budget is required.

K.B. Wilson et al. / Agricultural and Forest Meteorology 106 (2001) 153–168 155
Eddy covariance measurements above the canopyprovide estimates of evapotranspiration at the hightemporal resolution necessary to examine processes,but also at much greater spatial scales than sap flow(Table 1). Simultaneous measurements of sensibleheat flux and other trace gas fluxes, such as carbondioxide, are also feasible. Therefore, this techniquecan probe vital links between hydrological and otherbiogeochemical processes. In addition, simultaneousheat flux and energy balance estimates are used asindependent checks on the validity of the measure-ments (Baldocchi et al., 1988). A monitoring systembeneath tall vegetation can provide independent esti-mates of soil evaporation (Saugier et al., 1997; Wilsonet al., 2000a), but the estimates are usually represen-tative of a much smaller area than the above-canopymeasurements (Table 1) (Baldocchi, 1997; Wilsonand Meyers, 2000). One weakness of the eddy co-variance technique is that the size and shape of therepresentative region contributing to the measuredflux, the flux ‘footprint’, is not fixed in time (Horstand Weil, 1992; Baldocchi, 1997). Eddy covariancemeasurements are sometimes difficult to interpretduring weakly turbulent periods, usually at night (Leeet al., 1996; Paw U et al., 2000; Baldocchi et al.,2000). The technique also cannot directly accountfor advection in areas of significant heterogeneousor complex terrain, limiting its applicability in somelocations.
The catchment water balance provides a single inte-grated assessment of annual evapotranspiration for anarea of fixed dimensions (the catchment) that is oftenconsiderably larger than that measured by the othertechniques. However, the method provides essentiallyno information on processes at temporal scales shorterthan the annual cycle (Table 1). This technique is alsosubject to errors based on assumptions concerning thetiming and presence of full system recharge (soil wa-ter storage) or the appropriate extent of groundwaterdivides (Luxmoore and Huff, 1989).
A comparison of these different techniques allowsindependent estimates of water vapor exchange at aparticular site, and tests the general applicability ofextrapolating smaller scale measurements. Processescontrolling evapotranspiration and its separation intocomponents can be examined with a spatial and tem-poral detail not available when only a single measure-ment technique is used.
Several studies have compared sap flow and eddycovariance measurements (Köstner et al., 1992;Berbigier et al., 1996; Hogg et al., 1997; Granieret al., 1990, 2000; Saugier et al., 1997). However,these studies have primarily focused on monospecificand even-aged stands. The experiments were often forshort time periods, and analysis was usually limitedto only these two methodologies. Comparisons be-tween the soil water budget and eddy covariance mea-surements have been performed in Jack Pine stands(Cuenca et al., 1997; Moore et al., 2000). Historically,catchment water balance studies have focused on theeffects of disturbance on streamflow, rather than mea-suring long-term evapotranspiration rates (Bosch andHewlett, 1982). Comparisons of catchment water bal-ance with these other techniques are also rare becausethe comparison requires measurements that span atleast one annual cycle.
In this study, we present a multi-year comparisonof these four independent techniques for estimatingevapotranspiration and its components in an east Ten-nessee watershed containing a mixed deciduous for-est. Measurements based on the soil water budget havebeen performed for 1 year, sap flow for 2 years, eddycovariance for 5 years and catchment water balancefor 31 years. We examine the consistency of estimatesbetween each of the techniques in providing estimatesof evapotranspiration and its components on daily toannual time scales, and discuss the specific advantagesand limitations provided by each of the methods.
2. Methods
2.1. General site characteristics
Measurements were conducted at Walker BranchWatershed, a 97.5 ha mixed deciduous forest in OakRidge, TN (35◦57′30′′N, 84◦17′15′′W, 365 m asl). Theoverstory is dominated by chestnut oak, white oak,black gum and red maple. The ages of the overstorytrees ranged from about 40–75 years, and the max-imum canopy height was approximately 26 m abovethe surface. Maximum leaf area was typically about 6.
Mean annual precipitation and temperature for thewatershed over the past 30 years are 1333 mm and14.4◦C, respectively. Other climatological and energybalance characteristics above and below the canopy

156 K.B. Wilson et al. / Agricultural and Forest Meteorology 106 (2001) 153–168
of this forest are described in Wilson and Baldocchi(2000) and Wilson et al. (2000a). A drought occurredduring the late summer of 1998, one of the 2 yearswhen at least three of the measurement techniqueswere active. Details concerning soil water content andleaf-level gas exchange responses during this droughtcan be found in Wilson et al. (2000b,c). The soil iswell drained and is classified as a typic Paleudult,which encompasses clayey and kaolinitic soils. Amore detailed description of the canopy architecture,species composition and soil properties are providedby Luxmoore et al. (1981), Hutchison et al. (1986)and Johnson and Van Hook (1989).
2.2. Soil water budget measurements
Soil water budget measurements in 1998 showedthat soil water monitoring at only two depths (100 and300 mm) and two soil pedons during that year was in-adequate for complete characterization of soil waterdepletion under severe drought conditions. Therefore,instrumentation for monitoring soil water to a depthof 700 mm was added in 1999, consistent with a re-port showing that the majority of tree roots (>90%)are within the upper 600 mm of soil at our study site(Joslin and Wolfe, 1998). Six additional soil pits wereadded in 1999, and these new pits included soil watercontent measurements down to four depths (100, 300,500 and 700 mm) and are the basis of the measure-ments discussed in this study.
Soil water content was measured using water con-tent reflectometers at each soil depth (Model CS615,Campbell Scientific, Inc., Logan, UT). Time domainreflectometer waveguides (TDR; Soil Moisture Equip-ment Corp., Santa Barbara, CA) were also co-locatedwith the soil water reflectometers as a check againstthe factory supplied calibrations. The sensors weremonitored each minute and the hourly means werestored on a Campbell Scientific CR10X data logger(Campbell Scientific, Inc., Logan, UT).
Several assumptions were made to estimate evap-otranspiration from the soil water content measure-ments. The measured soil water contents at 100, 300,500 and 700 mm were assumed to apply to soil lev-els at 0–150, 150–350, 350–550 and 550–750 mm,respectively. These levels were chosen asymmetri-cally about the measurements to more accuratelyrepresent vertical variation in the rooting depths and
soil characteristics. No soil water was assumed tocontribute to transpiration from below 750 mm inthese calculations. Because rain inputs and move-ment of soil water within the soil profile confoundestimates of soil water extraction using the soil waterbudget approach, we eliminated all days with rainand up to two additional days following heavy rainevents. Such corrections allowed only 43% of thegrowing season days to be used for application ofthe soil water budget method. Because of the largeamount of missing data, annual evapotranspirationtotals based on the soil water budget method were notattempted.
2.3. Sap flow measurements
In the same region as the soil water content andeddy covariance measurements, individual tree sapflow probes were installed on 15 canopy trees (four redmaple, four loblolly pine, two chestnut oak, two whiteoak, one red oak and two yellow-poplar). The stemdiameter in these trees ranged from 240 to 630 mmand tree height varied from 20 to 31 m. Water use bycommon understory saplings (one red maple, one dog-wood and one beech) was also measured. The sap flowobservations were operated automatically with mini-mal disruptions (i.e. only 9% of the hourly data weremissing). If all observations were not available duringdaylight hours that day was eliminated for compara-tive analyses in this paper, but interpolated estimateswere used for calculating annual transpiration.
Measurements of sap flow were made usingcommercially-available thermal dissipation probes(Model TDP-30, Dynamax, Inc., Houston, TX). Theseprobes operated on the constant power principle(Granier, 1987). Two cylindrical probes, each 30 mmin length and 1.3 mm in diameter, were inserted 30 mminto the sapwood of the tree bole (Wullschleger et al.,2000b). All probes were installed on the northern sideof trees to avoid direct solar heating and shielded withaluminum foil to minimize temperature fluctuations inthe sapwood. Mean sap flow for the tree (m s−1) wascalculated using the empirical calibration of Granier(1987). Sap flow data were collected every minutefrom day 90 to day 335 in 1998 and 1999, a periodthat covers bud break to complete senescence. Hourlymean values were stored on a data logger (CR10X,Campbell Scientific, Inc., Logan, UT).
K.B. Wilson et al. / Agricultural and Forest Meteorology 106 (2001) 153–168 157
Sap flow measurements were scaled to stand tran-spiration from knowledge of species compositionand sapwood area. Transpiration (kg m−2 s−1) foreach species (Tx , where subscriptx refers to a par-ticular species) was computed each hour from themean sap flow for each species (SVx , m s−1) and thespecies-specific sapwood area index (SAIx , ratio ofsapwood area to ground area) of the region surround-ing the tower used for eddy covariance measurements
Tx = ρw SVx SAIx (1)
whereρw is the density of liquid water. Cross-sectionalsapwood area was computed from the measured stemdiameter using species-specific allometric equations(Wullschleger et al., 2000a). Species composition andsapwood area index for each species was determinedfrom 30 inventory plots, each with a 10 m radius,within a 700 m radius of the tower used for eddycovariance measurements. The plots were within thepredominate wind directions (W to SW and NE) ofthe tower. All estimates of sapwood area were ad-justed according to known radial variation in sap flowfor the individual species (Wullschleger et al., 2000a).
Canopy transpiration (Et) was computed by sum-ming the contributions from each species
Et =∑
x
Tx (2)
2.4. Eddy covariance measurements
Two eddy covariance systems were used in thestudy. One system was mounted on a walk-up tower10 m above the canopy and has operated continuouslysince autumn of 1994. A second system was placedwithin the canopy in autumn 1997, 2 m above theground. Virtually no vegetation was present betweenthis second system and ground level, providing di-rect estimates of water vapor exchange from the soiland leaf litter. Numerous tests have been conductedto validate the application of this method below thecanopy (Baldocchi and Meyers, 1991; Wilson et al.,2000a; Wilson and Meyers, 2000). Wind velocityand virtual temperature fluctuations were measuredwith a three-dimensional sonic anemometer (modelSWS-211/3 K, Applied Technology, Boulder, CO).Fluctuations in humidity were measured with an openpath, infrared absorption gas analyzer (Auble and
Meyers, 1992). Vertical flux densities were evaluatedby computing the mean covariance of water and sen-sible heat fluctuations with the fluctuating verticalvelocity (Baldocchi et al., 1988). Mean scalar andvelocity quantities were determined using a digitalrecursive filter with a 400 s time constant. Additionaldetails on instrumentation and flux measurements areprovided in Wilson and Baldocchi (2000) and Wilsonet al. (2000a).
To obtain daily and annual sums it was necessaryto estimate missing or rejected data. Half-hourly val-ues of latent heat fluxes (LE) that were missing orof insufficient quality (i.e. due to anomalous turbu-lence statistics during rain events or instrument mal-function) were estimated using the two-week averagePriestly–Taylor coefficient (α = E/Eeq, Priestly andTaylor, 1972) whereE is the measured evaporation(kg m−2 s−1) and Eeq is the equilibrium evaporation(Wilson and Baldocchi, 2000). Much of the missingdata occurred at night or when precipitation or dewobscured the sensors. These are periods when fluxeswere expected to be small. The portion of missing orrejected data was 14% on the tower and 16% on theforest floor system.
Canopy evapotranspiration (E) was estimated fromthe tower system, and soil evaporation (Es) was esti-mated from the system near the forest floor. The dif-ference between the two (E −Es) was estimated to bethe sum of canopy transpiration (Et) and evaporationof intercepted rainfall (Ei ) because
E = Et + Es + Ei (3)
2.5. Catchment water balance measurements
Weirs (120◦ V-notch) were installed in 1967 on thetwo first-order streams (East and West Forks) drain-ing the combined Walker Branch Watershed near theirconfluence (Luxmoore and Huff, 1989). Stage heightat each weir was recorded at 15 min intervals and in-stantaneous discharge (Q, in l s−1) was calculated from
Q = 2301 SH2.449 (4)
where SH is the stage height (m). Annual dischargerates for each fork were calculated by summing the15 min readings over the year. The total watersheddischarge was calculated by summing the rates for thetwo streams. Annual runoff is calculated by dividing

158 K.B. Wilson et al. / Agricultural and Forest Meteorology 106 (2001) 153–168
total annual discharge by the surface area of the entirewatershed (97.5 ha).
From 1967 to 1980, precipitation was determinedusing the hourly means from Belfort weighing bucketrain gauges located at five ridge clearings within orbordering the watershed. After 1980, the rain gaugenetwork was reduced to two ridge sites. In Novem-ber 1998, electronic tipping buckets (Telog ModelR-2107) were installed at the active sites, replacingthe weighing bucket gauges. Annual evapotranspira-tion integrated over the entire water catchment wasthen estimated as the residual between total annualprecipitation and total annual runoff.
2.6. Other measurements
Leaf area was computed continuously near thetower by applying Beers Law to spatially integratedsolar radiation measurements above and below thecanopy (Greco and Baldocchi, 1996; Wilson andBaldocchi, 2000). The canopy extinction coefficientwas assumed to be 0.58 (Hutchison et al., 1986).
Fig. 1. Annual estimates of evapotranspiration estimated from the catchment water balance (d) and eddy covariance (h) methods. Annualestimates of transpiration from sap flow (.) and annual equilibrium evaporation (4) are also shown. The estimate of sap flow in 1996 isfrom a different portion of the watershed (Wullschleger et al., 2000a) from the sap flow measurements in 1998 and 1999.
Canopy wetness was determined from the voltageoutput of a bridge resistor placed 10 degrees from hor-izontal above the canopy. When the surface of the in-strument became wet, the resistance was substantiallyreduced and was indicated by changes in voltage.
3. Results
3.1. Comparisons of techniques
Annual estimates of evapotranspiration based on theeddy covariance (squares) and catchment water bal-ance (circles) methods are shown in Fig. 1. There isgood agreement between the catchment water balanceand eddy covariance methods on the magnitude of an-nual evapotranspiration over the 5 years when bothmeasurements were performed. The average annualevapotranspiration during this 5-year period was 582±28 mm (catchment water balance) and 571± 16 mm(eddy covariance), which was less than the 30-year an-nual mean indicated by the catchment water balance(645± 20 mm). Based on the 5-year data set, the two

K.B. Wilson et al. / Agricultural and Forest Meteorology 106 (2001) 153–168 159
methods do not completely agree on the interannualtrends. The catchment estimates suggested maximumsin 1996 and 1999, but eddy covariance indicated thehighest rate in 1997. The mean annual difference be-tween the two estimates was 60 mm, or about 10%of the average evapotranspiration, which is of similarmagnitude to the interannual variation. Equilibriumevaporation (Priestly and Taylor, 1972; open trianglein Fig. 1) for the 5 years ranged from 793 to 876 mmwith a mean of 827 mm, considerably greater than theempirically measured rates. There was not an obviousrelationship between measured and equilibrium evap-otranspiration at the annual scale.
Fig. 2. Daily estimates of evapotranspiration from eddy covariance (d) and of transpiration from sap flow (5) during (a) 1998 and (b)1999. Also shown in (b) is the soil water budget estimates (cross hatchedh).
Fig. 1 also shows estimates of annual transpirationestimated from the sap flow measurements in 1998(230 mm) and 1999 (269 mm). The corresponding to-tal annual evapotranspiration rates from the eddy co-variance method were 547 mm in 1998 and 605 mmin 1999, and the water catchment balance estimateswere 502 and 642 mm.
The daily transpiration estimates from sap flow andevapotranspiration estimates from tower eddy covari-ance are shown for both 1998 and 1999 in Fig. 2.Despite quantitative differences, the daily trackingof the two estimates were often qualitatively similar.There was a good correlation (r2 = 0.80) between

160 K.B. Wilson et al. / Agricultural and Forest Meteorology 106 (2001) 153–168
Fig. 3. Relationship between sap flow estimates of transpiration(Et ) and eddy covariance estimates ofE − Es (above-canopyeddy covariance minus below-canopy eddy covariance) during (a)1998 and (b) 1999. Days with rainfall are indicated by (5) anddashed regression line. ‘Dry’ days are indicated by (d) and solidregression line. Intercepts in (a) are 0.18 (wet) and 0.18 (dry).Slopes in (a) are 0.33 (wet) and 0.40 (dry). Intercepts in (b) are−0.30 (wet) and 0.15 (dry). Slopes in (b) are 0.61 (wet) and 0.54(dry).
daily estimates ofEt from sap flow and eddy co-variance estimates of evapotranspiration minus soilevaporation (Fig. 3). The correlation was alteredslightly depending on whether measurable precipi-tation occurred during the day (triangles in Fig. 3),which was when evaporation of intercepted rainfall(Ei ) was presumably greater. A similar conclusion
Fig. 4. (a) Sap flow estimates of transpiration as a function of at-mospheric vapor pressure deficit above the canopy. Measurementswere either during a non-drought (5, days 130–219) or drought(d, days 220–275) periods during 1998. (b) Same as (a) exceptfor eddy covariance estimates ofE − Es against vapor pressuredeficit.
was found when data were sorted according to thecanopy wetness sensor (not shown).
Qualitative similarity between sap flow and eddycovariance measurements on the daily time scale isalso seen in the general responses to vapor pres-sure deficit and soil drying (Fig. 4). When soilwater is plentiful, evaporation generally increases
K.B. Wilson et al. / Agricultural and Forest Meteorology 106 (2001) 153–168 161
with vapor pressure deficit (vpd) over a wide rangeof vpd. As the soil dried, both methods indi-cate that water fluxes were suppressed for all val-ues of vpd and saturated at fairly low values ofvpd.
3.2. Components of evapotranspiration
Any attempt to reconcile the quantitative differencesbetween sap flow estimates of annual transpiration
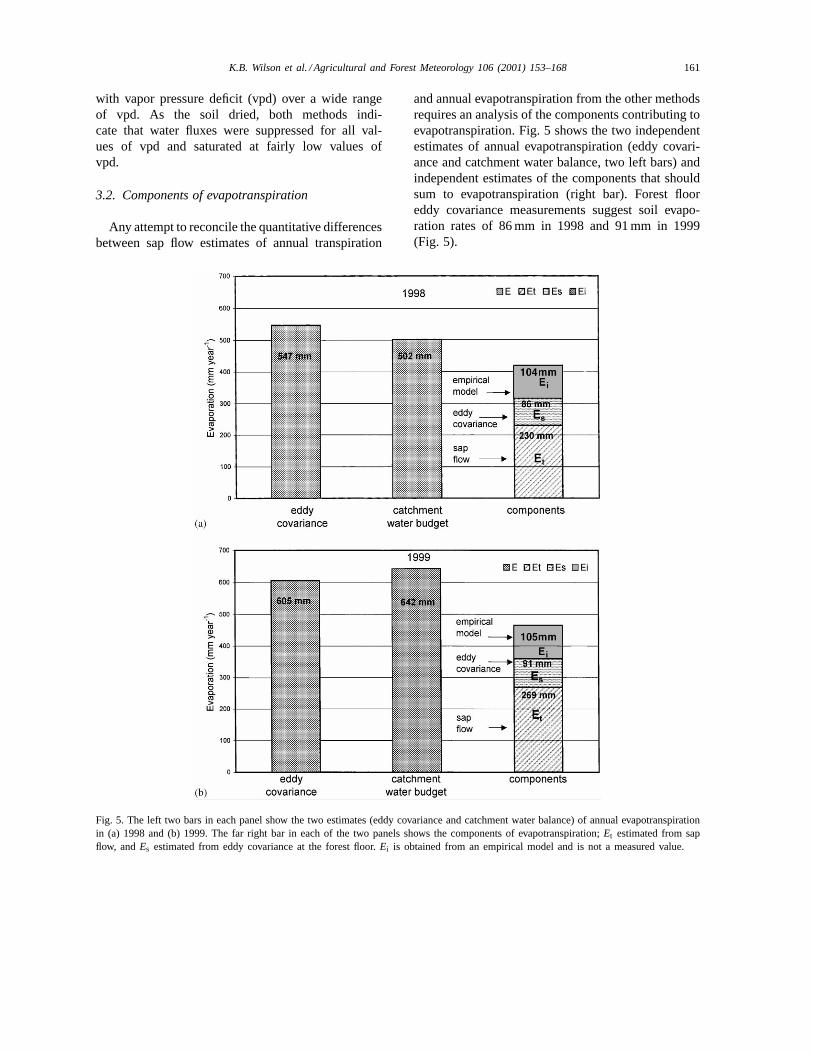
Fig. 5. The left two bars in each panel show the two estimates (eddy covariance and catchment water balance) of annual evapotranspirationin (a) 1998 and (b) 1999. The far right bar in each of the two panels shows the components of evapotranspiration;Et estimated from sapflow, andEs estimated from eddy covariance at the forest floor.Ei is obtained from an empirical model and is not a measured value.
and annual evapotranspiration from the other methodsrequires an analysis of the components contributing toevapotranspiration. Fig. 5 shows the two independentestimates of annual evapotranspiration (eddy covari-ance and catchment water balance, two left bars) andindependent estimates of the components that shouldsum to evapotranspiration (right bar). Forest flooreddy covariance measurements suggest soil evapo-ration rates of 86 mm in 1998 and 91 mm in 1999(Fig. 5).

162 K.B. Wilson et al. / Agricultural and Forest Meteorology 106 (2001) 153–168
Evaporation of rainfall intercepted by the forestcanopy (Ei ) is an additional component of evapo-transpiration not considered by the sap flow method,but is implicit in the estimates by the other methods.Rainfall interception was not measured as a separatecomponent in this study, but relationships have beendeveloped for the Walker Branch forest as a functionof leaf area index (Huff et al., 1977; Luxmoore, 1983).These relationships predict interception contributionsof 104 mm (1998) and 105 mm (1999) (Fig. 5). Al-though annualEi was not measured to validate theempirical model, independent estimates ofEi dur-ing the dormant season were available from eddycovariance measurements. During this time the dif-ference in eddy covariance estimates of evaporationabove and below the canopy should be interception,because transpiration is essentially zero. Measureddormant season estimates are between 21 mm (1998)and 25 mm (1999), compared to empirical modelestimates of 48 mm (1998) and 38 mm (1999), in-dicating the empirical estimates are about 50–100%greater than that estimated by eddy covariance. Theempirical estimates may be too high because theyinclude some evaporation from leaf litter, which isconsidered ‘soil evaporation’ in our analysis. An-nual fog interception by a nearby pine forest during1986–1989 was estimated to be small, only about10 mm (Johnson and Lindberg, 1992). This wouldlikely be even smaller for a deciduous forest, andwe did not include this component in our analysis.Although maximum annual interception rates on theorder of 100 mm are predicted for this forest, inter-ception rates of 231 mm (1998) and 245 mm (1999)are necessary to account for the discrepancy betweeneddy covariance/catchment water balance methodsand the sap flow method (Fig. 5).
The transpiration ratio is defined as the ratio oftranspiration to evapotranspiration (Et/E). The differ-ence between the above (E) and below (Es) canopywater flux isE −Es = Et +Ei (see Eq. (3)). Canopyinterception (Ei ) is nonzero over an annual cycle, butshould be negligible on many days without rainfall.Therefore, on days when a dry canopy is assumed(Ei = 0 so thatE − Es = Et), the transpirationratio can be estimated directly from above and be-low canopy eddy covariance data. The transpirationratio can also be estimated as the ratio between tran-spiration estimated directly from sap flow and evap-
Fig. 6. The transpiration ratio (transpiration/evapotranspiration) andrelative leaf area index (leaf area index in relation to maximum)in (a) 1998 and (b) 1999. Evapotranspiration is estimated fromthe above-canopy eddy covariance measurements. Transpiration isestimated either from eddy covariance, and assuming dry canopy(E i = 0) (d), or from sap flow estimates (5).
otranspiration estimated by the above-canopy eddycovariance system. Fig. 6 shows the transpiration ratiousing these two methods, either eddy covariance toobtainEt or sap flow to obtainEt. When eddy covari-ance data is used to obtainEt (assumingEi = 0) thetranspiration ratio rapidly approaches a mean around0.9 as leaf area reaches a maximum. The ratio re-mained close to 0.9 over the growing seasons, whichincluded a wide range of climatic conditions and a

K.B. Wilson et al. / Agricultural and Forest Meteorology 106 (2001) 153–168 163
late season drought in 1998. There is some indicationof a decreased ratio during and after the most intensedrought period in 1998 (days 245–265), just beforedecreasing more rapidly during senescence (Fig. 6a).In contrast, the transpiration ratio using sap flow es-timates of transpiration was considerably lower andshowed a different seasonality. Before full leaf expan-sion, the ratio peaked around 0.8 in 1998, but quicklydeclined to typically less than 0.5 for the remainderof the summer, until increasing again just before au-tumn senescence (Fig. 6a). The early and late seasonpeaks in the sap flow estimates of the transpirationratio were much more subdued in 1999 compared to1998 (Fig. 6b). The ratio was also slightly greaterin 1999 compared to 1998 during most of the grow-ing season, but was still less than eddy covarianceestimates.
3.3. Sensitivity of sap flow estimates to footprintassumptions
In addition to canopy interception, another possiblesource of divergence between the sap flow, eddy co-variance and catchment water budget methods is theassumed species composition and basal areas used toscale up the sap flow estimates (Eqs. (1) and (2)).Species composition and basal area are not constantwithin the tower footprint, varying with wind direc-tion and distance from the tower. In a 700 m radiuscircle extending from the meteorological tower, meanbasal area ranged from 21.7 to 34.9 m2 ha−1 within the30 subplots, with a population mean of 29.2 m2 ha−1.The effect of this variability on the sap flow estimateswas examined using the species composition and basalarea along each of the six different transects that en-compass the primary wind directions at this site. Us-ing these six different estimates of species composi-tion and basal area, sap flow estimates of transpirationranged from 208 to 230 mm per year in 1998 and from243 to 289 mm per year in 1999.
3.4. Soil water budget
Daily estimates of evapotranspiration from the soilwater budget equation are shown for 1999 in Fig. 2b.There was a positive correlation between estimates ofstand evapotranspiration from the soil water budgetand those derived from sap flow and eddy covariance
Fig. 7. Daily estimates of evapotranspiration from the soil budgetmethod in 1999 against (a) eddy covariance estimates and (b) sapflow estimates of transpiration. Data are segregated into days whenthe soil water content was above and below 8.5% by volume.
(Fig. 7), but the data were highly variable. There werealso few estimates during wet periods, which encom-passes much of the first half of the growing season.Soil water budget data collected during low soil mois-ture conditions in 1999 were not consistent with theoverall correlation in Fig. 7 (triangles), suggesting thatunder conditions of severe surface soil drying soil wa-ter depletion may be taking place below 700 mm.

164 K.B. Wilson et al. / Agricultural and Forest Meteorology 106 (2001) 153–168
4. Discussion
There was good agreement on the magnitude ofannual evapotranspiration over the 5 years betweeneddy covariance and catchment water balance meth-ods, averaging about 580 mm, increasing the confi-dence in these two approaches. Estimates of averageannual evapotranspiration from watershed catchmentstudies at the Coweeta Hydrologic Laboratory (within150 km of Walker Branch), where precipitation ratesare about 50% greater, range from 500 mm (high ele-vation) to 900 mm (low elevation) (Swift et al., 1988).In a forested watershed in West Virginia, both the an-nual average evapotranspiration (640 mm) and precip-itation (1458 mm) are more similar to Walker Branch(Adams et al., 1994).
The sap flow and eddy covariance estimates showgeneral similarity in their daily fluctuations and re-sponse to the environment. However, there is an ap-parent discrepancy between the higher estimates ofevapotranspiration from the eddy covariance and watercatchment methods and lower estimates of transpira-tion from the sap flow method. The eddy covariancesystems indicate that soil evaporation was an impor-tant, but relatively small, contribution to total annualflux (16%, and less than 8% during most of the grow-ing season), similar to estimates from other decidu-ous forests (Kelliher et al., 1992; Moore et al., 1996;Grimmond et al., 2000). Therefore, the relatively smallcontribution from this component does not explainwhy eddy covariance and catchment water balanceestimates greatly exceed those from sap flow; how-ever, a third component, evaporation from interceptedwater, was not measured but is necessary for directcomparison of the three methods. Estimates of inter-ception from previous measurements and simulationsat this site are around 15–20% of the annual evapo-transpiration (Luxmoore and Huff, 1989), similar tomany other forests (Calder, 1998). Interception ratesneeded to reconcile the difference between the eddycovariance/catchment water balance and sap flow mea-surements in this study are at least twice these esti-mates. Interception rates of these higher magnitudeshave been observed on an annual basis, but only inwet, high altitude climates, which experience higherannual rainfall, more frequent rainfall and fog eventsand higher wind speeds than at our site (Calder, 1998).Furthermore, if interception was the major cause of
discrepancy between sap flow and eddy covariance es-timates, correspondence between sap flow and eddycovariance measurements should be vastly superior ondays when rainfall was not present or the wetness sen-sor was dry (as in Granier et al., 2000), which was notthe case. Thus, sap flow measurements may have sys-tematically underestimated transpiration rates at thissite.
Quantitative agreements between sap flow and eddycovariance measurements were better in short-termstudies with maritime pine (Berbigier et al., 1996) andbeech (Köstner et al., 1992) and in longer-term studieswith aspen (Hogg et al., 1997), beech (Granier et al.,2000) and Jack pine (Saugier et al., 1997) than in thecurrent study. In a second maritime pine study (Granieret al., 1990) sap flow estimates were less than 70% ofeddy covariance, but these researchers suggested thatunderstory evapotranspiration, which was not mea-sured, may account for these differences. Of these pre-vious studies, four were for monospecific, even-agedstands (Berbigier, 1996; Hogg et al., 1997; Granier etal., 1990; Saugier et al., 1997), quite dissimilar to ourstudy area. The forests studied by Köstner et al. (1992)and Granier et al. (2000) consisted of only one or twospecies, but with some diversity in tree stature andage. Walker Branch is also an uneven-aged forest, butin addition contains greater species diversity. Speciesand age diversity decrease the probability that the as-sumed relative contributions from trees instrumentedwith sap flow probes are representative of the meansource distribution measured by the time-dependenteddy covariance footprint. As a result of this variabilityat Walker Branch, greater sampling and scaling errorscan be expected than in some previous studies whenextrapolating sap flow measurements to represent aneddy covariance footprint. However, simplistic scalingprocedures based on inventory analysis across a num-ber of plots in the flux footprint did not account formost of the differences between these two methods.
Tree species at Walker Branch include conifers withnon-porous and hardwoods with both ring-porous(oaks) and diffuse-porous (red maple, blackgum, yel-low poplar, sugar maple) water conducting elements.Errors can be associated with radial gradients in sapflow and the perceived inability of sap flow probes toadequately integrate observed rates of sap flow alongtheir length (Phillips et al., 1996; Clearwater et al.,1999). The largest errors are expected to occur in

K.B. Wilson et al. / Agricultural and Forest Meteorology 106 (2001) 153–168 165
ring-porous trees, with underestimates of sap flow upto 45% being theoretically possible (Clearwater et al.,1999). However, although radial variation in sap flowwith sapwood depth were observed (in chestnut oak,data not shown), this variation was not of sufficientmagnitude to incorporate the corrections suggestedby Clearwater et al. (1999). Technical differencesbetween the original probe design (Granier, 1987)and the commercially-available thermal dissipationprobes used in our study should also be evaluated asa possible source of uncertainty. The TDP-30 probesare 30 mm in length and have the heating elementcontained within a cylindrical stainless-steel housing.This contrasts with the original design of Granier(1987) where the probes were only 20 mm in lengthand had the heating element wrapped around theprobe’s external surface. The possibility that suchdifferences in construction could lead to an underesti-mation of stand transpiration, such as that apparentlyobserved in this study, is unresolved.
Our sap flow estimates of transpiration appear tobe too low, but this does not discount errors or biasesin the eddy covariance and catchment water balancemethods. One source of bias between the two esti-mates is the representative scale. The catchment waterbalance is integrating over an area of 97.5 ha, whilethe eddy covariance footprint is about two ordersof magnitude less during daytime conditions. Also,when the wind direction has a westerly component(a common occurrence), the eddy covariance fluxfootprint is technically outside the proper limits ofWalker Branch Watershed. Despite these differencesin scale, the catchment water balance and eddy co-variance methods agreed on the general magnitudeof annual evapotranspiration. However, there was notcomplete agreement on annual fluctuations betweenthese two methods, and important errors associatedwith the methodologies and instrumentation shouldbe considered.
There was a lack of complete energy balance clo-sure (80%) from the eddy covariance measurements atWalker Branch (Wilson and Baldocchi, 2000), indicat-ing a biased error in the flux or available energy (netradiation subtracted by ground heat flux and canopyheat storage) measurements. However, lack of closureindicates that the summed fluxes of heat (latent andsensible) may be biased low, which is opposite of thebias required for eddy covariance and sap flow calcu-
lations to converge. Daily and annual sums of evapo-transpiration from eddy covariance are also subject toerrors when missing or rejected data were estimatedfrom regression, but these occurrences were primarilyat night when water vapor fluxes are expected to besmall. Because the eddy covariance footprint is muchsmaller below the canopy than above the canopy, soilevaporation is measured over a much smaller area thanevapotranspiration, and the two eddy covariance esti-mates may not be directly comparable. These errors insoil evaporation due to representativeness are expectedto be on the order of 10% (Wilson and Meyers, 2000).We also expect that estimates of soil evaporation maybe biased low by 5–10% as a result of high frequencyloss of flux (Wilson and Meyers, 2000). However,neither of these considerations will substantially alterthe conclusions presented here.
Potential errors with the catchment water balancemethod should also be considered. Catchment esti-mates of annual evapotranspiration are based on anindirect calculation of the residual in the water bal-ance equation. The magnitude of this residual is sus-ceptible to ‘leaks’ (deep drainage losses), assumptionsconcerning the timing and presence of full systemrecharge, and other assumptions about the area of thegroundwater divide relative to the surface water divideon which areal precipitation is determined (Luxmooreand Huff, 1989; Adams et al., 1994; Wullschlegeret al., 1998). Walker Branch is underlain by dolomiteand may have groundwater inflows or outflows via so-lution cavities or fractured bedrock. It is suspected thatthe area of the groundwater divide at Walker Branchmay exceed the surface water divide by about 5%(Luxmoore and Huff, 1989), which will result in un-derestimates of evapotranspiration.
The large scatter in the relationship between evapo-transpiration estimated using the soil water budget andeither eddy covariance or sap flow estimates is likely aresult of spatial variability in soil moisture profiles anduncertainties concerning drainage and rooting depths.No attempt was made to locate the zero-flux plane(Rutter, 1968; Cuenca et al., 1997) in this study, whichis a likely source of error. However, we did not in-clude periods immediately following rainfall events inour analysis, which is when drainage was likely mostimportant.
More detailed soil water balance studies in north-ern (Moore et al., 2000) and southern (Cuenca et al.,

166 K.B. Wilson et al. / Agricultural and Forest Meteorology 106 (2001) 153–168
1997) Jack pine stands, which carefully accounted fordrainage, also did not compare well with eddy covari-ance measurements for much of the season. In the Jackpine studies, the magnitude of the soil water budgetestimates of evapotranspiration were about 60% lowerthan eddy covariance estimates during the second halfof the growing season. The soil water budget estimatesin our study were also lower than eddy covariance dur-ing dry periods, but possibly because roots were tap-ping water at depths below the deepest measurementprobes (700 mm) (Teskey and Sheriff, 1996).
5. Conclusions
1. The reasonably good agreement between the eddycovariance and catchment methods and the moder-ately acceptable energy balance closure gives someconfidence in these two approaches for estimat-ing annual evapotranspiration at Walker Branchover spatial scales ranging from approximately104–106 m2. Though imperfect, these methodsdo not require elaborate scaling considerations torepresent spatial areas that are orders of magni-tude greater than sap flow or soil water budgetmethods.
2. Sap flow and eddy covariance estimates are qual-itatively similar over much of the season. Sapflow measurements have other unique advantagesin addressing physiological responses and prob-ing heterogeneous environments. However, in thisscaling application the estimates are lower thanthat from the eddy covariance and catchment waterbalance methods, even after accounting for othercomponents of evapotranspiration. There may beerrors associated with scaling single tree estimates,or measurement errors associated with ring-porouswater conducting elements.
3. The soil water budget shows significant correlationwith the sap flow and eddy covariance methods.However, data scatter and excessive missing dataduring periods with rainfall inputs and rapid watermovement within the soil profile severely limit itsapplicability as a method for estimating annualevapotranspiration. Trees also may have accessedwater beneath the depth of our measurement probes(700 mm) during the height of drought, underesti-mating evapotranspiration using this method.
Acknowledgements
This work was funded by a grant from NASA/GEWEX and the US Department of Energy (Ter-restrial Carbon Program) and is a contribution tothe Ameriflux and FLUXNET projects. Funding forORNL researchers (PJH, PJM, SDW) was providedby the NSF/DOE/NASA/USDA/EPA/NOAA Inter-agency Program on Terrestrial Ecology and GlobalChange (TECO) through NASA’s Earth Science En-terprise Program under Interagency Agreement No.2013-K057-A1, and the Program for Ecosystem Re-search, Environmental Sciences Division, Office ofHealth and Environmental Research, U.S. Departmentof Energy under contract DE-AC05-00OR22725 withUniversity of Tennessee-Battelle LLC. Research wasconducted on the Oak Ridge National EnvironmentalResearch Park. E. Falge and D. Schindler provideddata on species inventory. M. Brewer, M. Hall andD. Auble provided field and laboratory assistance.J. Herewhe and R. Dobosy provided internal reviews.
References
Adams, M.B., Kochenderfer, J.N., Wood, F., Wood, T.R., Edwards,P., 1994. Forty years of hydrometerological data from theFernow Experimental Forest, West Virginia. USDA, ForestService, Northeastern Forest Experiment Station, GeneralTechnical Report NE-184.
Auble, D.L., Meyers, T.P., 1992. An open path, fast responseinfrared absorption gas analyzer for H2O and CO2.Boundary-Layer Meteorol. 59, 243–256.
Baldocchi, D.D., 1997. Flux footprints within and over forestcanopies. Boundary-Layer Meteorol. 85, 273–292.
Baldocchi, D.D., Meyers, T.P., 1991. Trace gas exchange at thefloor of a deciduous forest. I. Evaporation and CO2 efflux. J.Geophys. Res. 96, 7271–7285.
Baldocchi, D.D., Hicks, B.B., Meyers, T.P., 1988. Measuringbiosphere-atmosphere exchanges of biologically related gaseswith micrometeorological methods. Ecology 69, 1331–1340.
Baldocchi, D.D., Finnigan, J., Wilson, K.B., Paw U, K.T., Falge,E., 2000. On measuring net ecosystem carbon exchange overtall vegetation on complex terrain. Boundary-Layer Meteorol.96, 257–291.
Barrett, D.J., Hatton, T.J., Ash, J.E., Ball, M.C., 1996. Transpirationby trees from contrasting forest types. Aust. J. Bot. 44, 249–263.
Berbigier, P., Bonnefond, J.M., Lonstau, D., Ferreria, M.I.,David, J.S., Pereira, J.S., 1996. Transpiration of a 64-yearold maritime pine stand in Portugal. 2. Evapotranspiration andcanopy stomatal conductance measured by and eddy covariancetechnique. Oecologia 107, 43–52.
K.B. Wilson et al. / Agricultural and Forest Meteorology 106 (2001) 153–168 167
Bosch, J.M., Hewlett, J.D., 1982. A review of catchmentexperiments to determine the effect of vegetation changes onwater yield and evapotranspiration. J. Hydrol. 55, 3–23.
Calder, I.R., 1998. Water use by forests, limits and controls. TreePhysiol. 18, 625–631.
Calder, I.R., Narayanswamy, M.N., Srinivasalu, N.V., Darling,W.G., Lardner, A.J., 1986. Investigation into the use ofdeuterium as a tracer for measuring transpiration fromeucalyptus. J. Hydrol. 84, 345–351.
Cienciala, E., Lindroth, A., 1995. Gas-exchange and sap flowmeasurements ofSalix viminalistrees in short-rotation forest.Trees 9, 295–301.
Clearwater, M.J., Meinzer, F.C., Andrade, J.L., Goldstein, G.,Holbrook, N.M., 1999. Potential errors in measurement ofnonuniform sap flow using heat dissipation probes. Tree Physiol.19, 681–687.
Cuenca, R.H., Stangel, D.E., Kelly, S.F., 1997. Soil water balancein a boreal forest. J Geophys. Res. (D4) 29355–29365.
Daamen, C.C., Simmonds, L.P., Wallace, J.S., Laryea, K.B.,Sivakumar, M.V.K., 1993. Use of microlysimeters to measureevaporation from sandy soils. Agric. For. Meteorol. 65, 159–173.
Denmead, O.T., Dunin, F.X., Wong, S.C., Greenwood, E.A.N.,1993. Measuring water use efficiency of eucalypt trees withchambers and micrometeorological techniques. J. Hydrol. 150,649–664.
Dunin, F.X., 1991. Extrapolation of ‘point’ measurements ofevaporation: some issues of scale. Vegetatio 91, 39–47.
Eastham, J., Rose, C.W., Cameron, D.M., Rance, S.J., Talsma,T., 1988. The effect of tree spacing on evaporation from anagroforestry experiment. Agric. For. Meteorol. 42, 355–368.
Edwards, W.R.N., 1986. Precision weighing lysimetry for trees,using a simplified tared-balance design. Tree Physiol. 1, 127–144.
Granier, A., 1987. Evaluation of transpiration in a Douglass-firstand by means of sap flow measurements. Tree Physiol. 3,309–320.
Granier, A., Bobay, V., Gash, J.H.C., Gelpe, J., Saugier, B.,Shuttleworth, W.J., 1990. Vapour flux density and transpirationrate comparisons in a stand of Maritime pine (Pinus pinasterAit.) in Les Landes forest. Agric. For. Meteorol. 51, 309–319.
Granier, A., Biron, P., Lemoine, D., 2000. Water balance,transpiration and canopy conductance in two beech stands.Agric. For. Meteorol. 100, 291–308.
Greco, S., Baldocchi, D.D., 1996. Seasonal variations of CO2 andwater vapour exchange rates over a temperate deciduous forest.Global Change Biol. 2, 183–197.
Grimmond, C.S.B., Hanson, P.J., Cropley, F., Schmid, H.P.,Wullschleger, S., 2000. Evapotranspiration rates at the MorganMonroe State Forest Ameriflux site: a comparison of resultsfrom eddy covariance turbulent flux measurements and sapflow techniques. In: 15th Conference on Hydrology, AmericanMeteorological Society, Long Beach, CA, pp. 158–161.
Hogg, E.H., Black, T.A., den Hartog, G., Neumann, H.H.,Zimmermann, R., Hurdle, P.A., Blanken, P.D., Nesic, Z., Yang,P.C., Staebler, R.A., McDonald, K.C., Oren, R., 1997. Acomparison of sap flow and eddy fluxes of water vapor from aboreal deciduous forest. J. Geophys. Res. 102, 28929–28937.
Horst, T.W., Weil, J.C., 1992. Footprint estimation for scalar fluxmeasurements in the atmospheric boundary layer. Boundary-Layer Meteorol. 59, 279–296.
Huff, D.D., Luxmoore R.J., Begovich, C., 1977. TEHM: Aterrestrial ecosystem hydrology model. ORNL/NSL/EATC-27.Oak Ridge National Laboratory, Oak Ridge, TN.
Hutchison, B.A., Matt, D.R., McMillen, R.T., Gross, L.J.,Tajchman, S.J., Norman, J.M., 1986. The architecture of adeciduous forest canopy in eastern Tennessee USA. J. Ecol.74, 635–646.
Jaeger, L., Kessler, A., 1997. Twenty years of heat and waterbalance climatology at the Hartheim pine forest Germany.Agric. For. Meteorol. 84, 25–36.
Johnson, D.W., Lindberg, S.E. (Eds.), 1992. AtmosphericDeposition and Nutrient Cycling in Forest Ecosystems.Springer, New York.
Johnson, D.W., Van Hook, R.I. (Eds.), 1989. Analysisof Biogeochemical Cycling Processes in Walker BranchWatershed. Springer, New York.
Joslin, J.D., Wolfe, M.H., 1998. Impacts of long-term water inputmanipulations on fine root production and mortality in maturehardwood forests. Plant Soil 204, 165–174.
Kalma, S.J., Thorburn, P.J., Dunn, G.M., 1998. A comparison ofheat pulse and deuterium tracing techniques for estimating sapflow in Eucalyptus trees. Tree Physiol. 18, 697–705.
Kelliher, F.M., Köstner, B.M.M., Hollinger, D.Y., Byers, J.N.,Hunt, J.E., McSeveny, T.M., Meserth, R., Weir, P.L., Schulze,E.D., 1992. Evaporation, xylem sap flow, and tree transpirationin a New Zealand broad-leaved forest. Agric. For. Meteorol.62, 53–73.
Köstner, B.M.M., Schulze, E.-D., Kelliher, F.M., Hollinger, D.Y.,Byers, J.N., Hunt, J.E., McSeveny, T.M., Meserth, R., Weir,P.L., 1992. Transpiration and canopy conductance in a pristinebroad-leaved forest ofNothfagus: an analysis of xylem sap flowand eddy correlation measurements. Oecologia 91, 350–359.
Lee, X., Black, T.A., den Hartog, G., Newmann, H.H., Nesic,Z., Olejnik, J., 1996. Carbon dioxide exchange and nocturnalprocesses over a mixed deciduous forest. Agric. For. Meteorol.81, 13–29.
Luxmoore, R.J., 1983. Water budget of an eastern deciduous foreststand. Soil Sci. Soc. Am. J. 47, 785–791.
Luxmoore, R.J., Huff, D.D., 1989. Water. In: Johnson, D.W.,Van Hook, R.I. (Eds.), Analysis of Biogeochemical CyclingProcesses in Walker Branch Watershed. Springer, New York,pp. 164–196.
Luxmoore, R.J., Grizzard, T., Patterson, M.R., 1981. Hydraulicproperties of Fullerton cherty silt loam. Soil Sci. Soc. Am. J.45, 692–698.
Moore, K.E., Fitzjarrald, D.R., Sakai, R.K., Goulden, M.L.,Munger, J.W., Wofsy, S.C., 1996. Season variation in radiativeand turbulent exchange at a deciduous forest in centralMassachusetts. J. Appl. Meteorol. 35, 122–134.
Moore, K.E., Fitzjarrald, D.R., Sakai, R.K., Freedman, J.M., 2000.Growing season water balance at a boreal Jack Pine forest.Water Resour. Res., in press.
Paw U, K.T., Baldocchi, D.D., Meyers, T.P., Wilson, K.B., 2000.Correction of eddy-covariance measurements incorporating both

168 K.B. Wilson et al. / Agricultural and Forest Meteorology 106 (2001) 153–168
advective effects and density fluxes. Boundary-Layer Meteorol.,in press.
Phillips, N., Oren, R., Zimmermann, R., 1996. Radial patterns ofxylem sap flow in non- or diffuse- and ring-porous species.Plant Cell Environ. 19, 983–990.
Priestly, C.H.B., Taylor, R.J., 1972. On the assessment of surfaceheat flux and evaporation using large-scale parameters. MonthlyWeather Rev. 100, 81–92.
Rutter, A.J. 1968. Water consumption by forests. In: Kozlowski,T.T. (Ed.), Water Deficits and Plant Growth. Academic Press,New York, Chapter 2, pp. 23–84.
Saugier, B., Granier, A., Pontailler, J.Y., Dufrene, E., Baldocchi,D.D., 1997. Transpiration of a boreal pine forest measured bybranch bag, sap flow and micrometerological methods. TreePhysiol. 17, 511–519.
Smith, D.M., Allen, S.J., 1996. Measurement of sap flow in plantstems. J. Exp. Bot. 47, 1833–1844.
Swift Jr., L.W., Cunningham, G.B., Douglass, J.E., 1988. Climateand hydrology. In: Swank, W.T., Crossley Jr., D.A. (Eds.), ForestHydrology and Ecology at Coweeta. Springer, New York.
Teskey, R.O., Sheriff, D.W., 1996. Water use byPinus radiatatrees in a plantation. Tree Physiol. 16, 273–279.
Wilson, K.B., Baldocchi, D.D., 2000. Seasonal and interannualvariability of energy fluxes over a broadleaved temperate deci-duous forest in North America. Agric. For. Meteorol. 100, 1–18.
Wilson, K.B., Meyers, T.P., 2000. The spatial variability ofenergy and carbon fluxes at the floor of a deciduous forest.Boundary-Layer Meteorol., in press.
Wilson, K.B., Hanson, P.J., Baldocchi, D.D., 2000a. Factorscontrolling evaporation and energy partitioning beneath adeciduous forest over an annual cycle. Agric. For. Meteorol.102, 83–103.
Wilson, K.B., Baldocchi, D.D., Hanson, P.J., 2000b. Spatial andseasonal variability of photosynthetic parameters and theirrelationship to leaf nitrogen in a deciduous forest. Tree Physiol.20, 565–578.
Wilson, K.B., Baldocchi, D.D., Hanson, P.J., 2000c. Quantifyingstomatal and non-stomatal limitations to carbon assimilationrate as a result of leaf aging and drought in mature deciduoustree species. Tree Physiol. 20, 787–797.
Wullschleger, S.D., Meinzer, F.C., Vertessy, R.A., 1998. A reviewof whole-plant water use studies in trees. Tree Physiol. 18,499–512.
Wullschleger, S.D., Hanson, P.J., Todd, D.E., 2000a. Transpirationfrom a multi-species deciduous forest as estimated by xylemsap flow techniques. For. Ecol. Manage., in press.
Wullschleger, S.D., Wilson, K.B., Hanson, P.J., 2000b.Environmental control of whole-plant transpiration, canopyconductance and estimates of the decoupling coefficient forlarge red maple trees. Agric. For. Meteorol. 104, 157–168.