Embed Size (px)
DESCRIPTION
sfs
Citation preview

Cognos(R) 8 Business Intelligence
GETTING STARTED

Product InformationThis document applies to Cognos(R) 8 Version 8.3 and may also apply to subsequent releases. To check for newer versions of this document,visit the Cognos Global Customer Services Web site (http://support.cognos.com).
CopyrightCopyright © 2007 Cognos Incorporated.Portions of Cognos® software products are protected by one or more of the following U.S. Patents: 6,609,123 B1; 6,611,838 B1; 6,662,188B1; 6,728,697 B2; 6,741,982 B2; 6,763,520 B1; 6,768,995 B2; 6,782,378 B2; 6,847,973 B2; 6,907,428 B2; 6,853,375 B2; 6,986,135 B2;6,995,768 B2; 7,062,479 B2; 7,072,822 B2; 7,111,007 B2; 7,130,822 B1; 7,155,398 B2; 7,171,425 B2; 7,185,016 B1;7,213,199 B2.Cognos and the Cognos logo are trademarks of Cognos Incorporated in the United States and/or other countries. All other names are trademarksor registered trademarks of their respective companies.While every attempt has been made to ensure that the information in this document is accurate and complete, some typographical errors ortechnical inaccuracies may exist. Cognos does not accept responsibility for any kind of loss resulting from the use of information containedin this document.This document shows the publication date. The information contained in this document is subject to change without notice. Any improvementsor changes to either the product or the document will be documented in subsequent editions.U.S. Government Restricted Rights. The software and accompanying materials are provided with Restricted Rights. Use, duplication, ordisclosure by the Government is subject to the restrictions in subparagraph (C)(1)(ii) of the Rights in Technical Data and Computer Softwareclause at DFARS 252.227-7013, or subparagraphs (C)(1) and (2) of the Commercial Computer Software - Restricted Rights at 48CFR52.227-19,as applicable. The Contractor is Cognos Corporation, 15 Wayside Road, Burlington, MA 01803.This software/documentation contains proprietary information of Cognos Incorporated. All rights are reserved. Reverse engineering of thissoftware is prohibited. No part of this software/documentation may be copied, photocopied, reproduced, stored in a retrieval system, transmittedin any form or by any means, or translated into another language without the prior written consent of Cognos Incorporated.
Table of Contents
Introduction 5Using This Document 5
Chapter 1: Cognos 8 Business Intelligence 9Cognos Connection 10Query Studio 10Report Studio 10
Professional Authoring Mode 10Express Authoring Mode 11
Event Studio 11Metric Studio 11Analysis Studio 12Cognos 8 Go! Office 12Cognos 8 Go! Search 12Transformer 13How Cognos 8 Works 13Viewing and Organizing Content 16Administration of Cognos 8 17
Security 17Scheduling Content 18The Software Development Kit 18
Integrating with Other Cognos Products 18Building Cognos 8 Applications 19
Chapter 2: Cognos 8 Examples 21Example - Run a Report 21Example - Schedule a Report 24Example - Create a Portal Page 26Example - Create a Query 28Example - Create a Statement-Style Report 32Example - Create a Report 36Example - Manage an Event 41Example - Monitor Performance 45Example - Create an Analysis 51Example - Work with Cognos Content in Microsoft Excel 56Example - Search for Business Intelligence Content 59
Glossary 61
Index 67
Getting Started 3

4
Table of Contents

Introduction
This document is intended for use with Cognos 8. Cognos 8 is a Web product with integrated
reporting, analysis, scorecarding, and event management features.
Using This DocumentThis document introduces the Cognos 8 Business Intelligence architecture and provides examples
to illustrate key functionality.
The following products are part of the Cognos 8 Performance Management solution, and are not
discussed in this document:
● Cognos 8 Controller is a Web-based financial consolidation tool that provides standard reports
to support both statutory and management reporting
For more information, see the Cognos 8 Controller User Guide.
● Cognos 8 Workforce Performance is a next-generation analytic application geared to helping
organizations optimize their human capital management. It is the first analytic application to
capitalize on the open modern architecture of Cognos 8 Business Intelligence. It provides human
resources executives and managers with a complete spectrum of packaged reports on key,
configurable workforce measures to help improve planning and management decisions.
For more information, see the Cognos 8 Adaptive Analytics User Guide and the Cognos 8
Adaptive Warehouse User Guide.
● Cognos Planning provides the ability to plan, budget, and forecast in a collaborative, secure
manner. There are two major components: Cognos Planning - Analyst and Cognos Planning -
Contributor.
For more information see the Cognos Planning - Analyst User Guide and the Cognos Planning
- Contributor Administration Guide.
Audience
This document is intended for users who are new to Cognos 8 Business Intelligence.
Related Documentation
Our documentation includes user guides, getting started guides, new features guides, readmes, and
other materials to meet the needs of our varied audience. The following documents contain related
information and may be referred to in this document.
Note: For online users of this document, a Web page such as The page cannot be found may appear
when clicking individual links in the following table. Documents are made available for your
particular installation and translation configuration. If a link is unavailable, you can access the
document on the Cognos Global Customer Services Web site (http://support.cognos.com). Logon
Getting Started 5
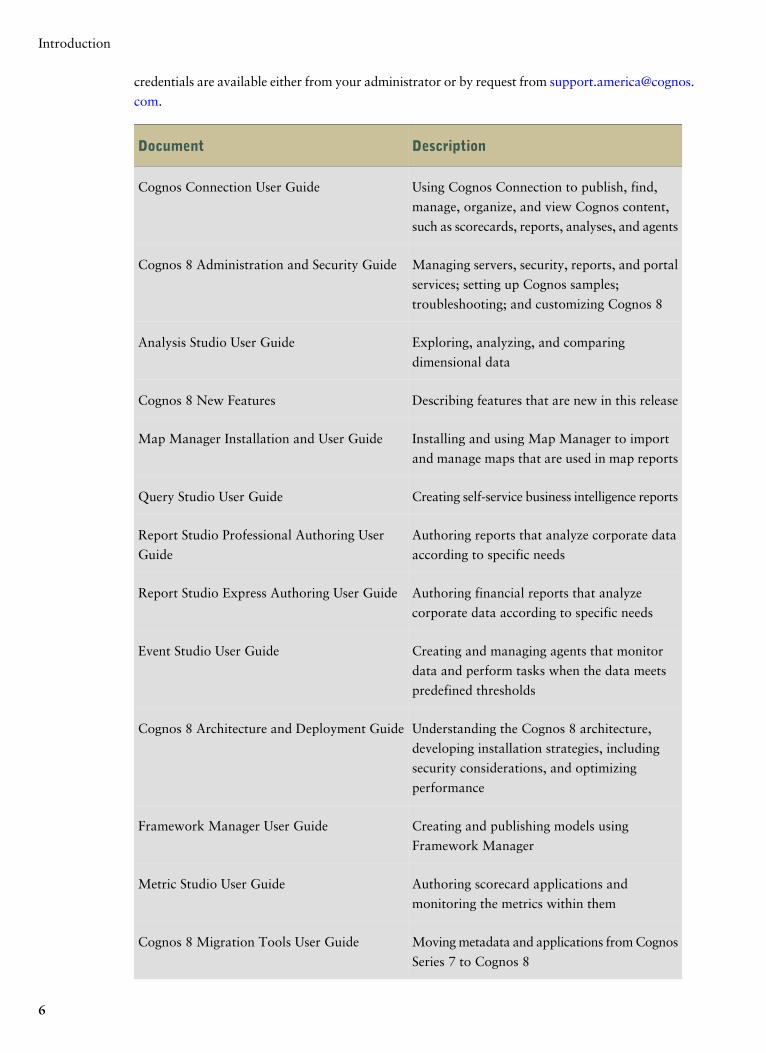
credentials are available either from your administrator or by request from support.america@cognos.
com.
DescriptionDocument
Using Cognos Connection to publish, find,
manage, organize, and view Cognos content,
such as scorecards, reports, analyses, and agents
Cognos Connection User Guide
Managing servers, security, reports, and portal
services; setting up Cognos samples;
troubleshooting; and customizing Cognos 8
Cognos 8 Administration and Security Guide
Exploring, analyzing, and comparing
dimensional data
Analysis Studio User Guide
Describing features that are new in this releaseCognos 8 New Features
Installing and using Map Manager to import
and manage maps that are used in map reports
Map Manager Installation and User Guide
Creating self-service business intelligence reportsQuery Studio User Guide
Authoring reports that analyze corporate data
according to specific needs
Report Studio Professional Authoring User
Guide
Authoring financial reports that analyze
corporate data according to specific needs
Report Studio Express Authoring User Guide
Creating and managing agents that monitor
data and perform tasks when the data meets
predefined thresholds
Event Studio User Guide
Understanding the Cognos 8 architecture,
developing installation strategies, including
security considerations, and optimizing
performance
Cognos 8 Architecture and Deployment Guide
Creating and publishing models using
Framework Manager
Framework Manager User Guide
Authoring scorecard applications and
monitoring the metrics within them
Metric Studio User Guide
Moving metadata and applications from Cognos
Series 7 to Cognos 8
Cognos 8 Migration Tools User Guide
6
Introduction

DescriptionDocument
Using Cognos 8 Go! Office to retrieve content
from Cognos reporting products within
Microsoft Office
Cognos 8 Go! Office User Guide
Finding Information
To find the most current product documentation, including all localized documentation, access the
Cognos Global Customer Services Web site (http://support.cognos.com). Click the Documentation
link to access documentation guides. Click the Knowledge Base link to access all documentation,
technical papers, and multimedia materials.
Product documentation is available in online help from the Help menu or button in Cognos products.
You can also download documentation in PDF format from the Cognos Global Customer Services
Web site.
You can also read PDF versions of the product readme files and installation guides directly from
Cognos product CDs.
Using Quick Tours
Quick tours are short online tutorials that illustrate key features in Cognos product components.
To view a quick tour, start Cognos Connection and click the Quick Tour link in the lower-right
corner of the Welcome page.
Getting Help
For more information about using this product or for technical assistance, visit the Cognos Global
Customer Services Web site (http://support.cognos.com). This site provides product information,
services, user forums, and a knowledge base of documentation and multimedia materials. To create
a case, contact a support person, or to provide feedback, click the Contact Us link. For information
about education and training, click the Training link.
Printing Copyright Material
You can print selected pages, a section, or the whole book. Cognos grants you a non-exclusive,
non-transferable license to use, copy, and reproduce the copyright materials, in printed or electronic
format, solely for the purpose of operating, maintaining, and providing internal training on Cognos
software.
Getting Started 7
Introduction

8
Introduction

Chapter 1: Cognos 8 Business Intelligence
Cognos 8 Business Intelligence is an integrated business intelligence suite that provides a wide range
of functionality to help you understand your organization’s data. Everyone in your organization
can use Cognos 8 to view or create business reports, analyze data, and monitor events and metrics
so that they can make effective business decisions.
Cognos 8 integrates the following business intelligence activities in one Web-based solution.
Before you use Cognos 8, you should understand how each of the components that make up the
Cognos 8 user interfaces can help you do your job.
ComponentActivity
Cognos ConnectionPublishing, managing, and viewing content
Query StudioAd hoc querying
Report StudioManaged reporting
Event StudioEvent management and alerting
Metric StudioScorecarding and metrics
Analysis StudioAnalyzing your business
Cognos 8 Go! OfficeWorking with Cognos content in Microsoft Office
Cognos 8 Go! SearchSearch for business intelligence content
For more information about how Cognos 8 products work together, see "How Cognos
8 Works" (p. 13).
You will also want to know how to use Cognos Connection and the Cognos Administration console
to view and organize content (p. 16), set up administration (p. 17) and security (p. 17), and schedule
content (p. 18).
If you are building Cognos 8 applications, you may want to understand the Cognos 8 software
development kit (p. 18) and workflow (p. 18).
Depending on your licensing permissions, you may not have access to all the functionality available
in Cognos 8.
Getting Started 9
Cognos ConnectionCognos Connection is the Web portal for Cognos 8. It is the starting point to access your BI
information and the functionality of Cognos 8. Use the portal to publish, find, manage, organize,
and view your organization’s business intelligence content, such as reports, scorecards, and agents.
If you have the necessary permissions, you can access the various studios from the portal and use
the portal for content administration, including scheduling and distributing reports, and creating
jobs.
You view reports in Cognos Viewer.
System administrators also use the portal to administer servers, optimize performance, and set
access permissions.
For information about using Cognos Connection, see "Example - Run a Report" (p. 21), "Example
- Schedule a Report" (p. 24), and "Example - Create a Portal Page" (p. 26).
Query StudioQuery Studio is the reporting tool for creating simple queries and reports in Cognos 8. Casual or
novice users use Query Studio to create self-serve reports that answer simple business questions.
With minimal steps, you can view data, author basic reports, change the report layout, filter and
sort data, add formatting, and create charts.
When you use Query Studio, you interact directly with your data.
For information about using Query Studio, see "Example - Create a Query" (p. 28).
Report StudioReport Studio has been extended to serve the needs of users who need quick and easy report creation
and formatting capabilities, without requiring professional authoring skills. Report Studio now
contains the traditional Professional authoring mode, with enhancements in this release, as well as
the Express authoring mode.
Authoring Modes
To meet the needs of both regular report authors and financial report authors, Report Studio
provides tailored user interfaces that contain reporting features relevant to these roles. Access to
each authoring mode is determined by the permissions you have to secured functions and features.
For more information, see the Administration and Security Guide.
Professional Authoring Mode
The Professional authoring mode gives users access to the full range of Report Studio functionality.
In this mode, you can create any report type, including charts, maps, lists, and repeaters, using any
data source (relational or multi-dimensional). It contains a superset of the features available in the
Express authoring mode. However, you cannot view live data.
10
Chapter 1: Cognos 8 Business Intelligence

For more information about using the Report Studio Professional authoring mode, see "Example
- Create a Report" (p. 36).
Express Authoring Mode
The Express authoring mode provides a simplified and focused Report Studio interface. It is designed
for non-technical users to create traditional financial and management statement reports. It allows
access to dimensionally-modeled data and uses a member-oriented data tree, by default.
This authoring mode allows you to see live data and supports crosstab reports at this time. It
contains a subset of the features available in the Professional authoring mode.
When you are in the Express authoring mode, if you open a report that was authored in the
Professional authoring mode, you can see but cannot modify objects that can be inserted only in
the Professional authoring mode, such as charts, maps, and lists.
For more information about using the Report Studio Express authoring mode, see "Example -
Create a Statement-Style Report" (p. 32).
Event StudioUse Event Studio to notify decision-makers in your organization of events as they happen, so that
they can make timely and effective decisions.
Use Event Studio to create agents that monitor status changes, priority customers, your organization’s
data to detect occurrences of business events, or any other factor that is important to your business.
Specify the event condition, or a change in data, that is important to you. When an agent detects
an event, it can perform tasks, such as sending an email, adding information to the portal, and
running reports.
For information about using Event Studio, see "Example - Manage an Event" (p. 41).
Metric StudioUse Metric Studio to create a customized scorecarding environment to monitor and analyze business
metrics throughout your organization. Metric Studio helps you translate your organization's strategy
into relevant, measurable goals that align each employee's actions and accountability with a strategic
plan.
A rich scorecarding environment of Metric Studio shows you where your organization is successful
and where it needs improvement. It tracks performance against predetermined targets and indicates
the current status of the business so that decision makers at every level of the organization can react
and plan.
With Metric Studio, you can readily see how the organization is progressing against its strategy.
You can set priorities for your own actions and understand how your decisions affect the performance
of the company.
Use the flexibility of Metric Studio to model metrics and their relationships based on any standard
or proprietary scorecarding and management methodology that you already use.
Getting Started 11
Chapter 1: Cognos 8 Business Intelligence

For information about using Metric Studio, see "Example - Monitor Performance" (p. 45).
Analysis StudioManagers and analysts use Analysis Studio to better understand their business and to get answers
to questions that they have about their business. Users can quickly and easily perform analysis to
get to the what and why behind an event or action so that they can improve business performance.
With analysis, it is possible to see trends and understand anomalies or variances that may not be
evident with other types of reporting. Analysis Studio users can easily zoom in on what is important
even with large volumes of dimensional data.
When you use Analysis Studio, you interact directly with visible data.
For information about using Analysis Studio, see "Example - Create an Analysis" (p. 51).
Cognos 8 Go! OfficeBy using Cognos 8 Go! Office, you can work with secure Cognos content in your familiar Microsoft
Office environment. You can retrieve report content from a variety of Cognos applications, including
Cognos 8 and Cognos PowerPlay. Cognos 8 Go! Office provides access to all Cognos report content,
including data, metadata, headers, footers, and charts. You can use predefined reports or create
new content using Query Studio, Analysis Studio, or Report Studio.
By importing content into Microsoft Office Excel, you can work with the data and leverage Microsoft
Office Excel’s formatting, calculation, and presentation capabilities. You can also use the formatting
and charting features of Microsoft Office Excel.
By importing content into Microsoft Office PowerPoint and Microsoft Office Word, you can include
reports and charts to enhance your presentations and documents.
For more information about Cognos 8 Go! Office, see "Example - Work with Cognos Content in
Microsoft Excel" (p. 56).
Cognos 8 Go! SearchWith Cognos Go! Search, you can perform full-text searches of Cognos 8 business intelligence
content. You can use this search in Cognos Connection, Cognos Viewer, Query Studio, and Analysis
Studio.
With Cognos Go! Search, you can quickly find relevant business intelligence information presented
in reports, analyses, dashboards, metric information, and events. Your search results are ranked
based on your priorities.
Administrators create and manage the search index. Administrators can also create Go! cards which
allow enterprise search engines, such as IBM WebSphere Information Integrator OmniFind Edition,
to index Cognos 8 content. Cognos Go! Search also allows administrators to easily supply the
Google OneBox for Enterprise with report, metric and search result content.
12
Chapter 1: Cognos 8 Business Intelligence
For more information about Cognos 8 Go! Search, see "Example - Search for Business Intelligence
Content" (p. 59).
TransformerCognos 8 Transformer is a multidimensional data modeling component designed for use with
Cognos 8.3 and subsequent releases.
You use this component to create a multidimensional model; a business presentation of the
information in one or more different data sources which share common data. After you add the
needed metadata from Cognos 8 packages, reports, and other various data sources, model the
needed dimensions, customize the measures, and apply Cognos 8 secured views with dimensional
filtering, you can create PowerCubes based on this model. You can deploy these cubes to support
OLAP reporting and analysis around the globe.
How Cognos 8 WorksWhen you view or create a report, you are viewing and manipulating data stored in your
organization’s databases. The following diagram explains the steps involved in using Cognos 8.
Getting Started 13
Chapter 1: Cognos 8 Business Intelligence

multi-dimensionalcube
ROLAPdatabase
relationaldatabase
otherdata source
Customerdatabases
CognosViewer
View reports
MetricStudio
Monitorperformance
QueryStudio
Create queries
AnalysisStudio
Analyze yourbusiness
EventStudio
Monitor events
ReportStudio
Create reports
Data modelingand packaging
Run, view,and managecontent
FrameworkManager
MetricDesigner
1
2
3
Cognos 8Go! Office
Work withCognos content inMicrosoft Office
Transformer6
CognosConnection
5 4
1. In Framework Manager, the modeler ensures that metadata is presented in a manner that business users canunderstand it. Modelers import the metadata from one or more databases, and then add to the model to meet userrequirements.
2. In Metric Designer, the modeler identifies the data items and calculations that form the targets and actual resultsfor each metric.
3. The modeler then publishes and updates packages to Cognos Connection so that authors can use them to createreports, agents, and scorecards.
4. Business users and report authors use the published packages to understand their business data.
5. Users run, view, and manage their content in Cognos Connection. Depending on their security permission they maybe able to simply run and view reports or manage schedules, portal layout, and other users’ permissions.
6. In Transformer, you can leverage queries in published packages, queries fromCognos 8 reports, and personal datasources, such as Microsoft Excel, to create a unique, focused model of your business. Transformer is Cognos’ industryleading OLAP modeling tool, which is designed so that business users can be self-sufficient in modeling a view ofthe business that suits the needs of their department or specialty.
14
Chapter 1: Cognos 8 Business Intelligence

For more information, see the Cognos 8 Architecture and Deployment Guide.
Report Specifications
When authors create a report, they are actually creating a report specification. The report
specification is an XML representation of the queries and prompts that are used to retrieve data,
as well as the layouts and styles used to present the data. For simplicity, the report specification is
called the report.
Report specifications can be useful to report authors for troubleshooting.
For information about working with report specifications, see the Report Studio Professional
Authoring User Guide or the Report Studio Express Authoring User Guide, and the Cognos 8
Software Development Kit Developer Guide.
Models and Packages
Because stored data is typically designed for storage, and not for reporting, a data modeler uses
Framework Manager to create metadata models. A model structures, adds to, and manages data
in ways that make sense to business users. For example, a model defines business rules, data
descriptions, data relationships, business dimensions and hierarchies, and other administration
tasks.
Planning and creating a model is an important task that should be performed by a modeler or a
modeling team familiar with both the database structure and the needs of the business users.
After the metadata model is defined, modelers create a package to make metadata available to
report authors. Each package must contain all the information that a specific user or group of users
needs to create reports. For example, one package can contain human resources data, and another
sales data. When users open an authoring studio, they must select which package to use. Each report
can contain data from only one package.
After a package has been made available in Cognos Connection, a Transformer modeler can begin
to design a multidimensional PowerCube for more summarized analysis of the business. The queries
can be created directly in Transformer using metadata from any published package. A business
specialist could also design their own model for more focused analysis and combine metadata from
different packages and even include personal data using flat files.
A more refined query intended for Transformer modeling could be authored by a business specialist
by creating a report in Query Studio or Report Studio. That report can then be accessed in
Transformer allowing the business specialist full control over changes to the report, and therefore
the query, rather than relying on the Framework Manager administrator for changes. Once the
multidimensional design is complete, Cognos 8 security can be added with dimensional filtering
and the PowerCube built. The PowerCube can then be published to Cognos Connection just like
any other package, making it available for multidimensional analysis and reporting.
For information about data modeling, see the Framework Manager User Guide, the Metric Designer
User Guide, or the Cognos 8 Transformer User Guide.
Getting Started 15
Chapter 1: Cognos 8 Business Intelligence

Viewing and Organizing ContentWhen you view and run a report, scorecard, or agent, the information that you see comes from
data sources, the package, calculations, other properties added by the author, and from Cognos 8
itself.
You use Cognos Connection to organize your reports and other Cognos 8 content such as agents,
metrics packages, URLs, and folders. You can access public content in the Public Folders tab or
custom portal pages, and store and access your favorite content in the My Folders tab.
Report and Agent Views
If you want to personalize an existing public report or agent, you can create a report or agent view
and save the view in the My Folders tab. This allows you to save prompt values, modify the schedule,
and change the output format of reports.
For more information, see the online help in Cognos Connection.
Report Outputs
When a report is run, it contains the latest data from the data source. However, viewing the most
recent data may not always meet your needs. When you want to view older data, you save and view
the report output.
Report outputs are created when you schedule a report, when a report has multiple formats or
languages, when a report has a delivery method of save, print, or email, and when a report is burst.
You can produce report outputs in the following formats:
● HTML
● Excel
● delimited text (CSV)
● XML
If you are the owner of a report or have the necessary permissions, you can specify the default
format for each report. You can also specify how many report output versions to keep.
For more information, see the online help in Cognos Connection.
Drill-through Links
A report can contain drill-through links, also known as Go To links, so that you can easily open
related content. A value in the report is linked to more detailed information in another report. For
example, a report includes sales information for each continent. When you click a continent name,
a more detailed report about sales for that specific continent opens.
When you view report data in Cognos Connection, Query Studio, and Analysis Studio, you can
also drill down and drill up. When you drill down, you follow a link from one layer of data to a
more detailed layer within the same report. When you drill up, you access a less detailed layer.
16
Chapter 1: Cognos 8 Business Intelligence

For more information, see the online help in Cognos Connection, Query Studio, or Analysis Studio.
Multilingual User Interface and Content
Cognos 8 is a multilingual solution that lets you author reports once and deploy them globally.
When users open a report, it automatically opens in the proper language, based on their locale
settings.
You can select the language that you prefer for the user interface. If your data and reports are
available in multiple languages, you can also select the language that you prefer for the content.
To deliver multilingual content, you can create each entry with multilingual properties in the
appropriate studio.
For more information about the multilingual capabilities of Cognos 8, see the online help in Cognos
Connection or see the Cognos 8 Architecture and Deployment Guide.
Portal Pages
In Cognos Connection, you can create your own custom portal pages. You use these portal pages
to view frequently-used content, to group related reports and folders, and to combine Cognos and
non-Cognos content within a single page. Within your portal pages, you can add Cognos portlets,
which you use to view and interact with your Cognos content.
If you have the necessary permissions, you can create public pages that other users and groups can
access and even use as their own. You can assign security permissions to allow only certain users
to access the pages.
For more information, see the online help in Cognos Connection.
Administration of Cognos 8Cognos 8 administrators ensure that Cognos 8 runs smoothly and at its optimum performance.
They can
● define connections to the organization’s data sources
● define security permissions for users and groups in the organization
● specify distribution lists, contacts, and printers
● manage servers and dispatchers and fine-tune the performance of Cognos 8
● pre-define links for an entire package that authors can then easily add to their reports
● customize the appearance and functionality of Cognos 8
For more information, see the Cognos 8 Administration and Security Guide.
Security
Cognos 8 is secured by setting permissions and enabling user authentication. If anonymous access
is enabled, you can use Cognos 8 without authenticating as a specific user.
Getting Started 17
Chapter 1: Cognos 8 Business Intelligence

In Cognos 8, administrators define permissions so that users can access functionality. For example,
to edit a report using Report Studio, you must have the appropriate security and licensing
permissions.
In addition, each entry in Cognos Connection is secured to define who can read, edit, and execute
the entry.
For more information, see the online help in the Cognos Administration console.
Scheduling Content
You can schedule most content that appears in Cognos Connection to run at a time that is convenient
for you.
You can schedule
● reports
● metrics
● metrics data refreshes
● agents
● deployments
You can also create jobs to schedule multiple entries together.
For more information, see the online help in Cognos Connection.
The Software Development Kit
The Cognos 8 software development kit (SDK) provides a platform-independent automation interface
for working with Cognos 8 services and components. Developers in your organization can use the
Cognos 8 SDK to create custom reports, manage deployment, and integrate security and portal
functionality to suit your needs, locale, and existing software infrastructure. The SDK uses a
collection of cross-platform Web services, libraries, and programming interfaces.
You can choose to automate only a specific task, or you can program the entire process from
modeling through to reporting, scheduling, and distribution.
The SDK is available as a separate package.
For more information, see the Cognos 8 SDK Developer Guide and Cognos 8 SDK Getting Started
Guide.
Integrating with Other Cognos ProductsCognos 8 is fully integrated with other Cognos products so your business intelligence capabilities
can grow with your needs.
When you integrate Cognos Series 7 with Cognos 8, you can
● access Series 7 reports from Cognos Connection
18
Chapter 1: Cognos 8 Business Intelligence

● access PowerCubes built with PowerPlay Transformer 7
When you integrate Cognos Planning products with Cognos 8, you can
● access Cognos Planning - Contributor from Cognos Connection
● create queries, analyses, and reports based on Cognos Planning and Cognos Finance data
For more information, see the Cognos Planning - Contributor Administration Guide.
Building Cognos 8 ApplicationsThe lifetime of a Cognos 8 business intelligence application can be months, or years. During that
time, data may change, and new requirements appear, so authors must modify existing content and
develop new content, and administrators must update models and data sources as the underlying
data changes. For more information about using data sources, see the Administration and Security
Guide and the Framework Manager User Guide.
In a working application, the technical and security infrastructure and the portal are in place, as
well as processes for change management, data control, and so on. For information about the
workflow associated with creating Cognos 8 content, see the Architecture and Deployment Guide.
For more information, see the Cognos Solutions Implementation Methodology toolkit, which
includes implementation roadmaps and supporting documents. The Cognos SIM toolkit is available
on the Cognos Global Services Web site, http://support.cognos.com/en/consulting/csim/index.html.
Locate and preparedata sources and models
Build and publishthe content Deliver the information
❑ locate and prepare data sources and models
Cognos 8 can report from a wide variety of data sources, both relational and dimensional.
Database connections are created in the web administration interface, and are used for modeling,
for authoring and for running the application.
To use data for authoring and viewing, the business intelligence studios need a subset of a
model of the metadata (called a package). The metadata may need extensive modeling in
Framework Manager.
❑ build and publish the content
Reports, scorecards, and so on are created in the business intelligence studios of Cognos 8.
Which studio you use depends on the content, lifespan and audience of the report, and whether
the data is modeled dimensionally or relationally. For example, self-service reporting and
analysis are done through Query Studio and Analysis Studio, and scheduled reports are created
in Report Studio. Report Studio reports and scorecards are usually prepared for a wider audience,
published to Cognos Connection or another portal, and scheduled there for bursting, distribution,
and so on. You can also use Report Studio to prepare templates for self-service reporting.
❑ deliver and view the information
Getting Started 19
Chapter 1: Cognos 8 Business Intelligence

You deliver content from the Cognos portal or other supported portals, and view information
that has been saved to portals, or delivered by other mechanisms. You can also run reports,
analyses, scorecards, and so on from within the business intelligence studio in which they were
created.
For information about tuning and performance, see the Administration and Security Guide and
the Cognos Global Services Web site, http://support.cognos.com.
20
Chapter 1: Cognos 8 Business Intelligence

Chapter 2: Cognos 8 Examples
The following examples show the different functionality of the various Cognos 8 components:
● run a report in Cognos Connection (p. 21)
● schedule a report in Cognos Connection (p. 24)
● create a portal page in Cognos Connection (p. 26)
● create a query in Query Studio (p. 28)
● create a statement-style report in Report Studio (p. 32)
● create a report in Report Studio (p. 36)
● manage an event in Event Studio (p. 41)
● monitor the performance of your business in Metric Studio (p. 45)
● analyze items in your business data in Analysis Studio (p. 51)
● work with Cognos content in Microsoft Office Excel using Cognos 8 Go! Office (p. 56)
● search for business intelligence content using Cognos Go! Search (p. 59)
You can do any of these examples without having to do them all. For example, you can start with
the Analysis Studio example without doing the previous examples.
Before you experiment with a data source of your own, we recommend that you try these examples
using the sample data.
Cognos Samples
Before you can work through these examples, ensure that the Cognos samples are set up. They
show a good cross section of reports that you can create using Cognos 8.
For more information, contact your administrator or see the Cognos 8 Administration and Security
Guide.
The sample databases shipped with Cognos 8 contain data from the operations of a fictional retail
company, the Great Outdoors Company. The Great Outdoors Company sells camping and sports
equipment directly in retail stores across the world, and through other manufacturers.
Example - Run a ReportCognos Connection is the Web portal that gives you access to all the Cognos 8 functionality. In the
portal, you can run reports.
In this exercise, you will learn how to
Getting Started 21

● navigate the portal
● run a report
● navigate within a report
● view the report in a different format
You are a business analyst for the Great Outdoors Company. You are asked to study the percentage
of products that are returned. Returned items reveal important information about the quality of
products, especially when products are returned because they are defective or are missing parts.
Things to Notice
The icon for a report shows the default format and default action of the report.
Reports that have saved outputs have an additional icon in the Actions column.
At any time, you can click the arrow next to the help button, and click Go to the Welcome Page to
return to the Cognos 8 Welcome page.
Steps
1. Open Cognos Connection:
● Start your Web browser.
● In the address bar, type the URL supplied by your administrator, and then press Enter. The
URL looks something like this:
http://servername/cognos8
2. In the Cognos 8 Welcome page, click Cognos content, click the GO Data Warehouse (analysis)
package, and then click Query Studio Report Samples.
3. Locate the Return Quantity by Product Line Chart report.
Tip: The icons beside an entry identify its default action and format. The default format
for this report is HTML and the default action is to run the report.
4. Click the report name to run the report.
The report runs and opens with the latest data about product returns.
22
Chapter 2: Cognos 8 Examples
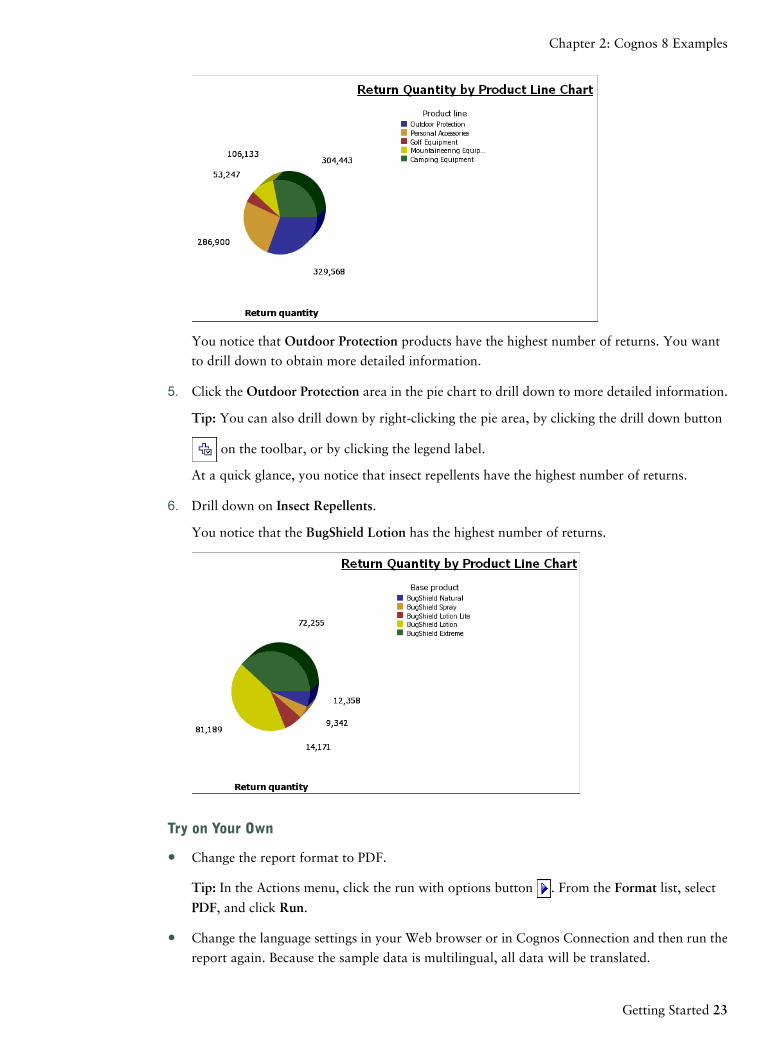
You notice that Outdoor Protection products have the highest number of returns. You want
to drill down to obtain more detailed information.
5. Click the Outdoor Protection area in the pie chart to drill down to more detailed information.
Tip: You can also drill down by right-clicking the pie area, by clicking the drill down button
on the toolbar, or by clicking the legend label.
At a quick glance, you notice that insect repellents have the highest number of returns.
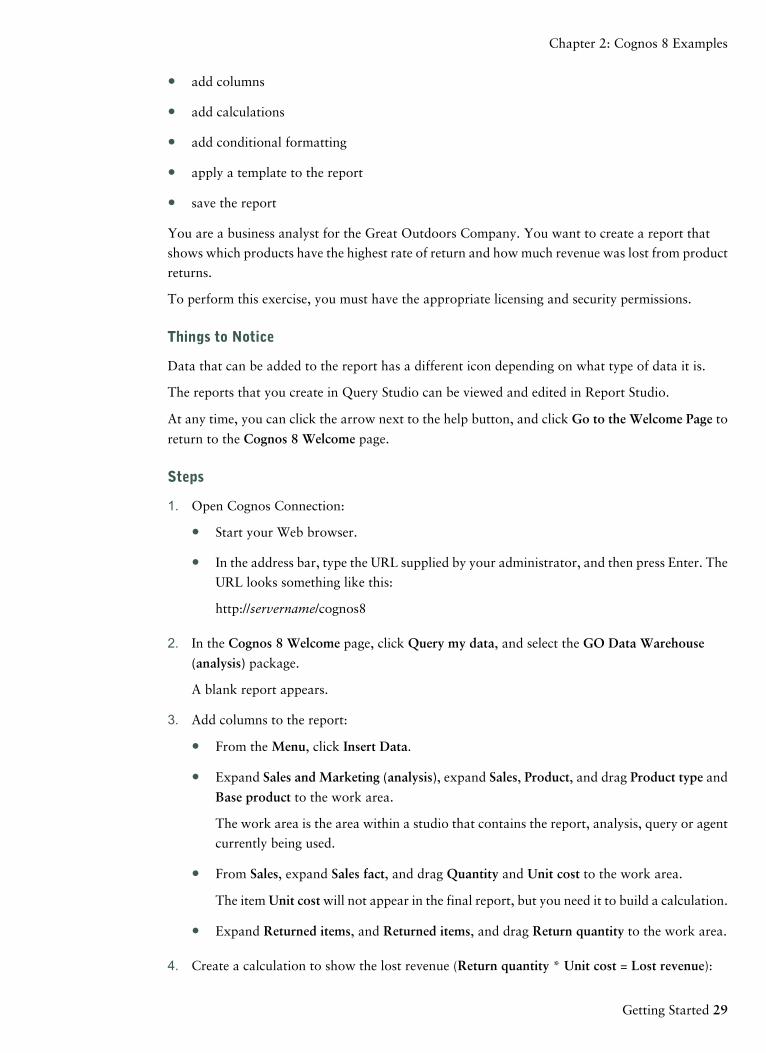
6. Drill down on Insect Repellents.
You notice that the BugShield Lotion has the highest number of returns.
Try on Your Own
● Change the report format to PDF.
Tip: In the Actions menu, click the run with options button . From the Format list, select
PDF, and click Run.
● Change the language settings in your Web browser or in Cognos Connection and then run the
report again. Because the sample data is multilingual, all data will be translated.
Getting Started 23
Chapter 2: Cognos 8 Examples

Tip: Next to the my area area button , click the down arrow, and click My Preferences.
Under Regional options, change the Product language and the Content language. You need to
run the report in order to see the content language changes.
● On the toolbar, click the home or return button to return to the portal.
For More Information
For more information about running reports, see the online help in Cognos Connection.
Example - Schedule a ReportYou can schedule entries that are stored in Cognos Connection, such as reports, queries, and agents,
so that they run at a time that is convenient for you.
In this exercise, you will learn how to
● save a report as a report view
● schedule a report so it runs daily
● use the schedule management tool to view the status of the schedule
You are a business analyst for the Great Outdoors company. You want to schedule the Return
Quantity by Product Line Chart report because some people in your organization need the data
updated daily. You schedule the report to run daily, and then check that it is properly scheduled.
Things to Notice
When a report runs according to a schedule, the report output is saved and appears in the Actioncolumn in Cognos Connection.
At any time, you can click the arrow next to the help button, and click Go to the Welcome Page to
return to the Cognos 8 Welcome page.
Steps
1. Open Cognos Connection:
● Start your Web browser.
● In the address bar, type the URL supplied by your administrator, and then press Enter. The
URL looks something like this:
http://servername/cognos8
2. In the Cognos 8 Welcome page, click Cognos content, click the GO Data Warehouse (analysis)
package, and then click Query Studio Report Samples.
Locate the Return Quantity by Product Line Chart report. You can also use any one of the
Cognos sample reports.
3. Create a report view for a daily view of the report:
24
Chapter 2: Cognos 8 Examples

● In the Actions column, click the create a report view button next to the report.
● In the Name box, remove the words Report View of from the beginning of the name, type
(Daily) at the end of the name, and then click Finish.
A new entry appears in Cognos Connection, with the report view icon .
4. Schedule the report view to run daily:
● For the entry, in the Actions column, click the schedule button .
● Under Frequency, click the By Day tab.
● Accept the default time and other defaults.
● Click OK.
5. Check the schedule:
● Next to the my area icon , click the down arrow, and click My Activities and Schedules.
● Click Schedules.
● In the Filter pane, select Any status and Any priority, and click Apply.
If you are accepting the default settings, you will not see any changes in the schedule.
Your report view appears in the list of scheduled reports.
Try on Your Own
● Modify the schedule so that the report runs weekly.
Tip: In the Actions tab, click More, and then click Modify the schedule.
● Permanently remove the schedule.
Tip: In the Actions tab, click More, and then click Remove the schedule.
For More Information
For more information about scheduling reports, see the online help in Cognos Connection.
Getting Started 25
Chapter 2: Cognos 8 Examples

Example - Create a Portal PageYou can customize the portal, Cognos Connection, by creating your own portal pages. You can
choose the information that is most important to you and make it available from your page. You
can choose from different types of content and organize the pages in a way that works for you.
This exercise shows how to
● create a page
● add content to a page
● define the appearance of a page
● enhance the content of a page
You want to create a personal page that includes all of the reports and content that you worked
on in the previous exercises so that you can easily view the content each time you log on to Cognos
8.
Things to Notice
In a portal page, you can add Cognos content, such as business intelligence reports, utilities, such
as URLs and bookmarks, and third-party portlets.
You can make a portal page available to a group in your organization, such as to the sales team,
or you can create a portal page for your personal use.
Steps
1. Open Cognos Connection:
● Start your Web browser.
● In the address bar, type the URL supplied by your administrator, and then press Enter. The
URL looks something like this:
http://servername/cognos8
2. In the Cognos 8 Welcome page, click Cognos content.
Click the new page button .
3. Type the name My Great Outdoors page, click Select My Folders as the location for the new
page, and click Next.
4. Specify the page layout:
● Under Number of columns, select 2 columns.
● Change the width of the left column to 40% and the right column to 60%.
5. Add content to your page:
● Under the left column, click Add.
26
Chapter 2: Cognos 8 Examples

● Click Cognos Content.
● Select the Cognos Navigator, Cognos Search, and Cognos Viewer portlets, and click the
arrow to move them to the Selected entries box.
Tip: You can preview the content of the portlets by clicking the view this portlet button
in the Actions column.
● Click OK.
● In the left column, click Cognos Viewer and click the move one item right arrow .
● Click Next.
6. Define the appearance of the page:
● In the Title box, type My Great Outdoors page.
Tip: You can change the formatting of the text.
● Click Next.
● Select the Add this page to the portal tabs check box.
● Click Finish.
The My Great Outdoors Page that you created appears as a tab in Cognos Connection.
7. Enhance the content of your page:
● Click the My Great Outdoors Page tab.
● In the Cognos Viewer portlet, click the edit button .
Getting Started 27
Chapter 2: Cognos 8 Examples

● Under Entry, click Select an entry, and select the Return Quantity by Product Line Chartsample report.
Tip: You can find this report in Public Folders > GO Data Warehouse (analysis) > Query
Studio Report Samples. You can also use any other sample report.
● Under Portlet height in pixels, type 600.
● Click OK.
The report now appears in the right column of your portal page.
If the report was not previously run and saved, click the run button in the Cognos
Viewer portlet. In the Run with options page, click Save the report and then click Run.
Try on Your Own
● Set the My Great Outdoors Page as your home page:
Tip: Next to the home icon , click the down arrow, and click Set View as Home.
● Delete the page:
Tip: From the tab menu button , on the left side of the tab bar, click Remove this tab.
For More Information
For information about creating portal pages, see the Cognos Connection online help.
Example - Create a QueryUse Query Studio to retrieve information from a data source, when you want to create reports that
answer simple business questions. Also use Query Studio to publish reports for audiences who do
not require complex layout or formatting.
In this exercise, you will learn how to
28
Chapter 2: Cognos 8 Examples
● add columns
● add calculations
● add conditional formatting
● apply a template to the report
● save the report
You are a business analyst for the Great Outdoors Company. You want to create a report that
shows which products have the highest rate of return and how much revenue was lost from product
returns.
To perform this exercise, you must have the appropriate licensing and security permissions.
Things to Notice
Data that can be added to the report has a different icon depending on what type of data it is.
The reports that you create in Query Studio can be viewed and edited in Report Studio.
At any time, you can click the arrow next to the help button, and click Go to the Welcome Page to
return to the Cognos 8 Welcome page.
Steps
1. Open Cognos Connection:
● Start your Web browser.
● In the address bar, type the URL supplied by your administrator, and then press Enter. The
URL looks something like this:
http://servername/cognos8
2. In the Cognos 8 Welcome page, click Query my data, and select the GO Data Warehouse
(analysis) package.
A blank report appears.
3. Add columns to the report:
● From the Menu, click Insert Data.
● Expand Sales and Marketing (analysis), expand Sales, Product, and drag Product type and
Base product to the work area.
The work area is the area within a studio that contains the report, analysis, query or agent
currently being used.
● From Sales, expand Sales fact, and drag Quantity and Unit cost to the work area.
The item Unit cost will not appear in the final report, but you need it to build a calculation.
● Expand Returned items, and Returned items, and drag Return quantity to the work area.
4. Create a calculation to show the lost revenue (Return quantity * Unit cost = Lost revenue):
Getting Started 29
Chapter 2: Cognos 8 Examples

● Select the column headings that you want for the calculation. In the work area, click the
heading for Return quantity and Ctrl+click the heading for the Unit cost column.
● Click the calculate button .
● In the Operation box, select * (multiplication).
● In the New item name box, type Lost revenue.
● Click Insert.
● Delete the Unit cost column.
5. Format the calculated column that you added:
● Right-click the heading for the Lost revenue column and click Format Data.
● In the Category list, click Currency.
● In the Thousands separator list, click Yes, and then click OK.
6. Create a calculation to show the percentage of returns (Return quantity / Quantity)*100):
● In the work area, click the heading for the Return quantity column and Ctrl+click the
heading for the Quantity column.
● Click the calculate button.
● In the Operation type box, select Percentage.
● The content of the Operation box changes to %.
● In the New item name box, type % Returned.
● Click Insert.
7. Sort the % Returned column in descending order:
● Right-click the heading for the % Returned column and click the sort button .
● Under Sort order, click Descending (9 to 1), and then click OK.
8. Apply conditional formatting to highlight products with a lost revenue greater than $200,000.
● Click the heading for the Lost revenue column.
● From the Menu, click Change Layout, and click Define Conditional Styles.
● In the New value: box, type 200000 and click Insert.
30
Chapter 2: Cognos 8 Examples

● For the first range, in the Style column, select Poor, and click OK.
The cells with a lost revenue greater than $200,000 appear with a red background.
9. Apply a template to the report:
● From the Menu, click Change Layout, and click Apply Template.
● Select Apply a template and click Select a template.
● In Public Folders, click Sample Template, select Great Outdoors Template, and click OKtwice.
The report appears with the styles from the template.
10. Add a title to the report:
● Above the report, click the report title.
● In the Title box, type Returns by Product Type and click OK.
11. Save the report:
● From the toolbar, click the save button.
● In the Name box, type Returns by Product Type.
● Accept the default save location and click OK.
The final report looks like this.
Getting Started 31
Chapter 2: Cognos 8 Examples

You notice that the Star Gazer 2 tent is the product that has the highest lost revenue rate.
Try on Your Own
● Every time you modify a report, Query Studio updates the results by running a query. Use the
run options to preview the report with no data. From the Run Report menu, click Preview with
No Data.
Tip: To preview a report with limited data, design filters must be defined in the model.
● Review the definition of all report items in the report. From the Manage File menu, click Report
Definition. This is useful for troubleshooting a report.
For More Information
For information about using Query Studio, see the Query Studio online help.
Example - Create a Statement-Style ReportUse Report Studio Express authoring mode for financial report authoring, such as creating and
maintaining statement-style reports. Financial authoring requires many but not all of the features
that already exist in Report Studio, combined with a more intuitive user experience, and interaction
with live data.
The user interactions in Report Studio have been streamlined, which simplifies the process of creating
statement-style reports. Only features essential to statement authoring are exposed in the Report
Studio Express authoring mode. The Report Studio Express authoring mode does not expose the
query interface or property page, and the toolbox contains a simplified set of items. A template
featuring an appropriate starting point for financial report creation is offered out of the box.
In this exercise, you will learn how to create a statement-style report.
You are a report author in the finance department of the Great Outdoors Company. You create a
balance sheet that shows the assets, liability, and equity for the company over the last few years.
32
Chapter 2: Cognos 8 Examples
To perform this exercise, you must have the appropriate licensing and security permissions for this
functionality.
Things to Notice
When you use the Report Studio Express authoring mode, data is live. You do not have to run a
report to see the data. From the View menu, you can switch between the Page Design and Page
Preview views to see the live data and the design of your report.
At any time, you can click the arrow next to the help button, and click Go to the Welcome Page to
return to the Cognos 8 Welcome page.
Steps
1. Open Cognos Connection:
● Start your Web browser.
● In the address bar, type the URL supplied by your administrator, and then press Enter. The
URL looks something like this:
http://servername/cognos8
2. In the Cognos 8 Welcome page, click Create professional reports.
3. Click the GO Data Warehouse (analysis) package.
4. Click Create a new report, click Financial, and click OK.
Tip: If you are in Report Studio Professional, switch to Report Studio Express for this example.
From the View menu, click Authoring Mode, and click Express.
5. Insert data in the crosstab zones:
● In the Insertable Objects pane, expand Finance (analysis), Finance, Account, Account(All)
, and Balance sheet (total).
● From Balance sheet (total), drag Assets (total) to the Rows zone.
● From Balance sheet (total), expand Liabilities & equities (total), and drag both Liabilities
(total) and Equity (total) to the Rows zone, under the Assets (total).
Tip: When you drag an object to the crosstab, you will see a flashing horizontal or vertical
bar. This indication tells you where, in the crosstab, the item will be placed.
● In the Insertable Objects pane, expand Submission, and Submission(All), and drag 2006
Actual results in USD to the Columns zone.
● Drag 2005 Actual results in USD to the Columns zone, to the right of 2006 Actual results
in USD.
● In the Insertable Objects pane, expand Time dimension, Time dimension(All), 2006, and
Q4, and drag December to the Columns zone, under the 2006 Actual results in USD.
● Repeat these steps for the 2005 year.
Getting Started 33
Chapter 2: Cognos 8 Examples
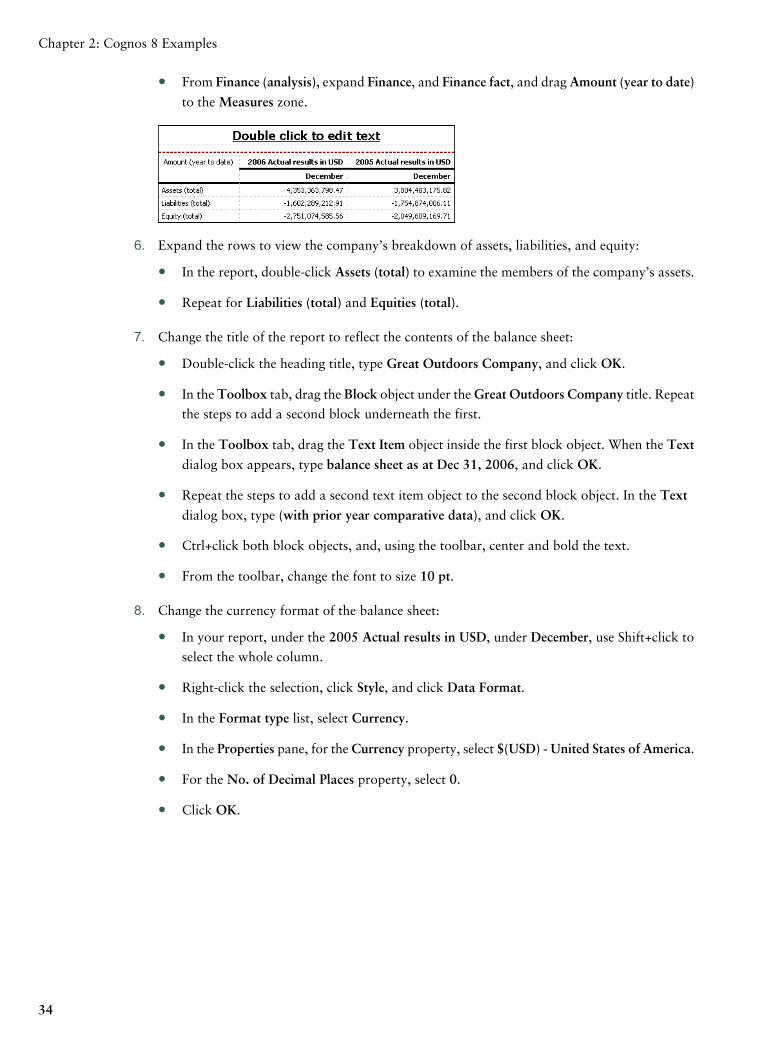
● From Finance (analysis), expand Finance, and Finance fact, and drag Amount (year to date)
to the Measures zone.
6. Expand the rows to view the company’s breakdown of assets, liabilities, and equity:
● In the report, double-click Assets (total) to examine the members of the company’s assets.
● Repeat for Liabilities (total) and Equities (total).
7. Change the title of the report to reflect the contents of the balance sheet:
● Double-click the heading title, type Great Outdoors Company, and click OK.
● In the Toolbox tab, drag the Block object under the Great Outdoors Company title. Repeat
the steps to add a second block underneath the first.
● In the Toolbox tab, drag the Text Item object inside the first block object. When the Text
dialog box appears, type balance sheet as at Dec 31, 2006, and click OK.
● Repeat the steps to add a second text item object to the second block object. In the Text
dialog box, type (with prior year comparative data), and click OK.
● Ctrl+click both block objects, and, using the toolbar, center and bold the text.
● From the toolbar, change the font to size 10 pt.
8. Change the currency format of the balance sheet:
● In your report, under the 2005 Actual results in USD, under December, use Shift+click to
select the whole column.
● Right-click the selection, click Style, and click Data Format.
● In the Format type list, select Currency.
● In the Properties pane, for the Currency property, select $(USD) - United States of America.
● For the No. of Decimal Places property, select 0.
● Click OK.
34
Chapter 2: Cognos 8 Examples

9. Repeat these steps for the column under 2006 by using the pick up style button .
● To copy all the formatting applied to the item, click the pick up style button, click the items
that you want to format, and then click the apply style button .
● To copy only one of the formatting styles, click the down arrow to the right of the pick up
style button and click the style that you want to copy. Then, click the item that you want
to format and click the apply style button.
● If you want to make changes to a style that you copied, click the down arrow to the right
of the pick up style button and click Edit Dropper Style. In the Style dialog box, specify
basic and advanced style characteristics, and then click OK.
10. Change text formatting to reflect a standard balance sheet:
● Ctrl+click to select the entire row for Assets (total). Using the toolbar, change the text to
bold.
● Select the entire rows for Liabilities (total) and Equity (total) and change the text to bold.
● Right-click Amount (year to date) and click Override Default Text. In the text box, type
Year to date (USD $000’s), and click OK.
● Select Year to date (USD $000’s), and using the toolbar, change the text to bold.
11. From the Run menu, click Run Report - HTML.
Getting Started 35
Chapter 2: Cognos 8 Examples

For More Information
For information about using Report Studio Express, see the Report Studio Express Authoring User
Guide.
Example - Create a ReportUse Report Studio to create reports with complex layout, formatting, and report user interactions.
These types of report are generally created by professional report authors, who have a good
knowledge of the data and tools they work with.
In this exercise, you will learn how to
● create a chart
● make the report interactive with prompts
You are a business analyst for the Great Outdoors Company. You create a chart report in Report
Studio to show the performance of returns over the last few years. You make the report interactive
by adding a prompt.
You will create a report that looks like the Report Studio sample Returns by Order Method -
Prompted Chart in the GO Sales sample package
To perform this exercise, you must have the appropriate licensing and security permissions for this
functionality.
Things to Notice
When you use Report Studio, data is not live. You must run the report to view data.
You can view the XML report specification.
You can add multilingual capabilities.
36
Chapter 2: Cognos 8 Examples

At any time, you can click the arrow next to the help button, and click Go to the Welcome Page to
return to the Cognos 8 Welcome page.
Steps
1. Open Cognos Connection:
● Start your Web browser.
● In the address bar, type the URL supplied by your administrator, and then press Enter. The
URL looks something like this:
http://servername/cognos8
2. In the Cognos 8 Welcome page, click Create professional reports.
3. Click the GO Data Warehouse (analysis) package.
4. Click Create a new report or template, click Crosstab, and click OK.
Tip: If you are in Report Studio Express, switch to Report Studio Professional for this example.
From the View menu, select Authoring Mode, and click Professional.
5. Insert data in the crosstab zones:
● In the Insertable Objects pane, expand Sales and Marketing (analysis), Returned items,
Return reason and Return reason.
● Drag Return reason to the Columns zone.
● In the Insertable Objects pane, expand Returned items and Returned items.
● Drag Return quantity to the Measures zone.
● In the Insertable Objects pane, expand Inventory, Product, and Product.
● Drag Product line to the Rows zone.
6. Click the run report button to run your report and verify the content.
The report output appears in Cognos Viewer.
Tip: To return to Report Studio, close the Cognos Viewer Web browser.
7. Insert another column in the report:
● In the Insertable Objects pane, expand Sales, Time dimension, and Time dimension.
Getting Started 37
Chapter 2: Cognos 8 Examples

● Drag Year to the column after the Return reason column.
8. Insert a chart in the report:
● In the Insertable Objects pane, click the toolbox tab .
● Drag the Chart object below the crosstab.
● In the Insert Chart dialog box, in the Chart pane, click the Column chart type, and click
OK.
● Click the chart to select it, and in the Properties - Combination Chart pane on the left, in
the Data properties, select the Query property.
● Select Query1 from the list.
Tip: When you change the Query property to the query that you used for the crosstab, it
is easier for you to find and reuse the same data items for the chart.
● In the Insertable Objects pane, click the data items tab .
● Drag Return quantity to the Default measure (y-axis), Product line to the Series, and Return
reason and Year to the Category (x-axis).
9. Create a filter to exclude the Wrong product ordered return reason from the crosstab:
● In the crosstab, click the Return reason column heading.
● On the toolbar, click the filter button .
● Click the Detail Filters tab.
38
Chapter 2: Cognos 8 Examples

● Click the add button .
● Define the following expression:
[Return reason] not in ([Returned items].[Return reason].[Return reason].[Return reason]
->[all].[9003])
Tip: Insert items from the Available Components pane. The value 9003 is the code for the
Wrong product ordered return reason.
● Click the validate button to validate your expression.
● Click OK twice.
10. Create a prompt page for the order method to allow users to filter data in the report and retrieve
data only for the order method they select:
● Click the background of the work area to deselect.
● From the Tools menu, click Build Prompt Page.
● Use Ctrl+click to select the Back and Next buttons, and the Double click to edit text prompt
page title, that are automatically created, and delete them.
● In the Insertable Objects pane, click the toolbox tab .
● Drag the Value Prompt object and drag it in the prompt page.
The Prompt Wizard - Value Prompt dialog box appears.
● Click Next.
● Beside the Package item box, click the ellipsis button (...).
● In the Choose Package Item dialog box, expand Sales and Marketing (analysis), Sales,
Order method, and Order method dimension.
● Click the lowest-level Order method dimension and then click OK.
● Click Next twice to accept the defaults, and click Finish.
11. Move the cursor over the Page Explorer between the Insertable Objects pane and the work
area, and in Report Pages, click Page1 to return to the report page.
Tip: Click the Prompt Pages folder title to remove or rename a page or to edit properties.
Getting Started 39
Chapter 2: Cognos 8 Examples

12. Add a title to the report:
● Double-click the Double click to edit text title area, type Returns by Order Method, and
click OK.
13. Save the report:
● From the File menu, click Save As.
● Name the report Returns by Order Method - Prompted Chart and click Save.
14. Run your report and verify the content,
● Click the run report button .
● In the Order method dimension drop down list, click E-mail and then click Finish.
The report output appears in Cognos Viewer.
40
Chapter 2: Cognos 8 Examples

Try on Your Own
● Save the report as a template so you can create a new report with the same layout and include
different data.
Tip: From the File menu, click Convert to Template and then save the report with a new name.
● Change the color of the background of the chart.
Tip: In the work area, click the chart. In the Properties pane, expand Color & Background,
and click the ellipsis (...) next to Background Color.
● View the XML specification for the report.
Tip: From the Tools menu, click Show Specification.
For More Information
For information about using Report Studio, see the Report Studio Professional Authoring User
Guide.
Example - Manage an EventUse Event Studio to define business events or exceptional conditions in your data that you must
deal with. Create agents to monitor your data and notify decision-makers in your organization of
events as they happen, so that they can make timely and effective decisions. You create agents to
perform tasks or deliver alerts when the data meets predefined thresholds.
This exercise shows how to
Getting Started 41
Chapter 2: Cognos 8 Examples

● define business events
● define agent tasks
● review the status of events
You are a business analyst for the Great Outdoors Company. You want to ensure that your customers
are satisfied with the products and services that you provide. In particular, if products are returned,
you want to investigate why, and ensure that you offer a replacement before your customers decide
to shop elsewhere.
Using Event Studio, you can be notified whenever a customer returns a product because it was
defective, unsatisfactory, incomplete, or because the wrong product was shipped to them. You want
to immediately send an email to your customer service department with details about the order and
the customer so that they can contact the customer.
You will create an agent that looks like the Event Studio sample Returns Agent in the GO Sales
(query) sample package.
To perform this exercise, you must have the appropriate licensing and security permissions.
Things to Notice
The tasks that you need to perform to create an agent in Event Studio appear in the I want to...area in the left pane. By default, when you open Event Studio, you start with the first task, defining
an event.
At any time, you can click the arrow next to the help button, and click Go to the Welcome Page to
return to the Cognos 8 Welcome page.
Steps
1. Open Cognos Connection:
● Start your Web browser.
● In the address bar, type the URL supplied by your administrator, and then press Enter. The
URL looks something like this:
http://servername/cognos8
2. In the Cognos 8 Welcome page, click Manage my events, and select the GO Sales (query)package.
3. Create the expression that defines the event:
● In the Insertable Objects pane, expand Returned items (query) and Returned items.
● In the Insertable Objects pane, expand Return reason.
● Use both Return quantity and Reason description to create the following expression:
[Return quantity]>0 AND [Reason description] IN ('Wrong product shipped','Unsatisfactory
product','Incomplete product','Defective product')
42
Chapter 2: Cognos 8 Examples

Tip: Insert items from the Insertable Objects pane. To select from a list of possible values
for the return reason, click the select values button . Move the values you want from
the Select Value box to the Selected Items box and click OK.
● Click the validate button to validate your expression.
Tip: You can also click Preview from the Actions menu to see the data retrieved from the
data source.
You defined the expression that will be used to notify you whenever a customer returns a
product because it was defective, unsatisfactory, incomplete, or because the wrong product
was shipped to them.
4. Create an email task to immediately send an email to your customer service department with
details about the returned order and the customer so that they can contact the customer:
● In the I want to list, click Add a task and click Send an email.
● In the To box, type the email address for the customer service department.
Tip: Since this example is for learning purposes, the agent will not actually run. Therefore,
you can type any email address.
● In the Subject, type Products Returned.
● Above the Body box, click the insert table button and add four columns and two
rows.
● In order to add any content to the table, ensure that the insert text... text is deleted from
each cell.
● Add information about returned products to the table as follows:
Manually type in the text for the heading row of the table.
Drag objects from the Insertable Objects pane to the bottom row of the table.
Tip: From the Insertable Objects pane, expand Returned items (query). Expand Order to
find Order number; Product for Product name; Returned items for Return quantity, and
Retailer site for Company name.
Company NameQuantityProduct NameOrder Number
[Company name][Return quantity][Product name][Order number]
When the agent runs, the data item for each event is replaced by the current value in the
package.
● Select the top row and select the bold button to make the column headings stand out.
Getting Started 43
Chapter 2: Cognos 8 Examples
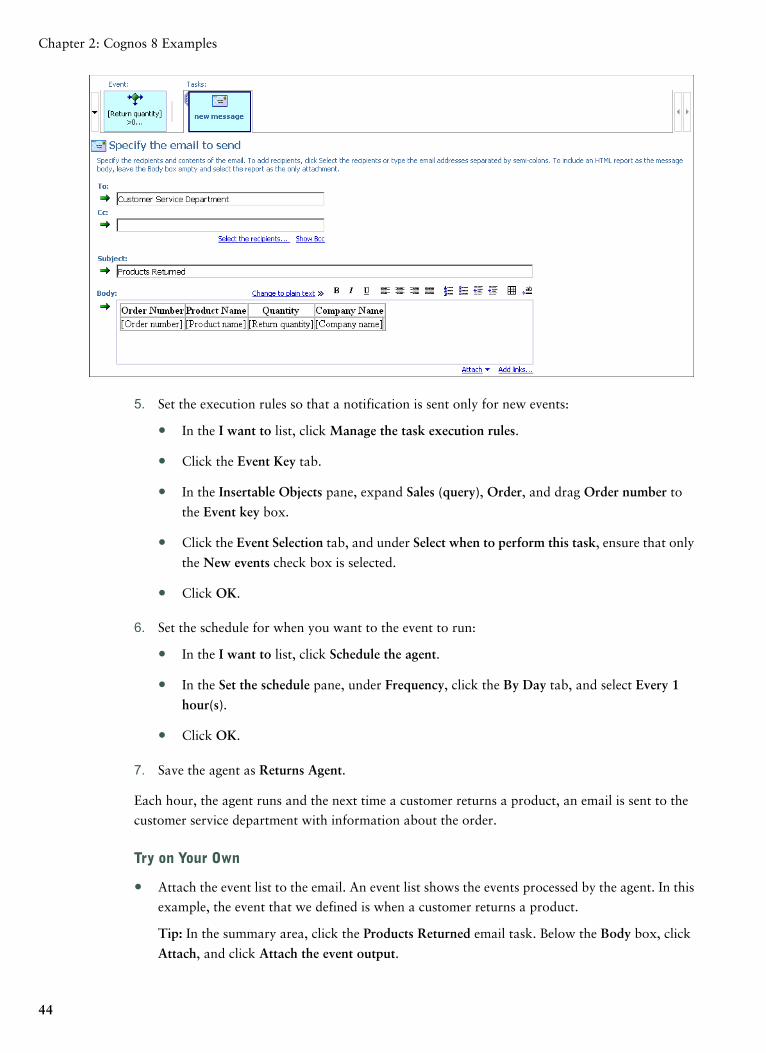
5. Set the execution rules so that a notification is sent only for new events:
● In the I want to list, click Manage the task execution rules.
● Click the Event Key tab.
● In the Insertable Objects pane, expand Sales (query), Order, and drag Order number to
the Event key box.
● Click the Event Selection tab, and under Select when to perform this task, ensure that only
the New events check box is selected.
● Click OK.
6. Set the schedule for when you want to the event to run:
● In the I want to list, click Schedule the agent.
● In the Set the schedule pane, under Frequency, click the By Day tab, and select Every 1
hour(s).
● Click OK.
7. Save the agent as Returns Agent.
Each hour, the agent runs and the next time a customer returns a product, an email is sent to the
customer service department with information about the order.
Try on Your Own
● Attach the event list to the email. An event list shows the events processed by the agent. In this
example, the event that we defined is when a customer returns a product.
Tip: In the summary area, click the Products Returned email task. Below the Body box, click
Attach, and click Attach the event output.
44
Chapter 2: Cognos 8 Examples

● Add a report task so that the agent runs a report that is related to an important business event.
Tip: In the I want to area, click Add a task, and click Run a report. Then, select the report that
you want to run.
To allow this report to be attached in an email task, under Options, click Set, and then select
the Override the default values check box. Under Delivery, select the Enable attachment of the
report in email tasks check box, and click OK.
● Attach a report to the email. You can only attach reports that are included in report tasks and
that have the Enable attachment of the report in email tasks check box selected.
Tip: In the summary area, click the Products Returned email task. Below the Body box, click
Attach, and click the name of the report that is available to attach.
For More Information
For information about creating agents, see the Event Studio online help.
Example - Monitor PerformanceWith Metric Studio, you can track the performance of your organization against its goals and
objectives. At a quick glance, decision makers at every level of the organization can see the current
status of the organization, and then react or plan.
A metric is an indicator of key measures that compares actual results to targets. A metric also
records who is responsible for the results and the impact of the metric. A scorecard is a collection
of performance metrics and projects that reflects the strategic goals of a unit in an organization.
This exercise shows how to
● review a strategy map for a visual representation of the strategy and the objectives of that
strategy for an organization
● review and understand the performance of a metric on a scorecard
● create an action on a metric
● add a metric to your watch list
You are a sales manager for a region for the Great Outdoors Company. You regularly look at a
scorecard that contains metrics about your sales area. The metrics give you an instant idea of how
the current sales compare to the sales targets set by the company. Return quantity is one of the
metrics.
To perform this exercise, you must have the appropriate licensing and security permissions for this
functionality.
Things to Notice
Metrics appear as either Poor (red), Average (yellow), or Excellent (green).
For each metric, you can see whether the trend is getting better or getting worse.
Getting Started 45
Chapter 2: Cognos 8 Examples

When you move your pointer over the title of a metric, you see a history chart that shows the
performance of the metric. A flyout menu extends when you mouse over a metric or a diagram.
At any time, you can click the arrow next to the help button, and click Go to the Welcome Page to
return to the Cognos 8 Welcome page.
Steps
1. Open Cognos Connection:
● Start your Web browser.
● In the address bar, type the URL supplied by your administrator, and then press Enter. The
URL looks something like this:
http://servername/cognos8
2. In the Cognos 8 Welcome page, click Manage my metrics, and select the GO Metrics package.
3. View the strategy map:
● On the left pane, click the Scorecards tab, and click the GO Consolidated scorecard.
● On the right pane, click the Diagrams tab.
In the GO Strategy map, notice how you can quickly evaluate the performance of each of the
goals of the organization. The large indicators show the status for a specific strategy. The
smaller indicators that appear below a strategy show the trend. The values for metrics that are
not performing well appear in red. Status and trend indicators that appear in red indicate
possible problem areas.
For example, in the Production & Distribution function of the strategy map, in the Control
Product Quality metric, the value for Return Quantity % is red, which shows a poor performance
metric.
46
Chapter 2: Cognos 8 Examples
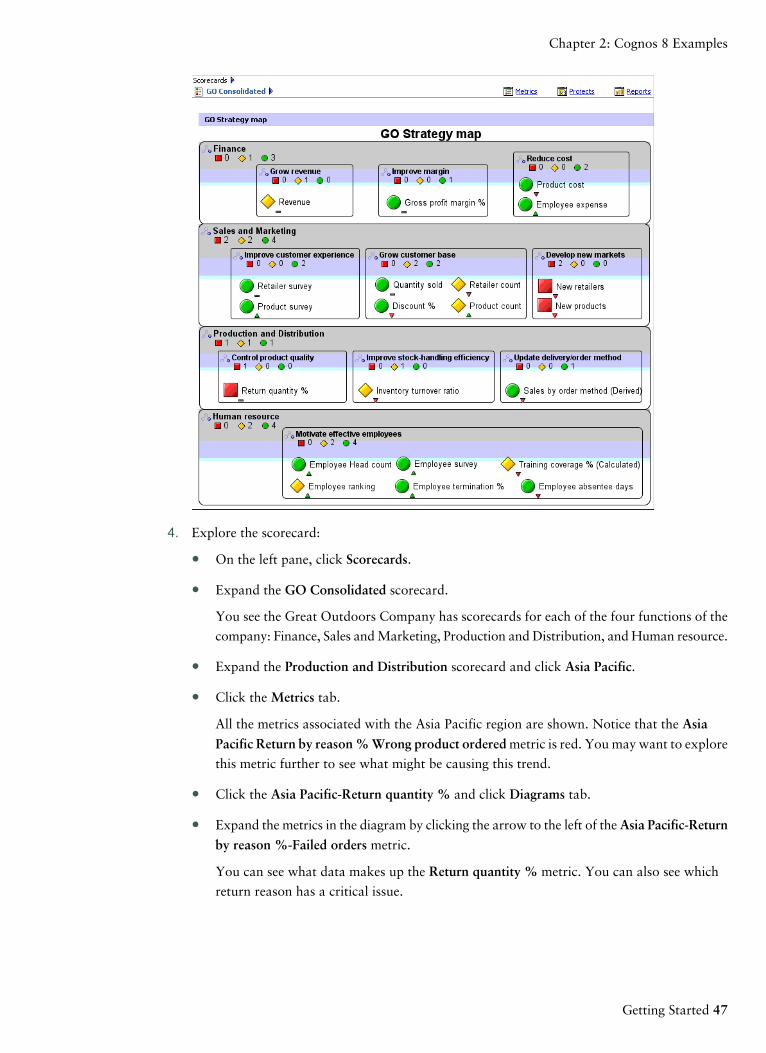
4. Explore the scorecard:
● On the left pane, click Scorecards.
● Expand the GO Consolidated scorecard.
You see the Great Outdoors Company has scorecards for each of the four functions of the
company: Finance, Sales and Marketing, Production and Distribution, and Human resource.
● Expand the Production and Distribution scorecard and click Asia Pacific.
● Click the Metrics tab.
All the metrics associated with the Asia Pacific region are shown. Notice that the Asia
Pacific Return by reason % Wrong product ordered metric is red. You may want to explore
this metric further to see what might be causing this trend.
● Click the Asia Pacific-Return quantity % and click Diagrams tab.
● Expand the metrics in the diagram by clicking the arrow to the left of the Asia Pacific-Return
by reason %-Failed orders metric.
You can see what data makes up the Return quantity % metric. You can also see which
return reason has a critical issue.
Getting Started 47
Chapter 2: Cognos 8 Examples

● Hold your mouse over Asia Pacific-Return quantity % to see more information about that
metric.
● In the left pane, in the Production and Distribution scorecard, click the Asia Pacific, and
click the Metrics tab to view the metric related to return quantity.
Notice that the status of Asia Pacific-Return by reason %-Wrong product ordered metric
is poor.
48
Chapter 2: Cognos 8 Examples

5. Click the Asia Pacific-Return by reason %-Wrong product ordered metric.
In Metric Studio, the tabs represent the questions you might ask yourself, as you try to solve a
problem or understand a piece of information.
6. On the right pane, click the History tab, and click List.
The information in the History tab answers the question "When?". You see the actual and
target values for the metric data for previous periods. You also see quarterly and yearly
summaries.
7. Explore the information available for the Asia Pacific-Return by reason %-Wrong product
ordered metric:
● Click the Reports tab.
The information in the Reports tab answers the question "What?" by providing more
details about a metric. Metric authors link reports to a metric to help illustrate the reasons
Getting Started 49
Chapter 2: Cognos 8 Examples

for the status of the metric and to help you solve issues related to the performance of a
metric.
● Click the Diagrams tab.
The information in the Diagrams tab helps you understand the question "How?" by
comparing your metric with other metrics. Impact diagrams show the relationships between
the Return by reason % metric and other metrics.
● Click the Details tab.
The information in the Details tab helps you understand your business and the metrics that
you are monitoring. In this tab, you see a description of the metric, how the metric is
calculated, who owns the metric, and whether a metric is impacted by other metrics.
8. Create an action for one of your business analysts to have her investigate the performance of
product returns:
● Click the Actions tab.
● Click the new action button .
Tip: You need to select a metric in order to see the action button.
● In the Name box, type Kazumi Uragome, the person who will own the action.
● In the Description box, type Please investigate to let Kazumi know what to do.
● Beside the Planned Finish box, click the calendar icon, select a date one week from today,
and then click OK.
9. Add the Asia Pacific-Return reason %-Wrong product ordered metric to your watch list so that
you can easily monitor it in the future:
● Click the Kazumi Uragome action check box.
● On the upper toolbar, click the add to watch list button .
● In the left pane, click My Folders and click Watch List.
The Asia Pacific-Return by reason %-Wrong product ordered metric appears in your watch
list.
Try on Your Own
● Add a comment to the metric to communicate information to users of the metric.
50
Chapter 2: Cognos 8 Examples

Tip: Beside the metric, in the comment column, click the ellipsis (...). After you add a comment,
a comment icon appears.
● Add an email notification so that you will be notified when the metric changes.
Tip: Beside the metric, click the email alerts button . The email alerts button changes to
show that email alerts is now turned on. You can also specify when and how often you receive
email notification about changes to metrics in the watch list, by changing the email alerts
properties.
● Filter the scorecard according to the status of the metrics.
Tip: On the Metrics tab, in the filter box, select the status or trend that you want.
For More Information
For more information about using scorecards, see the Metric Studio online help.
Example - Create an AnalysisIn Analysis Studio, you can manipulate items in your data interactively so that you can identify and
understand the problems and issues in your business.
In this exercise, you will learn how to
● drill down
● create a top filter
● create a summary calculation
● create a crosstab and a chart
You are a business analyst for the Great Outdoors Company. You want to further analyze the
returns business items to find out where and why products are the most returned, and which have
the biggest impact on the company’s profit.
To perform this exercise, you must have the appropriate licensing and security permissions.
Things to Notice
The items and measures that you can add to your analysis appear in the data tree in the left pane.
The overview area above the work area is a convenient place to quickly explore and change the
contents of your analysis. You manipulate rows and columns, drill up or down, and provide context
for the work area.
Analysis Studio uses sets, which are collections of similar items. You manipulate items by applying
actions to sets. You can sort, filter, and nest sets. You can also save custom sets and view subtotals
for your sets.
Getting Started 51
Chapter 2: Cognos 8 Examples

At any time, you can click the arrow next to the help button, and click Go to the Welcome Page to
return to the Cognos 8 Welcome page.
Steps
1. Open Cognos Connection:
● Start your Web browser.
● In the address bar, type the URL supplied by your administrator, and then press Enter. The
URL looks something like this:
http://servername/cognos8
2. In the Cognos 8 Welcome page, click Analyze my business.
3. Click the Sales and Marketing (cube) package.
4. Click Blank Analysis, and click OK.
5. Insert data in the crosstab:
● In the Insertable Objects pane, expand Measures and drag Returns to the Measure zone
or to the upper-left corner of the work area.
● Drag Products to the Rows zone.
● Expand the Time folder, and Time, and multiselect all four years (2004, 2005, 2006, 2007)
.
● Drag all four years to the Columns zone.
You now see the returns for all the product brands over a four year span of time. The total
number of returns is visible in the Total column. Notice that the year 2007 is not a complete
year of data.
6. Filter the top ten product brands based on their total returns over the last four years:
● In the overview area, right-click Products and click Down a Level.
The overview area is located above the work area. You can use the overview area as a
convenient place to quickly explore and change the contents of the work area. The overview
area shows any applied filters and sorting.
● Repeat the step to see a list of all individual products.
● In the overview area, right-click Products (depth 3), click Top or Bottom, select Top, and
click 10.
You see that the top ten products are now the only products in the crosstab.
52
Chapter 2: Cognos 8 Examples
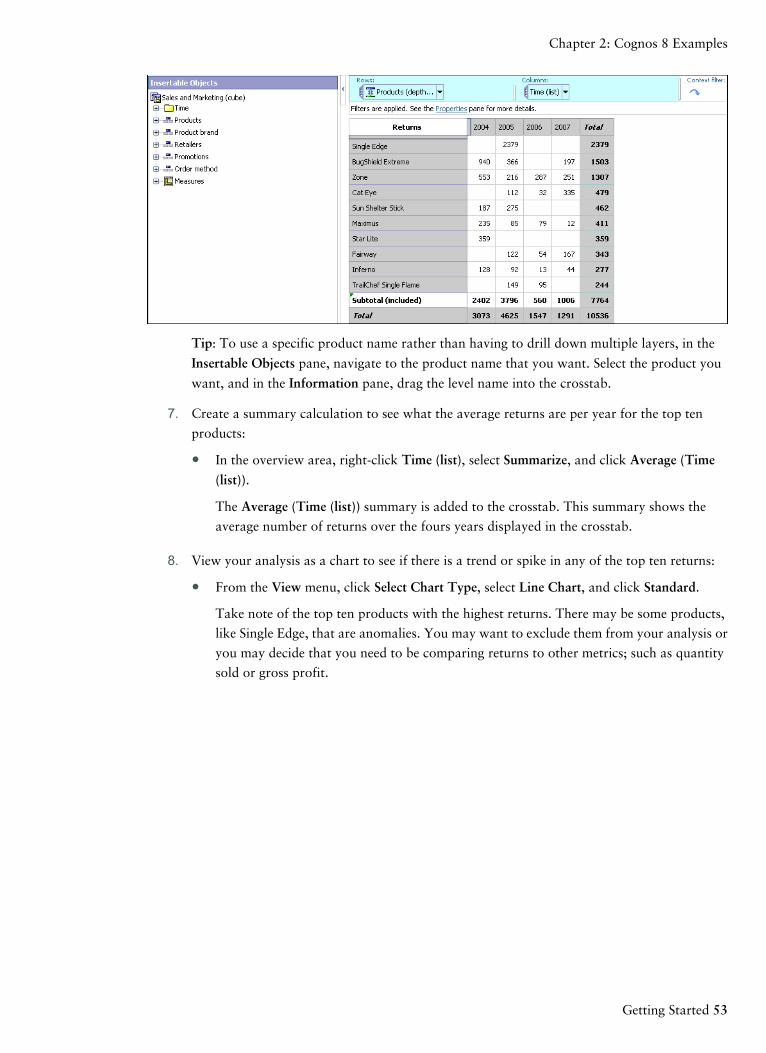
Tip: To use a specific product name rather than having to drill down multiple layers, in the
Insertable Objects pane, navigate to the product name that you want. Select the product you
want, and in the Information pane, drag the level name into the crosstab.
7. Create a summary calculation to see what the average returns are per year for the top ten
products:
● In the overview area, right-click Time (list), select Summarize, and click Average (Time
(list)).
The Average (Time (list)) summary is added to the crosstab. This summary shows the
average number of returns over the fours years displayed in the crosstab.
8. View your analysis as a chart to see if there is a trend or spike in any of the top ten returns:
● From the View menu, click Select Chart Type, select Line Chart, and click Standard.
Take note of the top ten products with the highest returns. There may be some products,
like Single Edge, that are anomalies. You may want to exclude them from your analysis or
you may decide that you need to be comparing returns to other metrics; such as quantity
sold or gross profit.
Getting Started 53
Chapter 2: Cognos 8 Examples

9. Change the top ten definition to filter on year 2007 to give you the most recent data for product
returns. Notice that the year 2007 is not a complete year of data.
● In the overview area, right-click Products (depth 3), click Top or Bottom, select Top, and
click Custom.
● In the Define top or bottom filter pane, from the For column list, select 2007.
By specifying 2007 in the top definition, you change the filter context to be specifically on
the highest top ten returns for the year 2007. In addition, you see the other years in the
crosstab, to give you some additional historical information.
Tip: In the definition, you can specify the number of items you want by number, percentage,
or sum.
● Click OK.
Notice that Cat Eye has the highest number of returns. The list also includes Inferno and
Zone.
Tip: In the overview area, using the Time (list) column, you can also filter on 2007. The
data returned from using this filter will be different than setting the 2007 context in the
top definition. Only 2007 data will appear in the crosstab, instead of including the historical
data. You can use this type of filter to help you analyze your data to find out more
information.
54
Chapter 2: Cognos 8 Examples

10. Look at the top ten products with the highest gross profit to see whether they include any of
the products with the highest returns, which might impact the company’s bottom line.
● You can change the Context filter section of the overview area. When you do this, the
values shown for the selected set also change. If you want the applied settings to ignore
context changes, you can pin the context of the selected set.
At the very bottom of the work area is a properties pane. Click the up arrows to open the
pane. Click Definition, Hold Current Context, and click OK.
Notice that a pin icon appears in the overview area.
● Drag the Gross Profit measure to the Measure zone in the crosstab.
Your top ten definition is automatically updated. Analysis Studio uses dynamic context by
default, so that any changes you make in the crosstab are reflected in your analysis.
Notice that Cat Eye doesn’t appear in the top ten products with the highest gross profit.
However, the product Inferno is the product with the second highest gross profit. Returns of
Inferno will really impact the bottom line, since it contributes so much more than the other
products to gross profit.
11. Save the analysis as Returns vs Gross Profit over Time.
Getting Started 55
Chapter 2: Cognos 8 Examples

Try on Your Own
● For report formatting and layout control, edit the report in Report Studio. With Report Studio,
you can extend the report definition to include other reporting elements, or enhance the report
by defining bursting rules. To use Report Studio, you must have the appropriate licensing and
security permissions.
Tip: From the File menu, click Open in Report Studio. After you save an analysis in Report
Studio, you can no longer edit it in Analysis Studio.
For More Information
For information about using Analysis Studio, see the Analysis Studio online help.
Example - Work with Cognos Content in Microsoft ExcelYou use Cognos 8 Go! Office to access Cognos content in Microsoft Office Excel where you can
work with and add value to existing Cognos reports, apply calculations, and use your existing
Microsoft Excel macros. When you reconnect to the Cognos server, you can refresh the data to
obtain the latest information. You can also import content into Microsoft Office PowerPoint and
Microsoft Office Word.
Cognos security is maintained in your Microsoft Office environment. For example, if you share a
Microsoft Excel workbook with coworkers, when they connect to the Cognos server to retrieve or
refresh data, their security permissions are used to retrieve the appropriate data.
This exercise shows how to
● import Cognos content into a Microsoft Excel workbook
● refresh data
● publish a workbook to Cognos Connection
You want to import the information from the two Query Studio sample reports named Return
Quantity by Product Line and Return Quantity by Product Line Chart into Microsoft Excel.
To perform this exercise, you must have the appropriate licensing and security permissions. Also,
Cognos 8 Go! Office must be installed and the .NET framework must be installed and configured
on your computer.
Things to Notice
You use Cognos 8 Go! Office to import Cognos report elements, such as headers, footers, images,
lists, and charts, in your Microsoft Excel workbook. You can import elements from different reports
into the same workbook.
When you save your workbook, you can save it with or without data.
You can publish workbooks to Cognos Connection so that other users can access them.
56
Chapter 2: Cognos 8 Examples

At any time, you can click the arrow next to the help button, and click Go to the Welcome Page to
return to the Cognos 8 Welcome page.
Steps
1. Start Microsoft Excel.
The Cognos 8 pane appears on the right side.
2. To begin using Cognos 8 Go! Office, on the toolbar, click the Logon button, select the server
that you want to connect to, type your user ID and password, and click OK.
3. In the Cognos 8 pane, click Cognos 8 Go! Office.
4. Import the Return Quantity by Product Line and Return Quantity by Product Line Chart report
elements in the workbook:
● In the Cognos 8 pane, click the Browse Content tab.
● Expand Public Folders, GO Data Warehouse (analysis), Query Studio Report Samples, and
click Returns by Product Type.
● Click Import content.
You can select the specific report elements that you want to import.
● Click Finish.
● Repeat the steps for the Return Quantity by Product Line Chart report.
Getting Started 57
Chapter 2: Cognos 8 Examples

The reports appear in the workbook.
5. Refresh the data in the report:
● In the Cognos 8 pane, click the Manage Data tab.
In the Imported report elements box, you can see all the elements in your workbook and
their properties.
● Right-click the report and click Refresh Data and Formatting.
Because the sample database is static, the report contents do not actually change.
6. Publish the workbook to My Folders in Cognos Connection:
● Save the workbook on your computer.
Tip: To save the workbook without data, right-click the report and click Remove Data.
You can later refresh all data.
● From the Cognos 8 for Microsoft Office toolbar, click the publish button .
● In the Publish dialog box, select the Cognos 8 server where you want to save the report,
and click Publish.
The workbook now appears in Cognos Connection. To open a workbook from Cognos
Connection, select it and save it locally to your disk.
58
Chapter 2: Cognos 8 Examples

For More Information
For information about working with Cognos content in Microsoft Office, see the Cognos 8 Go!
Office online help.
Example - Search for Business Intelligence ContentIn Cognos Connection, you can perform full-text searches with Cognos 8 Go! Search to find entries
that contain your key words. When you run a search, Cognos 8 Go! Search searches entries in the
index for matching prompts, titles, headings, column names, row names, data items, and other key
fields. Searches are not case sensitive and automatically include word variations. You can also limit
your search to a specific type of entry, such as an agent.
The search results are ranked with the most relevant content at the top of the list. Cognos 8 security
settings apply to search results so that only content that you have access to appears in the search
results.
This exercise shows how to
● search all the business intelligence content stored in the content store for entries related to
returns
● work with the search results
You want to search all the content to find other entries that relate to returns of Great Outdoors
Company products.
To perform this exercise, you must have the appropriate licensing and security permissions. Also,
Cognos 8 Go! Search must be installed.
Things to Notice
At any time, you can click the arrow next to the help button, and click Go to the Welcome Page to
return to the Cognos 8 Welcome page.
Steps
1. Open Cognos Connection:
● Start your Web browser.
● In the address bar, type the URL supplied by your administrator, and then press Enter. The
URL looks something like this:
http://servername/cognos8
2. In the Cognos 8 Welcome page, click Cognos content.
3. In the Cognos Connection Search box, type returns.
4. Entries that match the search criteria, and which you have permissions to view, appear in the
search results. To the left of the results appears a tree that allows you to refine your search.
5. Refine the search:
Getting Started 59
Chapter 2: Cognos 8 Examples
● In the tree, expand Orders and Returned items.
● Click Return quantity.
The search results now show only entries that contain the Return quantity measure.
Tip: To remove the search filter, under Selected items, delete the specific criteria you want, or
click Remove all.
Try on Your Own
Perform a new search and limit your search results to only agent entries.
Tip: Click New search, click Advanced, and in the Type box, click Agent. Click Search.
For More Information
For information about searching for business intelligence content, see the Cognos 8 Go! Search
Guide.
60
Chapter 2: Cognos 8 Examples

Glossary
agent
The object type created and edited by Event Studio. An agent contains the event condition and the
associated tasks to perform. Once defined, an agent can be scheduled to check for instances of the
event.
analysis
A process where a user interacts with data to gain insight and understanding. In Cognos 8, Analysis
Studio is designed to facilitate analysis.
authentication
The process of verifying the identity of users when they log on. Users must be authenticated before
they can be authorized to use any secured resources.
burst
To create many report results by running a single report once. For example, you can create a report
that shows sales for each employee, and run it once, sending different results to regional managers
by bursting on region. You set up bursting in Report Studio and enable it in the portal.
condition
An expression that yields a boolean value. Conditions are used in query expressions, query filters,
and boolean report variables that can be used for conditional formatting, styles, data sources,
layouts and blocks.
Content Manager
The Cognos 8 service that manages the storage of customer applications, including
application-specific security, configuration data, models, metrics, reports, and report output. Content
Manager is needed to publish models, retrieve or store report specifications, manage scheduling
information, and manage the Cognos namespace.
content store
The database that contains data that Cognos 8 needs to operate, such as report specifications,
published models, and the packages that contain them; connection information for data sources;
information about the external namespace, and the Cognos namespace itself; and information about
scheduling and bursting reports.
Design models and log files are not stored in the content store.
The Cognos 8 service that uses the content store is named Content Manager.
Getting Started 61

custom set
A custom set allows you to save the filter rules, calculations, and sort that defines a set created in
Analysis Studio. Custom sets are listed in the Analysis Items tab and are saved as part of the analysis.
See also set, predefined set, and analysis.
data tree
Within a studio, contains objects such as query subjects, query items, dimensions, levels, and
members. A data tree is used as a palette of the available data that can be inserted into calculations,
filters, display areas, and other authoring gestures.
drill down
In Cognos Planning, drill down is a technique used to analyze D-Cube data that was imported by
a D-Link. You can drill down on any single cell in a D-Cube. If the cell contains data transferred
by a D-Link, drill down opens a view of the source data. If the data was imported from another
D-Cube, drill down opens the appropriate selection from the source D-Cube. If the data was imported
from an external source (a mapped ASCII file or an ODBC database), drill down extracts the relevant
data from the source file and displays it in a special drill-down results dialog box.
In Cognos 8 BI, drill down refers to the act of navigating from one level of data to a more detailed
level. The levels are set by the structure of the data. See also drill up.
drill up
The act of navigating from one level of data to a less detailed level. The levels are set by the structure
of the data.
See also drill down.
event
An exceptional item of data, defined by specifying a query expression against items in a package.
When data is detected matching the event condition, it causes an agent to perform tasks.
event key
A combination of data items that uniquely defines an event instance. Identifying an event instance
enables the agent to determine if it is new, ongoing or stopped. The task execution rules then
determine which tasks to execute for each instance.
information pane
In Analysis Studio, a pane that helps you to confirm your selection in the data tree by displaying
related information such as the level and attributes.
layout
In reporting, layout defines the appearance of the report, including formatting, style, and design.
62
Glossary

In report specifications, layout is the portion of the specification that defines how the data returned
by queries is presented.
metric
A measure to assess performance in a key area of a business.
model
A physical or business representation of the structure of the data from one or more data sources.
A model describes data objects, structure, and grouping, as well as relationships and security.
In Cognos 8 BI, a design model is created and maintained in Framework Manager. The design
model or a subset of the design model must be published to the Cognos 8 server as a package for
users to create and run reports.
In Cognos Planning, a model is a group of D-Cubes, D-Lists, D-Links, and other objects stored in
a library. A model may reside in one or more libraries, with a maximum of two for Contributor.
namespace
For authentication and access control, a configured instance of an authentication provider. Allows
access to user and group information.
In XML, a collection of names, identified by a URI reference, which are used in XML documents
as element types and attribute names.
In Framework Manager, namespaces uniquely identify query items, query subjects, and so on. You
import different databases into separate namespaces to avoid duplicate names.
package
A subset of a model, which can be the whole model, to be made available to the Cognos 8 server.
For Metric Studio users, see metric package.
portlet
A mechanism for displaying Web content as part of a portal page.
properties pane
Within a studio, the properties pane provides an overview of the properties for selected data. You
can also use the properties pane to make several changes and apply them at the same time, instead
of repeating several different commands.
publish
In Cognos 8 BI, refers to the creation of a package that makes metadata available to the Cognos 8
server. Information in the package is used to create reports and other content.
In Cognos Planning, refers to a function that is used to copy the data from Contributor or Analyst
to a datastore, typically so it can be used for reporting purposes.
Getting Started 63
Glossary

query
A specification for a set of data to retrieve from a data source. A report specification can contain
one or more queries.
The type of object created and edited by Query Studio. A query is a subtype of report.
query item
A representation of a column of data in a data source. It contains a reference to a database column,
a reference to another query item, or a calculation. Query items may appear in a model or in a
report.
query subject
One of the types of objects inside a model. A query subject can be defined as a collection of references
to items of other query subjects, or expressed as an SQL expression that represents selected query
items. These query items will be retrieved from objects such as tables, synonyms, views, and so on.
Query subjects contain query items.
report
A set of data deliberately laid out to communicate business information. Depending on the context,
"report" may refer to report specification or report output.
Report (more precisely, report specification) is the generic term for the objects created or edited by
Query Studio, Report Studio, and Analysis Studio.
report output
Report output combines data at the point in time when the report was run with a report specification.
It is a document that can be displayed, printed, or emailed. Cognos 8 can produce report outputs
in HTML, PDF, Excel, or CSV formats.
report specification
The definition of queries, prompts, layouts, and styles that make up a report. A report specification
is combined with data by a run operation to create report outputs. You create report specifications
by using Report Studio, Query Studio, Analysis Studio, or through the Software Development Kit.
report view
A reference to another report that has its own properties, such as prompt values, schedules, and
results.
You use report views to share a report specification instead of making copies of it.
scorecard
A collection of metrics representing the performance of one unit or aspect of an organization.
64
Glossary
scorecard structure
The hierarchy of scorecards that reflects how an enterprise organizes its metrics.
set
A collection of related items or members. Members in the set may be selected by one or more filter
rules or by selecting specific members.
See also specific set definitions (detail-based set, selection-based set, and so on).
strategy
In performance management, a strategy is a set of objectives. It states what the organization wants
to accomplish over the next three to five years.
strategy map
In Metric Studio, a strategy map is a visual representation of the strategy and the objectives of that
strategy for an organization. For example, a strategy map may show employees how their jobs are
aligned to the overall objectives of the organization.
summary
In reporting and analysis, summaries are aggregate values that are calculated for all the values of
a particular level or dimension. Examples of summaries include total, minimum, maximum, average,
and count.
task
An action performed by an agent if the event status meets the task execution rules. For example,
an agent can send an email, publish a news item, or run a report.
template
A reusable report layout or style that can be used to set the presentation of a query or report.
watch list
A list of metrics that each user has chosen to monitor closely. If notification is enabled in Metric
Studio, the user will receive email notification of changes to these metrics. Users can also choose
to display their watch list as a portlet within Cognos Connection.
work area
The area within a studio that contains the report, analysis, query or agent currently being used.
Getting Started 65
Glossary

66
Glossary

Index
A
accessing
Cognos content, 56
ad hoc reports, 10
administering
Cognos 8, 17
agents, 11
definition, 61
examples, 41
monitoring, 11
agent views, 16
analyses
Analysis Studio, 12
creating, 51
definition, 61
examples, 51
Analysis Studio, 12
examples, 21, 51
authentication
definition, 61
automating
Cognos 8, 18
B
bursts
definition, 61
C
charts
creating in Report Studio, 36
Cognos 8, 9
Adaptive Analytics, 5
Adaptive Warehouse, 5
Controller, 5
Go! Office, 12
Go! Search, 12
importing into Microsoft Excel, 56
importing into Microsoft PowerPoint, 56
importing into Microsoft Word, 56
samples, 21
workflow, 13
Workforce Performance, 5
Cognos 8 Go! Office
examples, 21
working with Cognos content, 56
Cognos 8 Go! Search, 59
examples, 21
Cognos 8 samples, 21
Cognos Administration, 17
Cognos Connection, 10
examples, 21, 24, 26
running reports, 21
Cognos Planning, 5
Analyst, 5
Contributor, 5
integrating with Cognos 8, 18
Cognos PowerPlay for Windows
integrating with Cognos 8, 18
Cognos Series 7
integrating with Cognos 8, 18
Cognos Viewer, 21
components of Cognos 8, 9
conditional formatting
applying in Query Studio, 28
conditions
defining in Event Studio, 41
definition, 61
content
adding to portal pages, 26
Content Manager
definition, 61
content store
definition, 61
copyright material
printing, 7
creating
multidimensional models, 13
crosstabs
creating in Analysis Studio, 51
Getting Started 67

CSV
report outputs, 16
customer support
contacting, 5
custom sets
definition, 61
D
data trees
definition, 62
documentation
related information, 5
drill down
definition, 62
drilling down, 51
drilling through, 16
drill up
definition, 62
E
entries
searching, 59
event keys
definition, 62
events
definition, 62
managing, 41
monitoring, 11
See Also agents
Event Studio, 11
examples, 21, 41
examples, 21
analyzing data in Analysis Studio, 51
Cognos 8 Go! Office, 56
creating a query using Query Studio, 28
creating a report in Report Studio, 36
creating a statement-style report in Report Studio
Express, 32
creating portal pages, 26
managing events in Event Studio, 41
monitoring performance using Metric Studio, 45
running reports, 21
scheduling reports, 24
F
filters
creating in Analysis Studio, 51
creating in Report Studio, 36
finding
business intelligence content, 12, 59
finding information, 7
formatting
conditional, 28
Framework Manager, 15
G
Global Customer Services Web site, 7
Go To links, 16
H
help
getting, 7
related information, 5
HTML
report outputs, 16
I
information
finding, 7
information panes
definition, 62
integrating
other Cognos products with Cognos 8, 18
international solution, 17
L
languages, 17
layouts
definition, 62
linking reports, 16
M
managed reports, 10
managing
reports, 16
Metric Designer, 15
metrics, 11
definition, 63
examples, 45
68
Index

Metric Studio, 11
examples, 21, 45
monitoring performance, 45
Microsoft Excel
importing Cognos 8 content, 56
report outputs, 16
Microsoft Office Excel, 12
Microsoft PowerPoint
importing Cognos 8 content, 56
Microsoft Word
importing Cognos 8 content, 56
Mocrosoft Office Word, 12
models, 15
definition, 63
monitoring
agents, 11
events, 11
multidimensional models
creating in Transformer, 13
multilingual solution, 17
My Folders, 16
N
namespaces
definition, 63
O
organizing
entries in the portal, 16
outputs, 16
P
packages, 15
definition, 63
PDFs
report outputs, 16
performance
monitoring using Metric Studio, 45
permissions, 17
required for samples, 21
personalizing
agents, 16
portal pages, 17, 26
reports, 16
planning data
integrating with Cognos 8, 18
portal pages, 17
examples, 26
portals, 10
portlets, 17, 26
definition, 63
printing copyright material, 7
prompts
creating in Report Studio, 36
properties panes
definition, 63
Public Folders, 16
publishing
definition, 63
Q
queries
definition, 63
examples, 28
query items
definition, 64
Query Studio, 10
examples, 21, 28
query subjects
definition, 64
quick tours
using, 7
R
related documentation, 5
report outputs, 16
definition, 64
reports, 18
advanced, 10
creating, 28
definition, 64
managing, 16
running, 21
scheduling, 24
statement-style, 10
report specifications, 15
definition, 64
Report Studio, 10
examples, 21, 32, 36
Getting Started 69
Index

Express authoring mode, 11
Professional authoring mode, 10
report views, 16
creating, 24
definition, 64
running
reports, 21
S
samples
Cognos, 21
Cognos 8, 21
permissions required, 21
scheduling, 18
reports, 24
scorecards, 11
definition, 64
examples, 45
scorecard structures
definition, 64
SDK, 18
searching
business intelligence content, 12, 59
in Cognos 8 content, 59
security, 17
sets
definition, 65
software development kit, 18
statement-style reports
creating in Report Studio, 32
strategies
definition, 65
strategy maps
definition, 65
summaries
definition, 65
support
contacting, 5
T
tasks
definition, 65
templates
applying in Query Studio, 28
definition, 65
Transformer, 13, 15
W
watch lists, 45
definition, 65
work areas
definition, 65
workflow, 13
X
XML
report outputs, 16
report specifications, 15
70
Index


