Embed Size (px)
Citation preview

Why Have Workers Stopped Joining Unions?
Alex Bryson and Rafael Gomez
November 2003
Abstract This paper tracks the rise in the percentage of employees who have never become union members (‘never-members’) since the early 1980s and shows that it is the reduced likelihood of ever becoming a member rather than the haemorrhaging of existing members which is behind the decline in overall union membership in Britain. We estimate the determinants of ‘never-membership’ and consider how much of the rise can be explained by structural change in the labour market and how much by change in preferences among employees. We find a similar trend in the unionised sector, indicating that the rise in never-membership for the economy as a whole is not linked solely to a decline in the number of recognised workplaces. JEL Classification : J31, J50, J51 Keywords : Union membership. This paper is produced under the ‘Future of Trade Unions in Modern Britain’ Programme supported by the Leverhulme Trust. The Centre for Economic Performance acknowledges with thanks, the generosity of the Trust. For more information concerning this Programme please e-mail [email protected] Acknowledgements We would like to thank The Leverhulme Trust and the Regent Street Polytechnic Trust for financial support and Katarina Thomson and the National Centre for Social Research for access to and advice on the BSAS data. Alex Bryson is a member of the Policy Studies Institute, 100 Park Village East, London NW1 3SR and is a Research Associate at the Centre for Economic Performance, London School of Economics; e-mail: [email protected] Raphael Gomez is a member of the Interdisciplinary Institute of Management, London School of Economics, Houghton Street, WC2A 2AE; e-mail: [email protected] Published by Centre for Economic Performance London School of Economics and Political Science Houghton Street London WC2A 2AE All rights reserved. No part of this publication may be reproduced, stored in a retrieval system or transmitted in any form or by any means without the prior permission in writing of the publisher nor be issued to the public or circulated in any form other than that in which it is published. Requests for permission to reproduce any article or part of the Working Paper should be sent to the editor at the above address. Alex Bryson and Rafael Gomez, 2003 ISBN 0 7530 1667 2 Individual copy price: £5
Why Have Workers Stopped Joining Unions?
Alex Bryson and Rafael Gomez
1. Overview 1 2. Data 3 2.1 Measures of unionisation 3 3. Empirical Methods 4 3.1 Shift-share analysis 4 3.2 Linear probability estimation of never-membership 5 4. Results 5 4.1 Time-trends in never-membership 5 4.2 Rising never-membership across and within segments of the workforce 6 4.3 The impact of compositional and preference change on the total rise in never-membership 8
4.4 Changes over time in the significance and quantitative importance of demographic, job and workplace characteristics 10 4.5 Determinants of never-membership in the unionised sector 12
5. Discussion and Conclusions 14 Figures 16 Tables 17 Appendix A1 26 Data Derivation 27 References 29
The Centre for Economic Performance is financed by the Economic and Social Research Council
1
1. Overview
The decline in union membership in Britain since the early 1980s is well-documented
(Millward et al., 2000; Machin, 2000; Sneade, 2001). Less well-known is the fact that this
decline is attributable to a rise in the percentage of employees who have never become
members (‘never-members’). This is illustrated in Figure 1 with data for the period 1983-
2001 taken from the British Social Attitudes Surveys described in detail in Section 2.
Between 1983 and 2001, the percentage of employees who had never been a member
of a union or staff association rose by over two-thirds from 28% to 48%. Over the same
period, membership fell by a third from 49% to 31%.1 These figures are striking when we
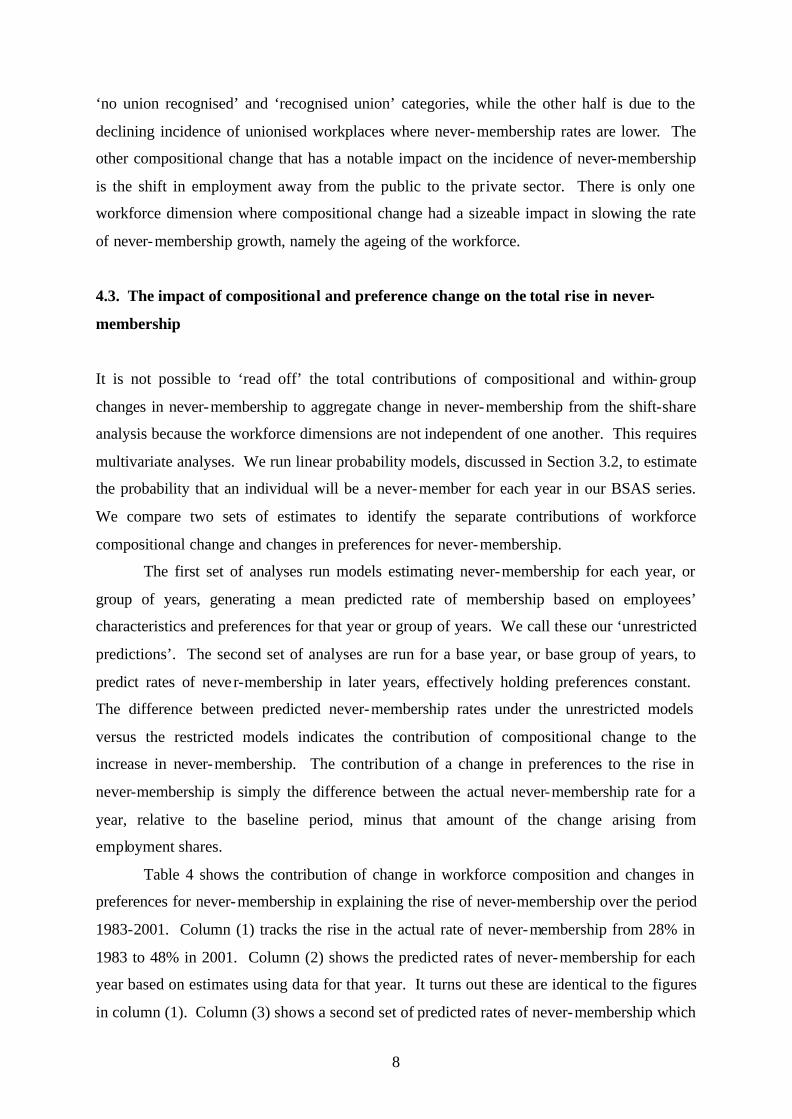
compare never-membership to other life experiences that mark the transition of persons from
young to mature workers (Table 1). Degree attainment and marital status are reported for
male and female workers aged 24 to 34 using the BSAS data for 1983-85 and 1999-2001
periods. These are cross-tabulated by whether a worker is employed in the union or non-
union sector.
The probability of each life event varies with time with a growth in degree attainment
and, for the most part, a decline in marriage rates, but the rise in never experiencing union
membership overshadows these other changes. Among the male population of this age,
workers in the non-unionised sector were twice as likely to have experienced union
membership in 1983 than in 2001. A dramatic difference is even seen in the unionised sector.
This suggests that by 2001, having never joined a union had become a common life event for
the cohort of workers born between the mid 1960s and mid 1970s, sharply distinguishing
their transition to maturity from the cohort born a decade or so earlier.
Since 1994, never-members have been more numerous than union members.
Between one-fifth and one-quarter of employees say they have been members in the past, a
proportion that has not differed much since the early 1980s. So union membership is not
haemorrhaging. This suggests those who become members are no less happy with
membership than in earlier years. This is supported by evidence for the period 1983-2001
from BSAS which shows no trend in perceptions of union effectiveness as measured by
whether union members think the union is doing its job well or not (Bryson and Gomez,
2002: pp. 58-59). There are three possible explanations for the rise in never-membership.
1 Throughout union membership refers to membership of a union or staff association.
2
First, the types of workers who never became members in the past are increasing as a
proportion of the workforce. Secondly, certain types of worker who became members in the
past are less inclined to do so now. This paper focuses on these two possibilities by looking
at the determinants of never-membership over time. The third possibility is that, even if
workers are similarly inclined to purchase membership, they are facing greater constraints in
doing so, creating greater frustrated demand for membership. Other research shows
frustrated demand for unionisation is quantitatively significant in explaining cross-sectional
differences in unionisation in the late 1990s (Bryson and Gomez, 2003). Unfortunately, we
do not have data on employees’ desire for unionisation over time to assess directly whether
frustrated demand has become more important. However, by focusing on the propensity of
individuals to be never-members where they have the opportunity to join (that is, where there
is a union on-site which is recognised by the employer for pay bargaining) we can gain in-
sight into the reasons for declining union density in the unionised sector. It is the density
decline in unionised workplaces, rather than the advent of new, non-unionised workplaces,
which accounts for most of the decline in unionisation during the 1990s (Millward et al,
2000: pp. 90-94).
The remainder of the paper is set out as follows. Section 2 introduces the data.
Section 3 presents empirical methods. Section 4 presents the results in five subsections.
First, we establish whether there is an independent time-trend in the rise of never-
membership having controlled for demographic, job, workplace and business cycle effects.
Second, we use shift-share analysis to describe the extent to which the rise in never-
membership across segments of the workforce can be attributed to changes in workforce
composition, on the one hand, and within-group never-membership density changes on the
other. Third, we estimate the proportion of the aggregate rise in never-membership
attributable to compositional change in the workforce, and the proportion attributable to
changes in the preferences of employees for never-membership. Fourth, we consider changes
over time in the significance and quantitative importance of demographic, job and workplace
characteristics in understanding changing employee preferences for never-membership,
holding other factors constant. Fifth, we consider propensities for never-membership within
the unionised sector, and how these have changed over time. Section 5 concludes and
discusses the implications of the results for trade union recruitment and future unionisation
rates.

3
2. Data
Our analyses use data from the British Social Attitudes Survey Series (BSAS) for the period
1983-2001. BSAS yields a representative sample of adults aged 18 or over living in private
households in Great Britain. The survey has been conducted annually since 1983, with the
exceptions of 1988 and 1992, and usually achieves a response rate of 60% or more. Analysis
is restricted to employees working at least ten hours per week, a cut-off used to filter
respondents on questions relevant to employees. All analyses are weighted to account for
complex survey design so that survey results can be generalised with confidence to the
population of employees in Britain working at least 10 hours per week. Most of the data are
collected through face-to-face interview, supplemented by a self-completion questionnaire.
(For further details of the survey see Park et al., 2002).
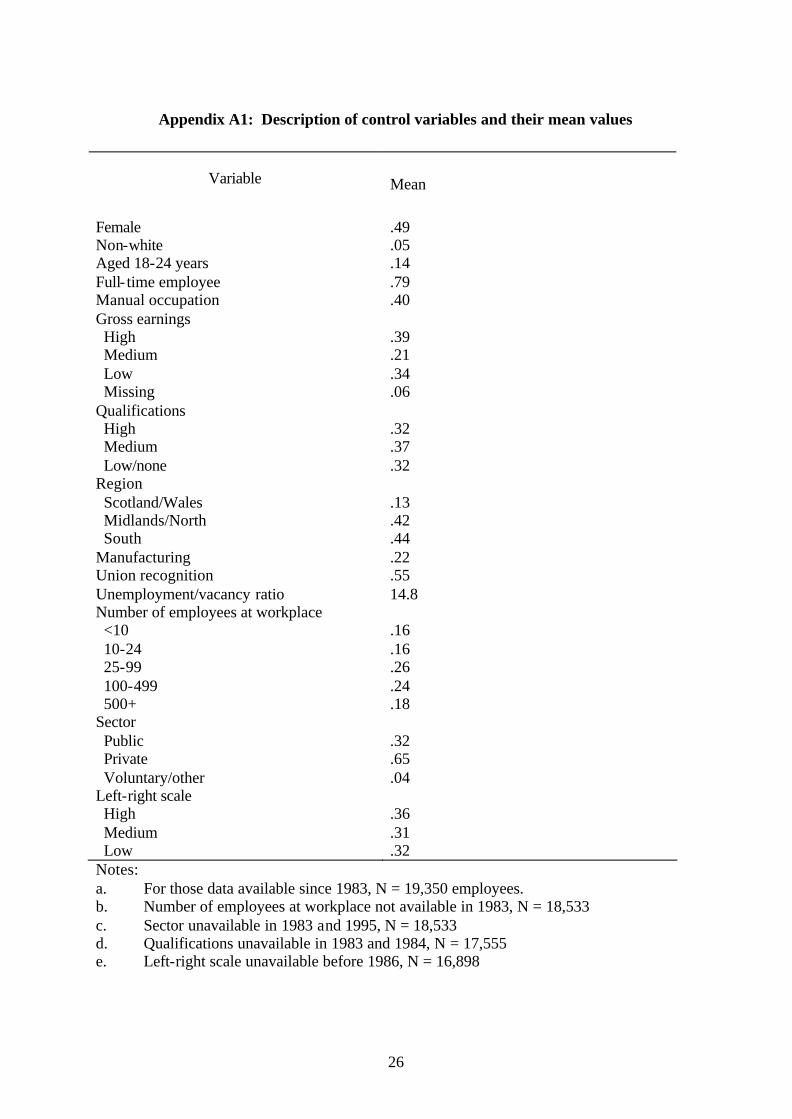
Descriptions of the control variables, together with their mean values, are presented in
Appendix A1.
2.1 Measures of unionisation
The BSAS series contains information on workplace- level unionisation and individual union
membership for every year of the survey, making it one of the longest running series on
unionisation in Britain. The questions are independent of one another in the survey so that
for all employees we can establish individual membership and workplace union status.
Our measure of workplace unionisation is based on employees’ responses to the
question: ‘At your place of work are there unions, staff associations or groups of unions
recognised by the management for negotiating pay and conditions of employment?’2 Current
individual membership status is derived from two questions. First, employees are asked:
‘Are you now a member of a trade union or staff association?’3 If they are not currently a
2 Evidence from linked employer-employee data indicates that lack of awareness about union presence is widespread among employees (Bryson, 2001: 20 and Appendix Table A5). One may also be concerned that respondents may not fully understand the meaning of the phrase ‘recognised by the management for negotiating pay and conditions’. This prompted the BSAS team designing the survey to ask those who said there was a recognised union or staff association ‘Can I just check, does management recognise these unions or staff associations for the purposes of negotiating pay and conditions of employment?’ This question has been added since 1998. In 2001, of the 775 unweighted cases saying ‘yes’ at the first question, 27 said ‘no’ to the check question and 17 said ‘don’t know’. Using weighted data, this adjustment reduces the percentage of employees saying they worked in a workplace recognising unions by 3.1 percentage points (from 46.9% to 43.8%). 3 The union membership figures from 1989 onwards correspond closely to those obtained using the Labour Force Survey (Sneade, 2001), although there is a small increase in membership between 1990 and 1991 in the BSAS data which is not apparent in the LFS (Bryson and Gomez, 2002).
4
member they are asked: ‘Have you ever been a member of a trade union or a staff
association?’ This second question was not asked in 1994 or 1997 so data for these two years
are omitted from the analysis.
3. Empirical Methods
3.1 Shift-share analysis
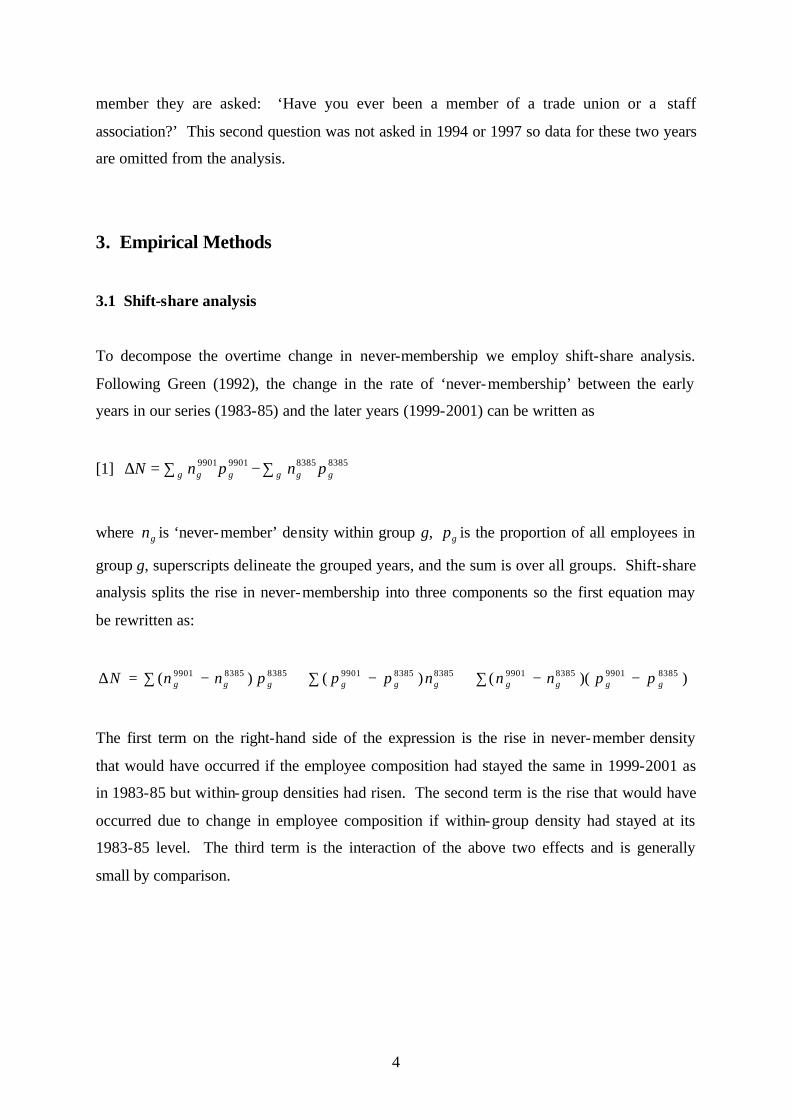
To decompose the overtime change in never-membership we employ shift-share analysis.
Following Green (1992), the change in the rate of ‘never-membership’ between the early
years in our series (1983-85) and the later years (1999-2001) can be written as
[1] 8385838599019901gggggg pnpnN ∑−∑=∆
where gn is ‘never-member’ density within group g, gp is the proportion of all employees in
group g, superscripts delineate the grouped years, and the sum is over all groups. Shift-share
analysis splits the rise in never-membership into three components so the first equation may
be rewritten as:
))(()()( 8385990183859901838583859901838583859901gggggggggg ppnnnpppnnN −−∑+−∑+−∑=∆
The first term on the right-hand side of the expression is the rise in never-member density
that would have occurred if the employee composition had stayed the same in 1999-2001 as
in 1983-85 but within-group densities had risen. The second term is the rise that would have
occurred due to change in employee composition if within-group density had stayed at its
1983-85 level. The third term is the interaction of the above two effects and is generally
small by comparison.

5
3.2 Linear probability estimation of never-membership
All the multivariate estimates of never-membership are based on linear probability models.
Linear probability models are a multivariate extension of the shift-share technique for
assessing changing determinants of never-membership. Let
[2] iii XY εβ +=
where iY is a 0/1 dummy variable denoting whether individual i is a never-member, iX is a
vector of variables representing the groups or workforce dimensions mentioned above, β is a
vector of coefficients and iε is an error term. The estimated predictions iXβ are interpreted
as the probabilities that individual i will never have joined a union. There are two drawbacks
to the technique. First, the value of iXβ may be outside the range 0-1, so that it can not be
interpreted as a predicted probability. In fact, the linear probability model gives results close
to the logit model which transforms the probability to avoid this problem. We ran all our
models as logits, confirming that results were indeed very similar. Following Green (1992)
we chose to use the linear probability model because it is the closest multivariate analogue to
the shift-share analysis. The second drawback is that the model is prone to heteroskedasticity
(Kennedy, 1998: 243). We employ the Huber-White robust variance estimator that produces
consistent standard errors in the presence of heteroscedasticity.
4. Results
4.1 Time-trends in never-membership
Figure 1 showed a steady rise in never-membership over the period 1983-2001. This is
reflected in Table 2 column 1 which shows a gradual rise in the probability that employees
will be never-members relative to the base year, 1983. The trend is only significantly
different from zero from 1987 onwards, with the size of the coefficients rising markedly in
the second half of the 1990s. Without controlling for other factors, the probability of being a
never-member rose by 19 percentage points between 1983 and 2001. If we group years into
the periods 1983-85, 1986-89, 1990-93, 1995-98 and 1999-2001 we see more clearly that

6
there was a significant rise in never-membership in the 1990s relative to the 1980s and that
this trend has been accelerating (Table 2, column 2). This trend is unaffected by the business
cycle (Table 2, column 3, where the business cycle is proxied with the unemployment-
vacancy ratio).4 The time-trend coefficients become smaller with the introduction of basic
controls for demographic, job and workplace characteristics but they remain sizeable and
statistically significant (Table 2, column 4). As noted in Appendix A1, some controls
(establishment size, sector, qua lifications, and the left-right scale) are not available for all
years. Inclusion of these variables truncates the time-series through the loss of earlier years.
However, the pattern of results remains largely unchanged, with the significant rise in never-
membership in the second half of the 1990s apparent in all specifications (results are
available from the authors).
4.2 Rising never-membership across and within segments of the workforce
In this section, we quantify how much of the rise in never-membership is attributable to
changes in the composition of the workforce, and how much of it is due to changes in the
propensity for never-membership within different segments of the workforce.
In Table 3 we characterise British workers along thirteen dimensions. In a recent
paper we illustrated how demand and supply of unionisation differed across categories within
these worker ‘segments’ (Bryson and Gomez, 2003). It is clear from columns 3 and 4 of
Table 3 that some types of worker are more likely than others to be never-members. For
instance, ever since the early 1980s, young workers have been more likely to be never-
members than older workers, as have low earners relative to higher earners, and those
working in the private sector compared to those working in the public sector. Columns 1 and
2 of Table 3 track changes in workforce composition between the early part of our time-series
(1983-85) and the latest period (1999-2001). They show that women, older workers, part-
timers, those with qualifications, non-manual workers, those in services, and those in the
private sector all increased their shares in employment by 5 percentage points or more. With
the exception of older workers, the workforce segments that have increased their employment
share are those where never-membership is traditionally higher. The drift to the political
right has also contributed to rising never-membership. There has also been an increase in the
share of employment taken by qualified workers. However, this has not substantially
4 We have a relatively short time -series and are only controlling for short-run shifts in the demand for labour.

7
affected the rate of never-membership because the growth in medium-qualified workers,
where never-membership was traditionally highest, is offset by the growth in the highly-
qualified who have the lowest rates of never-membership.
The last row of Table 3 reveals the extent to which the percentage of employees in
unionised workplaces has declined – from around two-thirds in the early 1980s to under a
half at the turn of the century. Since workplace- level unionisation is associated with rates of
never-membership which are around one-quarter to one-third of those in non-unionised
workplaces this compositional shift has also contributed to the rise in never-membership.
Although compositional change in the workforce has contributed to the rise in never-
membership, columns 3 and 4 of Table 3 also show considerable within-group change in the
percentage of employees who are never-members. Indeed, what is striking is that the rate of
never-membership rose for every segment of the workforce over the period. The increase
was particularly pronounced among young workers, even though they had the highest rate of
never-membership at the beginning of the period.
Both compositional change in the workforce and within-group preferences for never-
membership have contributed to the rise in never-membership. We quantify their relative
contributions to the growth in never-membership in columns 5 and 6 of Table 3. We use
‘shift-share’ analysis, described in Section 3.1, which has been used on a number of
occasions to analyse changes in union membership density. 5 The technique separates out the
rise in never-membership that would have occurred through within-group density change
with employee composition fixed at its 1983-85 level, and the rise that would have occurred
through change in employee composition if within-group density had stayed at its 1983-85
level.
Comparing columns 5 and 6 in Table 3, we find that within-group increases account
for most of the rise in never-membership in all but one segment. The exception is union
recognition: around half of the rise in never-membership along the dimension of workplace-
level unionisation is accounted for by an increase in the rate of never-membership within the
Hidden to us are macroeconomic cyclical fluctuations over the longer-term which influence unionisation. 5 There are no studies analysing the rise of never-membership in Britain. Studies using shift-share analysis to quantify the impact of workforce compositional change on the decline in union membership density have produced disparate results . Booth (1989) attributes 42% of the density decline from 1979 to 1987 to compositional change, while Green (1992) found compositional change accounted for just under one-third of the density decline between 1983 and 1989. Others show relatively little impact from compositional change for the first half of the 1980s (Carruth and Disney, 1988; Freeman and Pelletier, 1990). Bryson and Gomez (2002) find that, over the period 1983-2001, roughly one-third of the decline in membership density was accounted for by compositional change.
8
‘no union recognised’ and ‘recognised union’ categories, while the other half is due to the
declining incidence of unionised workplaces where never-membership rates are lower. The
other compositional change that has a notable impact on the incidence of never-membership
is the shift in employment away from the public to the private sector. There is only one
workforce dimension where compositional change had a sizeable impact in slowing the rate
of never-membership growth, namely the ageing of the workforce.
4.3. The impact of compositional and preference change on the total rise in never-
membership
It is not possible to ‘read off’ the total contributions of compositional and within-group
changes in never-membership to aggregate change in never-membership from the shift-share
analysis because the workforce dimensions are not independent of one another. This requires
multivariate analyses. We run linear probability models, discussed in Section 3.2, to estimate
the probability that an individual will be a never-member for each year in our BSAS series.
We compare two sets of estimates to identify the separate contributions of workforce
compositional change and changes in preferences for never-membership.
The first set of analyses run models estimating never-membership for each year, or
group of years, generating a mean predicted rate of membership based on employees’
characteristics and preferences for that year or group of years. We call these our ‘unrestricted
predictions’. The second set of analyses are run for a base year, or base group of years, to
predict rates of never-membership in later years, effectively holding preferences constant.
The difference between predicted never-membership rates under the unrestricted models
versus the restricted models indicates the contribution of compositional change to the
increase in never-membership. The contribution of a change in preferences to the rise in
never-membership is simply the difference between the actual never-membership rate for a
year, relative to the baseline period, minus that amount of the change arising from
employment shares.
Table 4 shows the contribution of change in workforce composition and changes in
preferences for never-membership in explaining the rise of never-membership over the period
1983-2001. Column (1) tracks the rise in the actual rate of never-membership from 28% in
1983 to 48% in 2001. Column (2) shows the predicted rates of never-membership for each
year based on estimates using data for that year. It turns out these are identical to the figures
in column (1). Column (3) shows a second set of predicted rates of never-membership which

9
are generated by estimating individuals’ probability of being a never-member for each year
while holding preferences constant at 1983 values. Column (4) shows the contribution to the
percentage point change in never-membership rates relative to 1983 that are accounted for by
compositional change arising from growth and shrinkage in the segments making up the
workforce. Finally, column (5) shows the contribution of changes in preferences while
holding compositiona l change constant. We can see that, over the whole period 1983-2001,
there was a 20 percentage point rise in never-membership: around sixty percent of the change
(12 percentage points) arises from changing employment shares across segments of the
workforce, while the remainder (8 percentage points) comes from changes in preferences for
never-membership. Figure 2 presents the information in graphical form.
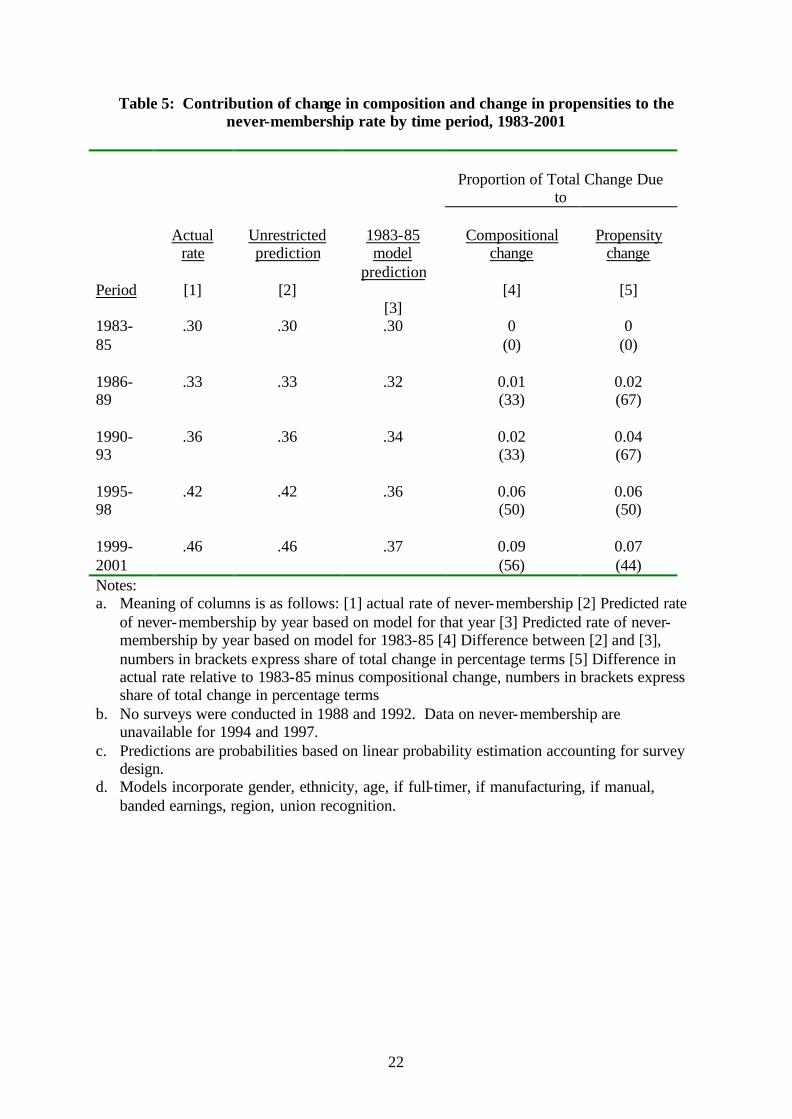
Table 5 presents similar analyses, this time grouping years into five periods: 1983-85,
1986-89, 1990-93, 1995-98 and 1999-2001. This helps overcome some of the sampling
variance arising from estimates based on the single year samples. Comparing 1999-2001
with 1983-85, roughly half the rise in never-membership is accounted for by compositional
change, and half by changes in preferences.
As noted earlier, the BSAS series contains a number of variables that are correlated
with never-membership but are not available in all years. We tested the sensitivity of results
to the inclusion of these variables. First we added sector and workplace size. The absence of
sector from the survey in 1983 and 1995 means these years are excluded from the analysis.
Workplace size was not significantly associated with never-membership. However, the
probability of being a never-member was 7-13% (depending on the period) lower among
public sector employees than private sector employees, controlling for other factors. With
these additional variables in the model, and with the consequential truncation of the time-
series, 7 percentage points of the 14 percentage point rise in never-membership between
1984-85 and 1999-2001 can be accounted for by compositional change in the workforce. The
remaining 7 percentage points is due to a change in preferences.
Next we added workplace size and qualifications to the estimates presented in Table
5. We regroup the years due to the absence of qualifications data for 1983 and 1984. Neither
qualifications nor workplace size have an independent effect on never-membership in our
models. This time, compositional change accounts for 7 of the 12 percentage point rise in
never-membership between 1985-89 and 1999-2001.
In our final sensitivity test, we incorporate workplace size, qualifications and attitudes
towards distributive justice. The absence of the attitude data before 1986 means this analysis
is confined to the period 1986-2001. Other research has established a strong association

10
between more liberal attitudes on this scale and an increased likelihood of union membership
(Bryson and Gomez, 2003). We found being on the ‘right’ of this scale (that is, scoring 2.8
or more on a scale of 1 to 5) increased the probability of never-membership by 6-12%
relative to being on the ‘left’ of the scale (scoring less than 2.20). With these variables
included, compositional effects account for 7 of the 12 percentage points rise in never-
membership between 1986-89 and 1999-2001.
These analyses indicate that compositional change and a change in preferences both
contribute substantially to the rise in never-membership between the early 1980s and late
1990s. Although the precise contribution of both varies a little with model specification and
the years included in the analyses, compositional change explains a little over half the
change, with a change in preferences accounting for the rest.
4.4 Changes over time in the significance and quantitative importance of demographic,
job and workplace characteristics
Let us turn to changes over time in the significance and quantitative importance of
demographic, job and workplace characteristics in understanding changing employee
preferences for never-membership, holding other factors constant. Earlier we showed that
never-membership has risen across all types of worker. This analysis takes each worker
segment (for instance, gender) and identifies whether differential rates of never-membership
increase across worker types within that segment (men and women in the case of gender)
were significantly different from one another, holding other factors constant.
Table 6 presents estimates of never-membership by grouped year. They are linear
probability models so the coefficients can be interpreted as the percentage change in the
probability of never-membership associated with a characteristic, holding other factors
constant. We control for workplace- level union recognition, thus netting out the constraints
and opportunities for membership associated with the availability of a union on-site. Thus, it
is arguable that changing associations with never-membership identified in the models tell us
about changes in preferences for membership.6 We return to this in Section 4.5.
6 There are two reasons why we can not claim that our analysis fully accounts for the relationship between union availability and preferences for unionisation. First, other variables may not be independent of workplace-level unionisation because different types of worker may sort themselves into unionised and non-unionised workplaces according to the gains they may obtain by being unionised. Employers may also be able to select from among those desirous of union membership. Secondly, if differential sorting has gone on over the period of our analysis, this may affect the interpretation of the independent effects of other variables in our models.

11
The association between the three demographic characteristics in the model and
never-membership probabilities change markedly over the period. Gender is not associated
with never-membership in the 1980s. In the 1990s, women’s probability of never-
membership is about 6% higher than men’s, but the differential closes by the end of the
century and is no longer statistically significant. Until the mid-1990s, non-whites had a
higher probability of never-membership than whites, but the difference is not apparent after
the mid-1990s. Young workers have had a higher probability of never-membership since the
beginning of the BSAS, but the size of the effect has grown. In the early 1980s, workers
aged under-25 had a probability of never-membership that was 18% higher than older
workers. This had risen to 29% by 1999-2001. A formal test of whether the coefficients
altered significantly between 1983-85 and 1999-2001 indicates that the shift in preferences of
non-whites relative to whites and the young versus the old are statistically significant.7
Where employees live also matters, with those in the South significantly more likely to be
never-members than those living elsewhere: variation in regional effects over time is not
statistically significant.
Turning to job characteristics, the negative association between never-membership
and full-time working apparent in the 1980s had disappeared by the 1990s. Throughout the
period non-manual workers had higher probabilities of never-membership than manual
workers, but the size of the effect did not differ much over time. Similarly, low-paid workers
were more likely to be never-members throughout but the size of the effect did not differ
significantly.
Perhaps most interesting of all is the effect of workplace- level union recognition.
Employees in unionised workplaces had a 40% lower probability of never-membership than
similar employees in non-unionised workplaces. The size of this effect has not changed
significantly over the period. Recall that the shift-share analysis presented in Table 3
indicated that changes in preferences accounted for roughly half of the rise in never-
membership along this dimension. The analysis in Table 6 shows that, controlling for other
7 The formula for this test is
22
21
21
sese +− ββ where beta1 signifies the coefficient in the first period,
beta2 signifies the coefficient in the second period, se12 is the square of the standard error for the coefficient
in the first period and se22 is the square of the standard error for the coefficient in the second period. The
changes in the coefficients between the beginning and the end of the period on ethnicity and age are both statistically significant at a 99% level of confidence.

12
factors, the rate at which the preference for never-membership declined did not differ
significantly across employees in unionised and non-unionised workplaces.
We also estimated the impact of workplace size, sector, qualifications and attitudes to
distributive justice over time for the years that these variables were available. Workplace
size and qualifications were never statistically significant. Being in the public sector lowered
the probability of never-membership by 7-13% relative to private sector employment, but
there was no trend over time. Similarly, being on the ‘right’ of the left-right scale raised the
probability of never-membership by between 6-12% depending on the period relative to
being on the ‘left’, but there was no time-trend.
In general, then, coefficients attached to workplace and job characteristics did not
shift a great deal over the period. The exception was full- time employment, which was no
longer associated with lower never-membership by the 1990s. However, there was
substantial change in preferences attached to demographic characteristics.
4.5 Determinants of never-membership in the unionised sector
Above we showed that one of the reasons for the rise in never-membership was the decline in
the presence of a union at the workplace. Others have highlighted the growth in non-union
workplaces as contributing to the decline in union membership in Britain (Millward et al.,
2000; Machin, 2000). The absence of workplace-level unionisation may affect individual
employees’ decisions to join a union because the cost of organising an unorganised
workplace in order to become a union member is higher than the cost of becoming a member
in an already unionised workplace (Farber, 2001; Green, 1990; Bryson and Gomez, 2002).
An alternative perspective would be to consider individuals’ propensity to join a union, on
the one hand, and their opportunities for doing so, on the other, as important determinants of
the union joining decision (Bain and Elshekh, 1976; Disney, 1990).8 Those opportunities are
greatest where there is already a union in place. In keeping with workplace-level analyses
(Millward et al, 2000), we find the propensity to be a member has declined since the early
1980s even among those with the best opportunities to join (those facing the lowest costs) –
that is, those in unionised workplaces (Table 7). Three-quarters of the 12 percentage point
8 In fact, these two perspectives are not that dissimilar because the extent to which individuals perceive an ‘opportunity’ to unionise depends to a large degree on perceived costs and benefits of organising.

13
drop in membership in unionised workplaces since the early 1980s is accounted for by the
rise in never-membership.9
In light of the discussion above, an analysis of employees’ decisions never to join a
union, even when they have a recognised union on-site, provides an opportunity to
understand possible reasons for the decline in union membership density within the unionised
sector.
Table 8 presents results from linear probability models estimating never-membership
for grouped years among employees working in unionised workplaces. Between 1983-85
and 1999-2001 never-membership in the unionised sector rose 9 percentage points. Under
the models presented in Table 8, this change was due exclusively to compositional effects. It
is possible that preferences are less important in explaining changes in the never-membership
rate in the unionised sector than in the economy as a whole because some self-sorting plays a
role in determining whether individuals are employed in a unionised or non-unionised
workplace in the first place. Different types of workers may choose to apply in unionised and
non-unionised workplaces according to the gains they may obtain by being unionised.
Equally, employers may also select from among those most (or least) desirous of union
membership (Abowd and Farber, 1982). If so, employees’ characteristics dictate whether
they choose (or are chosen by employers) to enter unionised workplaces, and thus have the
opportunity to join a union without incurring the large costs of organising a non-unionised
workplace.
This does not mean that preferences for never-membership within the unionised
sector are of no consequence. As Table 8 shows, there were significant shifts in preferences
within particular dimensions of the workforce. For instance, the probability of never-
membership rose dramatically for young workers relative to older workers in the unionised
sector over the period (the relative probability rising from 13% in 1983-85 to 28% in 1999-
2001). The probability of never-membership also rose significantly among low and mid-
earner employees relative to high earners. On other dimensions, there was a convergence in
never-membership rates – for instance, between men and women, full- timers and part-timers
and manual and non-manual workers.
9 The Workplace Industrial Relations Survey Series indicates that aggregate union density in recognised workplaces fell from 75% in 1984 to 56% in 1998, a drop of 19 percentage points (authors’ calculations). Over the same period, BSAS indicates a decline from 71% to 60%, a drop of 11 percentage points. The discrepancies in density levels and rates of decline may be accounted for by differences in sample coverage. WIRS is confined to workplaces with 25+ employees but includes employees regardless of hours worked. BSAS has no employment size threshold but is confined to employees working at least 10 hours per week.

14
5. Discussion and Conclusions
Using repeat cross-sectional data from the British Social Attitudes Surveys we have shown
that the decline in union membership in Britain is accounted for by the rising percentage of
employees who have never been union members. There was a significant rise in never-
membership in the 1990s relative to the 1980s and this trend accelerated in the second half of
the 1990s.
In the economy as a whole, a little over half the rise in never-membership is due to
compositional change in the workforce, in that segments with traditionally high rates of
never-membership increased their share of employment. The remainder is accounted for by
within-group changes in never-membership density. These within-group changes may be
indicative of changing preferences for union membership. The rise in young people’s
probability of never-membership relative to older workers over the period is particularly
marked, and is apparent in the whole economy and the unionised sector. The estimated
probability of never-membership over time did not vary much with workplace and job
characteristics. The exception was full- time employment status which, by the 1990s, was no
longer associated with a lower never-membership rate than part-time employment.
The biggest single factor determining the probability of never-membership is whether
or not an individual is employed in a workplace with a recognised union. Employees in
unionised workplaces had a 40% lower probability of never-membership than similar
employees in non-unionised workplaces. The size of this effect has not changed very much
since the early 1980s. However, the decline in workplace unionisation has contributed very
significantly to the rise in never-membership in the economy. Intriguingly, three-quarters of
the decline in union density within unionised workplaces is accounted for by a rise in never-
membership, indicating that the rise in never-membership is not simply a function of overt
employer opposition or the increasing organising costs of becoming a member implied by the
rise in non-unionised workplaces.
These findings have a number of practical implications for the future of unions and
union organising. Compositional changes in the workforce have conspired against unions
because they have resulted in an increasing proportion of employment going to the types of
workers who have traditionally been less inclined to unionise. If these changes continue into
the future, we can expect further declines in union membership. Of course, it is by no means
certain that these compositional changes will continue. For instance, in view of public

15
concern about public services, one might anticipate some relative growth in the public sector
(where unions are traditionally strong). Perhaps more unsettling for union organisers is the
finding that the rate of never-membership rose across all segments of the workforce in the
1980s and 1990s. This universal move away from unionism makes it difficult for unions to
know where to focus their organising energies. However, union organisers can take some
comfort from the fact that changing preferences fo r unionisation accounted for nearly half the
rise in never-membership. There is little unions can do to alter the nature of workforce
compositional change but they may be able to persuade employees to alter their preferences
for union membership - provided they correctly diagnose why it is that employees have
stopped joining unions.
Of course, this last point is extremely important. Unions’ ability to offer ‘value’ to
employees is severely limited where they are unable to establish bargaining rights with
employers. Getting onto a better footing with employers – one that brings the prize of
recognition – may be the best way to make substantial membership gains in the longer-term.
But with never-membership rates within the unionised sector rising by 64% since the early
1980s, this is not enough on its own. Unions are faced with the challenge of proving their
relevance and effectiveness to the 23% of employees in the unionised sector who have never
become members. Achieving this is probably less costly to unions than seeking to organise
unorganised workplaces and, at least in the short-term, it may present the best opportunity for
making substantial membership gains.

16
Figure 1: Trends in Union Membership, 1983-2001
Note: Mid-point rates have been interpolated for years in which the survey was not conducted (1988 and 1992) and years in which the question on ex-membership was not asked (1994 and 1997).
Figure 2: Rising never-membership in Britain: the contribution of ‘compositional’ and
‘propensity’ change, 1983-2001.
25
30
35
40
45
50
1983 1985 1987 1989 1991 1993 1995 1997 1999 2001
Actual
Composition only
Propensity only
%
20
25
30
35
40
45
50
1983 1985 1987 1989 1991 1993 1995 1997 1999 2001
E x - m e m b e r s
Never -members
M e m b e r s
%
17
Table 1: Union membership compared to other life events for those aged 25-34
Total
Unionised Sector
Non-Union Sector
Life Event
1983-85
1999-2001
1983-85
1999-2001
1983-85
1999-2001
Males Never-membership 26 57 8 34 52 75 Ever membership 74 43 92 66 48 25 Bachelor’s degree 17 28 19 32 13 24 Marriage 78 68 80 65 76 71 Females Never-membership 37 59 14 31 68 83 Ever membership 63 41 86 69 32 17 Bachelor’s degree 24 27 32 27 15 27 Marriage 70 68 72 70 66 66 Notes: Ever membership includes both current members and non-members who have been members in the past. Married includes living as married. Life events in 1983-85 are for birth cohort born between 1949 (aged 34 in 1983) and 1960 (aged 25 in 1985) and for 1999-2001 the birth cohort is born between 1965 (aged 34 years in 1999) and 1976 (aged 25 in 2001).

18
Table 2: Time-trends and rising never-membership (1) (2) (3) (4)
1. Year (ref: 1983) 1984 0.020 (0.83) 1985 0.036 (1.56) 1986 0.031 (1.50) 1987 *0.054 (2.53) 1989 *0.046 (2.19) 1990 **0.080 (3.75) 1991 **0.060 (2.67) 1993 **0.073 (3.26) 1995 **0.132 (6.05) 1996 **0.131 (6.12) 1998 **0.139 (6.42) 1999 **0.168 (7.67) 2000 **0.150 (7.01) 2001 **0.191 (8.90) 2. Year, grouped (ref: 1983-85) 1986-89 0.024 0.012 0.006 (1.96) (0.85) (0.48) 1990-94 **0.052 **0.048 *0.029 (4.02) (3.54) (2.38) 1995-98 **0.115 **0.099 **0.063 (9.06) (5.92) (4.40) 1999-2001 **0.151 **0.126 **0.085 (11.88) (5.93) (4.66) 3. Unemployment-vacancy ratio -0.002 -0.001
(1.46) (0.81) 4. Aged 18-24 **0.250
(23.08) 5. Gross earnings (ref: high) Low **0.079 (7.57) Mid-level 0.011 (1.21) Missing **0.093 (6.11) 6. Non-white (ref: white) *0.036
(2.26) 7. Female (ref: male) **0.033 (4.08) 8. Full-timer (ref: part-timer) -0.016 (1.46) 9. Manual (ref: non-manual) **-0.085 (11.28)

19
(1) (2) (3) (4) 10. Manufacturing (ref: Non-manufacturing)
0.012
(1.43) 11. Region (ref: South) Midlands/North **-0.077 (10.53) Scotland/Wales **-0.089 (8.92) 12.Union recognised (ref: Non-union) **-0.411
(56.63) 13. Constant **0.285 **0.303 **0.336 **0.577 (17.34) (31.09) (13.93) (23.57) Observations 19350 19350 19350 18601 R-squared 0.01 0.01 0.01 0.28 Joint significance of time variables F(14,19336
)=16.72 P>F=0.000
0
F(4,19346)=55.92
P>F=0.0000
F(4,19346)=21.40
P>F=0.0000
F(4,18597)=12.66
P>F=0.0000
Note: * denotes significance at a 95% confidence level, ** denotes significance at a 99% confidence level.

20
Table 3: Decomposing the rise of never-membership by workforce groupings
Share of employees Share who have
never been members Shift share analysis
(Percentage Change Due to:)
1983-85
1999-2001
1983-85
1999-2001
Within-group density change
Compositional change
1. By Gender Male Female
56 44
49 51
25 37
44 47
91
9
2. By Age 18-24 25+
17 83
12 88
50 26
78 41
111
-11 3. By Ethnicity White Non-white
97 3
94 6
30 41
45 48
96
4
4. By Left-Right scale High Medium Low
37 29 35
41 31 27
42 30 25
50 43 38
97
3
5. By Hours Full-time Part -time
83 17
76 24
27 46
44 49
94
6
6. By Occupation Manual Non-manual
46 54
37 63
25 35
45 45
96
4
7. By Earnings High Medium Low
37 23 40
50 22 28
22 23 42
39 46 57
102
-2 8. By Qualification High Medium Low
25 32 42
36 39 25
27 36 32
42 50 44
100
0
9. By Workplace size <25 employees 25+ employees
32 68
32 68
46 24
57 40
100
0
10. By Sector Public Private Other
36 61 3
29 68 3
13 42 42
22 55 50
83
17 11. By Industry Manufacturing Non-manufact.
28 72
19 81
27 32
42 46
96
4
12. By Region Scotland/Wales Midlands/North South
13 43 45
14 41 45
25 24 38
35 42 52
102
-2 13. By Unionisation Recognition No Recognition
64 36
47 53
14 60
23 66
50
50 Notes: a. A description of the shift-share methodology is given in Section 3.1. b. Left-right scale is not available before 1986 so base period is 1986-89. c. Workplace size is not available in 1983 so base period is 1984-85. d. Qualifications are not available in 1983 or 1984 so base period is 1985. e. Sector figures are not available for 1983 so base period is 1984-85.

21
Table 4: Contribution of change in composition and change in propensities to the never-membership rate, 1983-2001
Proportion of Total Change Due to Actual
rate
[1]
Unrestricted prediction
[2]
1983 Model prediction
[3]
Change in Composition
[4]
Change in Propensity
[5]
Year
1983 0.28 0.28 0.28 0.00 (0)
0.00 (0)
1984 0.30 0.30 0.28 0.02
(100) 0.00 (0)
1985 0.32 0.32 0.29 0.03
(75) 0.01 (25)
1986 0.32 0.32 0.31 0.01
(25) 0.03 (75)
1987 0.34 0.34 0.30 0.04
(67) 0.02 (33)
1989 0.33 0.33 0.31 0.02
(40) 0.03 (60)
1990 0.37 0.37 0.32 0.05
(55) 0.04 (45)
1991 0.34 0.34 0.31 0.03
(50) 0.03 (50)
1993 0.36 0.36 0.32 0.04
(50) 0.04 (50)
1995 0.42 0.42 0.32 0.10
(71) 0.04 (28)
1996 0.42 0.42 0.34 0.08
(57) 0.06 (42)
1998 0.42 0.42 0.35 0.07
(50) 0.07 (50)
1999 0.45 0.45 0.35 0.10
(58) 0.07 (42)
2000 0.44 0.44 0.35 0.09
(56) 0.07 (44)
2001 0.48 0.48 0.36 0.12
(60) 0.08 (40)
Notes: a. Meaning of columns is as follows: [1] actual rate of never-membership [2] Predicted rate of never-
membership by year based on model for that year [3] Predicted rate of never-membership by year based on model for 1983 [4] Difference between [2] and [3], numbers in brackets express share of total change in percentage terms [5] Difference in actual rate relative to 1983 minus compositional change, numbers in brackets express share of total change in percentage terms.
b. No surveys were conducted in 1988 and 1992. Data on never-membership are unavailable for 1994 and 1997. Analysis for 1991 excludes ethnicity dummy due to large number of missing cases.
c. Predictions are probabilities based on linear probability estimation accounting for survey design. d. Models incorporate gender, ethnicity, age, if full-timer, if manufacturing, if manual, banded earnings,
region, union recognition.
22
Table 5: Contribution of change in composition and change in propensities to the never-membership rate by time period, 1983-2001
Proportion of Total Change Due to
Period
Actual
rate
[1]
Unrestricted prediction
[2]
1983-85 model
prediction
[3]
Compositional
change
[4]
Propensity
change
[5]
1983-85
.30 .30 .30 0 (0)
0 (0)
1986-89
.33 .33 .32 0.01 (33)
0.02 (67)
1990-93
.36 .36 .34 0.02 (33)
0.04 (67)
1995-98
.42 .42 .36 0.06 (50)
0.06 (50)
1999-2001
.46 .46 .37 0.09 (56)
0.07 (44)
Notes: a. Meaning of columns is as follows: [1] actual rate of never-membership [2] Predicted rate
of never-membership by year based on model for that year [3] Predicted rate of never-membership by year based on model for 1983-85 [4] Difference between [2] and [3], numbers in brackets express share of total change in percentage terms [5] Difference in actual rate relative to 1983-85 minus compositional change, numbers in brackets express share of total change in percentage terms
b. No surveys were conducted in 1988 and 1992. Data on never-membership are unavailable for 1994 and 1997.
c. Predictions are probabilities based on linear probability estimation accounting for survey design.
d. Models incorporate gender, ethnicity, age, if full-timer, if manufacturing, if manual, banded earnings, region, union recognition.

23
Table 6: Linear probability models estimating never-membership by worker groupings, for 5 periods
Dependent Variable: Probability of Never Being a Union Member
Period
Independent Variables:
1983-85
1986-89
1990-93
1995-98
1999-2001
1. Female 0.003 0.011 **0.061 **0.062 0.019 (0.13) (0.66) (3.07) (3.77) (1.13) 2. Non-white **0.140 *0.078 **0.110 0.011 -0.020 (3.23) (2.10) (2.79) (0.36) (0.69) 3. Age 18-24 **0.179 **0.226 **0.270 **0.288 **0.288 (7.10) (11.86) (9.27) (11.66) (12.37) 4. Full- timer **-0.108 **-0.067 -0.030 0.031 0.030 (3.44) (3.11) (1.14) (1.37) (1.36) 5. Manufacturing *0.039 0.006 0.013 0.029 -0.013 (2.08) (0.40) (0.64) (1.56) (0.67) 6. Manual worker **-0.104 **-0.092 **-0.099 **-0.083 **-0.066 (5.55) (6.28) (5.48) (5.17) (4.03) 7. Gross earnings (ref: High)
Mid-level -0.004 -0.029 0.010 0.019 *0.043 (0.19) (1.58) (0.45) (1.02) (2.18) Low **0.079 **0.050 0.044 **0.114 **0.098 (3.19) (2.58) (1.76) (5.13) (4.09) Missing *0.079 **0.087 **0.110 **0.113 *0.077 (2.22) (2.94) (3.27) (3.27) (2.25) 8. Region (ref: South) Scotland/Wales
**-0.070
**-0.084
**-0.069
**-0.080
**-0.118
(2.73) (4.51) (2.67) (3.80) (5.65) Midlands/North **-0.101 **-0.067 **-0.083 **-0.062 **-0.081 (5.63) (4.65) (4.67) (4.01) (5.21) 9. Union recognition **-0.412 **-0.419 **-0.396 **-0.416 **-0.404 (20.26) (28.44) (21.94) (28.05) (26.90) 10. Constant **0.675 **0.650 **0.593 **0.554 **0.619 (17.72) (23.82) (16.94) (19.46) (21.97) Observations 2434 4344 3066 4366 4391 R-squared 0.29 0.28 0.27 0.27 0.25 Note: * denotes significance at a 95% confidence level, ** denotes significance at a 99% confidence level.

24
Table 7: The rise of never-membership in the unionised sector, 1983-1998
Period
Membership Status
1983-
85
1986-
89
1990-
94
1995-
98
1999-2001
1. Current Members
72
71
68
63
60
2. Non-members
28
(100)
29
(100)
32
(100)
37
(100)
40
(100) a. Ex-members 14
(50) 14
(48) 15
(46) 17
(45) 17
(42) b. Never-Members
14 (50)
15 (52)
17 (54)
20 (55)
23 (58)
No. Observations 1574 2671 2090 2274 2094
Notes: Numbers represent percentages. Numbers in brackets represent share of total non-union membership rate attributable to ex and never members.

25
Table 8: Linear probability models estimating never-membership in the Unionised Sector by worker groupings, for 5 periods
Dependent Variable: Probability of Never Being a Union Member
Period
Independent Variables
1983-85
1986-89
1990-93
1995-98
1999-2001
1. Female **-0.063 -0.018 0.026 0.028 -0.023 (2.97) (0.95) (1.06) (1.28) (0.92) 2. Non-white *0.111 0.053 0.059 -0.071 -0.063 (2.14) (1.22) (1.03) (1.83) (1.54) 3. Age 18-24 **0.127 **0.128 **0.248 **0.271 **0.284 (4.36) (4.97) (5.19) (5.65) (5.87) 4. Full- timer **-0.208 **-0.084 -0.014 -0.008 0.031 (5.46) (3.16) (0.43) (0.26) (0.96) 5. Manufacturing **0.074 **0.052 *0.061 **0.088 0.045 (3.77) (3.01) (2.41) (3.44) (1.67) 6. Manual worker **-0.147 **-0.117 **-0.136 **-0.100 **-0.098 (7.39) (7.05) (6.24) (4.54) (4.10) 7. Gross earnings (ref:High) Mid-level -0.003 -0.018 -0.000 **0.060 **0.095 (0.18) (1.05) (0.02) (2.64) (3.55) Low **0.100 **0.086 **0.112 **0.145 **0.181 (4.06) (4.13) (3.53) (4.59) (5.09) Missing **0.075 *0.067 *0.102 0.056 **0.135 (1.96) (2.01) (2.48) (1.32) (2.67) 8. Region (ref:South) Scotland/Wales **-0.080 **-0.097 *-0.065 **-0.092 **-0.142 (3.14) (4.84) (2.11) (3.65) (5.38) Midlands/North **-0.092 **-0.078 **-0.061 -0.062 **-0.101 (4.89) (4.79) (2.86) (3.00)** (4.60) 10. Constant **0.385 **0.265 **0.182 **0.172 **0.221 (8.62) (8.48) (4.19) (4.76) (5.48) Observations 1563 2652 1745 2253 2080 R-squared 0.12 0.07 0.11 0.09 0.09
26
Appendix A1: Description of control variables and their mean values
Variable Mean
Female .49 Non-white .05 Aged 18-24 years .14 Full- time employee .79 Manual occupation .40 Gross earnings High Medium Low Missing
.39 .21 .34 .06
Qualifications High Medium Low/none
.32 .37 .32
Region Scotland/Wales Midlands/North South
.13 .42 .44
Manufacturing .22 Union recognition .55 Unemployment/vacancy ratio 14.8 Number of employees at workplace <10 10-24 25-99 100-499 500+
.16 .16 .26 .24 .18
Sector Public Private Voluntary/other
.32 .65 .04
Left-right scale High Medium Low
.36 .31 .32
Notes: a. For those data available since 1983, N = 19,350 employees. b. Number of employees at workplace not available in 1983, N = 18,533 c. Sector unavailable in 1983 and 1995, N = 18,533 d. Qualifications unavailable in 1983 and 1984, N = 17,555 e. Left-right scale unavailable before 1986, N = 16,898

27
Data Derivation
Here we describe the derivation of variables where it is not self-evident what we have done.
Earnings
Respondents are asked to identify which of a number of gross earnings bands covers their
own earnings. During the series the number of bands has increased from X to Y with values
varying to reflect the rise in earnings over the period. We recoded the gross earnings bands
into an ordinal variable with five categories ranging from ‘much below average’ to ‘much
above average’. ‘Low’ includes ‘much below’ and ‘below’ average’; ‘Medium’ is ‘average’
and ‘High’ is ‘above average’ or ‘much above average’.
Qualifications
These relate to individuals’ highest qualification. ‘High’ means degree or higher education
below degree. ‘Medium’ means ‘A-level’ or ‘O-level’ or equivalent. Low means ‘CSE’ or
‘none’.
Unemployment/vacancy ratio
The unemployment/vacancy ratio was constructed by the authors and is a consistent
seasonally adjusted time-series for Great Britain derived from series provided by the Office
of National Statistics. The unemployment measure is the number of unemployed in the
Spring of each year using the ILO definition, and the vacancy data are the official figures for
the same period.
Left-right scale
The left-right scale is an additive index drawing on responses to five statements to which the
respondent is invited to ‘agree strongly’, ‘agree’, ‘neither agree nor disagree’, ‘disagree’ or
‘disagree strongly’. These are: ‘Government should redistribute income from the better-off
to those who are less well off’; ‘Big business benefits owners at the expense of workers’;
‘Ordinary working people do not get their fair share of the nation’s wealth’; ‘There is one law
for the rich and one for the poor’; ‘Management will always try to get the better of employees
if it gets the chance’. This well tried and tested index measures an underlying (‘latent’)
attitudinal dimension relating to employees’ perceptions of distributive justice. Those with
28
lower scores on the continuous scale running from 1 to 5 are more likely to favour
government economic intervention and the reduction of inequality than are those with higher
scores. We distinguish between ‘low’, ‘medium’ and ‘high’ scorers on the index. ‘Low’
scorers are those scoring below 2.2 on the scale, ‘medium’ scorers are those scoring 2.2 –
2.75 and ‘high’ scorers are those with above 2.75. Previous research shows union members
are significantly more likely to be ‘left-wing’ (have a lower score) on the index than non-
members (Bryson, 1999).

29
References Abowd, J. M. and Farber, H. S. (1982), ‘Job Queues and the Union Status of Workers’,
Industrial and Labor Relations Review, Vol. 35, No. 3, pp. 354-367
Bain, G. S. and Elsheikh, F. (1976), Union Growth and the Business Cycle, Basil Blackwell: Oxford.
Booth, A. (1989), What Do Unions Do Now?, Discussion Papers in Economics, No. 8903, Brunel University.
Bryson, A. (1999), ‘Are Unions Good for Industrial Relations?’,in R. Jowell, J. Curtice, A. Park, and K. Thomson (eds.), British Social Attitudes: the 16th Report – Who shares New Labour values?, Ashgate: Aldershot.
Bryson, A. and Gomez, R. (2003), ‘Segmentation, Switching Costs and the Demand for
Unionization in Britain’, Centre for Economic Performance Discussion Paper No. 568, London School of Economics.
Bryson, A. and Gomez, R. (2002), ‘Marching On Together? Reasons for the Recent Decline in Union Membership’, in A. Park, J. Curtice, K. Thomson, L. Jarvis, and C. Bromley (eds.), British Social Attitudes: the 19th Report, Ashgate: Aldershot.
Carruth, A. and Disney, R. (1988), ‘Where Have Two Million Trade Union Members
Gone?’, Economica, 55, pp. 1-19.
Disney, R. (1990), ‘Explanations of the Decline in Trade Union Density in Britain: an Appraisal’, British Journal of Industrial Relations, 28:2, pp. 165-177.
Farber, H. (2001), ‘Notes on the Economics of Labor Unions’, Working Paper No. 452. Princeton University, Industrial Relations Section.
Freeman, R. and Pelletier, J. (1990), ‘The Impact of Industrial Relations Legislation on
British Union Density’, British Journal of Industrial Relations, 28, pp. 141-164.
Green, F. (1992), ‘Recent Trends in British Trade Union Density: How Much of a Compositional Effect?’, British Journal of Industrial Relations, 30: 3, pp. 445-458.
Green, F. (1990), ‘Trade Union Availability and Trade Union Membership In Britain’, The Manchester School, Vol. LV111, No. 4, pp. 378-394.
Hicks, S. (2000), ‘Trade Union Membership 1998-99: an Analysis of Data from the Certification Officer and Labour Force Survey’, Labour Market Trends, July, pp. 329-327.
Jowell, R., Curtice, J., Park, A., and Thomson, K. (1999), British Social Attitudes: the 16th Report. Who Shares New Labour Values?, Ashgate: Dartmouth.
Kennedy, P. (1998), A Guide to Econometrics, Fourth Edition, Blackwells: Oxford.

30
Machin, S. (2000), ‘Union Decline in Britain’, British Journal of Industrial Relations, 38:4, pp. 631-645.
Millward, N., Bryson, A. and Forth, J. (2000), All Change at Work?, Routledge: London. Park, A., Curtice, J., Thomson, K., Jarvis, L. and Bromley, C. (eds.), (2002), British Social
Attitudes: the 19th Report, Aldershot.
Sneade, A. (2001), ‘Trade Union Membership 1999-2000: an Analysis of Data from the Certification Officer and the Labour Force Survey, Labour Market Trends, pp. 433-444.

CENTRE FOR ECONOMIC PERFORMANCE Recent Discussion Papers
588 Henry G. Overman
L. Alan Winters Trade Shocks and Industrial Location: the Impact of EEC Accession on the UK
587 Pierre-Philippe Combes Henry G. Overman
The Spatial Distribution of Economic Activities in the European Union
586 Henry G. Overman Can We Learn Anything from Economic Geography Proper?
585 A. B. Bernard J. Bradford Jensen P. K. Schott
Falling Trade Costs, Heterogeneous Firms and Industry Dynamics
584 A. B. Bernard J. Bradford Jensen P. K. Schott
Survival of the Best Fit: Exposure to Low-Wage Countries and the (Uneven) Growth of U.S. Manufacturing Plants
583 S. Wood S. Moore
Reviewing the Statutory Union Recognition (ERA 1999)
582 T. Kirchmaier Corporate Restructuring and Firm Performance of British and German Non-Financial Firms
581 C. Dougherty Why Is the Rate of Return to Schooling Higher for Women than for Men?
580 S. Burgess D. Mawson
Aggregate Growth and the Efficiency of Labour Reallocation
579 S. Nickell Poverty and Worklessness in Britain
578 D. Marsden Renegotiating Performance: the Role of Performance Pay in Renegotiating the Effort Bargain
577 S. Nickell A Picture of European Unemployment: Success and Failure
576 A. de Coulon M. Piracha
Self-Selection and the Performance of Return Migrants: the Source Country Perspective

575 H. Steedman K. Wagner J. Foreman
The Impact on Firms of ICT Skill-Supply Strategies: An Anglo-German Comparison
574 S. Gibbons The Costs of Urban Property Crime
573 R. Griffith S. Redding H. Simpson
Productivity Convergence and Foreign Ownership at the Establishment Level
572 S. Redding P. K. Schott
Distance, Skill Deepening and Development: Will Peripheral Countries Ever Get Rich?
571 B. Petrongolo C. A. Pissarides
Scale Effects in Markets with Search
570 M. Coles B. Petrongolo
A Test Between Unemployment Theories Using Matching Data
569 A. Bryson L. Cappellari C. Lucifora
Does Union Membership Really Reduce Job Satisfaction?
568 A. Bryson R. Gomez
Segmentation, Switching Costs and the Demand for Unionization in Britain
567 M. Gutiérrez-Domènech Employment After Motherhood: A European Comparison
566 T. Kirchmaier The Performance Effects of European Demergers
565 P. Lopez-Garcia Labour Market Performance and Start-Up Costs: OECD Evidence
564 A. Manning The Real Thin Theory: Monopsony in Modern Labour Markets
563 D. Quah Digital Goods and the New Economy
To order a discussion paper, please contact the Publications Unit
Tel 020 7955 7673 Fax 020 7955 7595 Email [email protected] Web site http://cep.lse.ac.uk


![001112ˇ˛˚˙2˝˙˜0’˘’˚˙ 01*+,-13] Lipsey,R.G.(1970), The theory of Customs Unions: A General Equilibrium ... UK joining the EEC: ... 239-266. [26] Viner, J. ...Authors:](https://img.dokumen.tips/doc/110x75/5b1c5d447f8b9a23258fd276/00111220-01-13-lipseyrg1970-the-theory-of-customs.jpg)