Embed Size (px)
Citation preview

DI
SC
US
SI
ON
P
AP
ER
S
ER
IE
S
Forschungsinstitut zur Zukunft der ArbeitInstitute for the Study of Labor
Why Don’t Women Patent?
IZA DP No. 6886
September 2012
Jennifer HuntJean-Philippe GarantHannah HermanDavid J. Munroe
Why Don’t Women Patent?
Jennifer Hunt Rutgers University,
NBER and IZA
Jean-Philippe Garant McGill University
Hannah Herman
McGill University
David J. Munroe Columbia University
Discussion Paper No. 6886 September 2012
IZA
P.O. Box 7240 53072 Bonn
Germany
Phone: +49-228-3894-0 Fax: +49-228-3894-180
E-mail: [email protected]
Any opinions expressed here are those of the author(s) and not those of IZA. Research published in this series may include views on policy, but the institute itself takes no institutional policy positions. The IZA research network is committed to the IZA Guiding Principles of Research Integrity. The Institute for the Study of Labor (IZA) in Bonn is a local and virtual international research center and a place of communication between science, politics and business. IZA is an independent nonprofit organization supported by Deutsche Post Foundation. The center is associated with the University of Bonn and offers a stimulating research environment through its international network, workshops and conferences, data service, project support, research visits and doctoral program. IZA engages in (i) original and internationally competitive research in all fields of labor economics, (ii) development of policy concepts, and (iii) dissemination of research results and concepts to the interested public. IZA Discussion Papers often represent preliminary work and are circulated to encourage discussion. Citation of such a paper should account for its provisional character. A revised version may be available directly from the author.

IZA Discussion Paper No. 6886 September 2012
ABSTRACT
Why Don’t Women Patent?* We investigate women’s underrepresentation among holders of commercialized patents: only 5.5% of holders of such patents are female. Using the National Survey of College Graduates 2003, we find only 7% of the gap in patenting rates is accounted for by women's lower probability of holding any science or engineering degree, because women with such a degree are scarcely more likely to patent than women without. Differences among those without a science or engineering degree account for 15%, while 78% is accounted for by differences among those with a science or engineering degree. For the latter group, we find that women’s underrepresentation in engineering and in jobs involving development and design explain much of the gap. JEL Classification: J16, O31 Keywords: patenting, gender Corresponding author: Jennifer Hunt Department of Economics Rutgers University New Jersey Hall 75 Hamilton Street New Brunswick, N.J. 08901-1248 USA E-mail: [email protected]
* We are grateful to Leah Brooks and Paula Stephan for comments. Hunt is grateful to the Social Science and Humanities Research Council of Canada for financial support and is also affiliated with the CEPR (London) and DIW (Berlin).

1 Introduction
The gender gap in patenting rates is much more pronounced than the gender gap in many
other endeavors: American women patent at only 8% of the male rate, according to the
National Survey of College Graduates 2003, while by comparison they earn 81% of male
full–time weekly earnings (U.S. Bureau of Labor Statistics 2011). Other sources confirm
the wide patenting gap. Only 10.3% of the 90,705 U.S. origin patents granted in 1998
are estimated by the United States Patent and Trademark Office (1999) to have had at
least one female inventor.1 Adjusting for co–authorship, Frietsch et al. (2009) estimate
that women accounted for 8.2% of patents filed by Americans at the European Patent
Office in 2005, a decrease from the 8.8% peak of 2001. The highest shares were for Spain
and France (12.3% and 10.2% respectively), while the lowest shares were for Austria and
Germany (3.2% and 4.7% respectively).2 The magnitude of the gender gap in patenting
raises the concern that, rather than reflecting comparative advantage or differing tastes
by gender, the gap reflects gender inequity and an inefficient use of female innovative
capacity.
Innovation, or equivalently, technological progress, is a driver of economic growth and
key to future prosperity: more than half of U.S. economic growth since the Second World
War is attributable to technogical progress (Boskin and Lau 2000). Clearly, growth will
be highest if the innovative capacity of the whole workforce is exploited, and doing so is
particularly important at a time of concern about growth and technological progress. By
referring to the 2007–2009 recession as a “Sputnik moment”, President Obama in 2010
called into doubt whether the United States was innovating at its full potential,3 while an
influential report by the National Academy of Sciences (2007) states “... the committee
is deeply concerned that the scientific and technological building blocks critical to our
1 The National Women’s Business Council (2012) estimates a share of 14% for 1998 ostensibly basedon the same data, rising to 18% in 2010, but neither the level nor trend of their aggregate patents grantedcorresponds to aggregate data published by the USPTO.
2 See also Ashcraft and Breitzman (2007).3 www.whitehouse.gov/blog/2010/12/06/president-obama-north-carolina-our-generation-s-sputnik-
moment-now, accessed 21 August 2012.
1
economic leadership are eroding...”. Among many other recommendations, the report
urges increasing the share of women in science and engineering.
Innovation is difficult to measure at the individual level, and scholars use patents as a
proxy. While not all innovations are patented, patenting is likely to be correlated with un-
patented innovation, including innovation embodied in tacit knowledge and disseminated
by inter–firm worker mobility. In this paper, we examine the reasons for women’s un-
derperformance in patenting using a representative sample of U.S. college graduates, the
2003 National Survey of College Graduates. While there have been earlier quantitative
studies of the question, they have been confined to samples of PhDs, generally academic
scientists and engineers.4 Such samples provide only limited information about patenting
generally, since our data show that PhDs hold only 29% of patents, and academics only
7% of patents. Furthermore, the gender patenting gap appears to be much smaller in
these samples than in the more general population we study in our paper. Although the
studies generally do not report the unadjusted gender gap, we estimate based on informa-
tion in the papers that women in these samples are between 40% and two–thirds as likely
to patent as men, compared with 8% for the college graduates we study. Most of the
gender patenting gap apparently arises because women do not get to the stage of being
in the samples of earlier studies.
The earlier studies do not report how much of the raw gap is explained by the co-
variates, but since our estimated raw gaps are similar to the reported conditional gaps,
the covariates apparently explain little.5 Nevertheless, these papers do identify signifi-
cant predictors of patenting (for both men and women). Patenting is higher in certain
fields, for researchers with more publications, more co–authors per publication, and with
company scientists as co–authors, for more experienced researchers and for researchers in
industry or at universities that are highly ranked and have more patents. Whittington
(2011) finds that female PhDs in academia do not enjoy the patenting bonus children
4 Ding et al. (2006), Thursby and Thursby (2005), Whittington (2011), Whittington and Smith–Doerr(2005, 2008). See also Stephan et al. (2010) for a general analysis of patenting by PhDs.
5 The exception is Whittington’s (2011) academic sample, for which covariates explain 42% of the rawgap by our calculations.
2
provide men, though their counterparts in industry do. Qualitative analysis, including
parts of the studies cited above and papers such as Murray and Graham (2007), highlight
that academic women failed to make early contacts in industry and then fell behind men
in developing the appropriate skills, that academic women have smaller networks with
fewer industrial contacts and are more concerned that commercial science hurts academic
advancement.
In our data, 7.5% of patents granted are granted to women (alternatively: women’s
patenting rate is 8% of men’s), while only 5.5% of patents commercialized or licensed,
presumably those more important for economic growth, are commercialized or licensed
by women. A natural first hypothesis for the difference in patenting rates is women’s
underrepresentation in science and engineering: while 33.1% of males in the sample have
a tertiary qualification in science or engineering, the figure is only 14.2% for women.
However, we find that the patenting rate of women with science or engineering degrees is
sufficiently low that increasing women’s representation in science and engineering would
have little effect absent other changes. For commercialized or licensed patents, only 7%
of the gender patenting rate gap is accounted for by the lower share of women with any
science or engineering degree, while 78% of the gap is explained by lower female patenting
among holders of a science or engineering degree. The remaining 15% of the gender gap is
explained by lower female patenting among those without a science or engineering degree.
For holders of science and engineering (S&E) degrees, two thirds of the gender patent-
ing rate gap reflects a gap in the probability of holding any commercialized patent. We
are able to explain 61% of this probability gap, with specific fields of study within S&E
accounting for 31% of the gap, and the degree to which respondents’ jobs involve partic-
ular tasks accounting for at least another 13%: women are underrepresented in electrical
and mechanical engineering, the most patent–intensive fields, and in development and
design, the most patent–intensive job tasks. Women’s education, in particular their lower
share of doctorates, accounts for another 10%. The gender gap in the number of commer-
cialized patents conditional on holding any has slightly different determinants. We are
able to explain almost half this gap, with job tasks, especially design and development,
3

explaining 40% of the gap.
The results make clear that the first steps towards increasing female patenting rates
must be to increase women’s representation in electrical and mechanical engineering,
relative to life sciences, and in jobs involving design and development. Whether this
will have the desired effect of increasing female patenting rates naturally depends upon
how the representation is increased. We discuss policies that will increase the average
quality of the elite doing innovative design and development by increasing the pool of
qualified women available at each step of the career path. These policies complement
those stemming from studies of the existing elite: any newcomers will still have to grapple
with the further gender issues identified by the existing literature. We stress that most
of the policies we mention have not been rigorously evaluated, we recommend the use of
randomized trials to do so, and we urge early intervention: women do not enter the career
paths that lead men to be granted many patents in middle age.
2 Data
We use individual–level data from the 2003 National Survey of College Graduates (NSCG),
collected by the U.S. Bureau of the Census under the auspices of the National Science
Foundation. The data may be downloaded at sestat.nsf.gov/datadownload. These data
are a stratified random sample of people reporting having a bachelor’s degree or higher
on the long form of the 2000 census. All respondents who had ever worked were asked
whether they had applied for a U.S. patent since October 1998, whether they had been
granted any U.S. patent since October 1998, and if so, how many, and how many had
been commercialized or licensed. The survey will not capture patents by those with less
than a college degree, but we assume that most patents are captured: education is not
recorded in patent filings, so there is no way of quantifying the missing patents.
We choose these data for their combination of patent information and a rich set of
variables describing respondents’ education and job, including job tasks, and because they
are representative of a population likely to include most inventors. The companion Survey
4

of Doctoral Recipients, the only other large–scale survey with patent information of which
we are aware, is more limited by design, while administrative patent records have almost
no information on the inventors and are not linked to other data sets.6 An additional
advantage of the data is that the information on the licensing or commercialization of the
patent can be used to identify patents more likely to contribute to economic growth. A
disadvantage of the data is that they are several years old: the 2003 wave is the most
recent available for the NSCG, while the next to be released will not contain patenting
information.
We count as holders of S&E degrees respondents with bachelor’s, master’s or doctoral
degrees in science (excluding social sciences) or in engineering, as well as those who
minored in science or engineering in college.7 We exclude from our sample respondents 65
or older (the youngest respondent is 24, but few are younger than 26) and respondents who
live outside the United States or in U.S. territories. The sample of potential patentors we
work with has 88,094 observations, representing 2070 patents granted and 1299 patents
commercialized or licensed. Because the data result from an oversample of scientists and
engineers, we use sample weights in all of our analysis to make it representative.
3 Method
We first perform a Oaxaca decomposition on the gender patenting rate gap so as to
highlight the importance of women’s lower representation among those with any degree
in science or engineering. If N is the number of patents and P (SE) is the probability of
having a degree in science or engineering, the expected number of patents for a person is
E(N) = P (SE)E(N |SE) + [1− P (SE)]E(N |non SE),
or, in terms of patents per person (the patenting rate) for a population,
N = P SNS + (1− P S)NO,
6 German administrative patent data are now linked to information on inventors, but the informationis much less rich than that in the NSCG. We are not aware of linked databases in other countries.
7 Three quarters of those who minored in S&E also majored in S&E, so including those with minorsexpands the sample only slightly.
5
where the bar denotes the average, the hat denotes the average conditioning on science
and engineering degree status, and O indexes non–S&E. The difference between male and
female patenting rates is therefore
Nm −N f = [P SmN
Sm + (1− P S
m)NOm]− [P S
f NSf + (1− P S
f )NOf ],
where m and f subscripts denote gender. This may be rewritten as
Nm −N f = (P Sm − P S
f )(NSf − NO
f ) + P Sm(NS
m − NSf ) + (1− P S
m)(NOm − NO
f ). (1)
The first term on the right hand side represents the share of the patenting rate gap due to
the gender gap in having a science or engineering degree; the second represents the share
due to the gender patenting rate gap among those with a science or engineering degree;
the third the share due to the gender patenting rate gap among those without a science
or engineering degree.8
The same equation may be used to decompose the gender gap in the probability of
patenting, P , by replacing N with P , the probability of patenting conditional on science
and engineering degree status, on the right hand side. The gender gap in the number
of patents conditional on having any patent, N , may be decomposed by replacing N
with˜N , the average number of patents conditional on having a patent and on science
and engineering degree status, and P S with P S, the probability of having a science or
engineering degree conditional on having a patent.
In the same spirit, we investigate the degree to which the gender patenting gap is
caused by the gender difference in the probability of having any patent, and the gender
difference in the number of patents conditional on having any. If N is the number of
patents, E(N) = P (Any patent) × E(N |Any patent), or N = PN , where the tilde
denotes the average conditioning on having a patent. The gender patenting rate gap is
8 The decomposition is sensitive to the choice of this variant rather than its dual. We consider thisone more appropriate in a context where the counterfactual of increasing the share of women in S&E isof interest: the additional women would presumably experience a patenting boost equal to the currentfemale S&E/non–S&E differential, so the weight on the S&E representation gap (the first component inequation 1) should be the female S&E/non–S&E patenting differential, not the male as in the dual.
6
therefore
Nm −N f = PmNm − PfNf .
This may be rewritten as
Nm −N f = Pm(Nm − Nf ) + Nf (Pm − Pf ), (2)
with the first term on the right hand side reflecting the share of the gap due to the gender
gap in the number of patents conditional on having any patent, and the second term
reflecting the gap in the probability of having any patent.
Having performed these decompositions, we run regressions on separate samples of
science and engineering degree holders and other degree holders, and we separately ex-
amine the probability of patenting and the number of patents conditional on having any,
as the determinants may differ. We focus on patents commercialized or licensed, given
their probable greater contribution to economic growth, but results for patents granted
are similar. For the full samples of all those who have ever worked, we report linear
probability coefficients (probit marginal effects are similar) from regressions of the form:
P (Any commercialized patent)i = α0 + α1Fi + α2Xi + εi, (3)
where the coefficient of interest is α1, the coefficient on the female dummy. For the samples
of commercialized or licensed patent holders (whom we sometimes refer to as inventors)
we report coefficients from least squares estimation of
log(Commercialized patents|any)i = β0 + β1Fi + β2Xi + νi, (4)
where β1 is the coefficient of interest. Finally, for the samples of patent holders (commer-
cialized or not), we report linear probability coefficients from regressions for the proba-
bility of commercializing a patent conditional on any patent being granted:
P (Patent commercialized|patent granted)i = γ0 + γ1Fi + γ2Xi + ηi. (5)
All regressions are weighted with the survey weights, and robust standard errors are
calculated in all cases. In all regressions, we gradually add covariates to assess how much
7
of the gender gap is due to gender differences in particular characteristics. The controls
include demographics, detailed fields of study, highest degree, employment and student
status, whether a bachelor’s degree level knowledge of science or engineering was necessary
for the job, the degree to which the work on the job is related to the field of highest degree,
and controls for whether at least 10% of time on the job is spent in activities we judged
likely to be associated with patenting: basic research, applied research, development,
design, computer tasks and management. Job–related covariates are interacted with a
dummy for employed.
4 Descriptive statistics
Table 1, based on samples where an observation is a patent, shows that 7.5% of patents
granted were reported by female inventors (column 1). This number is calculated in a way
comparable to the numbers of Frietsch et al. (2009), who adjust for co–authorship, and
indeed their 2005 female share for the United States is very similar at 8.2%. The smaller
share compared to the U.S. Patent and Trademark Office (1998) estimates of the share of
patents with at least one female inventor may indicate that women inventors file patents
with more co–inventors. Only 5.5% of commercialized or licensed patents, were reported
by female inventors (column 4). The lower figure for commercialized patents is due to the
fact that while overall 77% of patents granted were commercialized (column 1), only 62%
of patents granted to female inventors were commercialized (column 3), compared to 79%
for men (column 2).9 74% of patent holders hold S&E degrees (column 1), a share that is
slightly higher for women than men and lower among holders of commercialized patents,
especially men (68%, column 4).
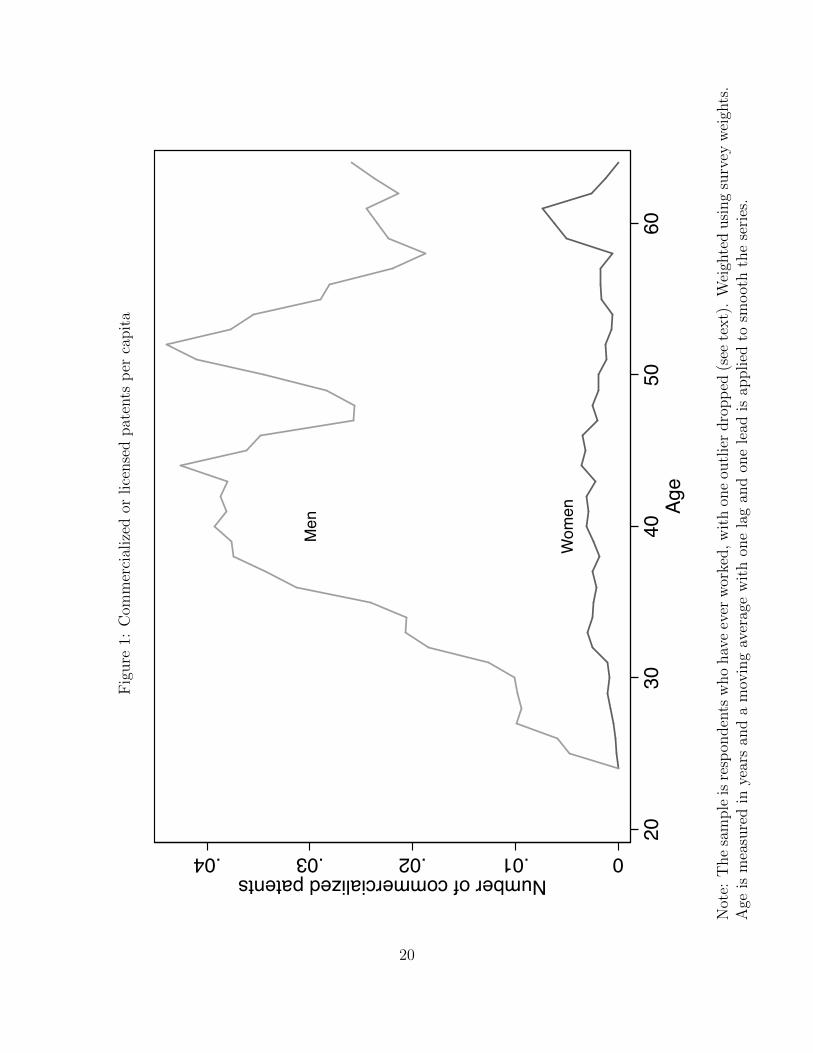
Based on the full sample of respondents (those who have ever worked), Figure 1 gives
a vivid illustration of the gender gap in the number of commercialized or licensed patents
per capita for men and women (the graph for patents granted is qualitatively similar).10
9 Cook and Kongcharoen (2010) study the gender gap in commercialization of patents.10 One outlier has been dropped. See below.
8

Male patents per capita peak in mid–career, while female patents per capita are uniformly
low and always below male levels. Over all ages, women patent at 8% of the male rate.
Using the same sample, Table 2 shows statistics split by gender and S&E degree status.
S&E degree holders patent more than others, and within both degree categories men
patent more than women. For example, 4.4% of men with S&E degrees report being
granted a patent, and 2.9% report commercializing a patent (column 2), compared to
1.0% and 0.6% respectively for women (column 3). The male–female disparity is larger for
the (unconditional) number of patents, indicating that male inventors have more patents
than female inventors.
In Table 3, we take a first step towards investigating the reasons for higher patenting
rates for men among S&E degree holders (panel A), and among non–S&E degree holders
(panel B), by showing the distribution of fields of study by gender and the patenting
intensity of each field. Columns 1 and 2 show the highest degrees of women with any S&E
degree are concentrated in the life sciences: 27% of their highest degrees are in this field,
compared to 14% for men. Consequently, women with S&E degrees are underrepresented
in most other S&E fields, with the largest gaps in the relatively large (for men) fields of
electrical and mechanical engineering.
The consequences of these different fields of study may be seen in columns 3–6: re-
spondents reporting a highest degree in life sciences report only 0.06 patents on average
(column 4), compared with 0.28 in electrical engineering, the most patent–intensive field,
and 0.18 in mechanical engineering. Women with S&E degrees are also slightly underrep-
resented in the other patent–intensive fields of physical sciences and chemical engineering.
The disparity between more female and more male fields is higher for commercialized or
licensed patents (columns 5 and 6), since, as column 7 shows, only 39% of patents granted
in life sciences are commercialized, compared to 62% in electrical engineering and mechan-
ical engineering.
The lower panel examines the sample of respondents with no degree in S&E. We follow
the NSF’s classification of “technology” fields (which include computer programming, as
distinct from computer science) as “S&E–related” rather than as S&E. For this sample,
9

the most common S&E–related fields other than technology are science education fields.
Women without an S&E degree are underrepresented in technology (compare columns 1
and 2), which not surprisingly is the most patent–intensive of these fields. However, with
only 0.04 patents granted per person (column 4), technology is not very patent intensive
compared to S&E fields, and it represents only a small fraction of non–S&E degrees.
Most technology patents are commercialized (67% in column 7), yet technology’s average
number of commercialized patents is only half the S&E average of 0.06 (column 6).
In Tables 4 and 5, we similarly examine a set of job characteristics, for those working
at the survey date. In Table 4, we consider the sample of respondents with an S&E degree.
The first panel shows that men and women are equally likely to have a job closely related
to the field of study of highest degree (columns 1 and 2), and that not surprisingly, those
working in jobs closely related to science and engineering study have more patents than
others (columns 3 and 4). Women are slightly more likely to be working in an unrelated
field, which should tend to reduce their patenting. The second panel shows that men are
much more likely to work in a job for which a knowledge of science and engineering at at
least a bachelor’s level is required: 72% of men do so, compared to 59% of women, and
there is a sharp divide in patenting between respondents who have jobs requiring such
knowledge (0.079 commercialized patents per person) and those who do not (0.009).
The third panel shows similar statistics according to whether respondents reported
spending at least 10% of their time on various tasks likely to be related to patenting.
Women are slightly underrepresented in basic and applied research, somewhat underrep-
resented in computer tasks, and very underrepresented in development and design, as well
as management. At the same time, there are large patenting disparities between those
that do and do not do applied research, development and design (columns 3 and 4).
Table 5 shows statistics for the sample of respondents without an S&E degree. The job
characteristics which are most closely associated with patenting and in which women are
most underrepresented are design and development, with a similar but much less marked
pattern in management. Appendix Tables 1 and 2 show means of other variables used in
estimation.
10

5 Results
We decompose the gender patenting gap before running regressions, focusing on commer-
cialized patents, to establish the determinants of the gender gap among those with S&E
degrees, and among those without. Finally, we estimate the probability of commercializing
a patent for those who have been granted a patent.
5.1 Decomposition results
Table 6 presents results based on the decomposition of equation (1). The means underlying
the decomposition are presented in Appendix Table 3. The first column shows that for
commercialized or licensed patents, 5.6% of the gender patenting rate gap is owing to the
smaller fraction of women with an S&E degree (14.2%, compared to 33.1% for men), 62%
is owing to a gender patenting rate gap among holders of an S&E degree, and 32% is
owing to a gender patenting rate gap among holders of other degrees.
This decomposition is heavily influenced by one observation, however: a male with a
degree in communications reporting having 70 commercialized patents, an outlier among
those without an S&E degree (the next highest tally is 15), and second most prolific
patenter in the sample. There does not seem to be an error: the respondent reports that
his work is unrelated to the field of his highest degree, that his main task is development,
and that his occupation is manager. Nevertheless, we feel more comfortable with the
decomposition dropping this observation, and this is reported in column 2. Now the
share of the gap within S&E degree holders dominates more clearly at 78%, compared to
7% due to the smaller fraction of women with an S&E degree, and 15% for the within
non–S&E component. Columns 3 and 4 shows the decompositions of the probability of
any patents and the number of patents per inventor are similar.
Simulations provide a different way of representing the components of the gender
patenting rate gap. If the share of women in S&E were increased to that of men, com-
mercialized or licensed patents per woman would rise by a factor of 1.9, holding constant
patenting rates within S&E. This would increase women’s share of commercialized patents
11
to 10.0%, rather than 5.5% as currently, increasing the number of commercialized patents
by 5.0%.11 On the other hand, if female commercialized patenting in S&E were instead
raised so as to eliminate the within–S&E patenting rate gap, patents per woman would
rise by a factor of 5.3, resulting in women contributing 23.5% of commercialized patents.
This would increase the number of commercialized patents by 23.6%.
It is useful in interpreting the regressions that follow to use equation (2) to assess
how much of the gender patenting rate gap in commercialized patents is due to a gap
in the probability of having any commercialized patent versus the gap in the number of
commercialized patents conditional on having any. For holders of S&E degrees, 66% is
attributable to the gap in the probability of patenting, and the figure of 63% for holders
of non–S&E degrees (without the outlier) is very similar.
5.2 Determinants of the probability of patenting
We now estimate the regressions of equation (3) to explain the gender gap in the prob-
ability of patenting, the more important component of the patenting gap. In Table 7
panel A, for S&E degree holders, we examine the probability of commercializing or licens-
ing a patent, beginning with only the female dummy in column 1: S&E women are 2.3
percentage points less likely to patent than S&E men. Adding dummies for race, ethnic-
ity and nativity in column 2 changes little, but adding 142 dummies for field of study of
highest degree and 29 dummies for field of study of bachelor’s degree in column 3 reduces
the coefficient to 1.5 percentage points, a decrease corresponding to 31% of the original
effect in column 1.
The covariates added in columns 4–8 cumulatively explain more of the gap, with
education controls explaining 10% of the gap (column 4), but the dummies for how closely
related one’s work is to one’s highest degree, and whether one needs knowledge of a science
or engineering bachelor’s degree for the job (column 8) having little effect. The effect of
the education controls reflects the lower share of women with doctoral degrees. Only
11 The outlier’s patents are included in this calculation.
12
when the dummies for whether at least 10% of the respondent’s time is spent in specific
tasks does the coefficient fall again appreciably: from 1.2 percentage points in column 8
to 0.9 percentage points in column 9, or 13% of the original gap. This is likely to be an
underestimate of the contribution of job tasks, since tasks are measured at the survey
date, while patents are measured over a five year window. Unreported regressions reveal
that while each task control individually reduces the gender gap, those with the strongest
effects are design and development. Unreported regressions also show that neither adding
a dummy for working at a university nor adding information about books and journal
articles published and major conferences attended has any effect on the female coefficient.
Altogether, the reported covariates explain 61% of the raw gender gap.
In panel B, we repeat the exercise for the sample of non–S&E degree holders. Women
are 0.32 percentage points less likely to commercialize a patent than men. Only the
controls for job tasks in column 8 make much of a difference to the coefficient, reducing
it from 0.25 to 0.21 percentage points, or 16% of the raw gender gap. Altogether, the
covariates explain only 34% of the raw gap.
5.3 Determinants of patents per inventor
We next turn to examining the number of commercialized patents, conditional on any
having been commercialized, and present results of estimating equation (4) for the S&E
sample in Table 8 panel A. Female inventors commercialize 17 log points fewer patents
than men (column 1), and controlling for detailed field of study in column 3 increases
the gap to 24 log points. Although this suggests women’s choice of field is beneficial to
patenting, the effect is outweighed by the opposite effect of field on the more important
gap in the probability of patenting at all (Table 7 panel A).
Controls for age (rather than years since highest degree) are important for the gap in
patents per inventor, reducing the conditional gender gap from 24 log points in column 5
to 18 log points in column 6, or by 29% of the raw gender gap. This is somewhat deceptive,
however, as Figure 1 shows that the return to age exists only for men. Job tasks are again
13

important in column 9, accounting for 40% of the raw gender gap. Unreported regressions
indicate that design tasks influence the gender gap the most, followed by development and
management. Basic research and computer tasks do not affect the gap. The covariates
together explain 49% of the raw gender gap.
In panel B, we examine the gender gap in the number of patents per inventor among
those without an S&E degree. We are unable to explain this gender gap, with most
covariates only deepening the puzzle. The raw gap is a large 37 log points, statistically
significant at the 10% level, while the conditional gap in column 8 is 61 log points, though
statistically insignificant. Only job tasks (column 8) make a non–trivial contribution to
understanding the raw gap, explaining 27% of it.
The panel B regressions are sensitive to the outlier mentioned above, so in panel C, we
present the coefficients from regressions on a sample with the outlier dropped. The raw
gap is smaller, at 21 log points (column 1), statistically significant at the 10% level. Fields
of study deepen the puzzle, while doing work requiring science or engineering knowledge
(column 7) and job tasks (column 8) appear to explain a lot of the gap, though the
estimates are very imprecise.
5.4 Determinants of the probability of commercializing a granted
patent
We have focused on commercialized or licensed patents, as these are likely to be those con-
tributing more to economic growth. Table 1 indicated that conditional on being granted
any patent, female inventors are less likely to commercialize a patent than male inven-
tors. We examine this conditional probability explicitly in Table 9, by estimating equation
(5). For S&E degree holders, in panel A, there is a 9.7 percentage point raw gender gap
(column 1), statistically significant at the 10% level, which may be compared with the
overall commercialization rate of 77%. 70% of this gap is explained by detailed field of
study (column 3); age and years since highest degree explain another 24% (column 6),
while other covariates either explain little or increase the puzzle. Together the covariates
14
explain 86% of the gap.
Due to the small sample size of only 202 patents, we are less successful in understanding
this outcome for those without an S&E degree (panel B). The raw gender gap is 8.8
percentage points, but it is statistically insignificant. The point estimates indicate that
most covariates deepen the puzzle, while job tasks make a large contribution to explaining
the raw gap, with an additional contribution of age and years since highest degree. The
column 9 point estimate is the same as in column 1.
6 Conclusions and policy recommendations
Women are much less likely to be granted a patent than men, and are somewhat less likely
to commercialize or license the patents they are granted. Because women with a degree in
S&E patent little more than other women, increasing the share of women in S&E would
not greatly increase female patenting rates, absent changes within S&E. Only 7% of the
gender gap in commercialized patents is owing to women’s underrepresentation in S&E,
compared to 78% owing to the patenting rate gap among holders of S&E degrees. Results
for all patents granted are similar.
The most important determinants of the gender patenting rate gap among S&E de-
gree holders are women’s underrepresentation in patent–intensive fields of study, espe-
cially electrical and mechanical engineering, and in patent–intensive job tasks, especially
development and design. Women’s lower share of doctoral degrees plays a minor role.
It is also useful to note factors found to be unimportant among S&E degree holders.
Conditional on age and years since highest degree, current employment status and years
since last employment do not affect the gender gap. Though women in the sample are
closely attached to the labor force, the effect of actual experience may be larger than cap-
tured by these measures anchored on the survey date. Other variables with little effect on
the conditional gender gap include the extent to which the respondent’s job is related to
the field of study of highest degree and whether the respondent’s job requires science or
engineering knowledge at the level of a bachelor’s degree or higher. This is despite a large
15
gender gap in the S&E knowledge requirement variable, and a large unconditional patent-
ing differential between respondents in jobs requiring and not requiring S&E knowledge:
these gaps reflect different choices of field of study.
There is little sign that large improvements in female patenting are likely to have
occurred since the time of the survey. Bachelor’s degrees in engineering awarded to
women rose by 29.7% between 1990 and 2000, but only by 10.2% between 2000 and 2010.
Some increase would be expected, given a rising population, so it is more significant
that though women’s share of bachelor’s degrees in engineering rose from 15.4% to 20.6%
between 1990 and 2000, it fell back to 18.2% by 2010.12 Consistent with this, Figure 1
gives no indication that younger cohorts of women were patenting more in 2003 and might
now have reached a middle age patenting peak like their male colleagues.13
The results point to the need to increase the share of women in engineering and in
jobs involving development and design, to complement policies stemming from papers
examining the smaller gender patenting rate gap existing among workers already in such
jobs. To increase female representation in engineering, policies should address high female
outflows from engineering as well as low female inflows into engineering: Hunt (2010)
demonstrated that women trained as engineers disproportionately leave engineering jobs
due to dissatisfaction with pay and promotion. To increase the share of women in design
and development tasks, Figure 1 suggests that policies should target young women: women
do not appear to get on the first step of escalator leading to large numbers of patents in
middle age, as their patents are well below men’s even at the youngest ages in the sample.
Small–scale remedies are already being applied by universities, companies, and pro-
fessional organizations, but they lack rigorous evaluation.14 Seeking to increase female
and minority enrollments in engineering, the National Science Foundation–supported 4∆
initiative focuses on outreach to girls and minority youth to stimulate their interest in
and better inform them about engineering. This collaboration of four engineering profes-
12 Statistics from www.nsf.gov/statistics/wmpd/sex.cfm .13 In principle, one cannot distinguish cohort, age and time effects from the graph, however.14 E.g. The MIT Women’s Initiative (web.mit.edu/wi/) and High–Tech High Heels (hightechhigh-
heels.org), the latter supported by Texas Instruments; accessed 20 August 2012.
16

sional societies stresses the need for assessment to establish best practices, yet evaluation
appears to consist of before and after comparison of participants.15
What is required are randomized trials of both outreach interventions and other poten-
tial remedies. A precedent has been established by the American Economic Association,
which has randomized and evaluated its mentoring program for women, with grants and
publications as the outcomes (Blau et al. 2010). In addition to these randomized trials,
there is a need for non–experimental research on gender and the choice of S&E college
majors to distinguish between science and engineering: Stinebrickner and Stinebrickner
(2011) study the decision to major in science and math in a liberal arts college where
engineering is not an option; Zafar (forthcoming) uses data from a university at which
engineering school students must declare their engineering major on entering college, and
therefore drops these students.
Successful policies are likely to include increasing high school girls’ awareness of engi-
neering as a viable career option and of the necessity of taking appropriate math in high
school, university reforms to the widespread requirement that students commit to engi-
neering before enrollment, and mentoring programs connecting design and development
engineers in industry with female engineering students or early–career female engineers.
The intriguing Mentoring Experiment might provide useful tools for matching mentors and
mentees.16 Aimed at information technology professionals using the SQL Server database,
it matches less experienced workers with volunteer mentors online, advertising in SQL
Server–related fora. Fewer obvious tools are available to combat any employer discrimi-
nation or incompatibility of work cultures that may play a role, though diversity training,
possibly evaluated with implicit bias tests (implicit.harvard.edu/implicit/demo/), is one
option.
15 outreach4change.org/index.php?option=com content&view=article&id=13&Itemid=16 andwww.nsf.gov/awardsearch/showAward.do?AwardNumber=0937306, accessed 20 August 2012.
16 thementoringexperiment.org, accessed 20 August 2012.
17

References
Ashcraft, Catherine and Anthony Breitzman. 2007. “Who Invents IT? An Analysis ofWomen’s Participation in Information Technology Patenting”. National Center forWomen and Information Technology.
Blau, Francine D., Janet M. Currie, Rachel T. A. Croson and Donna K. Ginther. 2010.“Can Mentoring Help Female Assistant Professors? Interim Results from a RandomizedTrial.” American Economic Review, 100 (2) 348–352.
Boskin, Michael J. and Lawrence J. Lau. 2000. “Generalized Solow Neutral TechnicalProgress and Postwar Economic Growth”. NBER Working Paper 8023.
Cook, Lisa and Chaleampong Kongcharoen. 2010. “The Idea Gap in Pink and Black”.NBER Working Paper 16,331.
Ding, Waverly W., Fiona Murray and Toby E. Stuart. 2006. “Gender Differences inPatenting in the Academic Life Sciences”. Science, 313 665–667.
Frietsch, Rainer, Inna Haller, Melanie Funken–Vrohlings, and Hariolf Grupp. 2009.“Gender–specific patterns in patenting and publishing”. Research Policy, 38 590–599.
Hunt, Jennifer. 2010. “Why Do Women Leave Science and Engineering?”. NBER WorkingPaper 15853.
Murray, Fiona and Leigh Graham. 2007. “Buying science and selling science: genderdifferences in the market for commercial science”. Industrial and Corporate Change, 16(4) 657–689.
National Academy of Sciences, National Academy of Engineering and Institute ofMedicine. 2007. Rising Above the Gathering Storm: Energizing and Employing Americafor a Brighter Future, Washington, D.C.: The National Academies Press.
National Women’s Business Council. 2012. “Intellectual Property and Women En-trepreneurs: Quantitative Analysis”. nwbc.gov/research/intelletual-property-women-entrepreneurs, accessed 19 August 2012.
Stephan, Paula, Gurmu Shiferaw, A.J. Sumell and Grant Black. 2010. “Who’s Patentingin the University? Evidence from the Survey of Doctorate Recipients”. Economics ofInnovation and New Technology, 19 (5) 481–503.
Stinebrickner, Todd and Ralph Stinebrickner. 2011. “Math or Science? Using Longitudi-nal Expectations Data to Examine the Process of Choosing a College Major”. Universityof Western Ontario working paper.
Thursby, Jerry G. and Marie C. Thursby. 2005. “Gender Patterns of Research and Li-censing Activity of Science and Engineering Faculty”. Journal of Technology Transfer,30 343–353.
18

U.S. Bureau of Labor Statistics. 2011. “Highlights of Womens Earnings in 2010”.www.bls.gov/cps/cpswom2010.pdf, accessed 22 August 2012.
U.S. Patent and Trademark Office. 1999. “Buttons to Biotech:1996 Update Report with supplemental data through 1998”.www.uspto.gov/web/offices/ac/ido/oeip/taf/wom 98.pdf, accessed August 20, 2012.
Whittington, Kjersten Bunker. 2011. “Mothers of Invention? Gender, Motherhood, andNew Dimensions of Productivity in the Science Profession”. Work and Occupations, 38(3) 417–456.
Whittington, Kjersten Bunker and Laurel Smith–Doerr. 2005. “Gender and CommercialScience: Women’s Patenting in the Life Sciences”. Journal of Technology Transfer, 30355–370.
Whittington, Kjersten Bunker and Laurel Smith–Doerr. 2008. “Women Inventors in Con-text: Disparities in Patenting Across Academia and Industry”. Gender and Society, 22194–218.
Zafar, Basit. Forthcoming. “College Major Choice and the Gender Gap”. Journal of Hu-man Resources.
19
Fig
ure
1:C
omm
erci
aliz
edor
lice
nse
dpat
ents
per
capit
a
Wom
en
Men
0.01.02.03.04Number of commercialized patents
2030
4050
60Ag
e
Not
e:T
he
sam
ple
isre
spon
den
tsw
ho
hav
eev
erw
orke
d,w
ith
one
outl
ier
dro
pp
ed(s
eete
xt)
.W
eigh
ted
usi
ng
surv
eyw
eigh
ts.
Age
ism
easu
red
inye
ars
and
am
ovin
gav
erag
ew
ith
one
lag
and
one
lead
isap
plied
tosm
oot
hth
ese
ries
.
20

Table 1: Statistics on sample of patents Patents granted Patents commercialized All Male
inventors Female
inventors All Male
inventors Female
inventors (1) (2) (3) (4) (5) (6) Female inventor 0.075 0 1 0.055 0 1 Commercialized 0.773 0.785 0.617 1 1 1 S&E degree holder 0.738 0.737 0.761 0.684 0.681 0.730
Observations 2070 1833 237 1299 1173 126
Note: Weighted using survey weights. An observation corresponds to a patent. S&E denotes science and engineering.

Table 2: Patenting rates by gender among holders of science and engineering degrees
Note: Weighted using survey weights. Samples are drawn from respondents who have ever worked. S&E denotes science and engineering.
All S&E degree holders Non-S&E degree holders
Male Female Male Female (1) (2) (3) (4) (5)
A. Patents granted Number 0.032 0.131 0.025 0.023 0.001 Any (%) 1.0 4.4 1.0 0.6 0.1 B. Patents commercialized Number 0.019 0.074 0.011 0.017 0.001 Any (%) 0.7 2.9 0.6 0.4 0.1
Observations 88,094 25,568 9607 23,754 29,165

Table 3: Respondent fields of study and associated patenting statistics
Highest degree Patents granted Patents commercialized Men
(%) Women
(%) Any (%)
Number Any (%)
Number As % patents granted
(1) (2) (3) (4) (5) (6) (7) A. S&E degree holders Computer Science 11.0 12.7 1.9 0.04 1.3 0.03 64.4 Mathematics 5.2 8.5 1.2 0.02 0.8 0.01 65.2 Life Sciences 14.2 26.5 2.2 0.06 1.1 0.02 39.3 Physical sciences 8.5 7.4 6.5 0.22 3.7 0.10 45.3 Civil engineering/ architecture 5.5 1.6 1.1 0.03 0.7 0.02 62.4
Electrical engineering 11.3 3.5 8.1 0.28 5.7 0.18 62.3 Chemical engineering 3.5 2.3 6.4 0.20 4.6 0.12 59.4 Mechanical/industrial engineering 13.8 4.0 6.2 0.18 4.2 0.11 61.7
S&E-related fields 10.1 15.0 1.2 0.03 0.7 0.01 42.6 Social sciences 1.8 2.7 2.1 0.03 1.5 0.02 71.9 Other non-S&E 15.2 15.9 2.1 0.06 1.5 0.03 56.0 All 100.0 100.0 3.4 0.10 2.2 0.06 55.4
Observations 24,575 10,600 35,175 --
B. Non S&E degree holders Technology 2.2 0.3 2.5 0.04 1.9 0.03 67.2 Other S&E-related 7.7 14.3 0.3 0.01 0.2 0.00 61.9 Social science 13.8 13.1 0.3 0.01 0.2 0.00 19.4 Other non-S&E 76.2 72.4 0.3 0.01 0.2 0.01 83.2 All 100.0 100.0 0.3 0.01 0.2 0.01 70.5
Observations 23,754 29,165 52,919 --
Note: Weighted using survey weights. Samples are drawn from respondents who have ever worked. Column 7 is based on the ratio of columns 6 and 4. S&E denotes science and engineering.
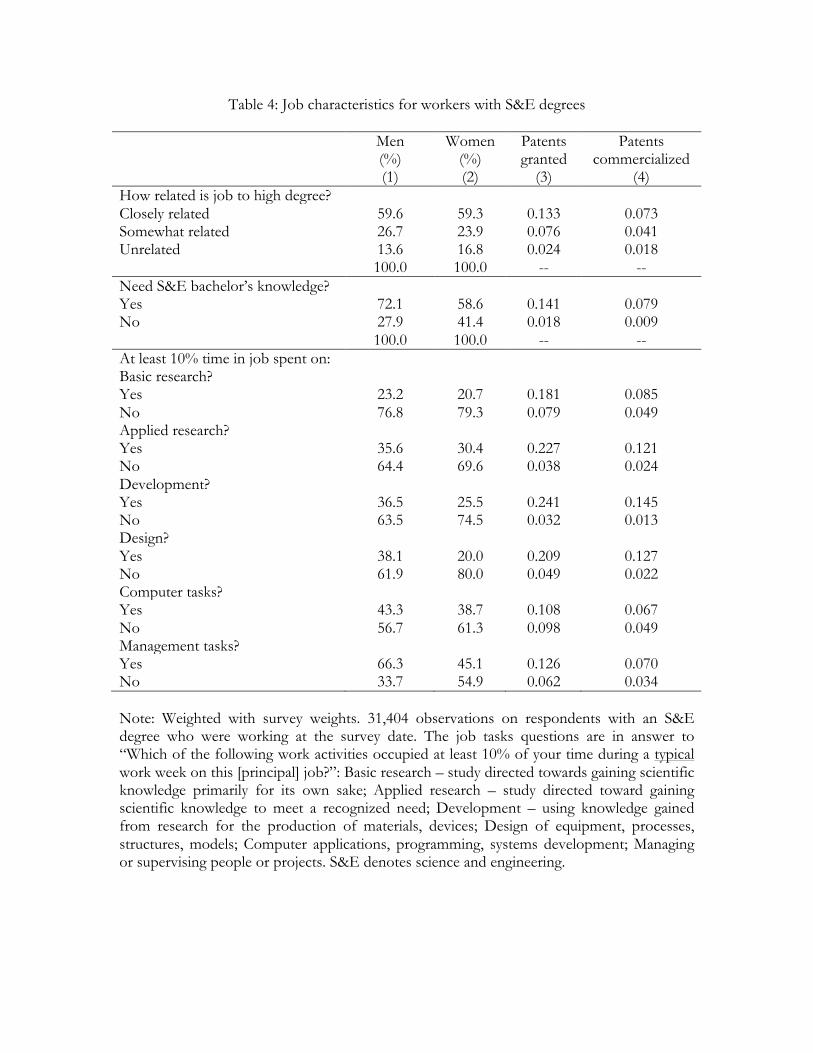
Table 4: Job characteristics for workers with S&E degrees
Men (%)
Women (%)
Patents granted
Patents commercialized
(1) (2) (3) (4) How related is job to high degree? Closely related 59.6 59.3 0.133 0.073 Somewhat related 26.7 23.9 0.076 0.041 Unrelated 13.6 16.8 0.024 0.018 100.0 100.0 -- -- Need S&E bachelor’s knowledge? Yes 72.1 58.6 0.141 0.079 No 27.9 41.4 0.018 0.009 100.0 100.0 -- -- At least 10% time in job spent on: Basic research? Yes 23.2 20.7 0.181 0.085 No 76.8 79.3 0.079 0.049 Applied research? Yes 35.6 30.4 0.227 0.121 No 64.4 69.6 0.038 0.024 Development? Yes 36.5 25.5 0.241 0.145 No 63.5 74.5 0.032 0.013 Design? Yes 38.1 20.0 0.209 0.127 No 61.9 80.0 0.049 0.022 Computer tasks? Yes 43.3 38.7 0.108 0.067 No 56.7 61.3 0.098 0.049 Management tasks? Yes 66.3 45.1 0.126 0.070 No 33.7 54.9 0.062 0.034 Note: Weighted with survey weights. 31,404 observations on respondents with an S&E degree who were working at the survey date. The job tasks questions are in answer to “Which of the following work activities occupied at least 10% of your time during a typical work week on this [principal] job?”: Basic research – study directed towards gaining scientific knowledge primarily for its own sake; Applied research – study directed toward gaining scientific knowledge to meet a recognized need; Development – using knowledge gained from research for the production of materials, devices; Design of equipment, processes, structures, models; Computer applications, programming, systems development; Managing or supervising people or projects. S&E denotes science and engineering.

Table 5: Job characteristics for workers with no S&E degree
Men Women Patents granted
Patents commercialized
(1) (2) (3) (4) Need S&E bachelor’s knowledge? Yes 18.0 14.3 0.015 0.010 No 82.0 85.7 0.012 0.009 At least 10% time in job spent on: Basic research? Yes 15.8 13.1 0.008 0.004 No 84.2 86.9 0.013 0.010 Applied research? Yes 20.0 19.0 0.016 0.010 No 80.0 81.0 0.012 0.009 Development? Yes 23.8 20.2 0.043 0.037 No 76.2 79.8 0.004 0.001 Design? Yes 18.0 11.1 0.066 0.057 No 82.0 88.9 0.003 0.001 Computer tasks? Yes 29.7 26.8 0.011 0.007 No 70.3 73.2 0.013 0.010 Management tasks? Yes 65.3 53.1 0.017 0.015 No 34.7 47.9 0.006 0.001 Note: Weighted with survey weights. 45,508 observations on respondents without an S&E degree who were working at the survey date. See Table 4 for the exact questions about job tasks. S&E denotes science and engineering.
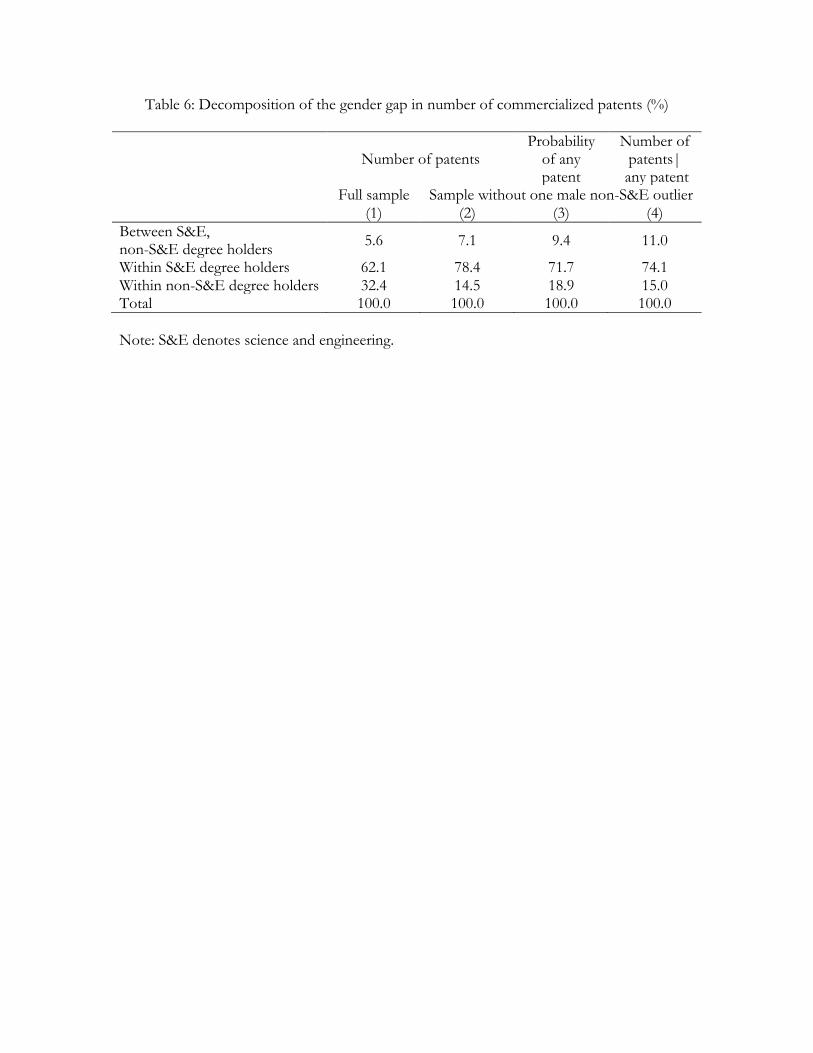
Table 6: Decomposition of the gender gap in number of commercialized patents (%)
Number of patents Probability
of any patent
Number of patents|
any patent Full sample Sample without one male non-S&E outlier (1) (2) (3) (4) Between S&E, non-S&E degree holders 5.6 7.1 9.4 11.0
Within S&E degree holders 62.1 78.4 71.7 74.1 Within non-S&E degree holders 32.4 14.5 18.9 15.0 Total 100.0 100.0 100.0 100.0 Note: S&E denotes science and engineering.

Table 7: Probability of commercializing or licensing a patent
(1) (2) (3) (4) (5) (6) (7) (8) (9)
A. S&E degree holders
Female -0.0230*** (0.0014)
-0.0224*** (0.0014)
-0.0152*** (0.0015)
-0.0130*** (0.0015)
-0.0131*** (0.0015)
-0.0129*** (0.0015)
-0.0126*** (0.0016)
-0.0120*** (0.0015)
-0.0089*** (0.0015)
R2 0.01 0.01 0.03 0.04 0.04 0.04 0.04 0.04 0.05 B. Non S&E degree holders
Female -0.0032*** (0.0005)
-0.0031*** (0.0005)
-0.0029*** (0.0005)
-0.0028*** (0.0005) -- -0.0028***
(0.0005) -0.0027*** (0.0005)
-0.0025*** (0.0005)
-0.0021*** (0.0005)
R2 0.00 0.00 0.01 0.01 -- 0.01 0.01 0.01 0.01 Race, ethnicity, immigrant -- Yes Yes Yes Yes Yes Yes Yes Yes Fields of study -- -- Yes Yes Yes Yes Yes Yes Yes Highest degree -- -- -- Yes Yes Yes Yes Yes Yes Level of S&E degree -- -- -- -- Panel A Panel A Panel A Panel A Panel A Potential experience -- -- -- -- -- Yes Yes Yes Yes Labor force status -- -- -- -- -- -- Yes Yes Yes Need S&E knowledge, study/job relatedness
-- -- -- -- -- -- -- Yes Yes Job tasks -- -- -- -- -- -- -- -- Yes
Note: Coefficients from least squares regressions weighted with survey weights; robust standard errors. The panel A sample has 35,175 observations, the panel B sample 52,919. Race and ethnicity controls are dummies for Asian, black non-Hispanic, Hispanic any race and mixed race non-Hispanic. Immigrant controls are dummies for born abroad non-citizen, born abroad as U.S. citizen, born in U.S. territories. Fields of study controls are 142 (83 in panel B) dummies for field of study of highest degree, and 29 (14 in panel B) dummies for field of study of bachelor’s degree. Highest degree controls are dummies for master’s, doctoral and professional degrees. Level of S&E degree comprises four dummies for bachelor’s, master’s, doctoral and minor degrees in science or engineering. Potential experience is controlled with six age dummies and five dummies for years since highest degree. Labor force status comprises a dummy for employed, the number of years since last employment interacted with employment, and dummies for fulltime master’s student, fulltime doctoral student, and other student. Need S&E knowledge is a dummy for whether the respondent reported that bachelor’s degree level knowledge of science or engineering was necessary for the job. Study/job relatedness controls are two dummies for the current job is closely or fairly closely related to the field of study of highest degree. Jobs tasks are dummies for whether the respondent spends more than 10% of work time on basic research, applied research, development, design, computer tasks or management. Job covariates are interacted with an employment dummy. S&E denotes science and engineering. *** p<0.01, ** p<0.05, * p<0.1

Table 8: Determinants of number of commercialized patents, conditional on holding a commercialized patent
(1) (2) (3) (4) (5) (6) (7) (8) (9)
A. S&E degree holders
Female -0.174** (0.078)
-0.177** (0.079)
-0.239** (0.083)
-0.228** (0.084)
-0.236** (0.086)
-0.185** (0.089)
-0.167* (0.088)
-0.165* (0.088)
-0.095 (0.090)
R2 0.01 0.03 0.13 0.13 0.14 0.18 0.19 0.20 0.24 B. Non S&E degree holders
Female -0.365* (0.196)
-0.388* (0.209)
-0.376* (0.191)
-0.382* (0.201) -- -0.592*
(0.346) -0.635 (0.415)
-0.710 (0.496)
-0.611 (0.486)
R2 0.02 0.04 0.70 0.70 -- 0.81 0.83 0.83 0.84 C. Non S&E degree holders, outlier dropped
Female -0.205* (0.120)
-0.224* (0.130)
-0.376* (0.192)
-0.382* (0.202) -- -0.387
(0.245) -0.370 (0.276)
-0.290 (0.304)
-0.120 (0.336)
R2 0.02 0.04 0.46 0.46 -- 0.68 0.69 0.70 0.75 Race, ethnicity, immigrant -- Yes Yes Yes Yes Yes Yes Yes Yes Fields of study -- -- Yes Yes Yes Yes Yes Yes Yes Highest degree -- -- -- Yes Yes Yes Yes Yes Yes Level of S&E degree -- -- -- -- Panel A Panel A Panel A Panel A Panel A Potential experience -- -- -- -- -- Yes Yes Yes Yes Labor force status -- -- -- -- -- -- Yes Yes Yes Need S&E knowledge, study/job relatedness -- -- -- -- -- -- -- Yes Yes
Job tasks -- -- -- -- -- -- -- -- Yes Note: The dependent variable is the log of the number of licensed or commercialized patents. Coefficients from least squares regressions weighted with survey weights; robust standard errors. Each coefficient is from a different regression. The sample size in panel A is 1166 observations, in panel B is 133, in panel C is 132. In panel A, 85 fields of study of highest degree and 28 fields of study of bachelor’s degree are represented in the sample; in panel B 46 fields of study of highest degree and 14 fields of study of bachelor’s degree are represented in the sample; otherwise the covariates are described in the notes to Table 7. S&E denotes science and engineering. *** p<0.01, ** p<0.05, * p<0.1

Table 9: Probability of commercializing a patent, conditional on having been granted a patent
(1) (2) (3) (4) (5) (6) (7) (8) (9)
A. S&E degree holders
Female -0.097* (0.049)
-0.092* (0.050)
-0.024 (0.047)
-0.031 (0.047)
-0.031 (0.047)
-0.008 (0.046)
-0.004 (0.046)
-0.005 (0.046)
-0.014 (0.047)
R2 0.01 0.01 0.12 0.13 0.13 0.16 0.16 0.17 0.18 B. Non S&E degree holders
Female -0.088 (0.151)
-0.070 (0.156)
-0.184 (0.149)
-0.191 (0.168) -- -0.195
(0.170) -0.155 (0.196)
-0.192 (0.191)
-0.084 (0.129)
R2 0.00 0.07 0.51 0.54 -- 0.65 0.66 0.69 0.74 Race, ethnicity, immigrant -- Yes Yes Yes Yes Yes Yes Yes Yes Fields of study -- -- Yes Yes Yes Yes Yes Yes Yes Highest degree -- -- -- Yes Yes Yes Yes Yes Yes Level of S&E degree -- -- -- -- Panel A Panel A Panel A Panel A Panel A Potential experience -- -- -- -- -- Yes Yes Yes Yes Labor force status -- -- -- -- -- -- Yes Yes Yes Need S&E knowledge, study/job relatedness -- -- -- -- -- -- -- Yes Yes
Job tasks -- -- -- -- -- -- -- -- Yes Note: Coefficients from least squares regressions weighted with survey weights; robust standard errors. The sample comprises respondents with a science or engineering degree who had been granted one or more patents. Panel A 1868 observations, panel B 202. In panel A, 84 fields of study of highest degree and 29 fields of study of bachelor’s degree are represented in the sample; in panel B, 55 fields of study of highest degree and 14 fields of study of bachelor’s degree are represented in the sample; otherwise the covariates are described in the notes to Table 7. S&E denotes science and engineering. *** p<0.01, ** p<0.05, * p<0.1

Appendix Table 1: Weighted means of full samples
S&E degree holders Non-S&E degree holders Men Women Men Women Asian, non-Hispanic 0.12 0.14 0.04 0.05 Black, non-Hispanic 0.04 0.07 0.06 0.08 Hispanic, any race 0.04 0.05 0.04 0.04 Mixed race, non-Hispanic 0.01 0.01 0.01 0.01 Foreign born 0.20 0.21 0.08 0.09 American born abroad 0.01 0.01 0.01 0.01 Born U.S. territories 0.00 0.00 0.00 0.00 Bachelor’s highest degree 0.55 0.56 0.68 0.67 Master’s highest degree 0.29 0.29 0.22 0.28 Doctorate highest degree 0.08 0.06 0.03 0.02 Professional highest degree 0.08 0.09 0.07 0.03 College minor in S&E? 0.18 0.22 -- -- Bachelor’s in S&E? 0.89 0.83 -- -- Master’s in S&E? 0.22 0.18 -- -- Doctorate in S&E? 0.07 0.05 -- -- Age 44.8
(10.0) 41.8 (9.7)
45.1 (10.1)
43.7 (10.0)
Years since highest degree 17.5 (10.3)
14.8 (9.8)
18.3 (10.2)
16.4 (10.0)
Student MA full time 0.01 0.01 0.01 0.01 Student PhD full time 0.01 0.01 0.00 0.00 Other student 0.05 0.01 0.04 0.06 Employed 0.91 0.82 0.91 0.80 Years since last worked × not employed
0.24 (1.47)
0.91 (3.37)
0.26 (1.60)
1.03 (3.51)
Observations 25,568 9607 23,754 29,165
Note: Weighted using survey weights. Standard deviations in parentheses. Samples are drawn from respondents who have ever worked. S&E denotes science and engineering.

Appendix Table 2: Weighted means of samples of inventors of commercialized patents S&E degree holders Non-S&E degree holders Men Women Men (a) Men (b) Women Patents commercialized 2.6
(3.5) 1.8
(1.5) 4.7
(13.8) 1.9
(2.1) 1.2
(0.4) Patents granted 3.5
(5.0) 2.7
(3.2) 5.0
(13.9) 2.2
(2.9) 1.5
(0.6) Patents commercialized 1 0.52 0.60 0.61 0.64 0.76 2 0.20 0.19 0.20 0.20 0.24 3-10 0.25 0.21 0.13 0.14 0 More than 10 0.02 0 0.06 0.02 0 Asian, non-Hispanic 0.14 0.20 0.07 0.07 0.00 Black, non-Hispanic 0.01 0.01 0.02 0.03 0.05 Hispanic, any race 0.01 0.06 0.03 0.03 0.01 Mixed race, non-Hispanic 0.01 0.05 0.02 0.02 0.11 Foreign born 0.24 0.30 0.12 0.13 0.07 American born abroad 0.02 0.01 0.02 0.02 0.00 Born U.S. territories 0.00 0.00 0.00 0.00 0.00 Bachelor’s highest degree 0.42 0.30 0.77 0.76 0.59 Master’s highest degree 0.32 0.43 0.17 0.17 0.23 Doctorate highest degree 0.24 0.26 0.04 0.04 0.10 Professional highest degree 0.03 0.01 0.03 0.03 0.09 College minor in S&E? 0.78 0.23 -- -- -- Bachelor’s in S&E? 0.96 0.87 -- -- -- Master’s in S&E? 0.37 0.48 -- -- -- Doctorate in S&E? 0.23 0.24 -- -- -- Age 45.5
(9.01) 43.5 (9.4)
44.9 (8.3)
44.9 (8.4)
43.4 (9.6)
Years since highest degree 17.6 (9.6)
15.1 (9.4)
19.6 (8.6)
19.6 (8.7)
14.2 (9.1)
Student MA full time 0.00 0.00 0.02 0.02 0.01 Student PhD full time 0.00 0.01 0.00 0.00 0.00 Other student 0.03 0.05 0.04 0.05 0.12 Employed 0.92 0.88 0.98 0.98 0.72 Years since last worked × not employed
0.13 (0.73)
0.24 (0.92)
0.01 (0.12)
0.01 (0.13)
0.18 (0.63)
Observations 1059 107 114 113 19 Note: Weighted using survey weights. Standard deviations in parentheses. Samples are for respondents who hold commercialized patents. A high outlier in terms of number of commercialized or licensed patents has been dropped from the fourth column of numbers: Men (b). S&E denotes science and engineering.

Appendix Table 3: Means used for decomposition of Table 6 All S&E degree Non-S&E degree Men Women Men Women Men Women A. Full samples 𝑁 Number of patents 0.036 0.002 0.074 0.011 0.017 0.001 P Probability of patenting 0.012 0.001 0.029 0.006 0.004 0.001 𝑁 Number of patents | any patent 3.01 1.62 2.58 1.82 4.68 1.24 PS Probability of S&E degree 0.331 0.142 1 1 0 0 B. Dropping one male non S&E outlier
𝑁 Number of patents 0.029 -- -- -- 0.007 -- P Probability of patenting 0.012 -- -- -- 0.003 -- 𝑁 Number of patents | any patent 2.43 -- -- -- 1.86 -- PS Probability of S&E degree 0.331 -- -- -- 0 -- Note: Mean weighted with survey weights. “Patents” refers to patents commercialized or licensed. The number of observations is different in each cell, and is one smaller in each cell in panel B compared to the corresponding cell in panel A. S&E denotes science and engineering.


![uky; h; f'A{A.A o la'Aks/Au] - Maharashtra · DMER MAHICTICH lapky ekfgr A ADHIKAR uky; hpk 2013]oS|d vf/Ad 17 c h; f' kj vf kchof A{A.A /Afu; jy e o la' e 2 kfgrh Aks/Au] 005 v 1](https://img.dokumen.tips/doc/110x75/600895306cd6be1a60096217/uky-h-faaa-o-laaksau-maharashtra-dmer-mahictich-lapky-ekfgr-a-adhikar.jpg)