Embed Size (px)
Citation preview

Why do Mexicans prefer informal jobs?Eliud Diaz Romo, Durham University
8 of July, 2015
2
› Understanding informal labour in Mexico
› Methodology
› Data
› Estimations
Why do Mexicans prefer informal jobs?
Tít
ulo
de la
sec
ción

3
› Understanding informal labour in Mexico
› Methodology
› Data
› Estimations
Why do Mexicans prefer informal jobs?
Tít
ulo
de la
sec
ción
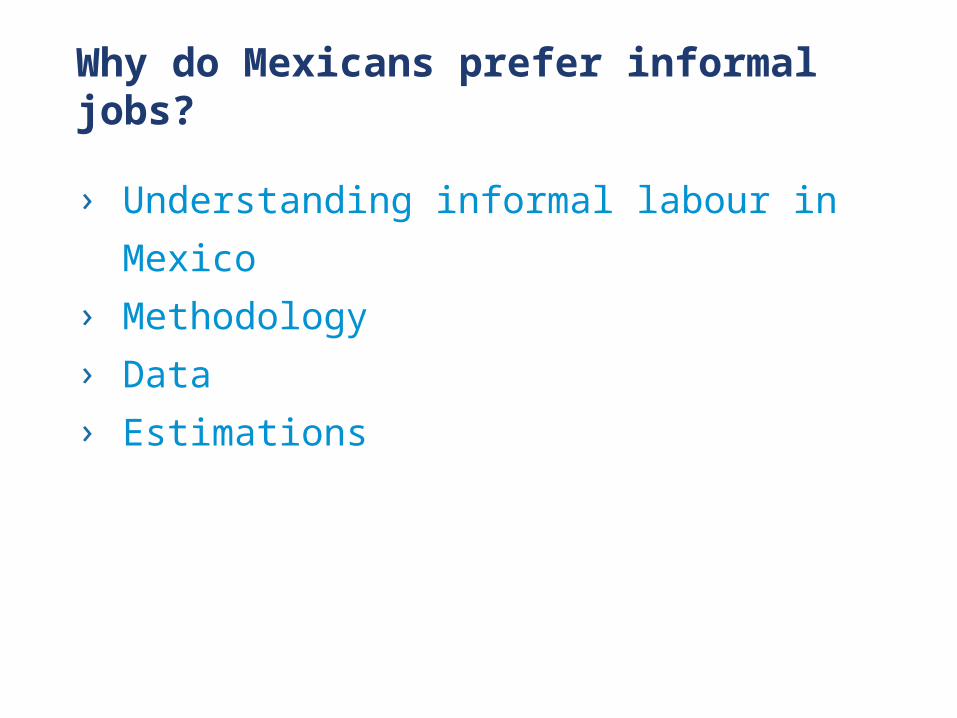
Informal workers57.0%
Formal workers38.0%
Unemployed5.1%
Notes:1. The Economically Active Population refers to individuals that are working or looking for a job: It was
estimated to be 52.2 million people in 20122. According to the ILO (International Labour Organization), decent work refers to that productive work
that generates appropriate income, offers adequate social protection and in which human rights are safeguarded.
Numbers are rounded
In Mexico almost 60% of the working population choose to work informally
Working force in 2012Percentage of individuals
Decent work conditions2 Productivity
Wage differentialsTax Collection
Why does informality bother?

Informal workers57.0%
Formal workers38.0%
Unemployed5.1%
Half of the informal workers are employed in the “formal sector”
Working Force in 2012Percentage of individuals
Informal businesses
27.7%
Formal businesses
29.3%
Informal workers
57.0%
•Appears not to be an appropriate regulation
•The percentages seem not to change across time. In 2005 the percentages were similar:
– 3.8% for unemployed– 38.4% for formal workers– 30.9% for informal workers in
formal businesses– 27.0% for informal workers in
informal businesses
•It looks like there are not clear incentives to become formal

Why do Mexicans prefer informal jobs?
7
Identify the determinant variables or conditions that
make individuals more likely to work in the informal
market instead of the formal in Mexico
Main research objective
Tít
ulo
de la
sec
ción

9
Formal work
38%
Informal work in a
formal firm
29%
Unemployed
5%
Informal work in an
informal firm
28%
Título de la sección
Are the individuals free to choose where they want to work?
Notes: The percentages are calculated with information from the Mexican National Survey of Employment 2012, 3rd trimester
Determinant factors:
• Demographic variables:– Years old– Marital status– Characteristics of the family
members• Education degrees • Geographic patterns • Male-female
differentiation• Sector of employment• Interactions between
variables

10
› Understanding informal labour in Mexico
› Methodology
› Data
› Estimations
Why do Mexicans prefer informal jobs?
Tít
ulo
de la
sec
ción
11
Multinomial models appear to be the best option
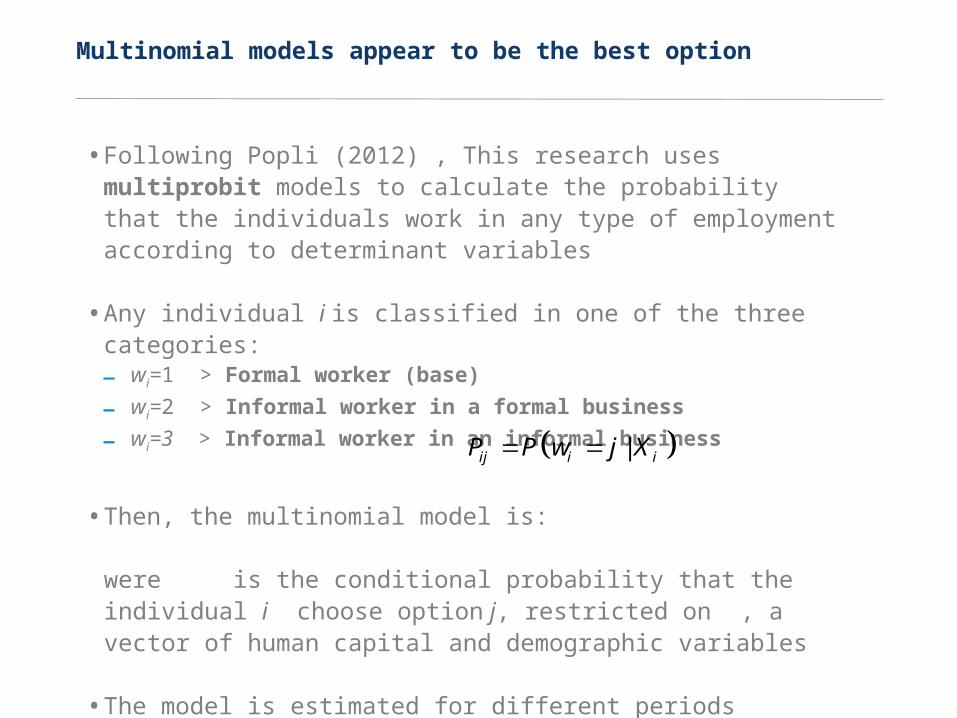
• Following Popli (2012) , This research uses multiprobit models to calculate the probability that the individuals work in any type of employment according to determinant variables
• Any individual i is classified in one of the three categories: – wi=1 > Formal worker (base)
– wi=2 > Informal worker in a formal business
– wi=3 > Informal worker in an informal business
• Then, the multinomial model is:
were is the conditional probability that the individual i choose option j, restricted on , a vector of human capital and demographic variables
• The model is estimated for different periods between 2005 to 2012 by gender to capture differences across time and discrimination effects
|ij i iP P w j X

12
› Understanding informal labour in Mexico
› Methodology
› Data
› Estimations
Why do Mexicans prefer informal jobs?
Tít
ulo
de la
sec
ción

13Notes:1. ENOE refers to the acronym in Spanish: Encuesta Nacional de Ocupaci’on y Empleo
The Mexican National Survey of Employment (ENOE1) offers valuable and trustable information
• Quarterly basis survey with information since 2005 until today.
• 120,000 families are surveyed each term. This is more than 400,000 individuals
• Provides detailed information of the surveyed individuals, allowing the analysis of demographic characteristics and working conditions
• ENOE includes a clear defined methodology to identify informal jobs and informal business using the standards of the ILO (International Labour Organization)
• The information is statistically representative for the whole country, all the 32 federal states and 43 cities
14
› Understanding informal labour in Mexico
› Estimated models
› Data
› Estimations
Why do Mexicans prefer informal jobs?
Tít
ulo
de la
sec
ción

15
Independent variables
Variable description
Group VariableMean for
MalesMean for Females
Years old 14 to 17 0.05 0.0318 to 21 0.09 0.0922 to 25 0.10 0.1026 to 35 0.23 0.2536 to 49 (base) 0.29 0.3350 to 59 0.14 0.1460 or older 0.09 0.07
Education Illiterate 0.03 0.04Basic literate 0.01 0.01Primary School (base) 0.25 0.21Middle School 0.30 0.26High School 0.18 0.17Technical Degree 0.03 0.08Normal School 0.01 0.02Undergraduate Degree 0.16 0.18Postgraduate 0.01 0.02
Group VariableMean for
MalesMean for Females
Married 0.49 0.38Free union 0.17 0.12Head of the family 0.62 0.22Houseworkers 0.05 0.06Other family member with informal job
0.50 0.56
Main income of the family 0.50 0.46
Services (base) 0.39 0.55Construction 0.12 0.01Agriculture and not specified 0.16 0.04Manufacture 0.15 0.14Comerce 0.16 0.26Other sectors 0.02 0.001st quarter of expected wage 0.40 0.414th quarter of expected wage 0.47 0.43Student 0.07 0.08Monterrey 0.04 0.04North frontier states 0.15 0.14Guadalajara 0.03 0.04Mexico 0.17 0.19Local employee 0.20 0.22
Job preferences indicators
Economic sector of Employment
Labour conditions of the family
Demographic variables
Geographic indicators
North frontier states 0.15 0.14Guadalajara 0.03 0.04Mexico 0.17 0.19
Geographic indicators

17
Formal jobs (base)
Informal jobs in formal business
Informal jobs in informal business
Formal jobs (base)
Informal jobs in formal business
Informal jobs in informal business
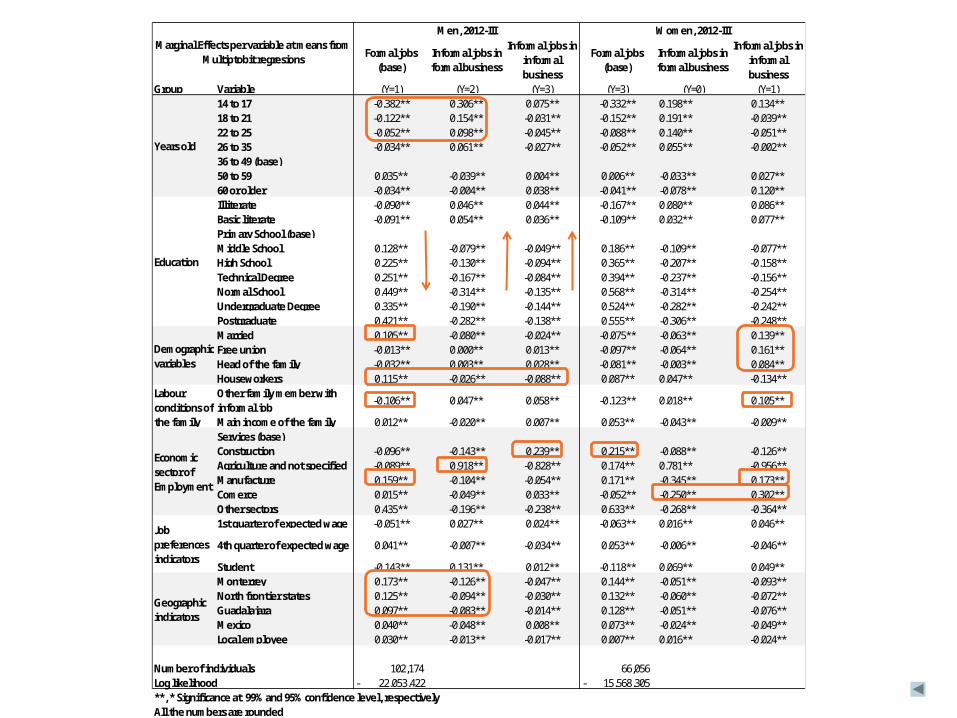
Group Variable (Y=1) (Y=2) (Y=3) (Y=3) (Y=0) (Y=1)14 to 17 -0.382** 0.306** 0.075** -0.332** 0.198** 0.134**18 to 21 -0.122** 0.154** -0.031** -0.152** 0.191** -0.039**22 to 25 -0.052** 0.098** -0.045** -0.088** 0.140** -0.051**26 to 35 -0.034** 0.061** -0.027** -0.052** 0.055** -0.002**36 to 49 (base) 50 to 59 0.035** -0.039** 0.004** 0.006** -0.033** 0.027**60 or older -0.034** -0.004** 0.038** -0.041** -0.078** 0.120**Illiterate -0.090** 0.046** 0.044** -0.167** 0.080** 0.086**Basic literate -0.091** 0.054** 0.036** -0.109** 0.032** 0.077**Primary School (base) Middle School 0.128** -0.079** -0.049** 0.186** -0.109** -0.077**High School 0.225** -0.130** -0.094** 0.365** -0.207** -0.158**Technical Degree 0.251** -0.167** -0.084** 0.394** -0.237** -0.156**Normal School 0.449** -0.314** -0.135** 0.568** -0.314** -0.254**Undergraduate Degree 0.335** -0.190** -0.144** 0.524** -0.282** -0.242**Postgraduate 0.421** -0.282** -0.138** 0.555** -0.306** -0.248**Married 0.105** -0.080** -0.024** -0.075** -0.063** 0.139**Free union -0.013** 0.000** 0.013** -0.097** -0.064** 0.161**Head of the family -0.032** 0.003** 0.028** -0.081** -0.003** 0.084**Houseworkers 0.115** -0.026** -0.088** 0.087** 0.047** -0.134**Other family member with informal job
-0.106** 0.047** 0.058** -0.123** 0.018** 0.105**
Main income of the family 0.012** -0.020** 0.007** 0.053** -0.043** -0.009**Services (base) Construction -0.096** -0.143** 0.239** 0.215** -0.088** -0.126**Agriculture and not specified -0.089** 0.918** -0.828** 0.174** 0.781** -0.956**Manufacture 0.159** -0.104** -0.054** 0.171** -0.345** 0.173**Comerce 0.015** -0.049** 0.033** -0.052** -0.250** 0.302**Other sectors 0.435** -0.196** -0.238** 0.633** -0.268** -0.364**1st quarter of expected wage -0.051** 0.027** 0.024** -0.063** 0.016** 0.046**
4th quarter of expected wage 0.041** -0.007** -0.034** 0.053** -0.006** -0.046**
Student -0.143** 0.131** 0.012** -0.118** 0.069** 0.049**Monterrey 0.173** -0.126** -0.047** 0.144** -0.051** -0.093**North frontier states 0.125** -0.094** -0.030** 0.132** -0.060** -0.072**Guadalajara 0.097** -0.083** -0.014** 0.128** -0.051** -0.076**Mexico 0.040** -0.048** 0.008** 0.073** -0.024** -0.049**Local employee 0.030** -0.013** -0.017** 0.007** 0.016** -0.024**
Number of individuals 102,174 66,056 Log likelihood - 22,053,422 15,568,305- **, * Significance at 99% and 95% confidence level, respectivelyAll the numbers are rounded
Men, 2012-III Women, 2012-III
Years old
Education
Demographic variables
Labour conditions of the family
Economic sector of Employment
Job preferences indicators
Geographic indicators
Marginal Effects per variable at means from Multiptobit regresions
18
Formal jobs (base)
Informal jobs in formal business
Informal jobs in informal business
Formal jobs (base)
Informal jobs in formal business
Informal jobs in informal business
Group Variable (Y=1) (Y=2) (Y=3) (Y=3) (Y=0) (Y=1)14 to 17 -0.382** 0.306** 0.075** -0.332** 0.198** 0.134**18 to 21 -0.122** 0.154** -0.031** -0.152** 0.191** -0.039**22 to 25 -0.052** 0.098** -0.045** -0.088** 0.140** -0.051**26 to 35 -0.034** 0.061** -0.027** -0.052** 0.055** -0.002**36 to 49 (base) 50 to 59 0.035** -0.039** 0.004** 0.006** -0.033** 0.027**60 or older -0.034** -0.004** 0.038** -0.041** -0.078** 0.120**Illiterate -0.090** 0.046** 0.044** -0.167** 0.080** 0.086**Basic literate -0.091** 0.054** 0.036** -0.109** 0.032** 0.077**Primary School (base) Middle School 0.128** -0.079** -0.049** 0.186** -0.109** -0.077**High School 0.225** -0.130** -0.094** 0.365** -0.207** -0.158**Technical Degree 0.251** -0.167** -0.084** 0.394** -0.237** -0.156**Normal School 0.449** -0.314** -0.135** 0.568** -0.314** -0.254**Undergraduate Degree 0.335** -0.190** -0.144** 0.524** -0.282** -0.242**Postgraduate 0.421** -0.282** -0.138** 0.555** -0.306** -0.248**Married 0.105** -0.080** -0.024** -0.075** -0.063** 0.139**Free union -0.013** 0.000** 0.013** -0.097** -0.064** 0.161**Head of the family -0.032** 0.003** 0.028** -0.081** -0.003** 0.084**Houseworkers 0.115** -0.026** -0.088** 0.087** 0.047** -0.134**Other family member with informal job
-0.106** 0.047** 0.058** -0.123** 0.018** 0.105**
Main income of the family 0.012** -0.020** 0.007** 0.053** -0.043** -0.009**Services (base) Construction -0.096** -0.143** 0.239** 0.215** -0.088** -0.126**Agriculture and not specified -0.089** 0.918** -0.828** 0.174** 0.781** -0.956**Manufacture 0.159** -0.104** -0.054** 0.171** -0.345** 0.173**Comerce 0.015** -0.049** 0.033** -0.052** -0.250** 0.302**Other sectors 0.435** -0.196** -0.238** 0.633** -0.268** -0.364**1st quarter of expected wage -0.051** 0.027** 0.024** -0.063** 0.016** 0.046**
4th quarter of expected wage 0.041** -0.007** -0.034** 0.053** -0.006** -0.046**
Student -0.143** 0.131** 0.012** -0.118** 0.069** 0.049**Monterrey 0.173** -0.126** -0.047** 0.144** -0.051** -0.093**North frontier states 0.125** -0.094** -0.030** 0.132** -0.060** -0.072**Guadalajara 0.097** -0.083** -0.014** 0.128** -0.051** -0.076**Mexico 0.040** -0.048** 0.008** 0.073** -0.024** -0.049**Local employee 0.030** -0.013** -0.017** 0.007** 0.016** -0.024**
Number of individuals 102,174 66,056 Log likelihood - 22,053,422 15,568,305- **, * Significance at 99% and 95% confidence level, respectivelyAll the numbers are rounded
Men, 2012-III Women, 2012-III
Years old
Education
Demographic variables
Labour conditions of the family
Economic sector of Employment
Job preferences indicators
Geographic indicators
Marginal Effects per variable at means from Multiptobit regresions

Why do Mexicans prefer informal jobs?

20
Conclusions
• The Mexican labour force does not show to prefer to work informally. Rather, the type of employment of an individual is better explained by the options available for them according to relevant demographic and economic variables.
•There are some key results to highlight from the baseline regressions:‒Higher education levels have a strong impact on being part of the
formal market;‒Young individuals are more alike to work in the informal market;‒ The principal differences by gender are found when analysing the
sectors of employment; ‒ There are clear differences on the jobs available by the place of
residence and; ‒ There are no relevant differences across time
•. The analysis of the impact of the interactions between the variables is very helpful for identifying mistreated or disadvantaged group of individuals.
Regressions

Thanks!