Embed Size (px)
Citation preview
Why Do Managers Avoid EPS Dilution?
Rong Huang Assistant Professor
Baruch College, CUNY
Carol Marquardt Associate Professor
Baruch College, CUNY
Bo Zhang PhD student
Baruch College, CUNY
We thank John Graham, Brian Bushee, and Jeffrey Wurgler for providing data on marginal tax rates, institutional ownership, and investor sentiment, respectively. We also thank Mary Ellen Carter, Aloke Ghosh, Armen Hovakimian, Amy Hutton, Peter Wilson, and participants at the Boston College, Lehigh University, and The Hong Kong University of Science and Technology accounting workshops and the 2008 American Accounting Association Annual Meeting for helpful comments and suggestions.
Why Do Managers Avoid EPS Dilution? ABSTRACT: Survey and empirical evidence reveals that managers prefer to avoid earnings dilution, though financial theory suggests that it is irrelevant in firm valuation. We explore contracting and behavioral explanations for this apparent paradox. Using a large sample of debt/equity issuers, we report evidence that managers only avoid earnings dilution when their bonus compensation explicitly depends upon earnings per share (EPS) performance; we further find that this effect is increasing in the magnitude of EPS-contingent bonus compensation. Our results are robust to controlling for endogeneity in compensation contract design, behavioral explanations including clientele and investor sentiment theories, and corporate governance policies. Our findings provide new evidence on the implications of the contracting role of accounting in firm decision-making. Keywords: earnings per share, dilution, executive compensation, leverage, agency theory Data Availability: Data are available from the sources described in the text.
I. INTRODUCTION
A half century of corporate finance theory suggests that earnings dilution should be
irrelevant in firm valuation (see Modigliani and Miller 1958; Brealey et al. 2007), yet survey
evidence presented by Graham and Harvey (2001) and Servaes and Tufano (2004) reveals that
CFOs regard earnings dilution as the single most important factor in determining whether to
issue equity.1 To quote Graham and Harvey (2001, p. 229):
“The popularity of this response is intriguing. It either indicates that executives focus more than they should on earnings dilution (if the standard textbook view is correct), or that the standard textbook treatment misses an important aspect of earnings dilution.” In this paper, we propose and test potential resolutions for this apparent paradox, with a
focus on a contracting explanation for managers’ preoccupation with earnings dilution. In
particular, we note that executives’ bonus compensation contracts are frequently based on
earnings per share (EPS) performance (see Morgenson 2008; Healy 1985), a situation which
creates strong incentives for executives to fixate on reported EPS. We therefore begin our
analysis by examining whether the use of EPS as performance metric in executives’ bonus
contracts helps to resolve the ‘dilution puzzle’ but also explore whether behavioral explanations,
including clientele and investor sentiment theories, might also provide a rationale for managers’
professed aversion to EPS dilution.
Our research question also extends the previous literature that has demonstrated a link
between firms’ financing activities and their financial reporting objectives related to EPS. For
example, Hand (1989) finds that smoothing reported EPS is a primary motivation behind firms’
1 “Earnings dilution” typically refers to the reduction in earnings per share (EPS) that occurs through the issuance of additional common shares or the conversion of convertible securities. We use the terms “earnings dilution” and “EPS dilution” interchangeably throughout the paper.
2
decisions to undertake debt-equity swaps; Marquardt and Wiedman (2005) document that firms
structure convertible bonds to increase diluted EPS figures; and Bens et al. (2003) and Hribar et
al. (2006) show that firms use stock repurchases to meet EPS benchmarks.2 However, to our
knowledge there is no extant research that examines how financial reporting incentives related to
EPS performance might affect what is arguably the firm’s most basic financing decision – the
choice between debt and equity.
We employ a standard two-stage model to examine firms’ debt-equity issuance decisions.
In the first stage, we estimate target leverage ratios for a large sample of firms with the necessary
Compustat, CRSP, and ExecuComp data over the period 1993-2005.3 In the second stage, which
is our main focus, we include our EPS dilution, contracting, and behavioral variables of interest
along with previously documented determinants of debt-equity choice.
To estimate EPS dilution, we follow prior research and create an indicator variable that
equals one whenever equity financing will result in greater dilution than debt financing, i.e.,
whenever the issuing firm’s E/P ratio exceeds its after-tax cost of debt. To examine the role of
compensation contracts, we hand-collect data from firms’ proxy statements filed with the
Securities and Exchange Commission (SEC) to ascertain whether EPS performance is explicitly
mentioned as a determinant of executives’ annual cash bonuses.4 If contracting incentives apply,
we expect managers’ aversion to EPS dilution to be intensified when their bonus compensation is 2 On a related note, prior research has also found that firms’ financing choices are associated with the management of balance sheet effects. For example, Imhoff and Thomas (1988) show that the choice between lease and non-lease financing depends upon balance sheet disclosure requirements; Engel et al. (1999) find that the decision to issue trust preferred stock is linked to its balance sheet classification; and Mills and Newberry (2005) find that firms’ contractual debt covenants influence their use of off-balance sheet and hybrid debt financing. 3 Our methodology is related to the two-stage analyses by Hovakimian et al. (2001); Fama and French (2002); Frank and Goyal (2003); Kayhan and Titman (2007); and Byoun (2008). 4 We obtain this information from the “Report of the Compensation Committee” within firms’ proxy statements. This report typically outlines the general compensation philosophy and provides details about the CEO’s compensation more specifically.

3
explicitly linked to EPS performance.
We provide strong empirical evidence consistent with the contracting argument. After
controlling for known determinants of debt-equity choice, we find that firms are significantly
more likely to favor debt over equity financing when debt has a relatively smaller dilutive effect
on EPS and when executives are explicitly compensated on EPS performance; i.e., managers are
more likely to avoid EPS dilution when their pay depends on reported EPS. We also find that the
likelihood of a debt issue is increasing in the interaction between EPS dilution and the magnitude
of executives’ bonus compensation for the subsample of firms that explicitly reward executives
on EPS performance; we document no such relation for the firms that do not use EPS as a
performance metric in their annual bonus contracts.
Because there is potential endogeneity with regard to firms’ compensation structure
choices, we supplement our main analysis with a Heckman (1978) estimation procedure in which
the decision to compensate executives on EPS performance is first modeled as a function of
observable firm characteristics. As there is no established model for this decision, we draw upon
prior findings in the compensation literature in developing our own. We relate the use of EPS as
a performance metric in bonus contracts to firm size, market-to-book ratios, leverage, tax rates,
the relative noise of earnings to returns, and corporate governance measures. We then include
the Inverse Mills Ratio (IMR) from this analysis as a control variable in our main analysis; our
results are robust to controlling for endogeneity in compensation structure choice.
While our evidence strongly suggests that managers’ preoccupation with EPS dilution is
linked to their annual bonus compensation, we also explore whether clientele or investor
sentiment theories might also play a role in explaining the phenomenon. We use transient
4
institutional ownership and Baker and Wurgler’s (2006) investor sentiment index as proxies for
short-term investment horizons and investors’ propensities toward speculative investments,
respectively. Although both variables are significant determinants of debt-equity choice, the
estimated coefficients on interaction terms between EPS dilution and these measures are not
significantly different from zero. We thus are unable to provide evidence that behavioral effects
explain managers’ aversion to earnings dilution, though we caution that we cannot entirely rule
out this explanation. Finally, our results are qualitatively unchanged after controlling for
managerial entrenchment and for executives’ stock and option holdings beyond those granted as
compensation in the current period.
We contribute to several streams of literature. First, we contribute to the literature linking
financial reporting incentives to firms’ financing decisions. While this literature has examined
the role of reporting incentives in firms’ decisions to undertake debt-equity swaps (Hand 1989);
contingently convertible debt issues (Marquardt and Wiedman 2005); and stock repurchases
(Bens et al. 2002; Bens et al. 2003; Hribar et al. 2006; Myers et al. 2007; Yang and Young 2009),
to our knowledge no extant research has examined the role of financial reporting in determining
the firms’ most fundamental financing decision – whether to issue debt or equity. Our paper
addresses this void in the literature.
Second, we contribute to the executive compensation literature. A long literature links
financial reporting choices to bonus compensation (e.g., Healy 1985; Holthausen et al. 1995;
Gaver and Gaver 1998), employee stock option activity (Cheng and Warfield 2005), and
executive retirement benefits (Kalyta 2009). Our evidence suggests that the use of EPS as a
performance metric in bonus compensation contracts creates an incentive for managers to avoid
5
EPS dilution, thereby significantly affecting firms’ financing choices. We thus extend this line of
research by providing new evidence on the implications of the contracting role of accounting.
Third, our results provide a plausible explanation for managers’ “puzzling” avoidance of
EPS dilution that has been documented both in survey and empirical findings within both the
accounting and corporate finance literatures. For example, Bens et al. (2003) question the
appropriateness of managers’ apparent fixation on EPS dilution documented in their work,
observing: “Executives’ myopic focus on short-term EPS in our study may sound implausible to
readers steeped in the neoclassical Arrow-Debreu framework.” This sentiment is further echoed
by both Guay (2002) and Larcker (2003), who note the absence of an equilibrium incentive
structure to support executives’ concern regarding EPS dilution. If, however, managers are
compensated on EPS, then their concerns about earnings dilution are not puzzling at all, but a
well-founded and rational consideration, given their incentives.
Lastly, our results contribute broadly to the corporate finance literature. This literature
has generally tended to on two competing models to explain firms’ financing decisions – the
traditional tradeoff model, in which firms identify optimal leverage by weighing the costs and
benefits of additional debt, and Myers’ (1984) pecking order model, in which financing decisions
are driven by internal financial deficits. However, both the tradeoff and pecking order theories
assume that shareholder wealth maximization is the corporate objective and typically ignore
agency costs that might affect capital structure decisions. Our findings suggest that explicitly

6
incorporating the agency costs related to executive compensation may be necessary if a unified
theory of corporate financial policy is to ultimately emerge.5
The remainder of this paper is organized as follows. In Section II, we discuss prior
literature and develop our hypotheses. We describe our methodology and variable construction
in Section III and our sample data in Section IV. We discuss our results in Section V and present
sensitivity tests in Section VI, and Section VII concludes.
II. PRIOR LITERATURE AND HYPOTHESIS DEVELOPMENT
EPS Dilution and Valuation
In this subsection, we briefly present a numerical example of Modigliani and Miller’s
“conservation of value” argument, adapted from Brealey et al. (2007), to illustrate the ‘standard
textbook view’ on EPS dilution and firm valuation. Suppose a company has no leverage and all
the operating income is paid as dividends to the common shareholders. Expected operating
income is $1,500, and there are 1,000 shares outstanding each with a market price of $10.00 per
share; expected EPS is thus $1.50. The expected return on the share is equal to the earnings-
price ratio, 1.50/10.00 = 0.15, or 15%.
The company’s president wonders if shareholders would be better off if the company had
equal proportions of debt and equity and proposes issuing $5,000 of debt (at an annual rate of
interest of 10%) and repurchasing 500 shares. Expected EPS under the new scenario is expected
operating income of $1,000 ($1,500 less $500 of interest expense) divided by 500 shares
outstanding, or $2.00, and the expected return on the share is now 20%. It would now appear
5 Fama and French (2005) and Barclay and Smith (2005) have both expressed a need for a unified framework of capital structure.
7
that the firm is better off issuing debt.
However, shareholders have the alternative of borrowing on their own account. For
example, suppose an investor borrows $10 and invests $20 in two unlevered shares. The payoff
on this investment is $2.00 ($3.00 in earnings, less $1.00 in interest charges on the $10 that is
borrowed), yielding exactly the same expected return of 20% as the investor would get by buying
one share in levered company. Therefore, a share in the levered company must also sell for $10.
Leverage increases expected EPS but does not affect the share price, and EPS dilution related to
the choice between debt and equity financing is irrelevant in firm valuation.6
Hypothesis Development
Despite the supposed lack of a theoretical link between EPS dilution and firm value,
survey and empirical evidence show that EPS dilution does affect financing decisions. Graham
and Harvey (2001) report that EPS dilution is the single most important factor affecting CFOs’
decisions to issue equity, with over two-thirds of CFOs citing it as a “very important” or
“important” factor in their decision. Hovakimian et al. (2001) empirically find that firms are less
likely to choose equity over debt financing when an equity issue will dilute EPS, noting that
compensation policies might explain the result.
We explore the compensation contracting argument more fully. Jensen and Meckling
(1976) articulated the implications of the agency problem between a firm’s shareholders and its
managers, which arises due to the imperfect observability of managerial effort and costly
contracting. Watts and Zimmerman (1986) further theorized that contracting considerations
6 This example may be generalized to incorporate the effects of taxes. See Miller (1977).
8
affect managers’ accounting choices in the presence of agency costs and information asymmetry,
and a large empirical literature suggests that the determination of accounting income and
selection of accounting methods are affected by compensation contracts (e.g., Healy 1985;
Holthausen et al. 1995; Cheng and Warfield 2005; Bergstresser and Philippon 2006; Kalyta
2009).
We extend this line of inquiry by considering the effect of compensation contracts that
explicitly link executives’ annual cash bonuses to EPS performance. When compensation is
contingent upon EPS performance, managers have an incentive to influence their pay not only
through the operating and reporting decisions that affect net income, but also through financing
decisions that affect the number of shares outstanding used in EPS calculations, and previous
literature documents that financing decisions to undertake debt-equity swaps (Hand 1989),
contingently convertible debt issuances (Marquardt and Wiedman 2005), and stock repurchases
(Bens et al. 2002; Bens et al. 2003; Hribar et al. 2006; Myers et al. 2007; Yang and Young 2009)
are influenced by EPS reporting incentives. Because the choice between debt and equity
financing differentially impacts reported EPS, managers who are rewarded explicitly on EPS
performance may be motivated by self-interest in making this decision. This leads to our first
hypothesis:
H1: Managers are more likely to avoid EPS dilution related to debt-versus-equity issues when their bonus compensation is explicitly linked to EPS performance.
We also explore whether the magnitude of EPS-based compensation affects managers’
financing decisions. We predict a positive association between the amount of bonus
compensation and managerial preferences for higher levels of reported EPS when bonus
9
contracts are explicitly linked to EPS performance. Stated formally, our second hypothesis is as
follows:
H2: Managers’ aversion to EPS dilution is increasing in the magnitude of bonus compensation explicitly linked to EPS performance.
Evidence consistent with H1 and H2 provides one rational explanation for managers’
previously documented aversion to EPS dilution. However, it does not necessarily imply that
managers’ financing decisions are suboptimal. Prior research shows that incentive compensation
is often used to induce managers to take on greater levels of debt because managers often tend to
under-leverage to reduce firm risk and protect their under-diversified human capital (Fama
1980). Mehran (1992) finds that firms’ leverage ratios are positively associated with the
percentage of executives’ total compensation in incentive plans, and Berger et al. (1997) report
lower leverage levels in firms where executive compensation plans are less sensitive to
performance. Evidence relating compensation contracting to managerial aversion to EPS
dilution would be consistent with the predictions of agency theory.
We also note that in developing our hypotheses above we assume that compensation
policies are exogenous. However, Smith and Watts (1992) and Skinner (1993) argue that the use
of accounting information in compensation and debt contracts should be viewed as endogenously
determined. Therefore, in our empirical tests, we allow for endogeneity in compensation
structure by using a two-stage Heckman model to control for firms’ decisions to use EPS as a
performance metric in their annual bonus contracts when choosing between debt and equity
financing.
10
III. METHODOLOGY AND VARIABLE CONSTRUCTION
As we discuss in detail below, we examine the effects of managers’ aversion to EPS
dilution on debt-equity financing choices. Following prior literature, we estimate the
determinants of debt-equity choice in two steps. In the first step, we construct a proxy for the
target leverage ratio as the predicted value from a regression of debt ratios on variables employed
in prior studies. We use this proxy to construct a leverage deficit variable, defined as the
difference between the target leverage ratio and the observed leverage ratio at the beginning of
sample year, as prior research shows that debt-equity choices are influenced by leverage deficits
(see Kayhan and Titman 2007; Byoun 2008). In the second step, we perform a probit estimation
of debt-equity issuances on the estimated leverage deficit, other known determinants of debt-
equity choice, EPS dilution, and our contracting and behavioral variables of interest.
Target Leverage Ratios
In the first stage of our empirical analysis, we estimate the following model in which
firms’ leverage ratios are regressed on determinants of target capital structure:
)1(&&
.1,111,10
1,91,81,71,6
1,51,41,31,21,10,
tititi
titititi
titititititi
EEQUITYSHARBONUSSHAREINDLEVDRASGPPE
SIZENOLCROARETMBLEVERAGE
εαααααα
αααααα
+++
++++
+++++=
−−
−−−−
−−−−−
In equation (1), the dependent variable LEVERAGE is defined as the ratio of book value of debt
over total assets, where book value of debt is defined as short-term debt plus long-term debt. We
draw our independent variables from prior research. Baker and Wurgler (2002) indicate that
firms tend to raise capital from the equity market and hence reduce leverage ratios when the

11
equity market is perceived to be more favorable, i.e., when the market-to-book ratio is high.
Following Baker and Wurgler (2002), we use the market-to-book ratio (MB) to capture this
market timing effect, where MB is defined as (total assets – book value of equity + market value
of equity) / total assets. Welch (2004) shows that leverage ratios are negatively related to past
stock returns, consistent with the notion that firms tend to issue equity following stock price
increases. We use stock return (RET) to capture this effect, where RET is defined as the split-
and dividend-adjusted raw return over the previous two fiscal years. We control for past
profitability using average return on assets for the previous three fiscal years (ROA) and for tax
benefits using net operating loss carryforwards (NOLC). Firms with better past profitability tend
to have lower debt ratios (Titman and Wessels 1988) because profitable firms are able to pay off
debt, and firms with NOLCs are able to better utilize the tax shield that debt financing provides.
We control for SIZE to capture the fact that small firms are more likely to become financially
distressed as they tend to have more volatile cash flows (Rajan and Zingales 1995). We define
SIZE as the log of net sales. We also include PPE (net property, plant, and equipment scaled by
total assets) to control for tangible assets. Titman and Wessels (1988) show that firms with large
amounts of tangible assets tend to have high target leverage ratios because their bankruptcy costs
are low. In contrast, firms with high intangible assets and unique products (high R&D expenses
and high selling expenses) tend to have low leverage ratios because their bankruptcy costs are
high (Titman 1984). We use R&D deflated by sales and SG&A costs deflated by sales to capture
the level of intangible assets and unique products. We include the industry median debt ratio
(INDLEV) to mitigate potential omitted variable problems, where the industry median leverage
ratio is calculated for firms within the same 3-digit SIC code for the same fiscal year
12
(Hovakimian et al. 2001).
We also include incentive compensation variables, as both Mehran (1992) and Berger et
al. (1997) find that incentive compensation tends to increase observed leverage ratios.7
However, in contrast to prior work, we separate incentive compensation into its bonus and equity
components. We expect bonus compensation, which is significantly more sensitive to EPS
performance than is equity-based incentive compensation (Core et al. 2003), to be more
positively associated with leverage ratios if managers are concerned with EPS dilution. We
define BONUSSHARE as the average ratio of annual cash bonus over shareholders’ equity for the
top five executives and EQUITYSHARE as the average ratio of the value of new grants of stock
options and restricted stocks over shareholders’ equity for the top five executives.
Since leverage ratios fall between zero and one, OLS estimation of equation (1) is likely
to produce biased estimates (e.g., Greene 2000, pp. 927-933; Maddala 2001, pp. 333-336).
Therefore, we estimate equation (1) using a Tobit model with fixed year effects, where the
predicted value of the leverage ratio is restricted to be between zero and one (Hovakimian et al.
2001; Kayhan and Titman 2007). The predicted value from the Tobit estimation is the estimated
target leverage ratio.
Debt-Versus-Equity Issuances
We use the following probit model to investigate whether earnings dilution and EPS-
based bonus contract affects the debt-versus-equity choice.
7 Our results are robust to whether incentive compensation is included in the target leverage ratio estimation.
13
)2()1(
*
.,10,,9
,8,7,6,5,4
,3,2,10,
titititi
tititititi
titititi
ISSUESIZEDUMMYMBNOLCROARETMBDEVIATION
NEPSDILUTIOEPSEPSNEPSDILUTIODEBTISSUE
ηβββββββ
ββββ
++>+
+++++
+++=
In equation (2), we define DEBTISSUE as an indicator variable that equals one when debt
is issued and zero when equity is issued. We follow Hovakimian et al. (2001) and Hovakimian et
al. (2004) and define net debt issued as the change in the book value of total debt; net equity
issued is defined as the proceeds from sale of common and preferred stock (Compustat Annual
Item 108) minus the change in the value of preferred stock (Compustat Annual Item 115). Firms
are identified as issuing a security when the net amount issued exceeds 5% of total assets.
EPSDILUTION is a dummy variable indicating whether an equity issue will dilute EPS.
It is set to one when E/P > rd (1-Tc), where E/P is the firm’s earnings/price ratio, rd is the yield on
Moody’s Baa rated debt, and the corporate tax rate Tc is the firm-specific marginal tax rate, and
zero otherwise.8 As described in more detail in the Appendix, the numerator of the E/P ratio is
reported EPS at the end of the fiscal year of the debt or equity issue, and P should ideally be
measured at the time the debt or equity is issued. Accordingly, we use the average of beginning
and end of year price in constructing our EPSDILUTION variable. EPSDILUTION equals one
(zero) when an equity (debt) issue yields a lower reported EPS than would result if debt (equity)
were instead issued. We therefore predict a positive relation between debt issuance and
EPSDILUTION.9
EPS is an indicator variable that equals one when EPS is explicitly mentioned in the 8 We use simulated marginal tax rates as calculated by Graham and Mills (2008) using financial statement data, which are highly correlated with marginal rates based on actual tax returns. We thank John Graham for providing data on marginal tax rates. When these data are not available, we use Graham and Mill’s (2008) “PseudoStatutory” variable, which they show is a second-best alternative to their simulated rates. 9 As noted by Hovakimian et al. (2001), EPSDILUTION could also proxy for a firm’s growth prospects. However, we control for this effect by including the firm’s market-to-book ratio in our model.
14
firm’s proxy statement as a determinant of executives’ annual bonus compensation, and zero
otherwise. We expect a positive relation between debt issuance and EPS, as managers with EPS-
based bonus schemes are likely to prefer debt over equity financing, on average, because debt
financing generally results in higher reported EPS (see Modigliani and Miller 1958; Brealey et
al. 2007).
Our main variable of interest is EPS*EPSDILUTION, which is the interaction term
between EPS and EPSDILUTION. A positive estimated coefficient on this variable would
indicate that managers are more likely to be concerned with EPS dilution related to debt/equity
issuances when their compensation depends upon reported EPS, consistent with H1.
We also include additional control variables that affect debt-equity financing decisions.
Trade-off theory suggests that firms choose the form of financing to offset deviations from their
target leverage ratios (Fama and French 2002; Kayhan and Titman 2007). We therefore include
the DEVIATION from target leverage, defined as the difference between the observed leverage
ratio and the predicted ratio from equation (1), as a control variable; we expect a negative
relation between DEVIATION and DEBTISSUE. Following Hovakimian et al. (2001), we also
include the market-to-book ratio (MB), raw stock returns (RET), return on assets (ROA), and net
operating loss carryforwards (NOLC) in the model, along with an indicator variable,
(MB>1)DUMMY that is set to one if the market-to-book ratio exceeds one and zero otherwise,
and ISSUESIZE. The (MB>1)DUMMY variable indicates whether an equity issue will dilute the
firm’s book value per share, and issue size equals the sum of the net debt and net equity issued.
We use a probit regression to estimate equation (2) since the dependent variable is binary.
To test whether managers’ aversion to EPS dilution is increasing in the magnitude of their
15
EPS-related bonus compensation (H2), we use the following probit model, which is estimated:
)3()1(
**
.,12
,,11,10,9,8
,7,6,,5
,,4,3
,2,10,
titi
tititititi
titititi
tititi
tititi
ISSUESIZEDUMMYMBNOLCROARET
MBDEVIATIONNEPSDILUTIOEEQUITYSHARNEPSDILUTIOBONUSSHARENEPSDILUTIO
EEQUITYSHARBONUSSHAREDEBTISSUE
ηβββββ
βββββ
βββ
++
>++++
+++
++
++=
To simplify the interpretation of interaction effects, we estimate equation (3) separately
for firms that reward executives explicitly on EPS performance versus those that do not. We
incorporate the magnitude of incentive compensation by including both BONUSSHARE and
EQUITYSHARE as potential determinants of the debt-equity choice. We expect both
BONUSSHARE and EQUITYSHARE to be positively related to DEBTISSUE, as prior research
has shown that incentive compensation induces managers to take on greater debt levels.
However, if executives’ concerns about EPS dilution are related to compensation structure, we
expect that a dollar of bonus compensation will be more positively associated with the likelihood
of a debt issuance than will an equal amount of equity compensation. In addition, as in equation
(2), we expect EPSDILUTION to be positively associated with DEBTISSUE.
Our main variables of interest are the interaction terms, BONUSSHARE*EPSDILUTION
and EQUITYSHARE*EPSDILUTION. Consistent with H2, we expect the interaction between
BONUSSHARE and EPSDILUTION to be positively associated with DEBTISSUE for the
subsample of firms that reward executives on EPS performance, but have no such expectation for
the subsample that does not. Furthermore, we do not expect the interaction between
EQUITYSHARE and EPSDILUTION to be a significant determinant of DEBTISSUE in either
group of firms, as reported EPS should not play a strong role in determining equity-based
16
incentive compensation (Core et al. 2003).
Controlling for Endogeneity in Compensation Structure
The above analysis assumes that firms’ decisions to explicitly condition annual bonus
compensation on EPS performance is exogenous. However, as observed by Smith and Watts
(1992) and Skinner (1993), it is possible that compensation structure and financing policies are
jointly determined. We address this potential endogeneity issue using a two-stage Heckman
(1978) model. In the first stage, we model the firm’s decision to explicitly reward executives on
EPS performance, relying on prior finding in the compensation literature in choosing our
dependent variables. Our model is as follows:
)4(.1,6
1,51,41,31,21,10,
titi
titititititi
ENTRENCHEDTAXRATELEVNOISEMBSIZEEPS
ξγγγγγγγ
++
+++++=
−
−−−−−
EPS is an indicator variable equal to one for firms with bonus compensation contracts
that are explicitly based on EPS, and zero otherwise. We include firm size (SIZE), as defined
earlier; we expect a positive coefficient on SIZE because large firms are more likely to use
compensation contracts that are sensitive to earnings performance (Kole 1997). We use market-
to-book (MB) ratio to control for investment opportunities and predict a negative coefficient on
MB, as firms with high investment opportunities tend to rely less on accounting-based
performance and more on market-based performance (Smith and Watts 1992). NOISE is the
ratio of time-series variance of ΔEPS to time-series variance of stock returns over our sample
period. We predict a negative relation between EPS and NOISE as firms with relatively more
noise in earnings tend to use less earnings-based compensation (Bryan et al. 2000). We control
17
for the existing level of leverage and expect a positive coefficient on LEV as highly leveraged
firms may provide more earnings-based cash incentives to avoid earnings-related debt covenant
violation (Watts and Zimmerman 1986). TAXRATE represents estimated marginal tax rates as
calculated by Graham and Mills (2008) using financial statement data. We expect a positive
coefficient on TAXRATE as firms with high tax rates tend to rely more on performance-based
cash compensation in order to preserve the tax deductibility of their executives’ bonus
compensation under Internal Revenue Code Section 162(m) (see Bryan et al. 2000).10 Finally,
following Davila and Penalva (2006), we include a corporate governance measure that captures
managerial entrenchment, ENTRENCHED, which is a weighted index of the following four
variables: anti-takeover protection; the proportion of executives that serve on the board of
directors; an indicator variable that equals one if the CEO is also the chairman of the board; and
the number of board meetings. We predict a positive coefficient on ENTRENCHED, as Davila
and Penalva (2006) find that entrenched managers tend to negotiate compensation contracts that
depend more on accounting-based rather than market-based performance. We obtain the inverse
Mills ratio from estimating equation (4) and add it as an additional dependent variable in both
equations (2) and (3). A significant coefficient on the inverse Mills ratio indicates the presence
of endogeneity.
IV. SAMPLE AND DATA
We obtain financial data from Compustat 2007, stock price information from CRSP 2007,
10 Under Internal Revenue Code Section 162(m), cash bonuses in excess of one million dollars are only deductible for tax purposes if the bonus is based on the achievement of financial performance goals that have been put in place by the firm’s compensation committee and approved by shareholder vote.

18
and compensation data from ExecuComp 2007. We exclude firms in financial industries (SIC
codes 6000—6999) since their financial reporting and capital structure are likely to be very
different from those of other firms (Hovakimian et al. 2004; Kayhan and Titman 2007).11 We
restrict our sample to firm-years with total assets above $10 million. Because ExecuComp is
available from 1992 and we require one-year lagged data for some our variables, we restrict our
sample from 1993 to 2005. The final sample contains 5,980 firm-year observations from 1993 to
2005.
We track debt issuances from the change in total debt reported in Compustat. Equity
issuances are identified from the statement of change in cash flows reported in Compustat. After
merging with our sample containing nonmissing financial variables, stock return variables, and
executive compensation variables, we obtain a sample of 2,397 firm-years with security (debt or
equity) issuances.
To identify firms with bonus compensation contracts that are explicitly based on EPS, we
access the proxy statements of the 2,397 firm-years with security issuances via SEC Edgar and
search for the description of bonus compensation contracts. We collect a sample of 614 firm-
years whose bonus contracts are explicitly based on EPS. Another sample of 1,188 firm-years
did not mention EPS in their description of their annual bonus plans in proxy statements filed
with the SEC. The remaining 595 firm-years either did not file a proxy statement or did not
report a bonus plan in their proxy statements. We thus use a total of 1,802 (614 plus 1,188) firm-
years in our examination of debt/equity issuances.
11 Graham and Harvey (2001) note that avoiding EPS dilution seems to be particularly important to CFOs working in regulated industries. We omit financial institutions to ensure consistency with prior research; however, we may be reducing the power of our tests if these firms are more likely than other firms to reward executives on EPS performance.
19
V. RESULTS
Target Leverage Ratios
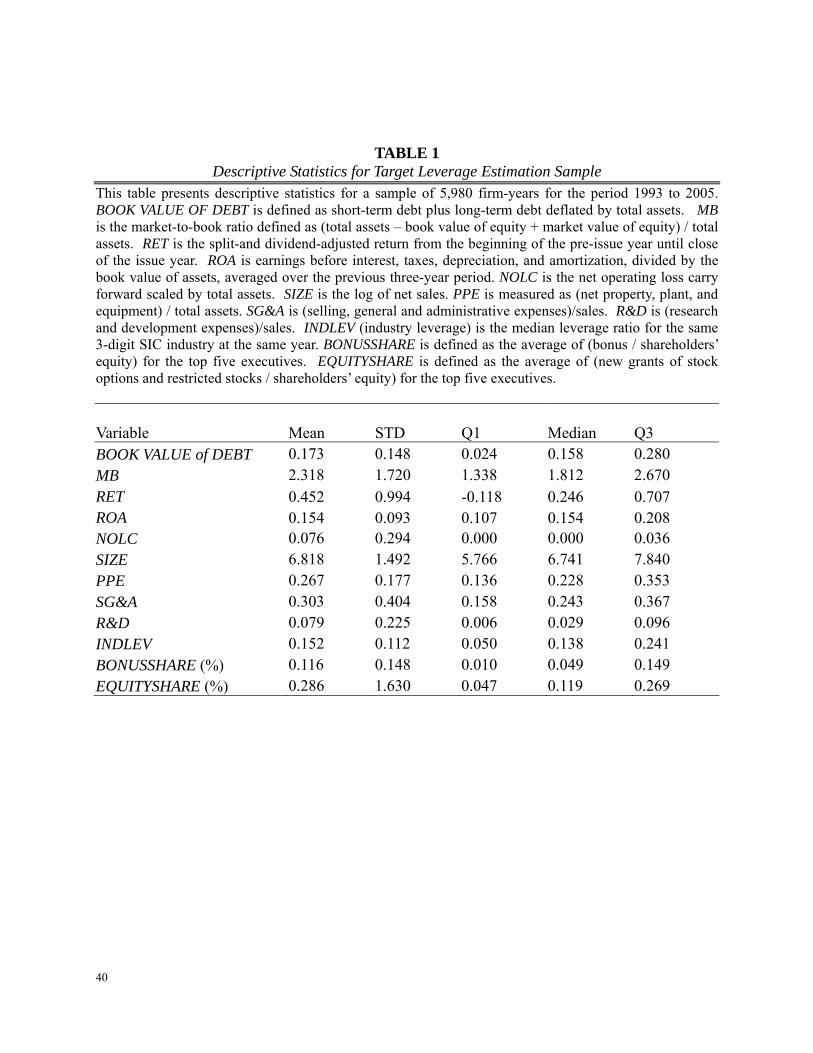
In Table 1, we provide descriptive statistics on firm characteristics of the initial sample
used to estimate target leverage ratios. BOOK VALUE of DEBT is book value of long-term and
short-term debt, deflated by total assets. The mean (median) leverage ratio is 17.3% (15.8%),
which is slightly lower than figures reported by Byoun (2008), who reports mean (median) ratios
of 0.2051 (0.1782) in 1993 and 0.1834 (0.1741) in 2003. The mean (median) values of 2.318
(1.812) for MB, 0.452 (0.246) for RET, and 0.154 (0.154) for ROA indicate that most firms in
this sample are profitable and financially healthy, consistent with their inclusion in the
ExecuComp database. In addition, the statistics for NOLC, SIZE, PPE, SG&A, and R&D
indicate that our sample firms have few tax loss carryforwards, high sales levels, and are
relatively asset-intensive. They are also more highly levered that the average firm in their
industry, as indicated by mean (median) values of INDLEV of 0.152 and 0.138. The mean
(median) value of bonus compensation as a percentage of shareholders’ equity is 0.116%
(0.049%) per executive, while the mean (median) value of equity compensation as a percentage
of shareholders’ equity is 0.286% (0.119%) per executive.12
Table 2 reports the results from the first stage Tobit estimation of target leverage ratios.
The first column presents the benchmark model without including compensation measures to
provide a comparison with prior studies (Hovakimian et al. 2004). Consistent with prior 12 Prior literature has noted that bonus compensation frequently represents a smaller proportion of total compensation than does equity compensation (Hall and Liebman 1998; Murphy 1999) and questioned its ability to create incentive benefits (Bushman and Smith 2001). Hoppe and Moers (2008) argue that corporate boards use bonus contracts to communicate how performance will be evaluated and thus signal the measures relevant in CEO termination decisions; they also present empirical evidence consistent with their argument.
20
research, we generally find that the determinants are associated with leverage ratios in the
predicted fashion. MB, RET, ROA, SG&A, and R&D are negatively related to leverage ratios,
while SIZE, PPE, and INDLEV are positively related to leverage ratios.13 These results suggest
that our sample is comparable to the samples used in prior studies, and all the documented
determinants in our sample generally behave in the predicted fashion.
The second and third columns include BONUSSHARE and EQUITYSHARE in the
regression, respectively. The estimated coefficient of 0.516 on BONUSSHARE is significantly
positive with a two-tailed p-value of less than 0.01. Similarly, the coefficient of 0.133 on
EQUITYSHARE is also significantly positive (p-value = 0.02), albeit much smaller in magnitude.
When both BONUSSHARE and EQUITYSHARE are included in the model, the estimated
coefficients are both still highly significant. These results are consistent with the prediction that
both bonus and equity compensation are positively associated with target leverage ratios. We
also perform an F-test (not tabulated) to determine whether the estimated coefficient on
BONUSSHARE is significantly larger than the coefficient on EQUITYSHARE; the F-statistic of
116.88 is highly significant (p-value < 0.001). In addition, we find that all the control variables
have the predicted signs, though SG&A and NOLC fail to reach conventional levels of
significance.
While we do not rely on the results from Table 1 as formal tests of H1 and H2, the results
are nonetheless consistent with our hypotheses. We find that a dollar of bonus compensation has
a significantly greater impact on leverage ratios than does a dollar of equity compensation.
13 Although NOLC is predicted to be negatively associated with target leverage, we find a positive relation, consistent with Hovakimian et al. (2001), who note that a positive relation may reflect the fact that firms with accumulated losses in the past tend to be over-levered relative to their targets.
21
Bonus compensation may be more effective in raising leverage ratios than equity compensation
because it is more sensitive to EPS performance than equity compensation and because debt
financing typically results in higher reported EPS levels than would result from equity financing;
hence, managers tend to choose debt over equity when bonus compensation is larger.14 We
proceed, however, with more formal hypothesis tests in the following section.
Debt-Versus-Equity Issuances
Panel A of Table 3 presents descriptive statistics for the sample of debt and equity issuers.
We present statistics for the combined sample, as well as for the two subsamples that are
conditioned on whether EPS is used as an explicit performance metric in firms’ bonus plans.
Firms that reward executives explicitly on EPS performance (EPS=1) are significantly more
levered than firms that do not (EPS=0): mean (median) book leverage is 0.232 (0.234) for the
EPS=1 subsample versus 0.196 (0.192) for the EPS=0 group. The EPS=1 firms also use more
incentive compensation. Both BONUSSHARE and EQUITYSHARE are significantly larger for
firms that reward EPS performance, with BONUSSHARE means (medians) of 0.062 (0.034) and
0.049 (0.031) and EQUITYSHARE means (medians) of 0.260 (0.133) and 0.185 (0.106) for the
EPS=1 and EPS=0 groups, respectively.
In addition, the EPS=1 firms are relatively larger than the EPS=0 firms (mean SIZE of
7.462 versus 6.867, p<0.01), have fewer tax loss carryforwards (mean NOLC of 0.043 versus
0.102, p<0.01), more fixed assets (mean PPE of 0.275 versus 0.263, p=0.05), and smaller SG&A 14 It is also possible that the estimated coefficient on BONUSSHARE is higher than that of EQUITYSHARE in Table 1 because the use of equity-based incentive compensation (especially nonqualified incentive stock options) can reduce marginal tax rates and the desirability of debt financing (Graham et al. 2004). We discuss this possibility in more detail in section VI.
22
and R&D expenses (means of 0.253 versus 0.300 and 0.044 versus 0.079, respectively, both
p<0.01), and are in more highly-levered industries (mean INDLEV of 0.170 versus 0.143,
p<0.01). Equity issues are also more likely to dilute EPS in the EPS=1 subsample: mean
EPSDILUTION is 0.525 for this group versus 0.442 (p<0.01) for the EPS=0 firms. The EPS=1
subsample is also more over-levered relative to their target debt ratios: mean DEVIATION is
0.073 versus 0.046 for the EPS=0 subsample (p<0.01)
Panel B of Table 3 presents the estimation results from our probit estimation models of
debt vs. equity issuances. The leftmost column presents results from estimating equation (2) for
the combined sample. The estimated coefficient of 0.256 on EPS is positive and significant (p-
value < 0.01). This finding is consistent with our expectation that managers with EPS-based
bonus plans are more likely to issue debt than equity. The estimated coefficient on
EPSDILUTION is also positive and significant (p-value <0.01), consistent with Graham and
Harvey’s (2001) survey evidence revealing that CFOs regard EPS dilution as a key factor in
determining whether to issue equity. More importantly, we find that the interaction term
EPS*EPSDILUTION has a positive coefficient of 0.159 (p-value<0.01). This finding confirms
our prediction that managers are more likely to issue debt when their bonuses are based on EPS
and when earnings will be diluted with an equity issue, consistent with H1.
We also find that, as expected, the estimated coefficient on DEVIATION is negative and
significant (p-value < 0.01), which supports the trade-off theory that firms choose the form of
financing to offset deviations from their target leverage ratios. In addition, MB, RET, ROA and
ISSUESIZE are significantly negatively related to the likelihood of debt issues.
We next investigate whether managers’ aversion to EPS dilution is increasing with the
23
magnitude of bonus compensation. The middle columns present results from the estimation of
equation (3) for the subsample where bonuses are explicitly based on EPS performance.
Consistent with our expectations, the estimated coefficients on BONUSSHARE and
EQUITYSHARE of 0.159 and 0.123, respectively, are significantly positive, indicating that
incentive compensation induces managers to choose debt over equity financing, consistent with
previous findings. EPSDILUTION continues to be positively related to the likelihood of a debt
issue, as expected, with an estimated coefficient 0.672.
Our main variables of interest, however, are BONUSSHARE*EPSDILUTION and
EQUITYSHARE*EPSDILUTION. The estimated coefficient of 0.476 on
BONUSSHARE*EPSDILUTION is positive and significant (p-value=0.02), consistent with H2.
Furthermore, the estimated coefficient of 0.122 on EQUITYSHARE*EPSDILUTION is not
significantly different from zero (p = 0.53). These results provide support for the argument that
the concern over EPS dilution in debt/equity financing decisions is related to compensation
contracting.
Finally, in the rightmost columns, we present results for the subsample where EPS is not
an explicit determinant of executives’ bonus compensation. Here we find that EQUITYSHARE is
significantly positively associated with the likelihood of a debt issue, but BONUSSHARE is not.
In addition, as expected, neither BONUSSHARE*EPSDILUTION nor
EQUITYSHARE*EPSDILUTION is a significant determinant of financing choices for firms that
do not explicitly reward executives on EPS performance. Finally, the estimated coefficient on
the EPSDILUTION variable is not significantly different from zero (0.138, p-value=0.23). It
appears that the ‘dilution puzzle’ presented by Graham and Harvey (2001) only applies to firms
24
that explicitly reward their managers on EPS performance, consistent with agency theory.
Controlling for Endogeneity in Compensation Structure
Our analysis thus far assumes that compensation structure is exogenously determined. In
this subsection, we present results of a two-stage Heckman (1978) model that controls for
endogeneity in compensation contract design.15 We present the results of the first stage
estimation of equation (4), a probit model of the decision to base executive annual bonuses on
EPS performance, in panel A of Table 4. Consistent with our expectations, we find that the
coefficient of 0.187 on SIZE is positive and significant (p-value = 0.01), suggesting that large
firms are more likely to use EPS-based bonus compensation. We use the market-to-book ratio
(MB) to control for investment opportunities. MB is marginally negatively associated with the
probability of EPS-based bonus scheme, indicating that firms with high investment opportunities
use less accounting-based performance measures in their compensation contracts, as accounting
performance tend to be noisy for these firms. In addition, we find that, as expected, firms with
high leverage and high tax rates provide more EPS-based cash incentives. Finally, the
coefficients on NOISE and ENTRENCHED are negative but insignificant.
In the second stage, we perform a probit estimation of the decision to issue debt by
adding the inverse Mills ratio as an additional explanatory variable. The leftmost column of
panel B shows that after controlling for endogeneity in compensation structure, the coefficients
on EPS*EPSDILUTION, EPS and EPSDILUTION are still positive and significant. This finding
confirms our prediction that managers with EPS-based bonus schemes are more likely to issue
15 Note that the sample size in Table 4 drops to 1,325 observations, as we require corporate governance data to estimate equation (4).

25
debt when an equity issue will dilute EPS. Note that the estimated coefficient on the inverse
Mills ratio of -0.671 is negative and significant, indicating that there is evidence of endogeneity
between compensation structure and financing choices, consistent with Smith and Watts (1992)
and Skinner (1993).
The middle and rightmost columns report results of the second-stage probit model for the
EPS=1 and EPS=0 subsamples, respectively. As before, we find that debt issuance is positively
associated with EPSDILUTION, BONUSSHARE, and BONUSSHARE * EPSDILUTION only in
the subsample where bonus is based on EPS performance. For the subsample where bonus is not
based on EPS, these three variables are not significant determinants of debt/equity choice,
although EQUITYSHARE remains a significant determinant for this group. In addition, the
estimated coefficients on IMR are negative and significant for both subsamples, providing
evidence of endogeneity between compensation structure and financing choices. However, our
results are robust to this concern.
VI. SENSITIVITY TESTS
Clientele Effects and Investor Sentiment
Agency theory provides one potential explanation for managerial concern over EPS
dilution, and our empirical evidence strongly supports this view, but other explanations might
also apply. In this subsection, we explore whether behavioral theories related to clientele effects
and investor sentiment might also play a role in the phenomenon. That is, it is not that managers
per se are concerned about EPS dilution; it is rather that they are catering to investor demands
for higher reported EPS performance.
26
One might reasonably expect investor concern with EPS dilution to vary both cross-
sectionally and over time. For example, prior research has documented that transient
institutional owners tend to overvalue current earnings in pricing securities (Bushee 2001), and
high levels of transient institutional ownership has been linked to myopic financial reporting
behavior by managers. Bushee (1998) reports evidence that firms with high levels of transient
institutional ownership are more likely to cut R&D to reverse an earnings decline, and
Matsumoto (2002) finds that firms with high transient ownership are more likely to meet or
exceed earnings expectations. Thus, managers of firms with high transient institutional
ownership may have relatively stronger preferences to avoid earnings dilution than other firms.
Similarly, prior research shows that investor sentiment – a phenomenon that biases
investors’ expectations of future firm performance – affects firms’ investing and financing
decisions (see Baker et al. 2007). When market sentiment is low, investors are pessimistic about
future prospects and undervalue the firm. Managers may be particularly reluctant to dilute
earnings at these times, as investors already have a negative view of the firm’s outlook. In
contrast, when sentiment is high, earnings dilution will be less likely to concern investors, as
they view the firm’s long-term prospects as good. We therefore expect managers to have
stronger preferences to avoid earnings dilution during times of low investor sentiment.
We control for both transient institutional ownership (TRANSIENT) and investor
sentiment (SENTIMENT) in our analysis of debt/equity issuances and interact both measures
with EPSDILUTION. If clientele effects and investor sentiment are related to the dilution
puzzle, we expect a positive coefficient on TRANSIENT*EPSDILUTION and a negative
coefficient on SENTIMENT*EPSDILUTION. We define TRANSIENT using Bushee’s (1998)
27
investor trading classification scheme and SENTIMENT using the investor sentiment index
developed by Baker and Wurgler (2006).16
Our results, reported in Table 5, show that after controlling for these two factors, the
estimated coefficients on EPS (0.236), EPSDILUTION (0.446), and EPS*EPSDILUTION
(0.138) remain positive and highly significant for the combined sample. The estimated
coefficient on SENTIMENT (-0.958) is negative and significant (p-value = 0.02), indicating that
managers tend to issue debt when the investor sentiment is low, while the coefficient of 2.139 on
TRANSIENT is significantly positive, suggesting that managers tend to issue debt when there is a
large proportion of transient institutional investors. However, neither interaction term is
significant, which suggests that behavioral explanations are not driving managers’ concerns
regarding EPS dilution.
Results for the EPS=1 and EPS=0 subsamples are also qualitatively unchanged after
adding the TRANSIENT and SENTIMENT variables, although we note that the EPSDILUTION
variable in the EPS=0 subsample is now marginally significantly positive. Overall, we are
unable to find support for a behavioral explanation for managers’ aversion to earnings dilution.
Managerial Entrenchment
Managerial preferences for avoiding EPS dilution may vary cross-sectionally with
corporate governance mechanisms and levels of managerial entrenchment. On the one hand, an
16 We thank Brian Bushee for providing transient institutional ownership data. The Baker and Wurgler (2006) index captures six investor sentiment proxies, including the closed-end fund discount, share turnover, average first day initial public offering returns, number of initial public offerings, share of equity issues in total debt and equity issues, and the dividend premium. SENTIMENT is the first principal component of the six sentiment proxies that have been orthogonalized with respect to a set of macroeconomic variables. We obtain this data from the following website: http://pages.stern.nyu.edu/~jwurgler/
28
entrenched manager may be better able to influence compensation levels than a less entrenched
manager (see Core et al. 1999), suggesting that a lower reported EPS figure may have little
impact on executives’ pay packages. On the other hand, Davila and Penalva (2006) find that
entrenched managers tend to have compensation contracts that employ accounting-based rather
than market-based performance measures, as accounting-based measures are presumably easier
to manipulate. This latter finding suggests that entrenched managers may benefit relatively more
from avoiding EPS dilution than other managers.
In this subsection, we explore whether managerial entrenchment might affect our results
linking managers’ aversion to EPS dilution to compensation contracts. We add the same
ENTRENCHED variable defined in Section III to our first and second stage regressions and also
add the interaction term ENTRENCHED*EPSDILUTION to the second stage analysis. As
shown in Table 6, the estimated coefficients on these variables are insignificantly different from
zero in every specification, although we note that for the EPS=1 subsample, the estimated
coefficient of 0.118 is approaching significance with a two-tailed p-value of 0.12. Overall,
however, our main findings are robust to controls for managerial entrenchment.
Executives’ Existing Stock and Option Holdings
In addition to the new grants of options and restricted stock that comprise our
EQUITYSHARE variable, executives’ existing holdings of stock and stock options might also
affect target leverage and debt-equity financing decisions, as they also help in aligning
executives’ interests with shareholders (Mehran 1992; Berger et al. 1997). As noted earlier,
option holdings could also affect our results if their exercise is used as an alternative tax shield to
29
debt financing.17 We estimate EQUITYHOLDING using the methodology outlined in Core and
Guay (1999) and Yermack (1995). Our results in both the first and second stage analyses are
robust to its inclusion as an additional control variable (results not tabulated). For the EPS=1
subsample, the estimated coefficients on EPSDILUTION (1.665), BONUSSHARE (0.183), and
BONUSSHARE*EPSDILUTION (0.878) are still significantly positive, and the coefficient on
EQUITYSHARE*EPSDILUTION is not significantly different from zero. In addition, neither
EQUITYHOLDINGS nor EQUITYHOLDINGS *EPSDILUTION are significant determinants of
debt/equity choice for this subsample. For the EPS=0 subsample, EQUITYSHARE remains a
significant determinant of financing choices, with an estimated coefficient of 0.280 (p-
value=0.03), but BONUSSHARE, the interactive terms BONUSSHARE*EPSDILUTION and
EQUITYSHARE*EPSDILUTION, and the new regressors EQUITYHOLDINGS and
EQUITYHOLDINGS*EPSDILUTION are all insignificant. Our main findings are thus robust to
the inclusion of executives’ equity holdings.
VII. Conclusions
In this paper, we examine whether the use of EPS as a performance metric in executives’
annual bonus contracts explains managers’ supposedly irrational tendency to avoid EPS dilution.
Using a large sample of debt and equity issuers with the necessary Compustat, CRSP, and
ExecuComp data over the period 1993-2005, we find that firms are significantly more likely to
favor debt over equity financing when debt has a relatively smaller dilutive effect on EPS and
17 Graham, Lang, and Shackelford (2004) find that the exercise of nonqualified stock options substantially reduces the marginal tax rates of Nasdaq 100 firms, but has little effect on the tax rates of S&P 100 firms. The median marginal tax rate for our sample firms is 0.35, which suggests that the widespread use of employee stock options as a non-debt tax shield is unlikely for our sample firms.
30
when executives are explicitly compensated on EPS performance; i.e., managers are more likely
to avoid EPS dilution when their pay depends on reported EPS. We also find that the likelihood
of a debt issue is increasing in the interaction between EPS dilution and the magnitude of
executives’ bonus compensation for the subsample of firms that explicitly reward executives on
EPS performance; we document no such relation for the firms that do not use EPS as a
performance metric in their annual bonus contracts. These results are robust controlling for
endogeneity in compensation contract design, behavioral explanations including clientele and
investor sentiment theories, and corporate governance policies. Overall, our results provide
compelling evidence that managers’ professed aversion to EPS dilution is related to
compensation contracting concerns, a finding consistent with agency theory.
While our findings suggest that contracting concerns are the most likely explanation for
managers’ tendency to avoid EPS dilution, we have no evidence that managers’ financing
choices are suboptimal, as incentive compensation is often used to encourage executives to
increase firm leverage. We consequently do not examine whether compensation committees
adjust executive pay for “opportunistic” financing choices, as we have no reason to believe that
an association between EPS-based bonus contracts and managerial preferences to avoid EPS
dilution represent a non-optimal contracting outcome. Future research might seek to address
whether there are instances of suboptimal leveraging decisions related to the use EPS-related
compensation contracts.
There are limitations to our analysis. First, because our EPSDILUTION variable depends
on firms’ E-P ratios, it could potentially capture growth or market timing effects. However, we
control for both of these effects by including the market-to-book ratio and stock price
31
performance in our analysis. It is also possible that the EPSDILUTION variable could also be
capturing differences in the relative cost of debt to equity, if the E-P ratio is viewed as a rough
proxy for the cost of equity capital. Firms will simply prefer to issue debt when it is relatively
cheaper than equity, i.e., when the EPSDILUTION variable is equal to one. While we
acknowledge that this is one possible interpretation of the EPSDILUTION variable, if this
construct is mainly capturing relative costs of debt versus equity financing, we would not expect
different results across our two subsamples, nor would we expect differences in the significance
of the interaction terms involving EPSDILUTION. In addition, our use of target leverage ratios
in the first stage analysis should also serve as an implicit control for the relative costs of debt
versus equity. Nonetheless, the results should be interpreted with this caveat in mind.
Second, we dichotomize our sample into firms that explicitly reward executives on EPS
performance and those that do not, based on information provided in proxy statements filed with
the SEC. It is possible that firms do use EPS in determining bonus compensation, but do not
disclose this information in their proxy statements. On a related note, we assume that bonus
compensation mainly reflects earnings and EPS performance. While this assumption is well-
supported in prior research, bonus compensation could potentially be affected by stock price
performance, as well as by non-financial measures of performance. To the extent that either or
both of the above situations apply, the power of our tests will be reduced.
The relatively small magnitude of bonus compensation relative to other components of
executive pay also has implications for our study. We implicitly assume that bonus
compensation is sufficiently large enough to impact managerial decision making. The strength
of our results suggests that this assumption is justified, and we further note that current trends in
32
incentive compensation may eventually render this potential concern as moot. Citing a survey of
350 large U.S. companies, Dvorak (2007) observes that as many firms are abandoning stock
options due to the new expensing requirements and other problematic issues, the percentage of
performance-based incentive pay has increased dramatically from 12% to 31% of total incentive
compensation over 2002−2006. The importance of bonus contract design in firm decision-
making is likely to grow in the near future.
On a final note, given the significant impact that EPS-based bonus contracts have in our
setting, it is likely that the use of EPS as a performance metric in determining executive pay
affects other firm decisions as well. For example, the Office of Federal Housing Enterprise
Oversight’s (OFHEO) now-famous 2006 report on the Fannie Mae accounting debacle sharply
criticizes Fannie Mae’s over-reliance on EPS in determining executive pay. According to the
report, “Fannie Mae tied major portions of executive compensation to EPS, a metric easily
manipulated by management.” The report also states, “Fannie Mae’s executives were precisely
managing earnings to the one-hundredth of a penny to maximize their bonuses while neglecting
investments in systems internal controls and risk management,” and Fannie Mae’s reaching of
announced targets for EPS each quarter “were illusions deliberately and systematically created
by senior management with the aid of inappropriate accounting and improper earnings
management.” Future research might address whether the use of EPS-based compensation
contracts has played a similar role in the recent financial crisis.
33
REFERENCES
Baker, M., and J. Wurgler. 2002. Market timing and capital structure. Journal of Finance 57 (1): 1-32.
———, and ———. 2006. Investor sentiment and the cross-section of stock returns. Journal of
Finance 61(4): 1645-1680. ———, R. Ruback, and J. Wurgler. 2007. Behavioral corporate finance: A survey. Handbook of
Corporate Finance: Empirical Corporate Finance. Barclay, M., and C. Smith. 2005. The capital structure puzzle: The evidence revisited. Journal of
Applied Corporate Finance 17(1): 8-17. Bens, D., V. Nagar, and F. Wong. 2002. Real investment implications of employee stock option
exercises. Journal of Accounting Research 40 (20): 359-393. Bens, D., V. Nagar, D. Skinner, and F. Wong. 2003. Employee stock options, EPS dilution, and
stock repurchases. Journal of Accounting and Economics 36 (1-3): 51-90. Berger, P., E. Ofek, and D. Yermack. 1997. Managerial Entrenchment and Capital Structure
Decisions. Journal of Finance 52 (4): 1411-1438. Bergstresser, D., and T. Phillippon. 2006. CEO incentives and earnings management. Journal of
Financial Economics 80 (3): 511-529. Brealey, R., S. Myers, and F. Allen. 2007. Principles of Corporate Finance. McGraw-Hill, New
York, NY. Bryan S., L. Hwang, and S. Lilien. 2000. CEO stock-based compensation: An empirical analysis
of incentive-intensity, relative mix, and economic determinants. Journal of Business 73(4): 661-693.
Bushee, B. 1998. The influence of institutional investors on myopic R&D investment behavior.
The Accounting Review 73(3):305-333. ———. 2001. Do institutional investors prefer near-term earnings over long-run value?
Contemporary Accounting Research 18 (2): 207-247. Bushman, R., and A. Smith. 2001. Financial Accounting Information and Corporate Governance.
Journal of Accounting and Economics 32 (1-3): 237-333. Byoun, S. 2008. How and when do firms adjust their capital structure toward targets? Journal of
Finance 63(6): 3069-3096.
34
Cheng, Q., and T. Warfield. 2005. Equity incentives and earnings management. The Accounting
Review 80 (2): 441-476. Core, J., and W. Guay. 1999. The use of equity grants to manage optimal equity incentive levels.
Journal of Accounting and Economics 28 (2): 151-184. ———, ———, and R. Verrecchia. 2003. Price versus non-price performance measures in optimal
CEO compensation contracts. The Accounting Review 78 (4): 957-981. ———, R. Holthausen, and D. Larcker. 1999. Corporate governance, the executive officer
compensation, and firm performance. Journal of Financial Economics, 51 (3): 371-406. Davila, A., and F. Penalva. 2006. Governance structure and the weighting of performance
measures in CEO compensation. Review of Accounting Studies 11(4): 463-493. Dvorak, P. 2007. Theory and practice: Tweaking the stock option grant – Firms rework terms to
keep plans’ benefits and minimize problems. Wall Street Journal (April 30): B3. Engel, E., M. Erickson, and E. Maydew. 1999. Debt-equity hybrid securities. Journal of
Accounting Research 37 (2): 249-74. Fama, E. 1980. Agency problems and the theory of the firm. Journal of Political Economy 88
(2): 288-307. ———, and K.R. French. 2002. Testing tradeoff and pecking order predictions about dividends
and debt. Review of Financial Studies 15 (1): 1-33. ———, and ———. 2005. Financing decisions: Who issues stock? Journal of Financial Economics
76 (3): 549-582. Frank, M., and V. Goyal. 2003. Testing the pecking order theory of capital structure dividends
and debt. Journal of Financial Economics 67 (2):217-248. Gaver, J. J., and K. M. Gaver. 1998. The relation between nonrecurring accounting transactions
and CEO cash compensation. The Accounting Review 73 (2):235-253. Gompers, P., J. Ishii, and A. Metrick. 2003. Corporate governance and equity prices. Quarterly
Journal of Economics 118 (1): 107-155. Graham, J., and C. Harvey. 2001. The theory and practice of corporate finance: Evidence from
the field. Journal of Financial Economics 60 (2-3):187-243. ———, M. Lang, and D. Shackelford. 2004. Employee Stock Options, Corporate Taxes, and Debt
35
Policy. Journal of Finance 59 (4): 1585-1618. ———, and Mills, L. (2008). Using tax return data to simulate corporate marginal tax rates.
Journal of Accounting and Economics 46 (2-3): 366-388. Greene, W. 2000. Econometric Analysis. Upper Saddle River, NJ: Prentice-Hall. Guay, W. 2002. Discussion of “real implications of employee stock option exercises.” Journal
of Accounting Research 40 (2002): 395-406. Hand, J. R. 1989. Did firms undertake debt-equity swaps for an accounting paper profit or true
financial gain? The Accounting Review 64 (4): 587-623. Hall, B., and J. Liebman. 1998. Are CEOs really paid like bureaucrats? Quarterly Journal of
Economics 111(3): 653-661. Healy, P. M. 1985. The effect of bonus schemes on accounting decisions. Journal of Accounting
and Economics 7(1-3): 85-107. Heckman, J.J. 1978. Dummy endogenous variables in a simultaneous equation system.
Econometrica 46 (4): 931-60. Holthausen, R., D. Larcker, and R. Sloan. 1995. Annual bonus schemes and the manipulation of
earnings. Journal of Accounting and Economics 19 (1):29-74. Hoppe, F., and F. Moers. 2008. Bonus contracts, private information, and CEO turnover.
Working paper, Maastricht University. Hovakimian, A., G. Hovakimian., and H. Tehranian. 2004. Determinants of target capital
structure: the case of due debt and equity issues. Journal of Financial Economics 71 (3): 517-540.
———, T. Opler., and S. Titman. 2001. The debt-equity choice. Journal of Financial and
Quantitative Analysis 36 (1): 1-24. Hribar, P., N. Jenkins, and W. B. Johnson. 2006. Stock repurchases as an earnings management
device. Journal of Accounting and Economics 41(1-2): 3-27. Imhoff, E., and J. Thomas. 1988 Economic consequences of accounting standards: The lease
disclosure rule change. Journal of Accounting and Economics 10 (4): 277-310. Jensen, M., and W. Meckling. 1976. Theory of firm: Managerial behavior, agency costs and
capital structure. Journal of Financial Economics 3 (4): 305-360.
36
———, and K. Murphy. 1990. Performance pay and top-management incentives. Journal of
Political Economy 98 (2): 225-264. Kayhan, A., and S. Titman. 2007. Firms’ histories and their capital structures. Journal of
Financial Economics 83 (1): 1-32. Kalyta, P. 2009. Accounting discretion, horizon problem, and CEO retirement benefits. The Accounting Review (forthcoming). Kole, S. 1997. The complexity of compensation contracts. Journal of Financial Economics 43
(1): 79-104. Larcker, D. 2003. Discussion of “employee stock options, EPS dilution, and stock repurchases.”
Journal of Accounting and Economics 36 (1-3): 45-49. Maddala, G. 2001. Introduction to Econometrics. Chichester, England: Wiley. Marquardt, C., and C. Wiedman. 2005. Earnings management through transaction structuring:
Contingent convertible debt and diluted earnings per share. Journal of Accounting Research 43 (2): 205-243.
Matsumoto, D. 2002. Management’s incentives to avoid earnings surprises. The Accounting
Review 77(3): 483-514. Mehran, H. 1992. Executive incentive plans, corporate control, and capital structure. Journal of
Financial and Quantitative Analysis 27 (4): 539-560. Miller, M.H., 1977. Debt and taxes. Journal of Finance 32 (2):261-275 Mills, L. and K. Newberry. 2005. Evidence of off-balance-sheet financing from book-tax
differences. Journal of Accounting Research 43(2): 251-282. Modigliani, F., and M. Miller. 1958. The cost of capital, corporation finance and the theory of
investment. American Economic Review 48 (3): 261-297. Morgenson, G. 2008. If the pay fix is in, good luck finding it. The New York Times (September
07): BU1. Murphy, K. 1999. Executive compensation. In Handbook of Labor Economics, Vol. 3b, edited
by O. Ashenfelter, and D. Card, Chapter 38, 2485-2563. New York, NY: North-Holland.
Myers, S. 1984. The capital structure puzzle. Journal of Finance 39 (3): 575-592. Myers, J., L. Myers, and D. Skinner. 2007. Earnings momentum and earnings management.
37
Journal of Accounting Auditing and Finance 22 (2): 249-284. Rajan, R. G., and L. Zingales. 1995. What do we know about capital structure? Some evidence
from international Data. Journal of Finance 50 (5): 1421-1460. Servaes, H., and P. Tufano. 2006. The theory and practice of corporate capital structure.
Corporate Capital Structure, Deutsche Bank, ed. James Ballingall and Adrian Crockett (January).
Skinner, D. J. 1993. The investment opportunity set and accounting procedure choice:
Preliminary evidence. Journal of Accounting and Economics 16 (4):407-445. Smith, C., and Watts, R. 1992. The investment opportunity set and corporate financing, dividend,
and compensation policies. Journal of Financial Economics 32 (3): 263-292 Titman, S. 1984. The effect of capital structure on a firm’s liquidation decision. Journal of
Financial Economics 13 (1): 137-151.
———, and R. Wessels. 1988. The determinants of capital structure.” Journal of Finance 43 (1): 1-19.
Watts, R., and J. Zimmerman. 1986. Positive accounting theory. Prentice-Hall Welch, I. 2004. Capital structure and stock returns. Journal of Political Economy 112 (1): 106-
131. Yang, J., and S. Young. 2009. Stock repurchases and executive compensation contract design:
The role of earnings per share performance conditions. Working Paper, Towers Perrin, Lancaster University.
Yermack, D. 1995. Do corporations award CEO stock options effectively? Journal of Financial
Economics 39 (2-3): 237-269.
38
APPENDIX
EPS Dilution and Debt vs. Equity Issues
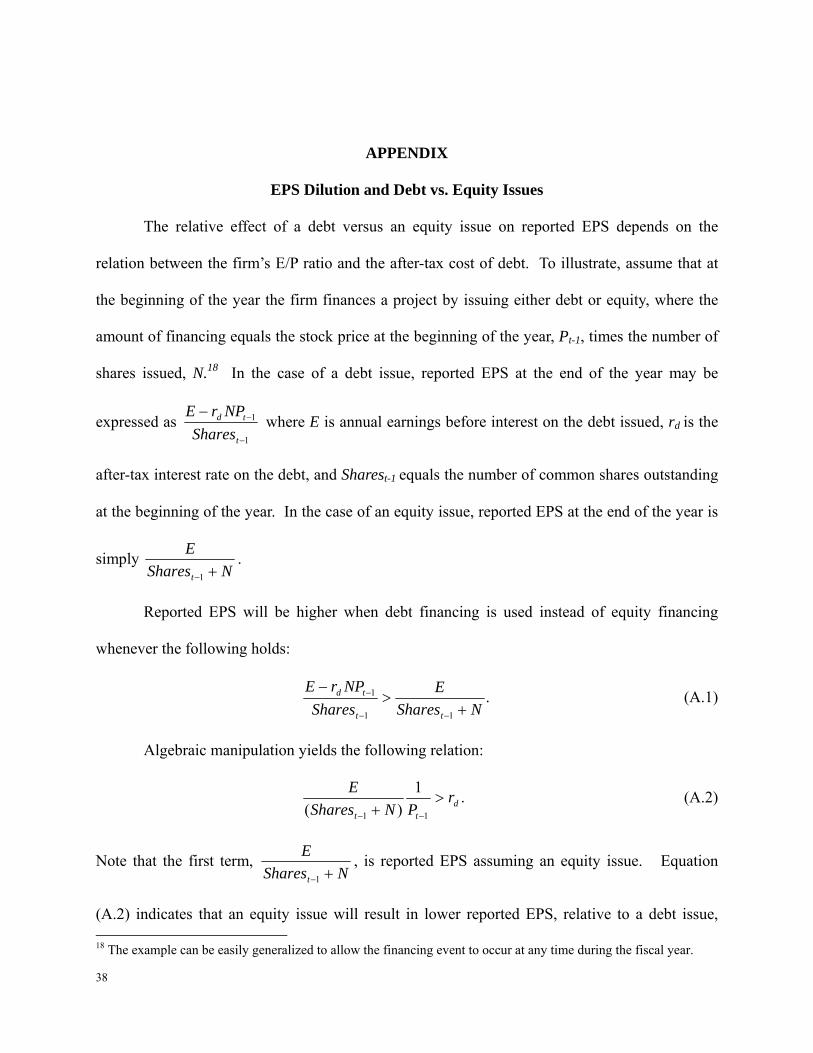
The relative effect of a debt versus an equity issue on reported EPS depends on the
relation between the firm’s E/P ratio and the after-tax cost of debt. To illustrate, assume that at
the beginning of the year the firm finances a project by issuing either debt or equity, where the
amount of financing equals the stock price at the beginning of the year, Pt-1, times the number of
shares issued, N.18 In the case of a debt issue, reported EPS at the end of the year may be
expressed as 1
1
−
−−
t
td
SharesNPrE
where E is annual earnings before interest on the debt issued, rd is the
after-tax interest rate on the debt, and Sharest-1 equals the number of common shares outstanding
at the beginning of the year. In the case of an equity issue, reported EPS at the end of the year is
simply NShares
E
t +−1
.
Reported EPS will be higher when debt financing is used instead of equity financing
whenever the following holds:
.11
1
NSharesE
SharesNPrE
tt
td
+>
−
−−
− (A.1)
Algebraic manipulation yields the following relation:
.1)( 11
dtt
rPNShares
E>
+ −−
(A.2)
Note that the first term, NShares
E
t +−1
, is reported EPS assuming an equity issue. Equation
(A.2) indicates that an equity issue will result in lower reported EPS, relative to a debt issue, 18 The example can be easily generalized to allow the financing event to occur at any time during the fiscal year.
39
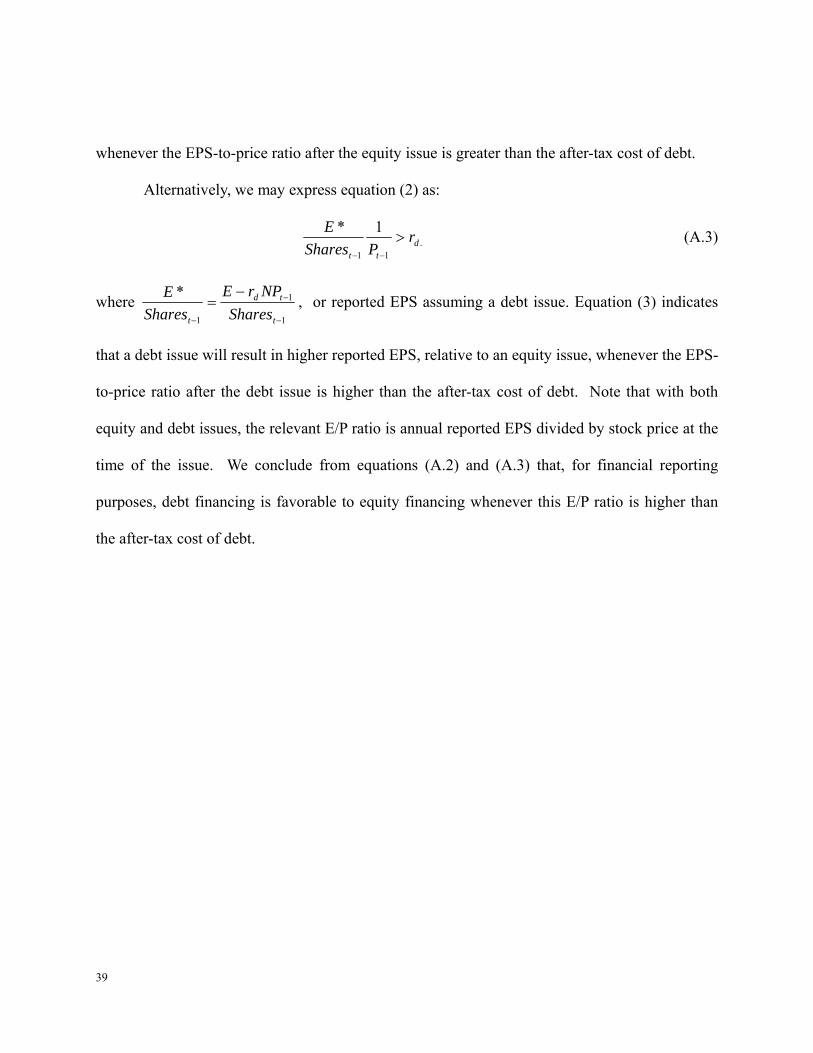
whenever the EPS-to-price ratio after the equity issue is greater than the after-tax cost of debt.
Alternatively, we may express equation (2) as:
.11
1*d
tt
rPShares
E>
−−
(A.3)
where 1
1
1
*
−
−
−
−=
t
td
t SharesNPrE
SharesE , or reported EPS assuming a debt issue. Equation (3) indicates
that a debt issue will result in higher reported EPS, relative to an equity issue, whenever the EPS-
to-price ratio after the debt issue is higher than the after-tax cost of debt. Note that with both
equity and debt issues, the relevant E/P ratio is annual reported EPS divided by stock price at the
time of the issue. We conclude from equations (A.2) and (A.3) that, for financial reporting
purposes, debt financing is favorable to equity financing whenever this E/P ratio is higher than
the after-tax cost of debt.
40
TABLE 1 Descriptive Statistics for Target Leverage Estimation Sample
This table presents descriptive statistics for a sample of 5,980 firm-years for the period 1993 to 2005. BOOK VALUE OF DEBT is defined as short-term debt plus long-term debt deflated by total assets. MB is the market-to-book ratio defined as (total assets – book value of equity + market value of equity) / total assets. RET is the split-and dividend-adjusted return from the beginning of the pre-issue year until close of the issue year. ROA is earnings before interest, taxes, depreciation, and amortization, divided by the book value of assets, averaged over the previous three-year period. NOLC is the net operating loss carry forward scaled by total assets. SIZE is the log of net sales. PPE is measured as (net property, plant, and equipment) / total assets. SG&A is (selling, general and administrative expenses)/sales. R&D is (research and development expenses)/sales. INDLEV (industry leverage) is the median leverage ratio for the same 3-digit SIC industry at the same year. BONUSSHARE is defined as the average of (bonus / shareholders’ equity) for the top five executives. EQUITYSHARE is defined as the average of (new grants of stock options and restricted stocks / shareholders’ equity) for the top five executives. Variable Mean STD Q1 Median Q3 BOOK VALUE of DEBT 0.173 0.148 0.024 0.158 0.280 MB 2.318 1.720 1.338 1.812 2.670 RET 0.452 0.994 -0.118 0.246 0.707 ROA 0.154 0.093 0.107 0.154 0.208 NOLC 0.076 0.294 0.000 0.000 0.036 SIZE 6.818 1.492 5.766 6.741 7.840 PPE 0.267 0.177 0.136 0.228 0.353 SG&A 0.303 0.404 0.158 0.243 0.367 R&D 0.079 0.225 0.006 0.029 0.096 INDLEV 0.152 0.112 0.050 0.138 0.241 BONUSSHARE (%) 0.116 0.148 0.010 0.049 0.149 EQUITYSHARE (%) 0.286 1.630 0.047 0.119 0.269
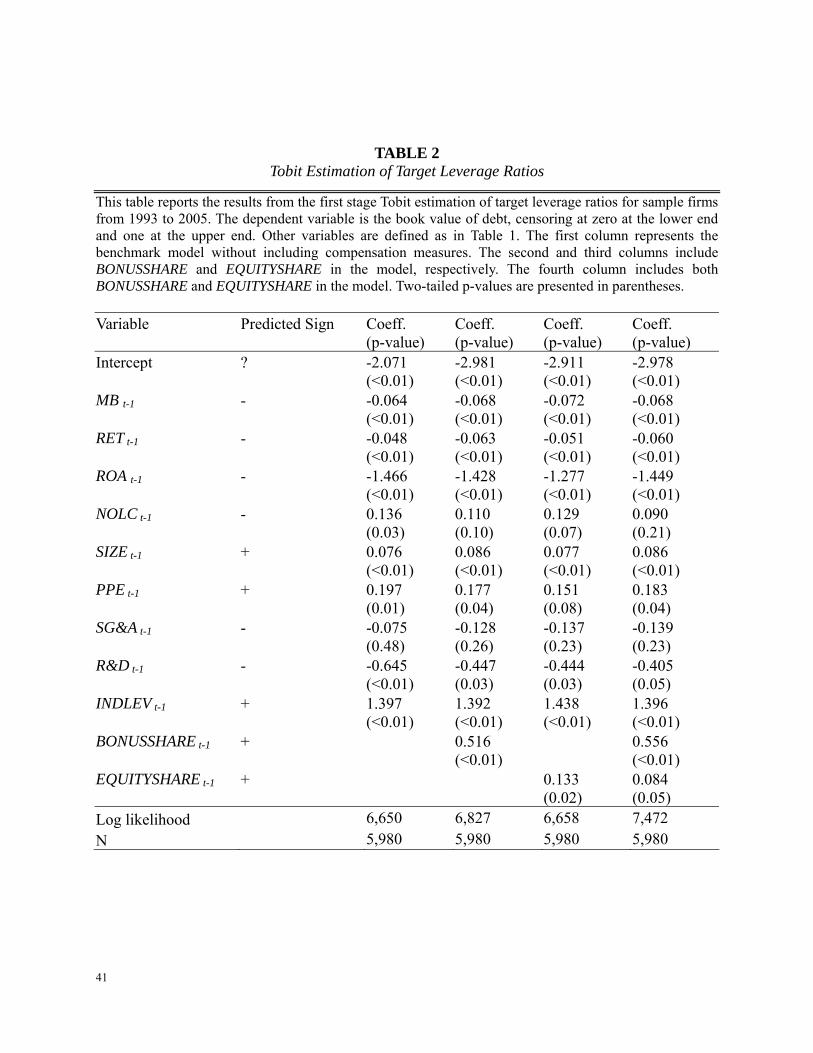
41
TABLE 2 Tobit Estimation of Target Leverage Ratios
This table reports the results from the first stage Tobit estimation of target leverage ratios for sample firms from 1993 to 2005. The dependent variable is the book value of debt, censoring at zero at the lower end and one at the upper end. Other variables are defined as in Table 1. The first column represents the benchmark model without including compensation measures. The second and third columns include BONUSSHARE and EQUITYSHARE in the model, respectively. The fourth column includes both BONUSSHARE and EQUITYSHARE in the model. Two-tailed p-values are presented in parentheses. Variable Predicted Sign Coeff.
(p-value) Coeff. (p-value)
Coeff. (p-value)
Coeff. (p-value)
Intercept
?
-2.071 (<0.01)
-2.981 (<0.01)
-2.911 (<0.01)
-2.978 (<0.01)
MB t-1
-
-0.064 (<0.01)
-0.068 (<0.01)
-0.072 (<0.01)
-0.068 (<0.01)
RET t-1
-
-0.048 (<0.01)
-0.063 (<0.01)
-0.051 (<0.01)
-0.060 (<0.01)
ROA t-1
-
-1.466 (<0.01)
-1.428 (<0.01)
-1.277 (<0.01)
-1.449 (<0.01)
NOLC t-1
-
0.136 (0.03)
0.110 (0.10)
0.129 (0.07)
0.090 (0.21)
SIZE t-1
+
0.076 (<0.01)
0.086 (<0.01)
0.077 (<0.01)
0.086 (<0.01)
PPE t-1
+
0.197 (0.01)
0.177 (0.04)
0.151 (0.08)
0.183 (0.04)
SG&A t-1
-
-0.075 (0.48)
-0.128 (0.26)
-0.137 (0.23)
-0.139 (0.23)
R&D t-1
-
-0.645 (<0.01)
-0.447 (0.03)
-0.444 (0.03)
-0.405 (0.05)
INDLEV t-1
+
1.397 (<0.01)
1.392 (<0.01)
1.438 (<0.01)
1.396 (<0.01)
BONUSSHARE t-1
+
0.516 (<0.01)
0.556 (<0.01)
EQUITYSHARE t-1
+
0.133 (0.02)
0.084 (0.05)
Log likelihood 6,650 6,827 6,658 7,472 N 5,980 5,980 5,980 5,980
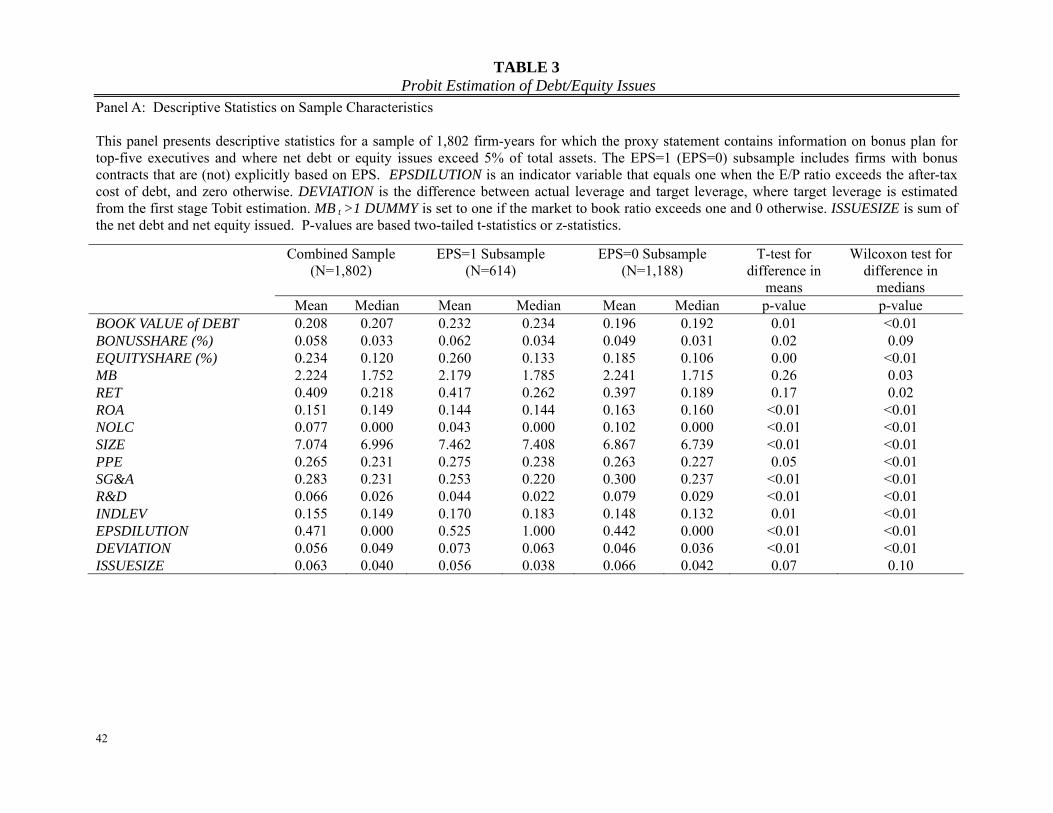
42
TABLE 3 Probit Estimation of Debt/Equity Issues
Panel A: Descriptive Statistics on Sample Characteristics This panel presents descriptive statistics for a sample of 1,802 firm-years for which the proxy statement contains information on bonus plan for top-five executives and where net debt or equity issues exceed 5% of total assets. The EPS=1 (EPS=0) subsample includes firms with bonus contracts that are (not) explicitly based on EPS. EPSDILUTION is an indicator variable that equals one when the E/P ratio exceeds the after-tax cost of debt, and zero otherwise. DEVIATION is the difference between actual leverage and target leverage, where target leverage is estimated from the first stage Tobit estimation. MB t >1 DUMMY is set to one if the market to book ratio exceeds one and 0 otherwise. ISSUESIZE is sum of the net debt and net equity issued. P-values are based two-tailed t-statistics or z-statistics.
Combined Sample (N=1,802)
EPS=1 Subsample (N=614)
EPS=0 Subsample (N=1,188)
T-test for difference in
means
Wilcoxon test for difference in
medians Mean Median Mean Median Mean Median p-value p-value BOOK VALUE of DEBT 0.208 0.207 0.232 0.234 0.196 0.192 0.01 <0.01 BONUSSHARE (%) 0.058 0.033 0.062 0.034 0.049 0.031 0.02 0.09 EQUITYSHARE (%) 0.234 0.120 0.260 0.133 0.185 0.106 0.00 <0.01 MB 2.224 1.752 2.179 1.785 2.241 1.715 0.26 0.03 RET 0.409 0.218 0.417 0.262 0.397 0.189 0.17 0.02 ROA 0.151 0.149 0.144 0.144 0.163 0.160 <0.01 <0.01 NOLC 0.077 0.000 0.043 0.000 0.102 0.000 <0.01 <0.01 SIZE 7.074 6.996 7.462 7.408 6.867 6.739 <0.01 <0.01 PPE 0.265 0.231 0.275 0.238 0.263 0.227 0.05 <0.01 SG&A 0.283 0.231 0.253 0.220 0.300 0.237 <0.01 <0.01 R&D 0.066 0.026 0.044 0.022 0.079 0.029 <0.01 <0.01 INDLEV 0.155 0.149 0.170 0.183 0.148 0.132 0.01 <0.01 EPSDILUTION 0.471 0.000 0.525 1.000 0.442 0.000 <0.01 <0.01 DEVIATION 0.056 0.049 0.073 0.063 0.046 0.036 <0.01 <0.01 ISSUESIZE 0.063 0.040 0.056 0.038 0.066 0.042 0.07 0.10

43
TABLE 3 - Continued Panel B: Second Stage Probit Estimation of Debt vs. Equity Issues This panel reports the results for the second stage probit estimation of debt vs equity issues. The dependent variable equals 1 when debt is issued and 0 when equity is issued. BONUS*EPSDILUTION and EQUITY*EPSDILUTION are the interaction of EPSDILUTION with BONUSSHARE and EQUITYSHARE, respectively. DEVIATION is the difference between actual leverage and target leverage, where target leverage is estimated from the first stage Tobit estimation. MB t >1 DUMMY is set to one if the market to book ratio exceeds one and 0 otherwise. ISSUESIZE is sum of the net debt and net equity issued. Other variables are defined in Table 1. Two-tailed p-values are presented.
Combined Sample EPS=1 Subsample EPS=0 Subsample Coefficient p-value Coefficient p-value Coefficient p-value
Intercept 1.564 <0.01 2.057 <0.01 1.084 <0.01
EPS t 0.256 <0.01
EPSDILUTION t 0.323 <0.01 0.672 <0.01 0.138 0.23
EPS*EPSDILUTION t 0.159 <0.01
BONUSSHARE t 0.159 <0.01 0.110 0.19
EQUITYSHARE t 0.123 <0.01 0.153 <0.01
BONUSSHARE*EPSDILUTION t 0.476 0.02 -0.093 0.13
EQUITYSHARE*EPSDILUTION t 0.122 0.53 0.083 0.16
DEVIATION t -3.111 <0.01 -3.670 <0.01 -3.057 <0.01
MB t -0.093 0.02 -0.069 0.39 -0.061 0.23
RET t -0.201 <0.01 -0.185 <0.01 -0.204 <0.01
ROA t -3.930 <0.01 -3.294 <0.01 -2.494 <0.01
NOLC t -0.176 0.35 -0.275 0.63 -0.041 0.83
MB t > 1 DUMMY -0.062 0.69 -0.093 0.76 -0.050 0.79
ISSUESIZE t -1.164 <0.01 -1.817 <0.01 -1.243 <0.01
Pseudo-R2 0.287 0.362 0.299
N 1,802 614 1,188
N (debt issues) 794 (44.1%) 414 (67.4%) 380 (31.9%)
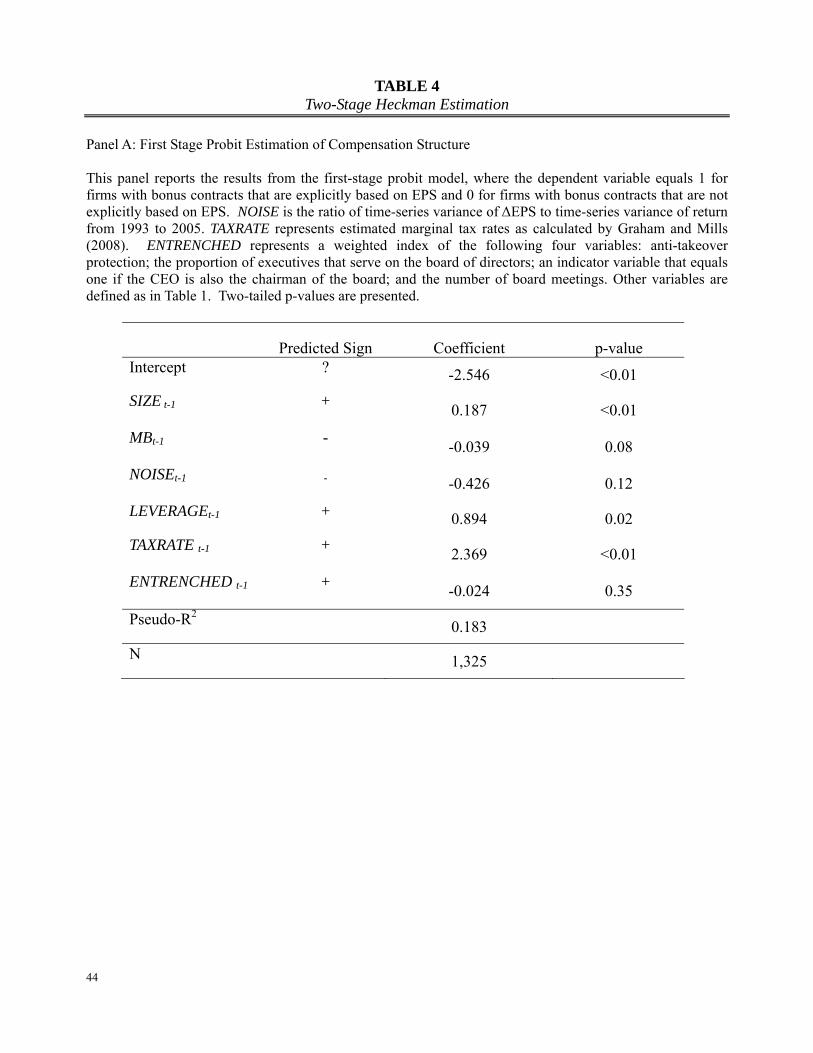
44
TABLE 4 Two-Stage Heckman Estimation
Panel A: First Stage Probit Estimation of Compensation Structure This panel reports the results from the first-stage probit model, where the dependent variable equals 1 for firms with bonus contracts that are explicitly based on EPS and 0 for firms with bonus contracts that are not explicitly based on EPS. NOISE is the ratio of time-series variance of ΔEPS to time-series variance of return from 1993 to 2005. TAXRATE represents estimated marginal tax rates as calculated by Graham and Mills (2008). ENTRENCHED represents a weighted index of the following four variables: anti-takeover protection; the proportion of executives that serve on the board of directors; an indicator variable that equals one if the CEO is also the chairman of the board; and the number of board meetings. Other variables are defined as in Table 1. Two-tailed p-values are presented.
Predicted Sign Coefficient p-value Intercept ? -2.546 <0.01 SIZE t-1
+ 0.187 <0.01
MBt-1
- -0.039 0.08
NOISEt-1
- -0.426 0.12
LEVERAGEt-1 + 0.894 0.02 TAXRATE t-1
+ 2.369 <0.01
ENTRENCHED t-1
+ -0.024 0.35
Pseudo-R2 0.183
N 1,325
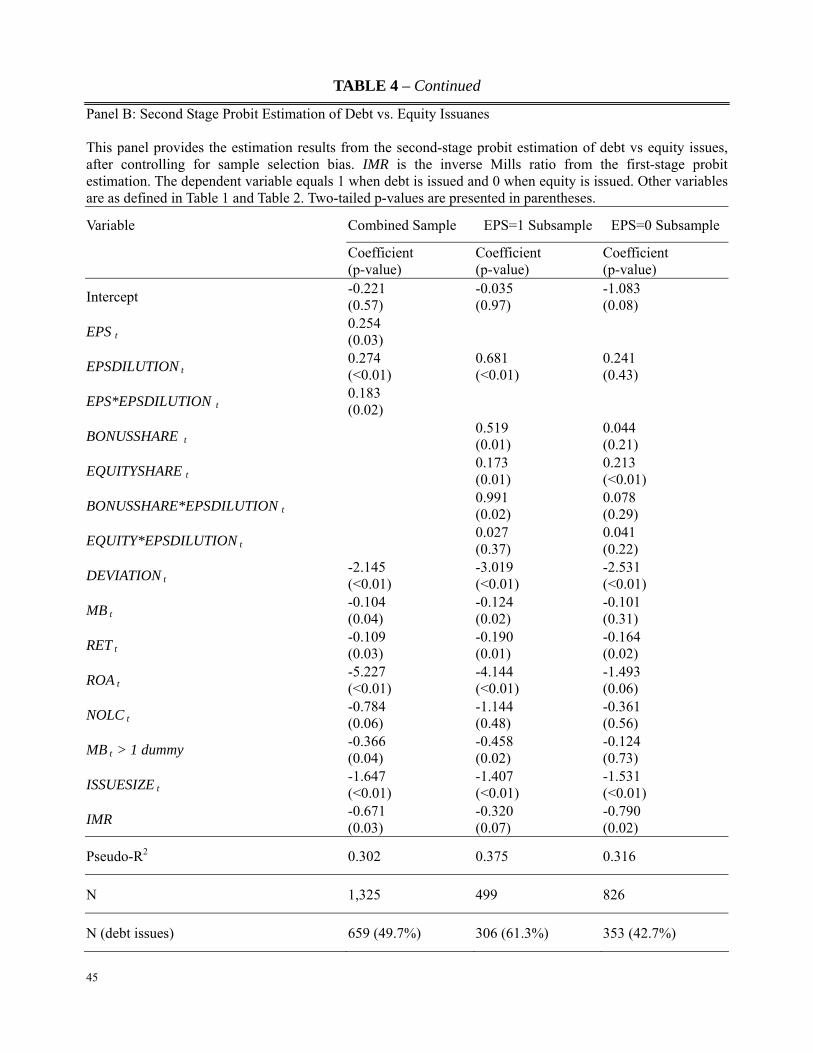
45
TABLE 4 – Continued
Panel B: Second Stage Probit Estimation of Debt vs. Equity Issuanes This panel provides the estimation results from the second-stage probit estimation of debt vs equity issues, after controlling for sample selection bias. IMR is the inverse Mills ratio from the first-stage probit estimation. The dependent variable equals 1 when debt is issued and 0 when equity is issued. Other variables are as defined in Table 1 and Table 2. Two-tailed p-values are presented in parentheses.
Variable Combined Sample EPS=1 Subsample EPS=0 Subsample
Coefficient (p-value)
Coefficient (p-value)
Coefficient (p-value)
Intercept -0.221 (0.57)
-0.035 (0.97)
-1.083 (0.08)
EPS t 0.254 (0.03)
EPSDILUTION t 0.274 (<0.01)
0.681 (<0.01)
0.241 (0.43)
EPS*EPSDILUTION t 0.183 (0.02)
BONUSSHARE t
0.519 (0.01)
0.044 (0.21)
EQUITYSHARE t 0.173 (0.01)
0.213 (<0.01)
BONUSSHARE*EPSDILUTION t 0.991 (0.02)
0.078 (0.29)
EQUITY*EPSDILUTION t 0.027 (0.37)
0.041 (0.22)
DEVIATION t -2.145 (<0.01)
-3.019 (<0.01)
-2.531 (<0.01)
MB t -0.104 (0.04)
-0.124 (0.02)
-0.101 (0.31)
RET t -0.109 (0.03)
-0.190 (0.01)
-0.164 (0.02)
ROA t -5.227 (<0.01)
-4.144 (<0.01)
-1.493 (0.06)
NOLC t -0.784 (0.06)
-1.144 (0.48)
-0.361 (0.56)
MB t > 1 dummy -0.366 (0.04)
-0.458 (0.02)
-0.124 (0.73)
ISSUESIZE t -1.647 (<0.01)
-1.407 (<0.01)
-1.531 (<0.01)
IMR -0.671 (0.03)
-0.320 (0.07)
-0.790 (0.02)
Pseudo-R2 0.302 0.375 0.316
N 1,325 499 826
N (debt issues) 659 (49.7%) 306 (61.3%) 353 (42.7%)
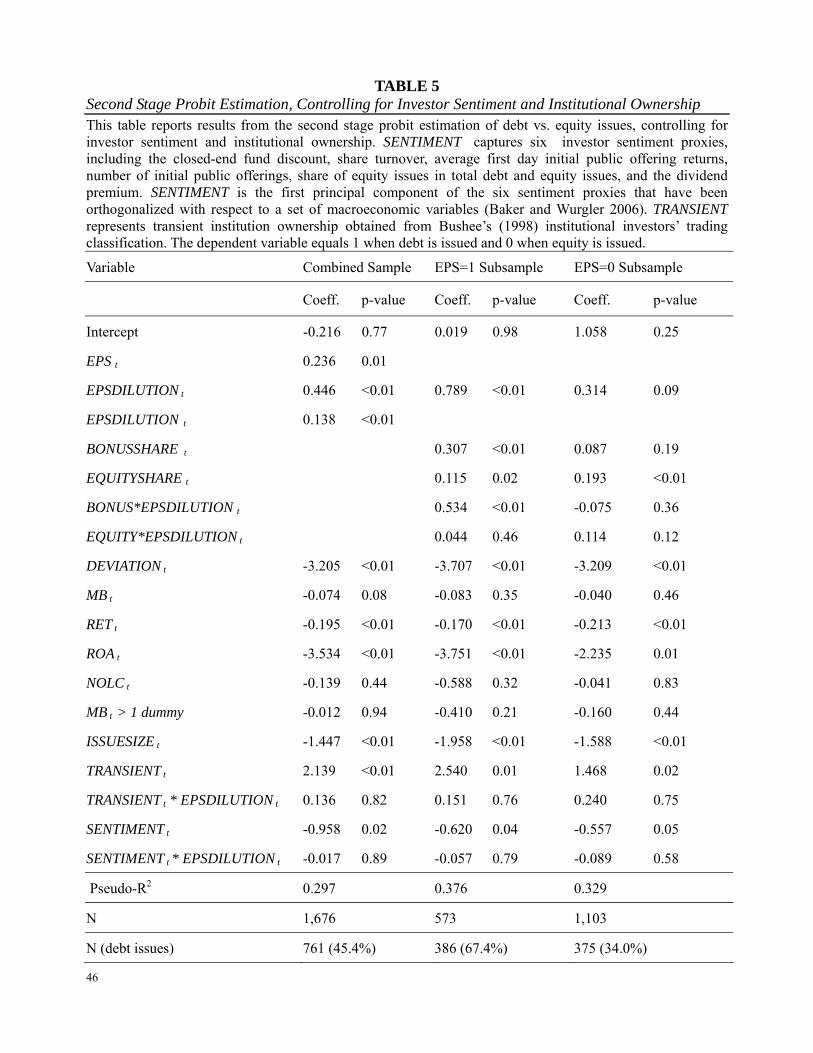
46
TABLE 5 Second Stage Probit Estimation, Controlling for Investor Sentiment and Institutional Ownership This table reports results from the second stage probit estimation of debt vs. equity issues, controlling for investor sentiment and institutional ownership. SENTIMENT captures six investor sentiment proxies, including the closed-end fund discount, share turnover, average first day initial public offering returns, number of initial public offerings, share of equity issues in total debt and equity issues, and the dividend premium. SENTIMENT is the first principal component of the six sentiment proxies that have been orthogonalized with respect to a set of macroeconomic variables (Baker and Wurgler 2006). TRANSIENT represents transient institution ownership obtained from Bushee’s (1998) institutional investors’ trading classification. The dependent variable equals 1 when debt is issued and 0 when equity is issued.
Variable Combined Sample EPS=1 Subsample EPS=0 Subsample
Coeff. p-value Coeff. p-value Coeff. p-value
Intercept -0.216 0.77 0.019 0.98 1.058 0.25
EPS t 0.236 0.01
EPSDILUTION t 0.446 <0.01 0.789 <0.01 0.314 0.09
EPSDILUTION t 0.138 <0.01
BONUSSHARE t 0.307 <0.01 0.087 0.19
EQUITYSHARE t 0.115 0.02 0.193 <0.01
BONUS*EPSDILUTION t 0.534 <0.01 -0.075 0.36
EQUITY*EPSDILUTION t 0.044 0.46 0.114 0.12
DEVIATION t -3.205 <0.01 -3.707 <0.01 -3.209 <0.01
MB t -0.074 0.08 -0.083 0.35 -0.040 0.46
RET t -0.195 <0.01 -0.170 <0.01 -0.213 <0.01
ROA t -3.534 <0.01 -3.751 <0.01 -2.235 0.01
NOLC t -0.139 0.44 -0.588 0.32 -0.041 0.83
MB t > 1 dummy -0.012 0.94 -0.410 0.21 -0.160 0.44
ISSUESIZE t -1.447 <0.01 -1.958 <0.01 -1.588 <0.01
TRANSIENT t 2.139 <0.01 2.540 0.01 1.468 0.02
TRANSIENT t * EPSDILUTION t 0.136 0.82 0.151 0.76 0.240 0.75
SENTIMENT t -0.958 0.02 -0.620 0.04 -0.557 0.05
SENTIMENT t * EPSDILUTION t -0.017 0.89 -0.057 0.79 -0.089 0.58
Pseudo-R2 0.297 0.376 0.329
N 1,676 573 1,103
N (debt issues) 761 (45.4%) 386 (67.4%) 375 (34.0%)
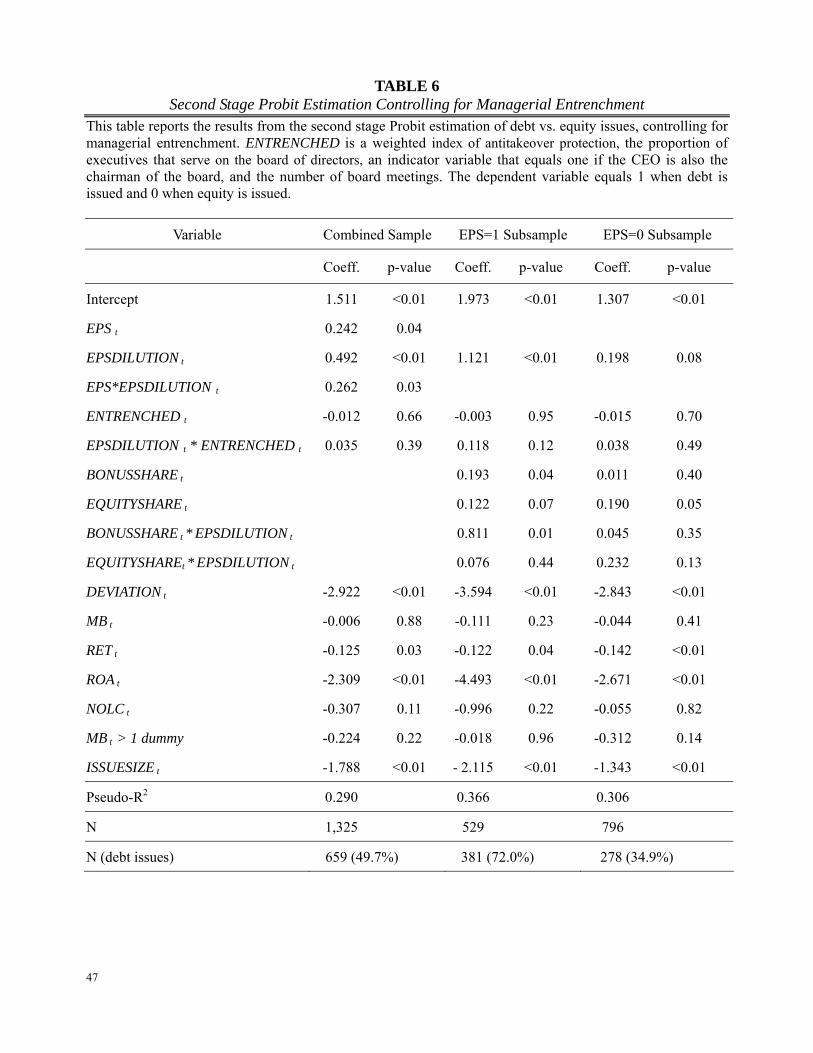
47
TABLE 6 Second Stage Probit Estimation Controlling for Managerial Entrenchment
This table reports the results from the second stage Probit estimation of debt vs. equity issues, controlling for managerial entrenchment. ENTRENCHED is a weighted index of antitakeover protection, the proportion of executives that serve on the board of directors, an indicator variable that equals one if the CEO is also the chairman of the board, and the number of board meetings. The dependent variable equals 1 when debt is issued and 0 when equity is issued.
Variable Combined Sample EPS=1 Subsample EPS=0 Subsample
Coeff. p-value Coeff. p-value Coeff. p-value
Intercept 1.511 <0.01 1.973 <0.01 1.307 <0.01
EPS t 0.242 0.04
EPSDILUTION t 0.492 <0.01 1.121 <0.01 0.198 0.08
EPS*EPSDILUTION t 0.262 0.03
ENTRENCHED t -0.012 0.66 -0.003 0.95 -0.015 0.70
EPSDILUTION t * ENTRENCHED t 0.035 0.39 0.118 0.12 0.038 0.49
BONUSSHARE t 0.193 0.04 0.011 0.40
EQUITYSHARE t 0.122 0.07 0.190 0.05
BONUSSHARE t * EPSDILUTION t 0.811 0.01 0.045 0.35
EQUITYSHAREt * EPSDILUTION t 0.076 0.44 0.232 0.13
DEVIATION t -2.922 <0.01 -3.594 <0.01 -2.843 <0.01
MB t -0.006 0.88 -0.111 0.23 -0.044 0.41
RET t -0.125 0.03 -0.122 0.04 -0.142 <0.01
ROA t -2.309 <0.01 -4.493 <0.01 -2.671 <0.01
NOLC t -0.307 0.11 -0.996 0.22 -0.055 0.82
MB t > 1 dummy -0.224 0.22 -0.018 0.96 -0.312 0.14
ISSUESIZE t -1.788 <0.01 - 2.115 <0.01 -1.343 <0.01
Pseudo-R2 0.290 0.366 0.306
N 1,325 529 796
N (debt issues) 659 (49.7%) 381 (72.0%) 278 (34.9%)