Embed Size (px)
Citation preview
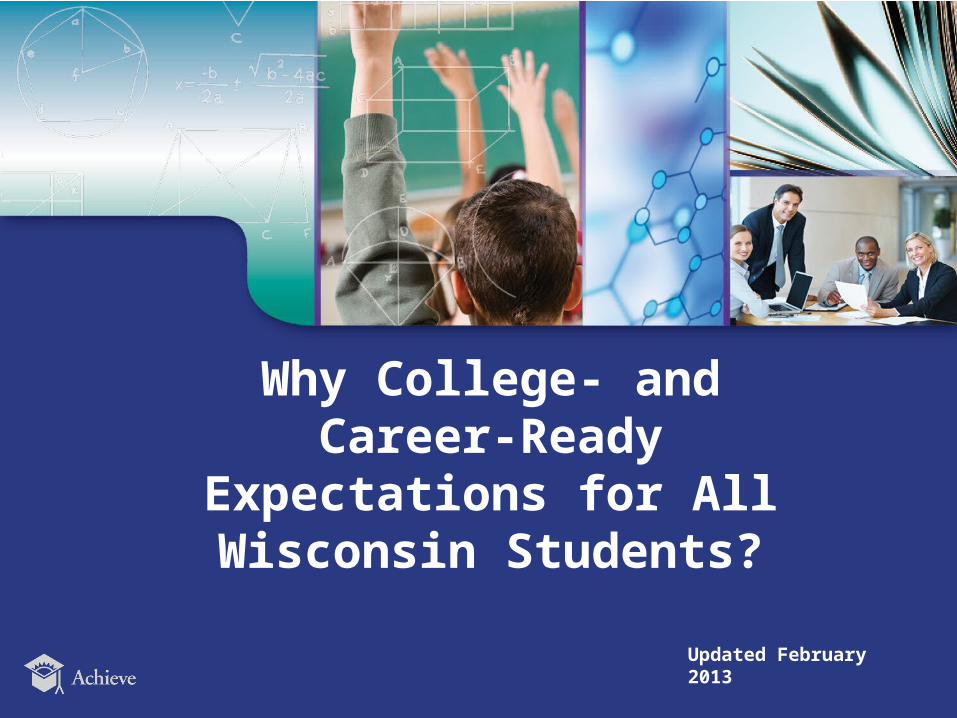
Why College- and Career-Ready Expectations for All
Wisconsin Students?
Updated February 2013
2BUSINESS
RESOURCES
FOR A
COLLEGE- AND
CAREER READY
AMERICA
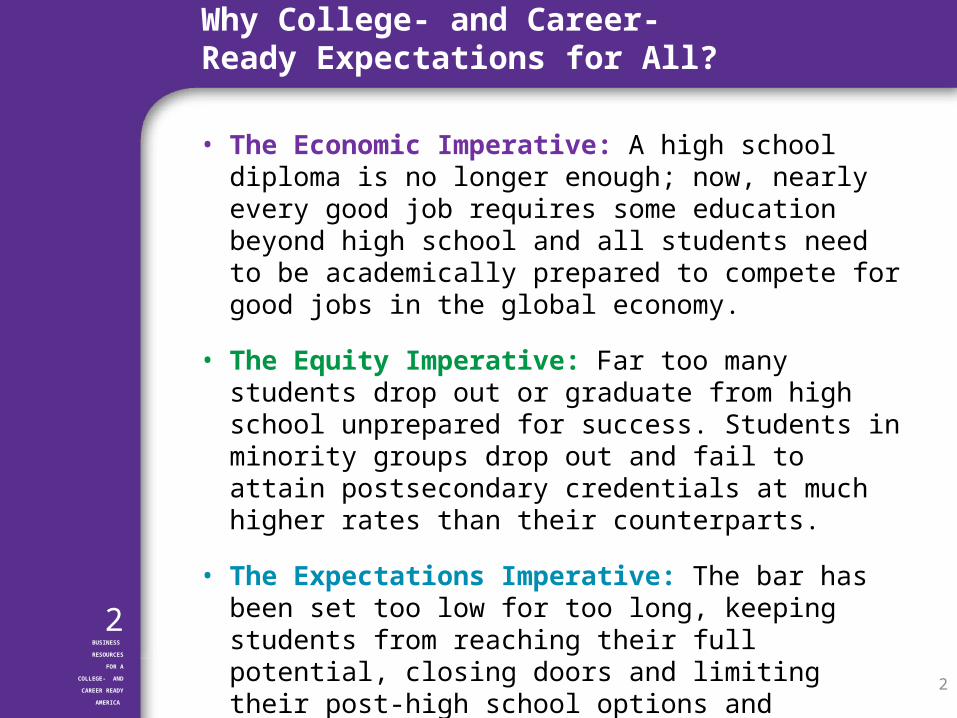
• The Economic Imperative: A high school diploma is no longer enough; now, nearly every good job requires some education beyond high school and all students need to be academically prepared to compete for good jobs in the global economy.
• The Equity Imperative: Far too many students drop out or graduate from high school unprepared for success. Students in minority groups drop out and fail to attain postsecondary credentials at much higher rates than their counterparts.
• The Expectations Imperative: The bar has been set too low for too long, keeping students from reaching their full potential, closing doors and limiting their post-high school options and opportunities.
2
Why College- and Career-Ready Expectations for All?
3BUSINESS
RESOURCES
FOR A
COLLEGE- AND
CAREER READY
AMERICA
3
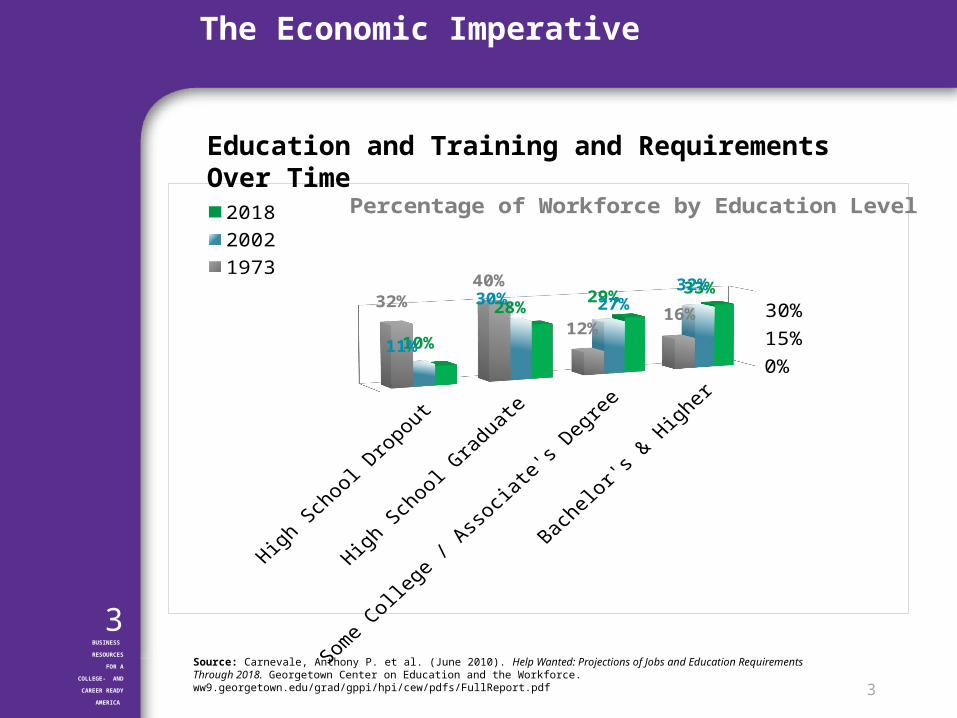
Source: Carnevale, Anthony P. et al. (June 2010). Help Wanted: Projections of Jobs and Education Requirements Through 2018. Georgetown Center on Education and the Workforce. ww9.georgetown.edu/grad/gppi/hpi/cew/pdfs/FullReport.pdf
Bachelor's & HigherSome College
/ Associate's Degree
High School GraduateHigh School
Dropout
0%
5%
10%
15%
20%
25%
30%
35%
40%33%
29%28%
10%
32%
27%30%
11%
16%
12%
40%
32%
Percentage of Workforce by Education Level2018
2002
1973
Education and Training and Requirements Over Time
The Economic Imperative
4BUSINESS
RESOURCES
FOR A
COLLEGE- AND
CAREER READY
AMERICA
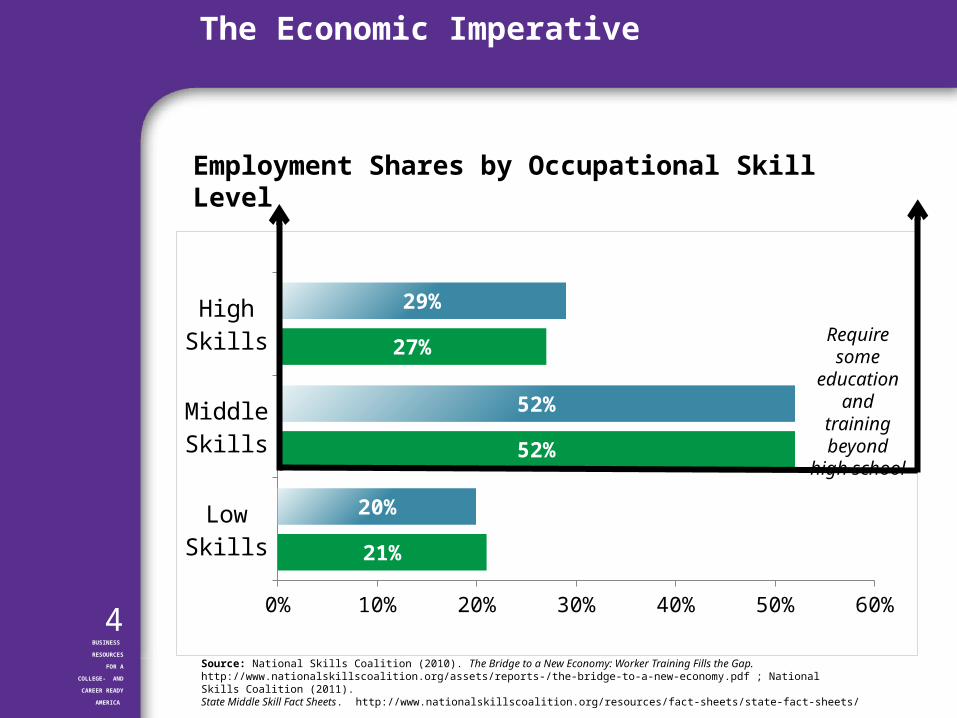
Source: National Skills Coalition (2010). The Bridge to a New Economy: Worker Training Fills the Gap. http://www.nationalskillscoalition.org/assets/reports-/the-bridge-to-a-new-economy.pdf ; National Skills Coalition (2011). State Middle Skill Fact Sheets. http://www.nationalskillscoalition.org/resources/fact-sheets/state-fact-sheets/
Low Skills
Middle Skills
High Skills
0% 10% 20% 30% 40% 50% 60%
21%
52%
27%
20%
52%
29%
U.S. Wisconsin
Require some
education and training
beyond high school
Employment Shares by Occupational Skill Level
The Economic Imperative
5BUSINESS
RESOURCES
FOR A
COLLEGE- AND
CAREER READY
AMERICA
The Economic Imperative
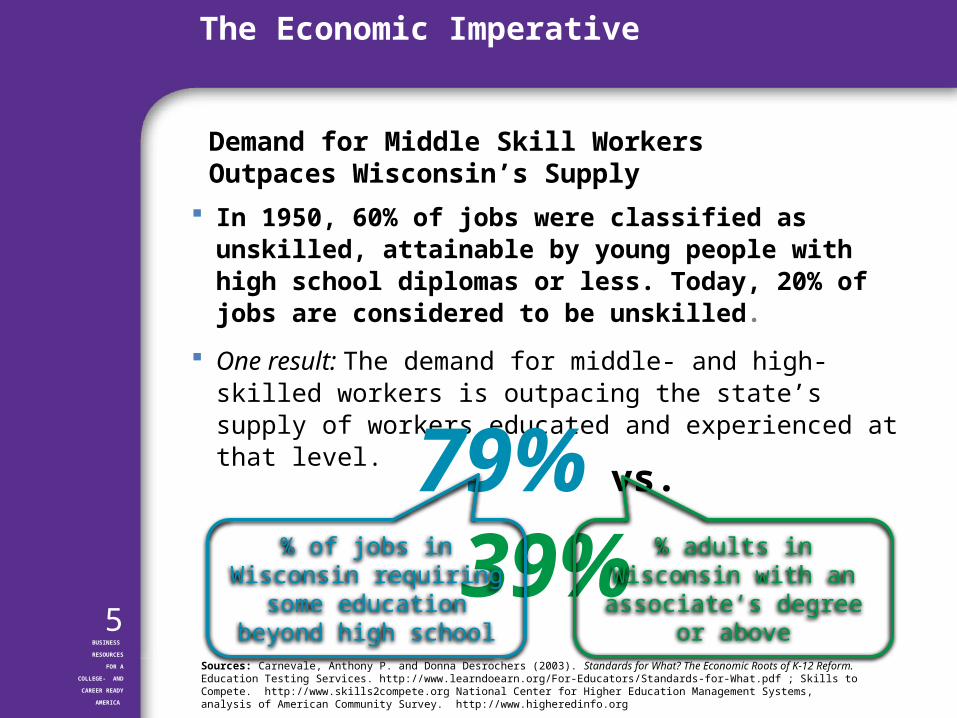
In 1950, 60% of jobs were classified as unskilled, attainable by young people with high school diplomas or less. Today, 20% of jobs are considered to be unskilled.
One result: The demand for middle- and high-skilled workers is outpacing the state’s supply of workers educated and experienced at that level.
Sources: Carnevale, Anthony P. and Donna Desrochers (2003). Standards for What? The Economic Roots of K-12 Reform. Education Testing Services. http://www.learndoearn.org/For-Educators/Standards-for-What.pdf ; Skills to Compete. http://www.skills2compete.org National Center for Higher Education Management Systems, analysis of American Community Survey. http://www.higheredinfo.org
79% vs.
39%% of jobs in Wisconsin requiring some education
beyond high school
% adults in Wisconsin with an associate’s degree or
above
Demand for Middle Skill Workers Outpaces Wisconsin’s Supply
6BUSINESS
RESOURCES
FOR A
COLLEGE- AND
CAREER READY
AMERICA
Iceland
U.K.
Netherlands
Norway
Ireland
Denmark
Germany
Israel
Canada
Poland
Korea
U.S.
Wisconsin
0 20 40 60 80 100
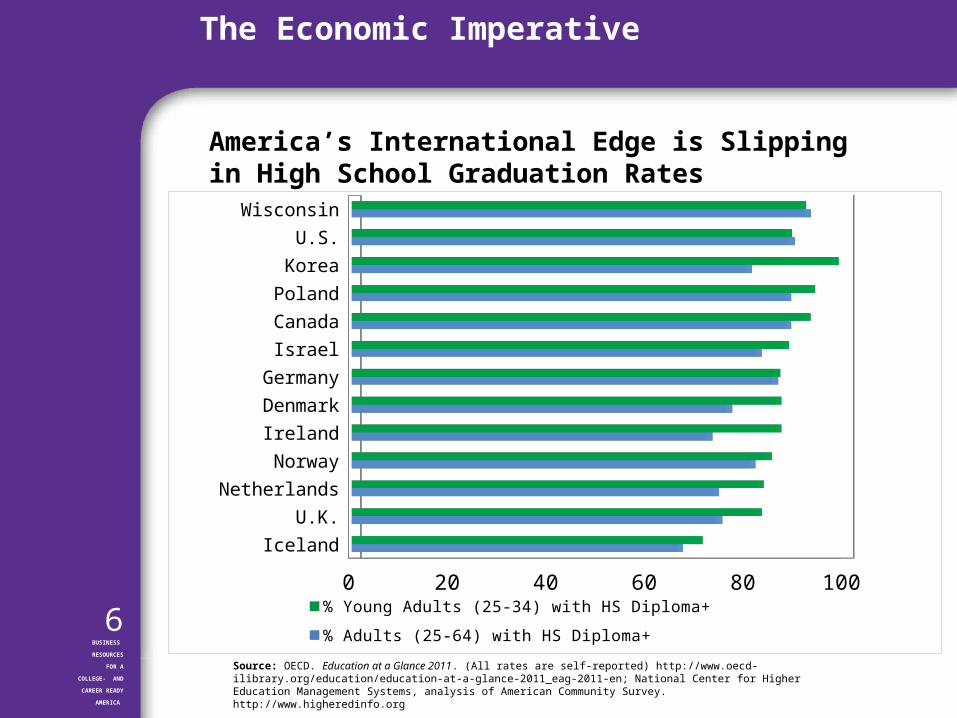
% Young Adults (25-34) with HS Diploma+ % Adults (25-64) with HS Diploma+
Source: OECD. Education at a Glance 2011. (All rates are self-reported) http://www.oecd-ilibrary.org/education/education-at-a-glance-2011_eag-2011-en; National Center for Higher Education Management Systems, analysis of American Community Survey. http://www.higheredinfo.org
America’s International Edge is Slipping in High School Graduation Rates
The Economic Imperative
7BUSINESS
RESOURCES
FOR A
COLLEGE- AND
CAREER READY
AMERICA
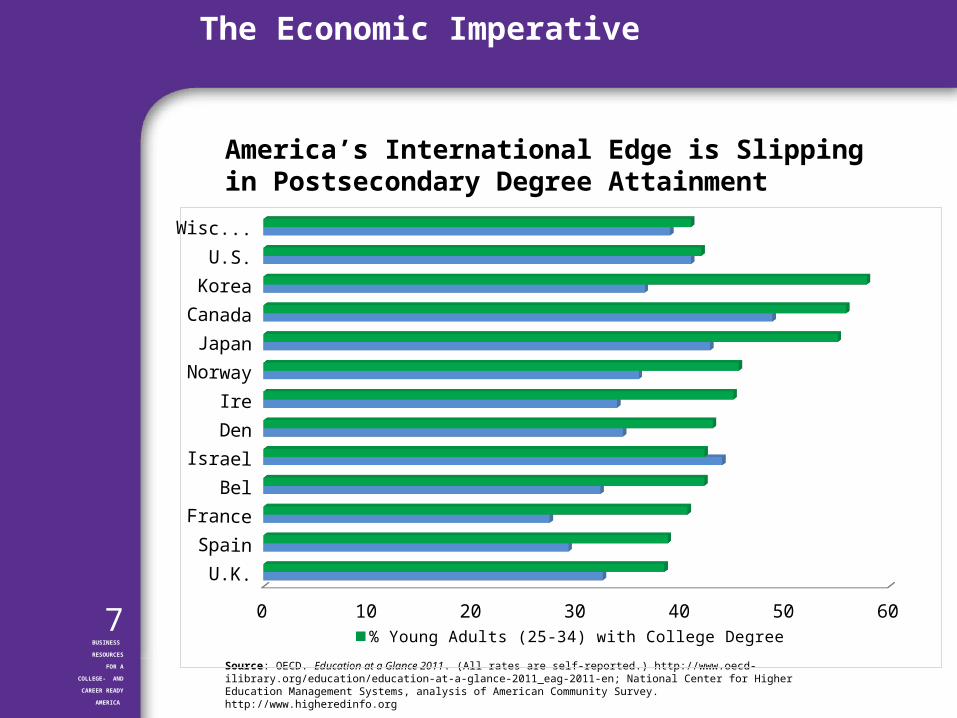
Source: OECD. Education at a Glance 2011. (All rates are self-reported.) http://www.oecd-ilibrary.org/education/education-at-a-glance-2011_eag-2011-en; National Center for Higher Education Management Systems, analysis of American Community Survey. http://www.higheredinfo.org
U.K.
Spain
France
Belgium
Israel
Den
Ireland
Norway
Japan
Canada
Korea
U.S.
Wisco...
0 10 20 30 40 50 60
% Young Adults (25-34) with College Degree % Adults (25-64) with College Degree
America’s International Edge is Slipping in Postsecondary Degree Attainment
The Economic Imperative
8BUSINESS
RESOURCES
FOR A
COLLEGE- AND
CAREER READY
AMERICA
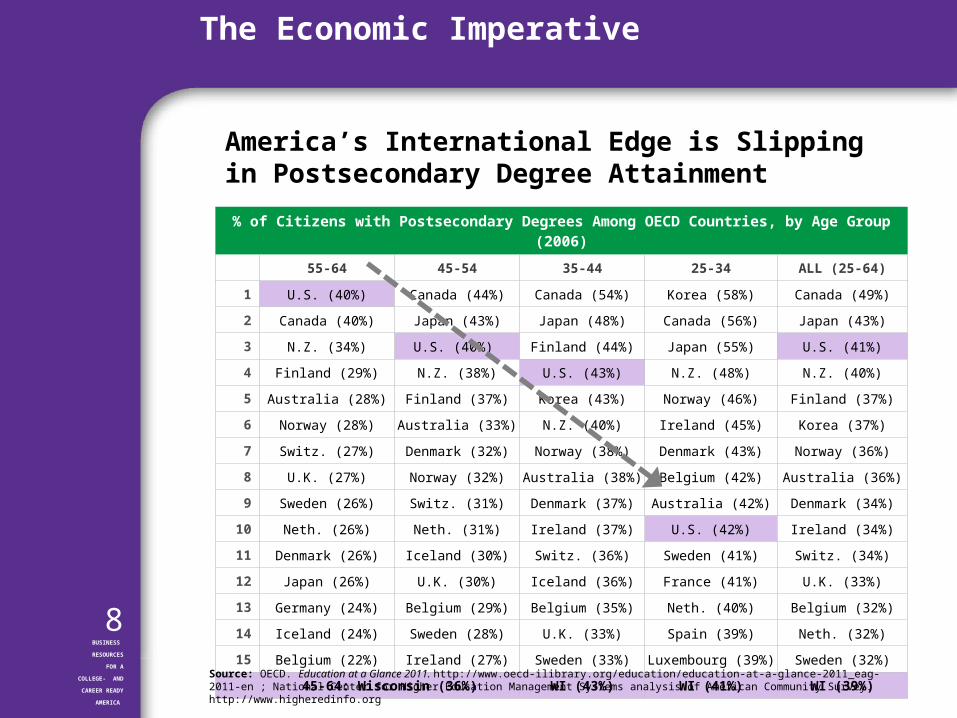
% of Citizens with Postsecondary Degrees Among OECD Countries, by Age Group (2006)
55-64 45-54 35-44 25-34 ALL (25-64)
1 U.S. (40%) Canada (44%) Canada (54%) Korea (58%) Canada (49%)
2 Canada (40%) Japan (43%) Japan (48%) Canada (56%) Japan (43%)
3 N.Z. (34%) U.S. (40%) Finland (44%) Japan (55%) U.S. (41%)
4 Finland (29%) N.Z. (38%) U.S. (43%) N.Z. (48%) N.Z. (40%)
5 Australia (28%) Finland (37%) Korea (43%) Norway (46%) Finland (37%)
6 Norway (28%) Australia (33%) N.Z. (40%) Ireland (45%) Korea (37%)
7 Switz. (27%) Denmark (32%) Norway (38%) Denmark (43%) Norway (36%)
8 U.K. (27%) Norway (32%) Australia (38%) Belgium (42%) Australia (36%)
9 Sweden (26%) Switz. (31%) Denmark (37%) Australia (42%) Denmark (34%)
10 Neth. (26%) Neth. (31%) Ireland (37%) U.S. (42%) Ireland (34%)
11 Denmark (26%) Iceland (30%) Switz. (36%) Sweden (41%) Switz. (34%)
12 Japan (26%) U.K. (30%) Iceland (36%) France (41%) U.K. (33%)
13 Germany (24%) Belgium (29%) Belgium (35%) Neth. (40%) Belgium (32%)
14 Iceland (24%) Sweden (28%) U.K. (33%) Spain (39%) Neth. (32%)
15 Belgium (22%) Ireland (27%) Sweden (33%) Luxembourg (39%) Sweden (32%)
45-64: Wisconsin (36%) WI (43%) WI (41%) WI (39%)
Source: OECD. Education at a Glance 2011. http://www.oecd-ilibrary.org/education/education-at-a-glance-2011_eag-2011-en ; National Center for Higher Education Management Systems analysis of American Community Survey. http://www.higheredinfo.org
America’s International Edge is Slipping in Postsecondary Degree Attainment
The Economic Imperative
9BUSINESS
RESOURCES
FOR A
COLLEGE- AND
CAREER READY
AMERICA
The Equity Imperative
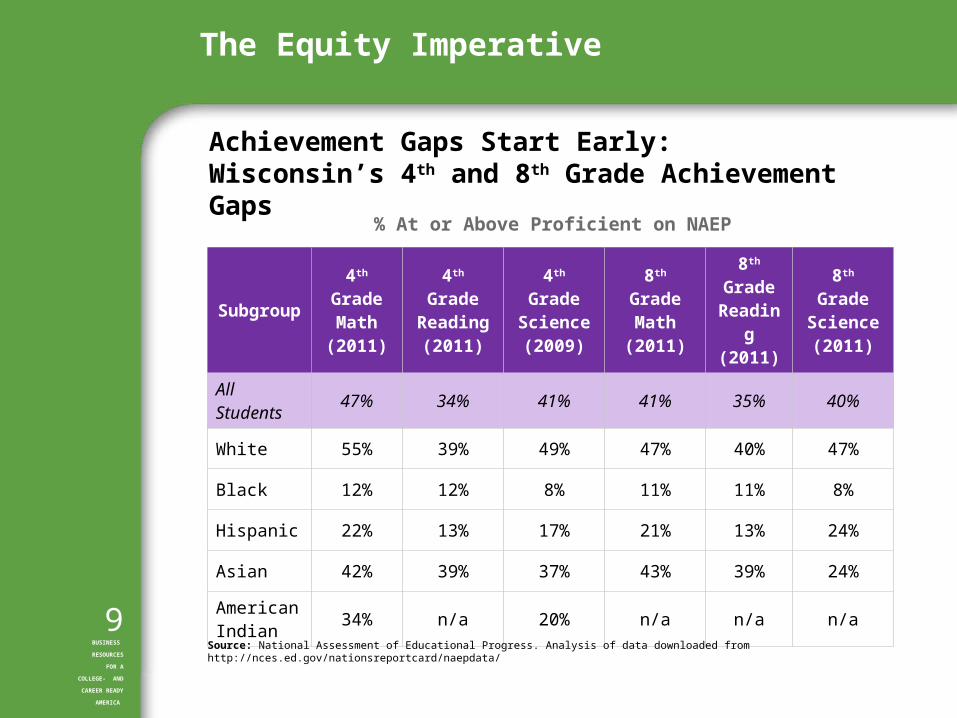
Subgroup4th Grade
Math(2011)
4th Grade Reading (2011)
4th Grade Science (2009)
8th Grade Math (2011)
8th Grade
Reading (2011)
8th Grade Science(2011)
All Students 47% 34% 41% 41% 35% 40%
White 55% 39% 49% 47% 40% 47%
Black 12% 12% 8% 11% 11% 8%
Hispanic 22% 13% 17% 21% 13% 24%
Asian 42% 39% 37% 43% 39% 24%
American Indian 34% n/a 20% n/a n/a n/a
Source: National Assessment of Educational Progress. Analysis of data downloaded from http://nces.ed.gov/nationsreportcard/naepdata/
% At or Above Proficient on NAEP
Achievement Gaps Start Early: Wisconsin’s 4th and 8th Grade Achievement Gaps
10BUSINESS
RESOURCES
FOR A
COLLEGE- AND
CAREER READY
AMERICA
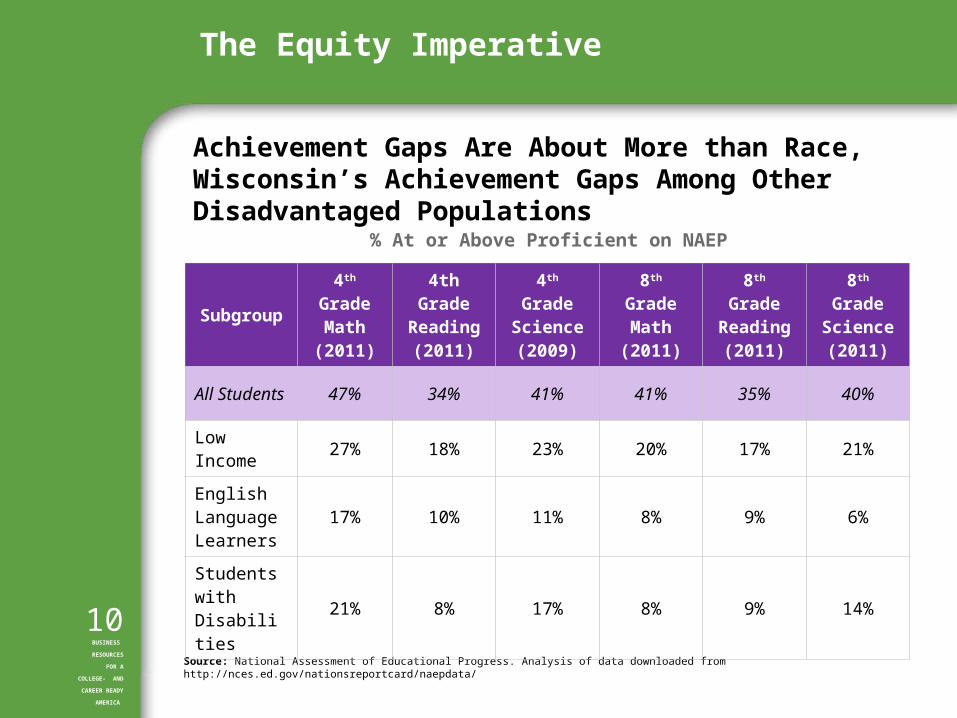
Source: National Assessment of Educational Progress. Analysis of data downloaded from http://nces.ed.gov/nationsreportcard/naepdata/
Subgroup4th Grade
Math (2011)
4th Grade Reading (2011)
4th Grade Science (2009)
8th Grade Math (2011)
8th Grade Reading (2011)
8th Grade Science(2011)
All Students 47% 34% 41% 41% 35% 40%
Low Income 27% 18% 23% 20% 17% 21%
English Language Learners
17% 10% 11% 8% 9% 6%
Students with Disabilities
21% 8% 17% 8% 9% 14%
% At or Above Proficient on NAEP
Achievement Gaps Are About More than Race, Wisconsin’s Achievement Gaps Among Other Disadvantaged Populations
The Equity Imperative
11BUSINESS
RESOURCES
FOR A
COLLEGE- AND
CAREER READY
AMERICA
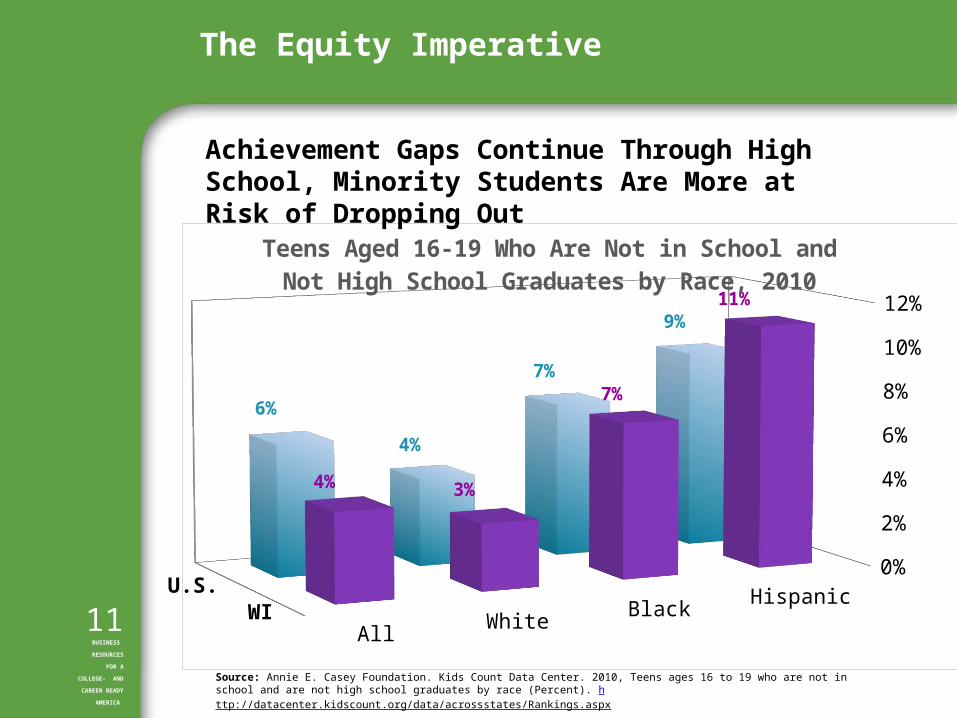
HispanicBlack
WhiteAll
0%
2%
4%
6%
8%
10%
12%
U.S.WI
9%
7%
4%
6%
11%
7%
3%4%
Teens Aged 16-19 Who Are Not in School and Not High School Graduates by Race, 2010
Source: Annie E. Casey Foundation. Kids Count Data Center. 2010, Teens ages 16 to 19 who are not in school and are not high school graduates by race (Percent). http://datacenter.kidscount.org/data/acrossstates/Rankings.aspx
Achievement Gaps Continue Through High School, Minority Students Are More at Risk of Dropping Out
The Equity Imperative
12BUSINESS
RESOURCES
FOR A
COLLEGE- AND
CAREER READY
AMERICA
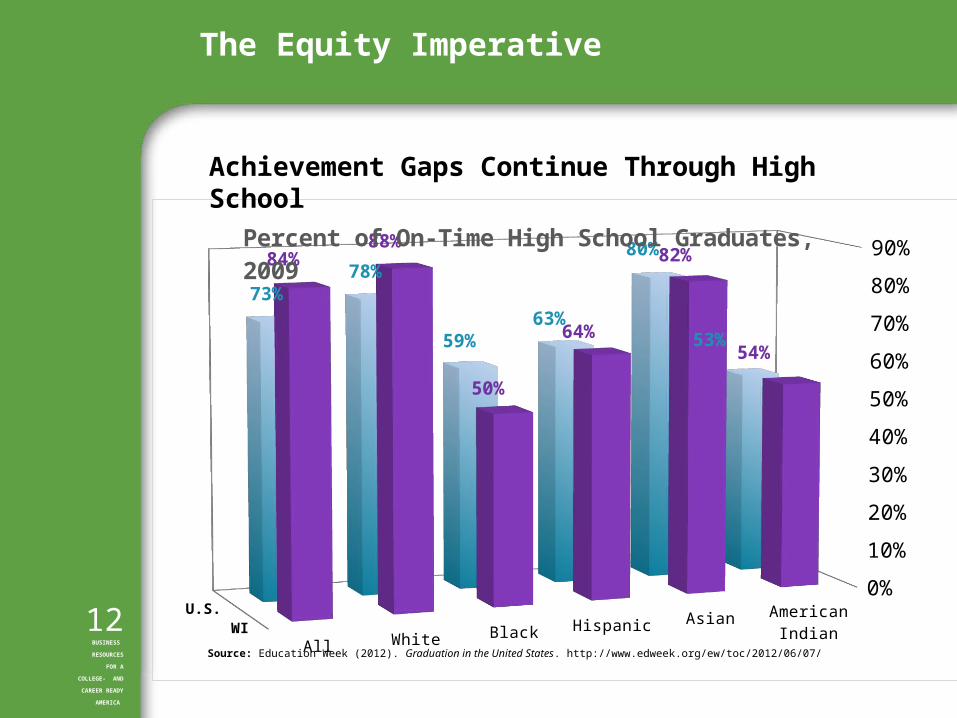
American Indian
AsianHispanicBlackWhiteAll
0%
10%
20%
30%
40%
50%
60%
70%
80%
90%
U.S.WI
53%
80%
63%59%
78%73%
54%
82%
64%
50%
88%84%
Percent of On-Time High School Graduates, 2009
Achievement Gaps Continue Through High School
The Equity Imperative
Source: Education Week (2012). Graduation in the United States. http://www.edweek.org/ew/toc/2012/06/07/

13BUSINESS
RESOURCES
FOR A
COLLEGE- AND
CAREER READY
AMERICA
The Equity Imperative
Source: NCES. IPEDS Graduation Rate Survey, analyzed by National Center for Management of Higher Education Systems.
American Indian
AsianHispanicBlackWhiteAll
0%
10%
20%
30%
40%
50%
60%
70%
U.S.WI
39%
66%
47%
41%
59%56%
31%
52%
44%
33%
60%58%
Percent of Students Earning a Postsecondary Degree
Achievement Gaps Continue Into Postsecondary, College Completion
14BUSINESS
RESOURCES
FOR A
COLLEGE- AND
CAREER READY
AMERICA
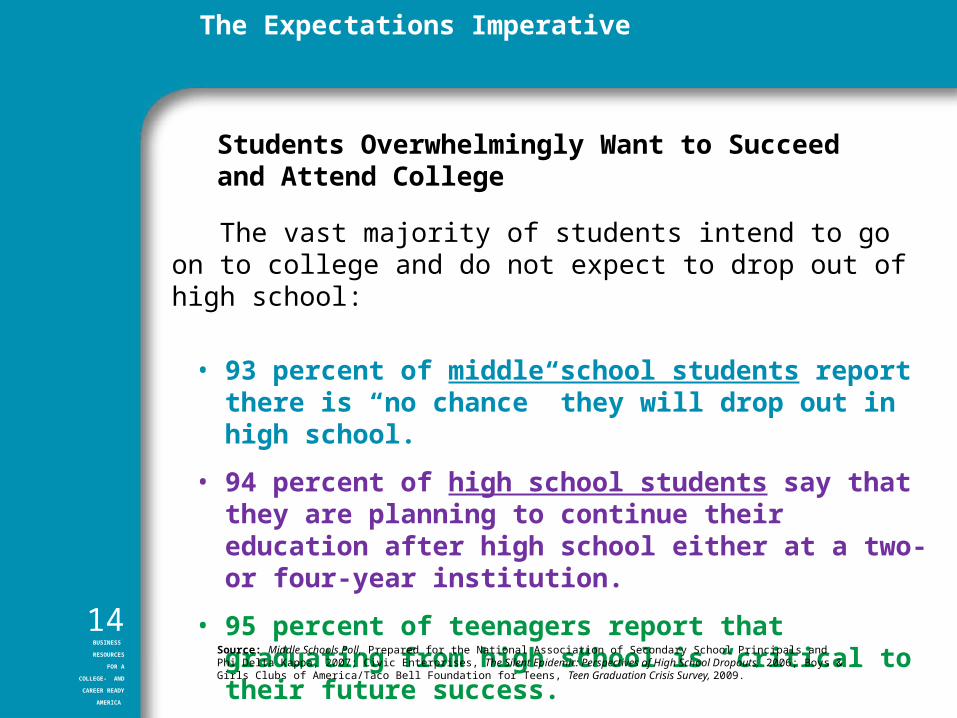
The vast majority of students intend to go on to college and do not expect to drop out of high school:
• 93 percent of middle school students report there is “no chance” they will drop out in high school.
• 94 percent of high school students say that they are planning to continue their education after high school either at a two- or four-year institution.
• 95 percent of teenagers report that graduating from high school is “critical to their future success.”
Source: Middle Schools Poll, Prepared for the National Association of Secondary School Principals and Phi Delta Kappa, 2007; Civic Enterprises, The Silent Epidemic: Perspectives of High School Dropouts, 2006; Boys & Girls Clubs of America/Taco Bell Foundation for Teens, Teen Graduation Crisis Survey, 2009.
Students Overwhelmingly Want to Succeed and Attend College
The Expectations Imperative
15BUSINESS
RESOURCES
FOR A
COLLEGE- AND
CAREER READY
AMERICA
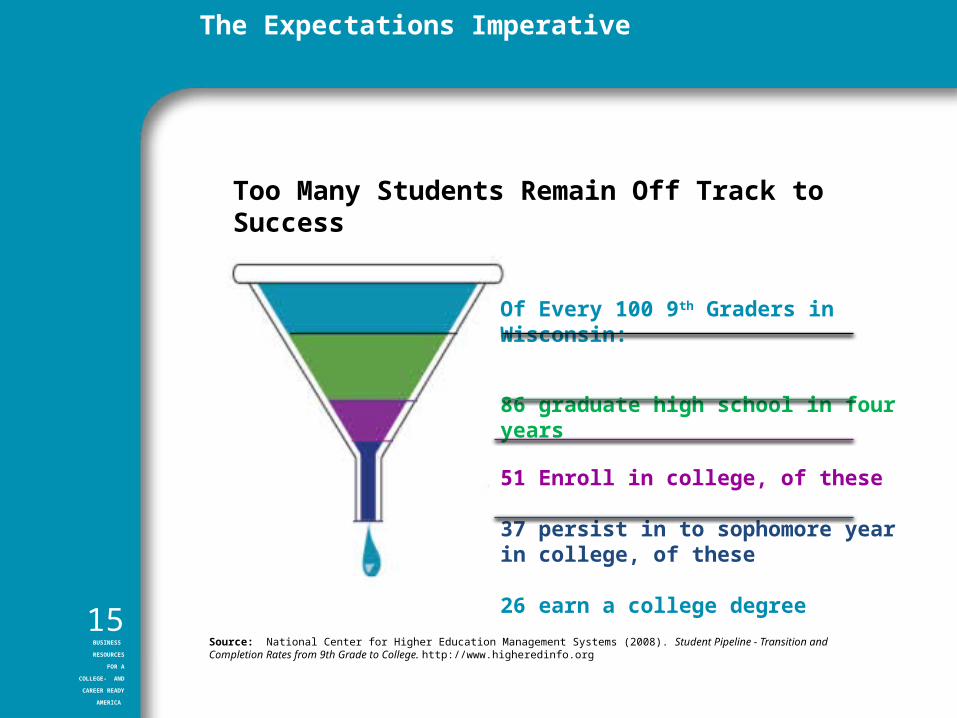
Source: National Center for Higher Education Management Systems (2008). Student Pipeline - Transition and Completion Rates from 9th Grade to College. http://www.higheredinfo.org
Of Every 100 9th Graders in Wisconsin:
86 graduate high school in four years
51 Enroll in college, of these
37 persist in to sophomore year in college, of these
26 earn a college degree
Too Many Students Remain Off Track to Success
The Expectations Imperative

16BUSINESS
RESOURCES
FOR A
COLLEGE- AND
CAREER READY
AMERICA
Source: National Center for Education Statistics (2011). Conditions of Education, 2012. Indicator 22-2011. http://nces.ed.gov/programs/coe/indicator_rmc.asp
Four-YearTwo-Year
Both
0%5%10%15%20%25%30%35%40%45%
20%
42%
36%
Percentage of First-Year Students in Two-year And Four-year Institutions Requiring Remediation in the U.S.
Too Many Students Are Not College and Career Ready, Remediation Rates
The Expectations Imperative

Why College- and Career-Ready Expectations for All
Connecticut Students?
Updated February 2013