Embed Size (px)
Citation preview
© CIVITAS Institute for the Study of Civil Society 2007 www.civitas.org.uk/nhs/waitingtimes_Jan_08.pdf Author: James Gubb, Civitas, 12/2007
1
Why are we waiting?
An analysis of waiting times in the NHS
James Gubb
© The Institute for the Study of Civil Society

© CIVITAS Institute for the Study of Civil Society 2007 www.civitas.org.uk/nhs/waitingtimes_Jan_08.pdf Author: James Gubb, Civitas, 12/2007
2
Author
James Gubb is director of the Health Unit at Civitas. After graduating in Philosophy, Politics
and Economics from St. John’s College, Oxford, he worked briefly in criminal law, before
joining Civitas in June 2006, where he has worked on European issues and health policy.
His previous publications on health include Just how well are we? and Innovation needs
competition.
Acknowledgements
I owe special thanks to Sabrina Sandrasagra for all her help with data extraction and analysis;
and also to Robert Whelan at Civitas for his comments on the final draft and invaluable
proof-reading. Needless to say, I accept full responsibility for any errors or infelicities that
remain.
About Civitas
Civitas is an independent educational charity that carries out research into areas of social
policy, including health, welfare, education, crime, the family and citizenship.
Civitas focuses on those institutions which constitute civil society. It has no political
affiliation and is entirely dependent on voluntary donations.
© Civitas 2007
77 Great Peter Street
London SW1P 2EZ
Civitas is a registered charity (no. 1085494)
and a company limited by guarantee, registered in
England and Wales (no. 04023541)
email: [email protected]
All rights reserved
Independence: Civitas: Institute for the Study of Civil Society is a registered educational charity (No.
1085494) and a company limited by guarantee (No. 04023541). Civitas is financed from a variety of
private sources to avoid over-reliance on any single or small group of donors.
All the Institute’s publications seek to further its objective of promoting the advancement of
learning. The views expressed are those of the author, not of the Institute.
© CIVITAS Institute for the Study of Civil Society 2007 www.civitas.org.uk/nhs/waitingtimes_Jan_08.pdf Author: James Gubb, Civitas, 12/2007
3
Contents
Summary...................................................... 5
A: The context:
- Labour’s strategy......................................... 8
B: Performance
- The original targets..................................... 10
o Statistical caveats.......................... 12
o Gaming.......................................... 13
- 18 weeks referral to treatment (RTT)......... 15
o Projections.................................... 15
o Inadequate data............................ 17
o Long waits...................................... 17
o Diagnostics.................................... 19
o Variation by specialty.................... 21
o Geographical variation.................. 23
C: Recommendations.................................. 28

© CIVITAS Institute for the Study of Civil Society 2007 www.civitas.org.uk/nhs/waitingtimes_Jan_08.pdf Author: James Gubb, Civitas, 12/2007
4
List of figures and tables
Figures:
Fig. 1. Percentage of patients spending less than four hours in A&E (right axis) vis-a-
vis total attendances in A&E (left axis), England, 2002/03-2007/08............................... 11
Fig. 2. Number of patients waiting longer than 13 weeks for an outpatient appointment, England,
1999/2000-2007/08............................................................................................................. 11
Fig. 3. Number of patients waiting and length of time spent waiting for an inpatient appointment,
England, 1999/2000-2007/08............................................................................................. 12
Fig. 4. Percentage of patients treated within 18 weeks of referral, England, January-September
2007 and projected improvement up to December 2008.................................................... 16
Fig. 5. Number of patient pathways in each weekly timeband whose RTT ‘clock’ stopped in
September 2007, England (>18 weeks)............................................................................... 18
Fig. 6. Number of patient pathways in each weekly timeband whose RTT ‘clock’ was still running in
September 2007, England (>18 weeks).......................................................................... 19
Fig. 7. Number of patients waiting for diagnostics, England, April 2006-October 2007........... 20
Fig. 8. Percentage of patients treated within 18 weeks of referral, by medical specialty, England,
September 2007................................................................................................................... 21
Fig. 9. Percentage of patients treated within 18 weeks of referral in trauma & orthopaedics,
England, January-September 2007 and projected improvement up to December 2008. 22
Fig. 10. Percentage of patients treated within 18 weeks of referral in each SHA, England, September
2007...................................................................................................................................... 23
Fig. 11. Percentage of patients treated within 18 weeks of referral in each SHA, vis-à-vis number of
patients treated, England, September 2007....................................................................... 24
Fig. 12. Percentage of patients treated within 18 weeks of referral in the best and worst performing
SHA in each medical specialty, England, September 2007................................................ 24
Fig. 13. Percentage of patients treated within 18 weeks of referral in each PCT, England, September
2007.................................................................................................................................. Annex 1
Fig. 14. Number of patients waiting longer than 52 weeks from referral to treatment in the weakest
PCTs, England, September 2007........................................................................................ 26
Fig. 15. Percentage of patients treated within 18 weeks of referral in each NHS (Foundation) Trust,
England, September 2007............................................................................................ Annex 1
Tables:
Table 1: Percentage of patients offered an appointment with a GP within 48-hours of contact,
England, 2002-2006......................................................................................................... 10
Table 2: Mean and median inpatient waiting times, England, 1999/2000-2006/07............... 13
© CIVITAS Institute for the Study of Civil Society 2007 www.civitas.org.uk/nhs/waitingtimes_Jan_08.pdf Author: James Gubb, Civitas, 12/2007
5
Summary
Following the publication of the NHS Plan in 2000, the Labour government ‘declared war’ on
waiting; not just to cut waiting times but ‘to move the NHS away from a culture of waiting to
a culture of booking’.
Initially the government set a number of targets: a 48-hour maximum wait for a GP
appointment by 2004; a four-hour maximum wait in A&E prior to admission, transfer or
discharge by 2004; a three-month maximum wait for an outpatient appointment by 2005
and a six-month maximum wait for an inpatient appointment by 2005. All of these were, by
and large, met.
But this did not come without collateral damage; targets are a blunt instrument for change
and resulted in much gaming of the system. This distorted clinical need, focused the NHS on
Whitehall and de-professionalised the medical profession.
In what could be seen as a response to one of the most serious consequences of this – very
long waits for diagnostics – the government introduced a new goal in 2004: that by the end
of 2008 no patient should wait longer than 18 weeks from referral to treatment (RTT) for
elective (planned) procedures. This does at least have the advantage of looking across the
entire patient pathway, including diagnostics, but its marginal cost could be enormous –
estimated at £2.7 billion in 2005/06 alone by HM Treasury.
Still, RTT statistics show performance on an upward curve. In January 2007, only 47% of
admitted patients were making it through the pathway in this time; in April it was 51%; in
June it was 54% and – at the latest count – in September it was 57%.
Nonetheless, the target that 100% of patients be treated within 18 weeks by December 2008
does not look achievable. At current rates of improvement, only 77% of admitted patients
will be treated within 18 weeks by this point. The interim benchmark of 85% by March 2008
looks simply utopian and, perhaps unsurprisingly, the December 2008 target has recently
been revised to 90%.
Nonetheless, a closer look at the data reveals concerning trends that may well make things
even more difficult; in many cases meeting the 18 week target will involve much more than
© CIVITAS Institute for the Study of Civil Society 2007 www.civitas.org.uk/nhs/waitingtimes_Jan_08.pdf Author: James Gubb, Civitas, 12/2007
6
just marginal improvements. For patients who received treatment – whose clock stopped –
in September 2007 (the latest statistics available):
• 19,441 (or 8.7% of patients where data is recorded) were still waiting over a year for
treatment; while 33,665 (15.0%) were still waiting over 36 weeks;
• 30, 832 were still waiting over 26 weeks just to receive diagnostics, of which 16,551
were waiting over a year. This is only one part of the pathway.
• Only 37% of trauma and orthopaedic patients were treated within 18 weeks, yet is in
the highest demand of all electives.
• Data is still not available for 19.6% of patients.
What’s more, of those patients whose clock was still running in September 2007 (i.e. who
were still waiting for treatment), 665,895 (or 16.7%) had been waiting longer than 36 weeks
and 401,724 (or 10.0%) had been waiting over a year.
While reaching the RTT target appears imminently possible for some NHS organisations,
many still have a very long way to go. A patient’s chances of getting treated within 18 weeks
still depend far too much on where they live. In September 2007 the best and worst
performers were:
• Just 44% of elective referrals treated within 18 weeks in South East Coast Strategic
Health Authority (SHA), compared with 67% in West Midlands SHA;
• Just 32% of elective referrals treated within 18 weeks in Brent Teaching Primary Care
Trust (PCT) compared with 83% in Heart of Birmingham PCT;
• Just 23% of elective referrals treated within 18 weeks at West Hertfordshire NHS
Trust compared with 88% in Yeovil District Hospitals NHS Foundation Trust.*1
• Just 26% of referrals for neurology treated within 18 weeks in East Midlands SHA,
compared with 86% in North East SHA.

© CIVITAS Institute for the Study of Civil Society 2007 www.civitas.org.uk/nhs/waitingtimes_Jan_08.pdf Author: James Gubb, Civitas, 12/2007
7
• In October 2007, 97.1% of audiology patients in Herefordshire PCT waited longer
than 13 weeks, compared with none in Worcestershire PCT , despite the fact that
Worcestershire PCT diagnosed over four times as many (4,771 compared with 1,153).
While we should not underestimate the scale of the achievement thus far, we equally should
not underestimate the scale of the challenge ahead, nor the political pressure on NHS
organisations to meet it.
A better approach
The uniform 18-week target should be scrapped. As of April 2008, patients will be able to
choose where to have elective treatment between all willing providers, including the
independent sector that can meet the NHS tariff. RTT waiting times for providers should be
included in the information patients have when making this choice. Patients could then
decide how important waiting is to them, weighed against other measures such as quality of
care, length of stay, health outcomes and how far they are prepared to travel.
Instead of political targets, performance should be driven by choice and competition – a self-
sustaining and much more positive mechanism for change. If this means more patients
choosing to have their treatment in the independent sector, then the sector should be allowed
to expand in response to this. As is the case elsewhere, it is the ability of patients to
compliment, complain and ultimately take their ‘business’ elsewhere that will drive providers
in the NHS to improve.
Tony Blair himself acknowledged this in September 2005: ‘We only got big falls in waiting
times after introducing competition for routine surgery. Fact.’ For all their recent wavering,
the current government and the DH clearly recognise this too and have, with the Operating
Framework for the NHS in 2007/08, cemented the structures for this to work.
The challenge must now be down to PCTs and GPs to promote and encourage choice to
ensure that the opportunity isn’t missed. At present this isn’t happening; the number of
patients who recalled being offered a choice of hospital for their first outpatient appointment
actually fell by 5% between March and July 2007 to a very lowly 43%2; and just 45% of GP
referrals are using the Choose and Book system. For the benefits of competition to be
realised and for waiting times to really accelerate downwards, this has to change – and fast.

© CIVITAS Institute for the Study of Civil Society 2007 www.civitas.org.uk/nhs/waitingtimes_Jan_08.pdf Author: James Gubb, Civitas, 12/2007
8
A. The context
If there is one thing the NHS is notorious for, it is waiting. At its inception in 1948, the NHS
inherited a waiting list of around half-a-million patients and, as much as successive
governments may have tried, the number has spiralled upwards ever since. When Labour
came to power in 1997, the total number stood at 1.3 million, with some patients having
waited years for operations. Getting waiting lists down is an ‘activity about as hopeful as
filling a sieve’, commented one despairing Health Minister in the 1960s.3 As Julian Le Grand
pithily put it, ‘patients were supposed to live up to their appellation and be patient’.4
It was this legacy that Tony Blair dared to take on; boldly pledging not just to end it, but
completely reverse it. With a public accustomed to choice, variety and responsiveness in
other areas – and increasingly aware that waits are non-existent in other developed health
systems – the NHS Plan (2000) identified having to wait months on end for health care as
the major gripe most had with the NHS.5 In the more serious cases, waiting was also costing
lives.6 The battle was launched; the then Secretary of State for Health, Alan Milburn,
‘declared war’ on waiting times; not just to cut them, but ‘to move the NHS away from a
culture of waiting to a culture of booking’.7 The NHS, it appeared, was to join the consumer
revolution with the ‘vision of the health service designed around the patient’.8
Labour’s strategy
Since its election in 1997, the Labour government’s determination to cut waiting times
certainly hasn’t been lacking; ‘if there is one consistent policy theme that has driven change
in [the NHS]’, wrote John Appleby of the King’s Fund, ‘it has been a concerted effort to
reduce the numbers of patients waiting and, more importantly, the length of time they spend
doing it’.9 What hasn’t been so consistent is the way they’ve tried to do it.
- Phase 1: Targets and central direction
For all the patient-centred rhetoric, the government’s immediate strategy post-NHS Plan
mimicked a command economy, with the Department of Health (DH) dictating the goals and
simply demanding NHS organisations cut waiting times. The political pressure on the NHS
was enormous. A torrent of extra cash was accompanied by a flurry of targets on access, the
most important being:
- 48-hour maximum wait for a GP appointment by 2004;
- 4-hour maximum wait in A&E to admission, transfer or discharge by 2004;
- 3-month maximum wait for an outpatient appointment by 2005;
© CIVITAS Institute for the Study of Civil Society 2007 www.civitas.org.uk/nhs/waitingtimes_Jan_08.pdf Author: James Gubb, Civitas, 12/2007
9
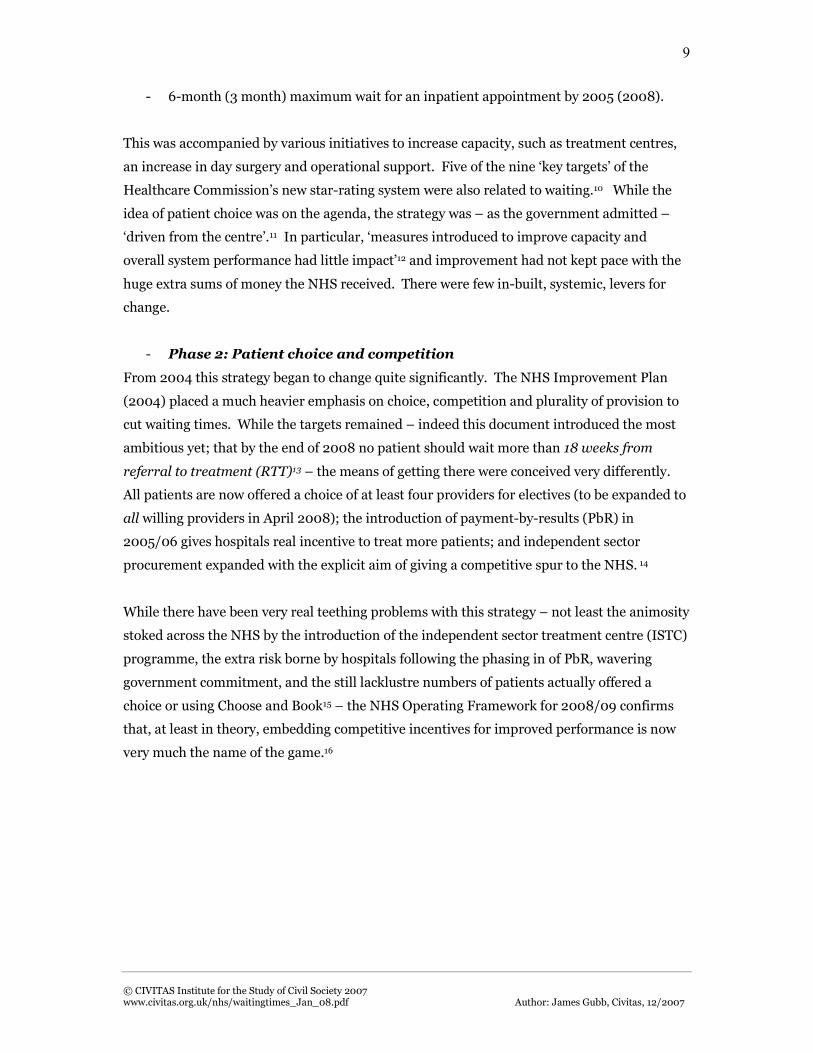
- 6-month (3 month) maximum wait for an inpatient appointment by 2005 (2008).
This was accompanied by various initiatives to increase capacity, such as treatment centres,
an increase in day surgery and operational support. Five of the nine ‘key targets’ of the
Healthcare Commission’s new star-rating system were also related to waiting.10 While the
idea of patient choice was on the agenda, the strategy was – as the government admitted –
‘driven from the centre’.11 In particular, ‘measures introduced to improve capacity and
overall system performance had little impact’12 and improvement had not kept pace with the
huge extra sums of money the NHS received. There were few in-built, systemic, levers for
change.
- Phase 2: Patient choice and competition
From 2004 this strategy began to change quite significantly. The NHS Improvement Plan
(2004) placed a much heavier emphasis on choice, competition and plurality of provision to
cut waiting times. While the targets remained – indeed this document introduced the most
ambitious yet; that by the end of 2008 no patient should wait more than 18 weeks from
referral to treatment (RTT)13 – the means of getting there were conceived very differently.
All patients are now offered a choice of at least four providers for electives (to be expanded to
all willing providers in April 2008); the introduction of payment-by-results (PbR) in
2005/06 gives hospitals real incentive to treat more patients; and independent sector
procurement expanded with the explicit aim of giving a competitive spur to the NHS. 14
While there have been very real teething problems with this strategy – not least the animosity
stoked across the NHS by the introduction of the independent sector treatment centre (ISTC)
programme, the extra risk borne by hospitals following the phasing in of PbR, wavering
government commitment, and the still lacklustre numbers of patients actually offered a
choice or using Choose and Book15 – the NHS Operating Framework for 2008/09 confirms
that, at least in theory, embedding competitive incentives for improved performance is now
very much the name of the game.16

© CIVITAS Institute for the Study of Civil Society 2007 www.civitas.org.uk/nhs/waitingtimes_Jan_08.pdf Author: James Gubb, Civitas, 12/2007
10
B. Performance
So, on waiting times, have Labour succeeded? On the surface, the figures are certainly
impressive, often held up as the achievement of the NHS in recent years and the justification
for all the money that’s gone into the service over the past decade. Hardly anyone is now
waiting longer than three months for an outpatient appointment and hardly anyone is now
waiting more than six months for inpatient treatment; in fact 57% of patients are now being
treated within 18 weeks of referral – statistics that would have been thought of as some kind
of fairyland just ten years ago. The politicians are certainly confident: in June 2007 the then
Health Minister, Andy Burnham, went so far as to say that by December 2008, the maximum
18-week wait would signal ‘the end of waiting on the NHS’.17 But are things really this good?
1. The original targets
On the standards set by government’s original waiting time targets, which were introduced
with the NHS Plan in 2000, performance has been impressive. By and large, the targets were
met and real improvement registered:
• To guarantee access to a GP within 48-hours by 2004
By March 2004, Primary Care Access Surveys showed that 97.4% of GP surgeries were
offering an appointment within 48-hours, compared with just 74.6% in 2002:
Table 1: Percentage of patients offered an appointment with a GP within 48-hours of
contact, England, 2002-2006
% of patients offered an
appointment with a GP
within 48hrs
March 2002 74.64
March 2004 97.36
March 2006 99.94
Source: Department of Health18
• To reduce the maximum waiting time in A&E from arrival to admission,
transfer or discharge to four hours by the end of 2004
Despite total attendances in A&E departments rising quite rapidly, from 3.1 million in the
second quarter of 2002/03 to 3.4 million in the second quarter of 2007/08, the target to
reduce the maximum waiting time to four hours was nonetheless met by 2005/06, according
to official statistics:
© CIVITAS Institute for the Study of Civil Society 2007 www.civitas.org.uk/nhs/waitingtimes_Jan_08.pdf Author: James Gubb, Civitas, 12/2007
11
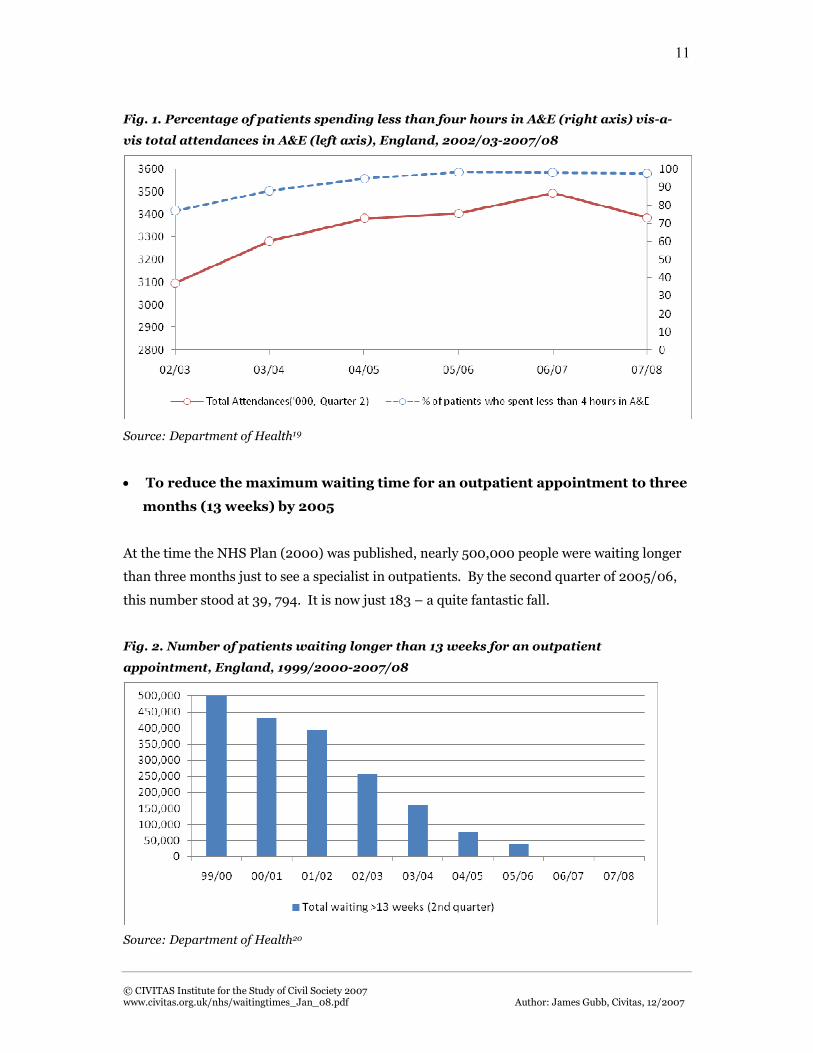
Fig. 1. Percentage of patients spending less than four hours in A&E (right axis) vis-a-
vis total attendances in A&E (left axis), England, 2002/03-2007/08
Source: Department of Health19
• To reduce the maximum waiting time for an outpatient appointment to three
months (13 weeks) by 2005
At the time the NHS Plan (2000) was published, nearly 500,000 people were waiting longer
than three months just to see a specialist in outpatients. By the second quarter of 2005/06,
this number stood at 39, 794. It is now just 183 – a quite fantastic fall.
Fig. 2. Number of patients waiting longer than 13 weeks for an outpatient
appointment, England, 1999/2000-2007/08
Source: Department of Health20

© CIVITAS Institute for the Study of Civil Society 2007 www.civitas.org.uk/nhs/waitingtimes_Jan_08.pdf Author: James Gubb, Civitas, 12/2007
12
• To reduce the maximum waiting time for inpatient treatment to six months
(26 weeks) by 2005, and three months (13 weeks) by 2008:
Alongside rapidly decreasing waiting times for outpatients came a similar trend for
inpatients. Waiting times have plummeted from around 264,000 waiting more than 26
weeks in 1999/00 to just 72,440 waiting more than 13 weeks in the second quarter of
2007/08:
Fig. 3. Number of patients waiting and length of time spent waiting for an inpatient
appointment, England, 1999/2000-2007/08
Source: Department of Health21 (no data available where columns omitted)
On face value things have clearly got much, much, better, but there are a few reasons for not
popping the champagne too prematurely.
Statistical caveats
For a start, more people are waiting longer than it might at first seem. The statistics on
waiting times for outpatient and inpatient appointments measure the number of people
waiting for an appointment at that given point in time. When we look across the entire year,
a slightly different picture emerges. For example, across the year 2005/06, 32,914 people
waited longer than the 13-week target for an outpatient appointment (though still a massive
improvement on the 527,901 in 1999/00).

© CIVITAS Institute for the Study of Civil Society 2007 www.civitas.org.uk/nhs/waitingtimes_Jan_08.pdf Author: James Gubb, Civitas, 12/2007
13
Another factor is that while the NHS has had considerable success in eliminating the longest
waits, much less of an impression has been made on average waiting times. Mean waiting
times have fallen, but median waiting times for inpatient treatment – the waiting time
experienced by the most patients – actually increased, from 43 days in 1999/00 to 49 in
2006/07:
Table 2: Mean and median inpatient waiting times, England, 1999/2000-2006/07
Waiting times for inpatient treatment (days)
Mean Median
1999/00 91 43
2001/02 96 47
2004/05 84 52
2005/06 78 51
2006/07 73 49
Source: Hospital Episode Statistics22
This implies waiting time targets have been met not just by increasing capacity, throughput
and efficiency, but also by juggling patients around to get the maximum number possible
under the targeted time.
Gaming
Many commentators, and not just those in government, will say that the targets used in the
NHS Plan caused waiting times to fall. To an extent this is true, but the problem with using
targets is that they are an incredibly blunt – and quite often damaging – instrument for
change. This boils down to three disconcerting, but entirely predictable, collateral effects
they have: they create an upward-looking service; they sap the medical profession’s morale
through removing responsibility from those on the front-line; and they distort clinical
decision-making.23
With intense pressure on meeting the target, there are many inappropriate, and innovative,
ways in which they can be met to the detriment of patient care.24 On the one hand there’s the
purely cynical. As shown above, the official statistics show PCTs having reported pretty much
100 per cent success in offering patients a GP appointment within 48 hours, yet when looking
at the Healthcare Commission’s patient survey of 2005, only 74% were actually seen within
48 hours, not for want of trying.25 Then there’s the manipulation of inpatient and outpatient

© CIVITAS Institute for the Study of Civil Society 2007 www.civitas.org.uk/nhs/waitingtimes_Jan_08.pdf Author: James Gubb, Civitas, 12/2007
14
waiting times. In 2004, the Audit Commission found inaccuracies in up to a third of
hospitals.26 Of course, not all were deliberate, but numerous ‘data tricks’ have been
uncovered such as classing patients as refusing treatment after only offering them an
immediate appointment that they weren’t able to attend and using time taken for diagnostic
tests or rehabilitation services as time deducted from official waiting times.27
Even more damaging than this are the wider distortionary effects and subtle changes in
behaviour the targets have caused; the law of unintended consequences. A&E provides the
most often cited examples: of ambulances queuing outside A&E departments unable to bring
in patients until A&E staff are confident of treating them within four hours;28 of patients
being unnecessarily admitted to hospital so as not to miss the four-hour clock; not to mention
the fact that many heart attack and asthma patients might actually do better by spending
more time in A&E for observation and testing.29 But the effects are much more widespread
than this; for example a survey conducted by the Healthcare Commission in 2005 found that
just over 30% of primary care patients surveyed could no longer book a GP appointment
more than three days in advance – presumably to free up appointment slots to ensure the 48-
hour target was met.30 Targets have also been blamed on numerous occasions for the rise of
hospital-acquired infections.31
But one of the most illustrative cases concerns elective waiting times. Crucially, the targets
set on inpatient and outpatient waiting times refer to a) the time from a GP referral to first
outpatient appointment, and b) the time from being placed on a surgical waiting list to
receiving inpatient treatment. This misses out a pretty vital part in the middle; diagnostics.
Unsurprisingly, with the spotlight well and truly on the targets, while waiting times for
inpatient and outpatient care fell, those for diagnostics didn’t. A report prepared by the then
Liberal Democrat health spokesman, Paul Burstow MP, drew attention to this, revealing that,
in December 2004, two out of five NHS Trusts patients were waiting up to six months or
more for routine MRI scans.32
The crux of the problem is that targets measure, and focus attention on, only one part of any
patient’s care pathway from the initial demand for health care to the outcome and on only a
few types of care – be it in elective, emergency or chronic. The targets may have cut waiting
times, but they have also caused serious distortion, collateral damage and inefficiency along
the way – a fact that the government and the DH have begun to recognise. The waiting time
target that has superseded that for inpatient treatment and outpatient appointments in
electives, referral to treatment (RTT), at least encompasses the whole care pathway and
© CIVITAS Institute for the Study of Civil Society 2007 www.civitas.org.uk/nhs/waitingtimes_Jan_08.pdf Author: James Gubb, Civitas, 12/2007
15
emphasis is beginning to shift from a target culture to one of patient empowerment and
competition, but very real problems still remain.33
2. 18-weeks referral to treatment
The NHS Improvement Plan (2004) committed the NHS – in the words of the NHS
Confederation’s policy director Nigel Edwards – to ‘probably the most challenging thing [it]
has been asked to take on’,34 pledging that by the end of 2008, no-one will be waiting more
than 18 weeks from a GP referral to hospital treatment.35 The NHS Operating Framework for
2007/08 set further interim milestones: that by March 2008, 85% of pathways where
patients are admitted for hospital treatment, and 90% of pathways that do not end up in
admission, should be completed within 18 weeks.36
Belied by some as a ludicrous aim – given that the NHS at the time had never collected the
relevant data so ‘neither the government nor anyone else had a clear notion of how attainable
it was’37 – the 18-week RTT target has, rightly or wrongly, become the benchmark everyone is
now talking about. The clock is, very literally, ticking – go on the DH’s own ‘comprehensive
source of information and resources’ on the target, www.18weeks.nhs.uk, and there’s one in
the top left-hand corner: ‘375 days to go’. Clearly there’s even less time until March and,
unsurprisingly, everyone’s getting a bit jittery. In November, the Health Minister, Ben
Bradshaw, announced that 10 per cent “buffer zones” were going to be created to account for
delays due to patient postponement and medical need – in effect reducing the target to 90%
of patients by 2008 – which has been cemented in the NHS Operating Framework for
2008/09.38 Some see this as a shameless moving of the goalposts, whereas others as a
recognition that targets have their limits.39 But the fact is that the target remains; just how
likely is the NHS to get there?
Projections
The latest count, September 2007, shows 57% of admitted patients whose ‘clock’ stopped in
that month received treatment within the 18-week target. What’s more, all the indications
are that things are improving quite nicely. In January 2007, only 47% of admitted patients
were making it through the pathway in 18 weeks; in April it was 51% and in June it was
54%.40 New statistics made available in September 2007 also show that for patients who did
not require treatment after diagnosis (non-admitted), 76% were dealt with within the
timeframe.41

© CIVITAS Institute for the Study of Civil Society 2007 www.civitas.org.uk/nhs/waitingtimes_Jan_08.pdf Author: James Gubb, Civitas, 12/2007
16
However, that does not mean the target will be met. In order to be treating even the revised
goal of 90% of all patients by December 2008 the NHS will have to up its game quite
considerably. Looking solely at admitted patients – where statistics have been available for
longer – the trend in improvement has thus far been quite linear.42 If the same trend were to
continue then by December 2008 around 77%, or roughly three-quarters, of patients will be
turned around in 18 weeks – not 90%, and certainly not 100%. Clearly this also puts paid to
the interim benchmark that 85% of admitted patients be treated within 18 weeks by March.
Given current rates of improvement, this figure will stand around 65% - still a real
achievement, but quite significantly off what is a very optimistic target.
Fig. 4. Percentage of admitted patients treated within 18 weeks of referral, England,
January-September 2007 and projected improvement up to December 2008
Source: Department of Health (calculations by author)43
Further caveats also abound. Though it is possible for the number of patients treated within
18 weeks to accelerate over time – for example once more trusts get the data right, referral
management centres become more effective and more care pathways have been redesigned44
– it is equally possible that things could slow down. For one, if we look at data available for
patients whose ‘clock’ is still running, just 59% are projected to be treated within the targeted
time.45 The NHS will also have to reverse trends of recent years – that it has been much more
effective at cutting out the excessively long waits rather than the waits the majority of people
experience – and this, in a large number of trusts and specialties, will take more than just
2007 2008
© CIVITAS Institute for the Study of Civil Society 2007 www.civitas.org.uk/nhs/waitingtimes_Jan_08.pdf Author: James Gubb, Civitas, 12/2007
17
marginal improvement. What’s more, they will have to do it in a time when the demand for
elective care seems to be on the increase; between 1998 and 2005, overall elective admissions
to hospital rose by just over 605,000, or 11%.46
Inadequate data
Just looking at raw figures and reporting the percentage of patients treated within the 18-
week target is, at least at present, likely to be very inaccurate. Over and above the reported
length of wait is the fact that we still only know what’s happening in 80% of cases; the cases
that the data refers to. As yet, data is not even available for 19.6% of individual patient
pathways, or 54,814 patients in total, because it is not known when their ‘clock’ started, i.e.
when they were originally referred by their GP for treatment.47 It could be within 18 weeks,
but the likelihood is it is probably much longer, before systems for collecting RTT data were
put in place.
Added to this is the problem that even for the 80% of cases where the ‘clock’ start time is
known and RTT data is subsequently reported, it is not necessarily accurate. As the DH
admits, data is incomplete in many cases; the average ‘score’ for completeness is just 76% in
the latest data, but in some PCTs it is much worse. Hammersmith and Fulham PCT is the
real outlier at a very lowly 8%, but there are a whole cluster below 50%; for example Barking
and Dagenham PCT scores just 34%, Newcastle PCT 35%, West Kent PCT 36% and Havering
PCT 36%.48 Perhaps this is not surprising because RTT data collection is an entirely new
concept and new systems take time to embed themselves, but the fact remains it would be
more sensible to err on the side of caution. Some claim, with reasonable logic, that once
patient administration systems tied to the RTT pathway are fully in place, the task for trusts
will become easier because they will have the necessary data to effectively implement
change.49 But then again, in the short term at least, they may well reveal the full scale of the
challenge.
Long waits
One particular challenge is the fact that, despite more patients being treated within 18 weeks,
there are still a large number that are waiting a very long time. Alarmingly, of those patients
who received treatment in September 2007, fully 19,441 (8.7% of patients where ‘clock start’
known) had been waiting over a year from referral and 33,665 (15.0%) had been waiting
over 36 weeks (double the 18-week target).

© CIVITAS Institute for the Study of Civil Society 2007 www.civitas.org.uk/nhs/waitingtimes_Jan_08.pdf Author: James Gubb, Civitas, 12/2007
18
Fig. 5. Number of patient pathways in each weekly timeband whose RTT ‘clock’
stopped in September 2007, England (>18 weeks, admitted patients)
Source: Department of Health 50
While it is true that such long waits represent something of a ‘waiting legacy’ (from times
prior to when RTT was measured) that shouldn’t reoccur, these patients must still,
nonetheless, be treated and treated fast in order to ensure the ‘legacy’ does not become a
permanent one. What is clear is that there are still a very large number of them. Of those
patients who, since referral, had yet to be treated in September 2007, 665,895 had been
waiting over 36 weeks, of which 401,724 had been waiting over a year. This is a higher
percentage of patients, 10.0%, than those whose clock stopped in September (8.7%). [see
fig.6 overleaf]
What’s more, if we can make the assumption that many of those whose clock ‘start date’ is
unknown are those waiting long times, these figures may well be even higher. Clearing the
backlog will be no easy task; in many cases it will require a huge increase in throughput that
will only be possible by service redesign or increased efficiency. To take one example: Bolton
Hospitals NHS Trust recently reported a 20% increase in the number of operations carried
out in the last quarter, compared with the year before, just to clear its long waits.51

© CIVITAS Institute for the Study of Civil Society 2007 www.civitas.org.uk/nhs/waitingtimes_Jan_08.pdf Author: James Gubb, Civitas, 12/2007
19
Fig. 6. Number of patient pathways in each weekly timeband whose RTT ‘clock’ was
still running in September 2007, England (>18 weeks)
Source: Department of Health 52
Diagnostics
As a direct response to concerns raised over long waits for diagnostics, alongside the RTT
target came the benchmark that no patient should wait longer than 13 weeks between an
outpatient appointment and receiving diagnostics. This was accompanied by a requirement
for NHS organisations to collect data on diagnostic waiting times.
The first set of data on this was published in mid-2006 and revealed what could have been
predicted: a major bottleneck in the system. In April 2006, 203,114 people were waiting
longer than 13 weeks for diagnostics, of whom 96,416 were waiting longer than 26 weeks.
The figure included some 12,648 waiting for longer than 13 weeks for MRI scans and 2,488
for CT scans. Since then improvement has been registered – virtually no-one is now waiting
longer than 13 weeks for a CT scan and just 169 were waiting longer than this for an MRI
scan– but, as of October 2007, there were still 30,832 patients waiting longer than 26 weeks
for diagnostics, of whom 16,551 were waiting over a year.

© CIVITAS Institute for the Study of Civil Society 2007 www.civitas.org.uk/nhs/waitingtimes_Jan_08.pdf Author: James Gubb, Civitas, 12/2007
20
Fig. 7. Number of patients waiting for diagnostics, England, April 2006-October 2007
Source: Department of Health 53
This – much more than the parts of the patient pathway relating to outpatient appointments
and inpatient treatment – is clearly a major impediment to the 18-week RTT target being
met. It is also a particularly serious problem in a few specialties. Incredibly, at the national
level, 42.8% of patients referred for audiology assessments still wait longer than 13 weeks; as
do 12.4% referred for neurophysiology diagnostics and 11.6% for colonoscopies. This gets
even worse in a number of instances at the local level. In October 2007, in Herefordshire
PCT, 97.1% of audiology patients were waiting longer than 13 weeks, with 1,069 tests still
outstanding at 26 weeks; and in West Sussex Teaching PCT 60.1% of patients were still
waiting longer than 13 weeks for a colonoscopy. The best performers have none waiting
longer than this: Worcestershire PCT diagnosed around four times as many audiology
patients as Herefordshire PCT in October, yet none waited longer than 13 weeks; in fact 70%
were treated in under six. 54
Unless diagnostic capacity is increased substantially, or becomes infinitely more efficient,
there will remain a severe blockage in the pathway, regardless of how much is achieved
elsewhere. In this light, the decisions made by the DH to axe two-thirds of the proposed
independent sector diagnostic contracts from the second phase of the ISTC programme is
puzzling to say the least.55

© CIVITAS Institute for the Study of Civil Society 2007 www.civitas.org.uk/nhs/waitingtimes_Jan_08.pdf Author: James Gubb, Civitas, 12/2007
21
Variation by specialty
Thus far we have dealt with the aggregated picture; the picture of national performance on
all specialties. But this hides many disconcerting problems when we look more closely at the
specifics.
For one, the chance of a patient getting treated within 18 weeks varies fantastically between
medical specialties. Some of this is, of course, to be expected – medical need should always
be put before any target; a cardiothoracic operation is likely to be more urgent than a hip
replacement. But the point is that, inflexible as it stands, the 18 week target refers to all
electives. For some, such as cardiothoracic surgery, general medicine, gastroenterology or
geriatric medicine, where over 80% of patients whose clock has stopped are already being
treated within 18 weeks, the target looks imminently attainable; but for others the reverse is
true.
Fig. 8. Percentage of admitted patients treated within 18 weeks of referral, by medical
specialty, England, September 2007
Source: Department of Health 56
Oral surgery, neurosurgery and ear, nose & throat (ENT) are all areas of particular concern,
with less than 50% of patients treated within the target, but most worrying is trauma and
orthopaedics. As of September 2007, only 37% of trauma and orthopaedic patients were
treated within 18 weeks of referral; a massive problem, particularly when you consider it’s the
field of electives in most demand – the clock stopped for 42,577 patients here in September
© CIVITAS Institute for the Study of Civil Society 2007 www.civitas.org.uk/nhs/waitingtimes_Jan_08.pdf Author: James Gubb, Civitas, 12/2007
22
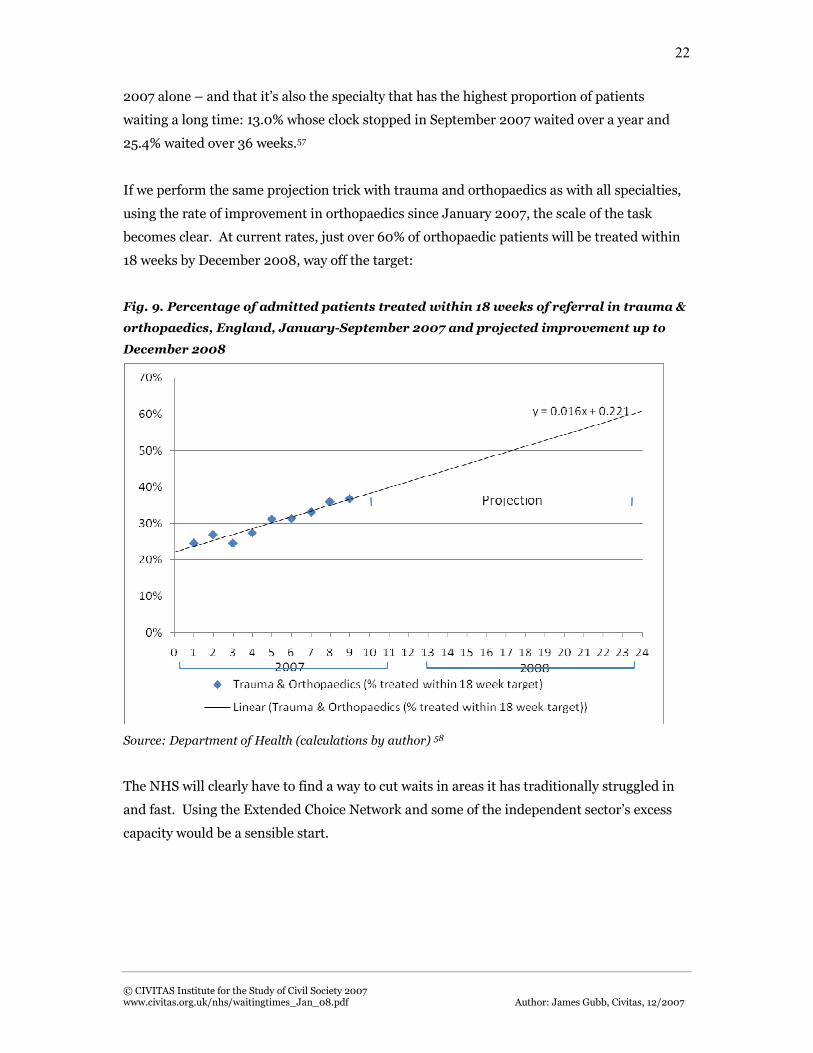
2007 alone – and that it’s also the specialty that has the highest proportion of patients
waiting a long time: 13.0% whose clock stopped in September 2007 waited over a year and
25.4% waited over 36 weeks.57
If we perform the same projection trick with trauma and orthopaedics as with all specialties,
using the rate of improvement in orthopaedics since January 2007, the scale of the task
becomes clear. At current rates, just over 60% of orthopaedic patients will be treated within
18 weeks by December 2008, way off the target:
Fig. 9. Percentage of admitted patients treated within 18 weeks of referral in trauma &
orthopaedics, England, January-September 2007 and projected improvement up to
December 2008
Source: Department of Health (calculations by author) 58
The NHS will clearly have to find a way to cut waits in areas it has traditionally struggled in
and fast. Using the Extended Choice Network and some of the independent sector’s excess
capacity would be a sensible start.

© CIVITAS Institute for the Study of Civil Society 2007 www.civitas.org.uk/nhs/waitingtimes_Jan_08.pdf Author: James Gubb, Civitas, 12/2007
23
Geographical variation
Not only is there real and substantial variation by specialty but also –and this is much harder
to justify – very significant variation in the number of patients treated within the 18-week
target by geographical location. Despite the advent of patient choice, much apparently still
depends on where a patient happens to live as to how quickly they can hope to be treated.
Strategic Health Authorities (SHAs)
Even at the regional level, differences are profound, with those having the misfortune of
living in London SHA or the South East Coast SHA clearly losing out. Respectively, just 44%
and 49% of patients in these SHAs, whose clock stopped in September 2007, were treated
within 18 weeks of referral, compared with 67% in West Midlands SHA – a huge difference.
Fig. 10. Percentage of admitted patients treated within 18 weeks of referral in each
SHA, England, September 2007
Source: Department of Health 59
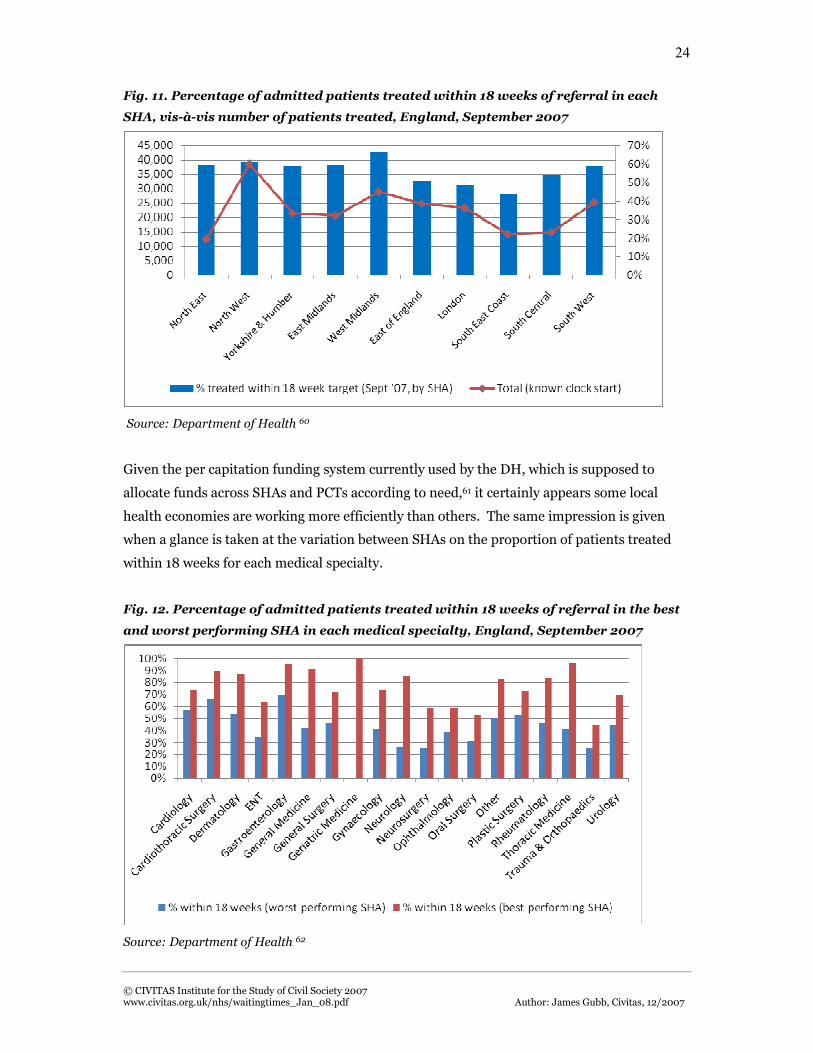
What’s more, this difference cannot be explained away by differences in demand, or
workload; it is not the case that London SHA and the South East Coast SHA are struggling to
treat patients within 18 weeks because they simply have to treat more patients. Yes, capacity
– a separate variable – obviously comes very much into the equation, but the two best
performing SHAs, West Midlands and North West, also treated the most patients overall in
September 2007, whereas South East Coast SHA actually treated the least.
© CIVITAS Institute for the Study of Civil Society 2007 www.civitas.org.uk/nhs/waitingtimes_Jan_08.pdf Author: James Gubb, Civitas, 12/2007
24
Fig. 11. Percentage of admitted patients treated within 18 weeks of referral in each
SHA, vis-à-vis number of patients treated, England, September 2007
Source: Department of Health 60
Given the per capitation funding system currently used by the DH, which is supposed to
allocate funds across SHAs and PCTs according to need,61 it certainly appears some local
health economies are working more efficiently than others. The same impression is given
when a glance is taken at the variation between SHAs on the proportion of patients treated
within 18 weeks for each medical specialty.
Fig. 12. Percentage of admitted patients treated within 18 weeks of referral in the best
and worst performing SHA in each medical specialty, England, September 2007
Source: Department of Health 62
© CIVITAS Institute for the Study of Civil Society 2007 www.civitas.org.uk/nhs/waitingtimes_Jan_08.pdf Author: James Gubb, Civitas, 12/2007
25
Disaggregated to this level, variation between the best and worst performing SHAs is even
more pronounced; in the case of neurology it’s over 200%. In the best, East Midlands SHA,
86% of patients referred for this specialty were treated within 18 weeks as of September
2007, compared with just 26% in the worst, North East SHA. This is the most extreme
example, but a similar picture is evident for most specialties; for ENT referrals, North East
SHA treated 64% within 18 weeks, compared with the 35% managed by South East Coast
SHA; Yorkshire & the Humber SHA treated 70% of urology referrals within 18 weeks
compared with just 44%, again in South East Coast SHA.63
Primary Care Trusts (PCTs)
Neither is there any let up when we look further down the chain at PCTs and providers – in
fact the more localised the data, the bigger the variations are. Even within SHAs there are
large discrepancies in the likelihood of a patient being treated within the 18 week target (see
Annex 1). This applies as much to the best performing as the worst: in West Midlands SHA,
83% of patients in Heart of Birmingham PCT were treated within 18 weeks of referral (for all
specialties) compared with 47% in Stoke-on-Trent PCT; in South East Coast SHA, 50% of
patients in Surrey PCT were treated within the target compared with just 33% in Hastings
and Rother PCT. But the variation is clearly even more pronounced when we look at PCTs
across England.64 Heart of Birmingham PCT, at 83%, is actually the best performer in the
country; in the worst, Brent Teaching PCT, only 32% of patients whose clock stopped in
September 2007 were treated in 18 weeks. This is a 51 percentage point difference.
See Annex 1 for: Fig. 13. Percentage of admitted patients treated within 18 weeks of
referral in each PCT, England, September 2007
But it’s not just that the weakest PCTs are struggling to get patients treated in less than 18
weeks; many of the weakest also have disproportionately high numbers of patients waiting a
very long time for treatment:

© CIVITAS Institute for the Study of Civil Society 2007 www.civitas.org.uk/nhs/waitingtimes_Jan_08.pdf Author: James Gubb, Civitas, 12/2007
26
Fig. 14. Number of admitted patients waiting longer than 52 weeks from referral to
treatment in the weakest PCTs, England, September 2007
Source: Department of Health 65
Taking the lowest quartile of PCTs falling below the national average of 57% for RTT in
September 2007, 15 out of 23 had more patients waiting longer than a year than the national
average of 128. In fact in Suffolk PCT 479 patients, or 15% of all elective patients, had been
waiting over a year for treatment.66
There is only one get-out clause here, which is that data completeness somehow explains
such differences away, but it is hard to believe such magnitudes could possibly be accounted
for unless PCTs are blatantly cheating the system and fixing figures. Moreover, it doesn’t
really stand up to scrutiny. It is true, for example, that the best performing PCT, Heart of
Birmingham, does only have a 60% data completeness ‘rating’, compared with Suffolk PCT’s
96%, but then the fourth best performing PCT, Telford and Wrekin PCT (with 79% treated
within 18 weeks) has the highest at 133%.67
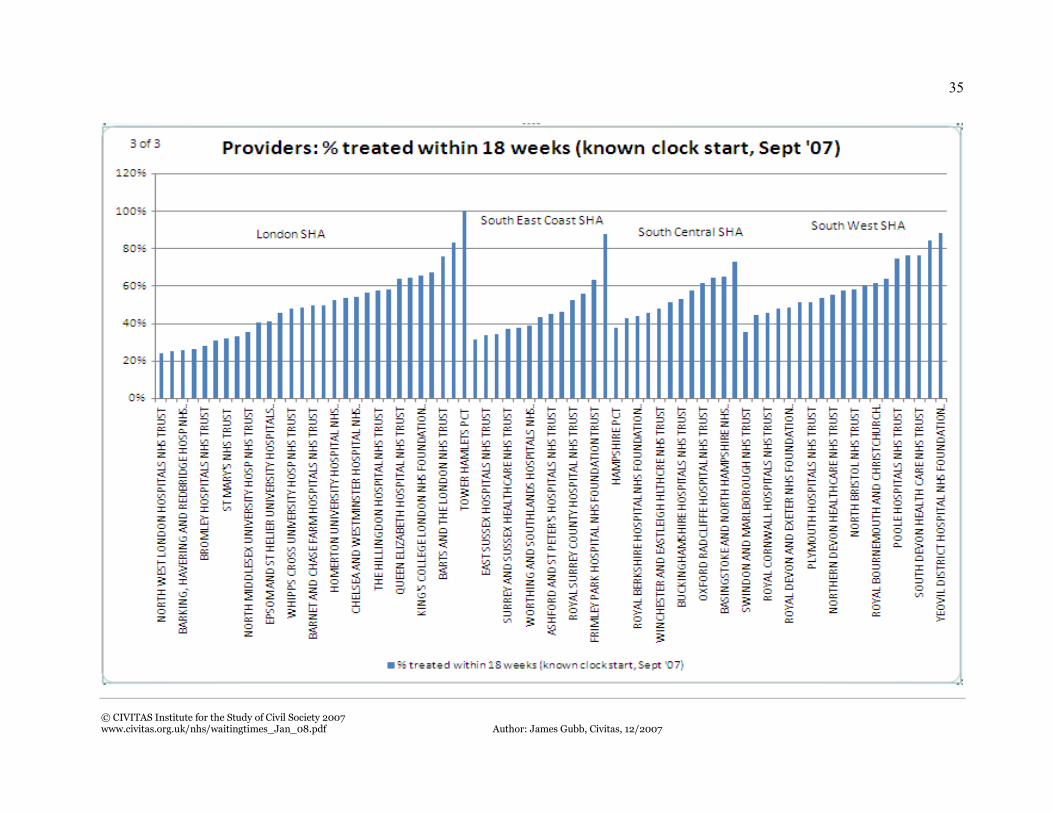
NHS Trusts/NHS Foundation Trusts
Unsurprisingly, the trend is also mirrored by RTT statistics so far as providers go:
See Annex 1 for: Fig. 15. Percentage of admitted patients treated within 18 weeks of
referral in each NHS (Foundation) Trust, England, September 2007

© CIVITAS Institute for the Study of Civil Society 2007 www.civitas.org.uk/nhs/waitingtimes_Jan_08.pdf Author: James Gubb, Civitas, 12/2007
27
Some providers are simply much more efficient at turning patients around than others; a
factor that – until patient choice is extended beyond localities to all willing providers in April
2008 – will either inhibit or enhance the efforts of PCTs to drive up performance. While not
excusing their commissioning role, PCTs are still, to an extent, stuck with the providers they
have. It is surely not a coincidence that Heart of Birmingham PCT (the best performing PCT)
is surrounded by hospital groups such as Heart of England NHS Foundation Trust,
University Hospital Birmingham NHS Foundation Trust, Sandwell & West Birmingham
Hospitals NHS Trust and Birmingham Children’s Hospital NHS Foundation Trust, that all
boast 18-week target statistics of above 75% of patients. 68
Similarly, the fact that Somerset PCT has one of the highest proportions of patients treated
within the target (79%) is surely in part down to the fact it has been able to take advantage of
a highly successful ISTC – the well-documented Shepton Mallet Treatment Centre – in its
midst.69 Dubbed the ‘Shepton Mallet effect’, the ISTC has, very literally, shaken up NHS
providers and bumped trusts such as Yeovil District Hospital NHS Foundation Trust, with
88% of patients treated within 18 weeks, and Taunton and Somerset NHS Trust with 76%, to
the top of the RTT ‘leaderboard’.
By contrast, it’s not going to help West Hertfordshire PCT that it’s surrounded by hospital
groups such as West Hertfordshire Hospitals NHS Trust and East & North Hertfordshire
NHS Trust, where the percentage of patients treated within 18 weeks stood at 23% and 36%
respectively in September 2007. Both were also rated ‘weak’ on use of resources, with West
Hertfordshire Hospitals NHS Trust also scoring ‘weak’ for quality of care, by the Healthcare
Commission in its annual health check for 2006/07.70 Perhaps not so coincidentally, it’s also
in a region – East of England SHA – where there’s not an ISTC in sight.
Evidently the postcode lottery is still very much a fact of life.

© CIVITAS Institute for the Study of Civil Society 2007 www.civitas.org.uk/nhs/waitingtimes_Jan_08.pdf Author: James Gubb, Civitas, 12/2007
28
C. Recommendations
On waiting times performance, the NHS has clearly got much better and clearly is still
getting better. Over the past decade waiting times have plummeted; the NHS is now treating
57% of patients within 18 weeks of referral to treatment – a massive achievement given its
long history of excessive waiting times. Just ten years ago many would have laughed at the
proposition of no-one waiting longer than 13 weeks for inpatient treatment and outpatient
appointments. Now it is the norm.
Nonetheless, the political pressure on trusts to get patients treated within 18 weeks of referral
is unrelenting. What this briefing shows is that, given current rates of improvement, it is
probably asking too much. Yes, there is the real possibility the NHS will up its game, but in
many cases this won’t be sufficient without a revolution in care. While some PCTs and NHS
Trusts are currently turning around 80% of patients within 18 weeks, for others, operating
nearer 20%, the target even of 90% looks a distant dream. Whatever the politicians’
rhetoric, nearly 20,000 patients still waiting over a year for treatment is much more
synonymous with a culture of waiting than one of booking. 71
A better way
Scrap the target
No-one would argue that it’s not desirable for elective waiting times to fall, or for the NHS to
be challenged, but the real question is: what is the best way to do it? Is it really through a
blanket 18-week target or is it through a more self-sustaining means?
Per se, targets are an incredibly blunt, Whitehall-focusing, and distortionary instrument for
change, but here, with such political capital at stake and with such wildly different
performance across the NHS, the collateral damage could be much worse. In monetary terms
it’s certainly going to be expensive: for 2007/08 alone the marginal cost of cutting waiting
times was estimated at £2.7 billion72 and it would come as no surprise if it consumed nearly
all the NHS’ 4% real-terms increase in funding this year. But it’s the unintended
consequences – particularly in trusts where meeting the target seems impossible – that we
should really be worrying about. What new ‘data tricks’ will be learnt?73 What effect will it
have on other areas of care, such as chronic or emergency; on the more urgent elective cases;
on the professionalism of the clinician; on the patient? If the experience of ‘gaming’
encountered with the original targets is anything to go by it could well be substantial and not
very welcome to say the least. The 18-week RTT waiting time target should be scrapped.

© CIVITAS Institute for the Study of Civil Society 2007 www.civitas.org.uk/nhs/waitingtimes_Jan_08.pdf Author: James Gubb, Civitas, 12/2007
29
Choice and competition
Instead, RTT waiting times for all providers – including the independent sector – should be
included in the information patients have when choosing where to have their elective
treatment. Patients can then decide how important waiting is to them, weighed against other
measures such as quality of care, length of stay, health outcomes and how far they are
prepared to travel for treatment.
As the government and the DH are increasingly coming to recognise, it is patient choice and
competition between providers that offers the long-term solution to waiting times, not
targets.
For a start, there is considerable excess capacity in the independent sector that the NHS
would do well to use. Utilisation rates in many ISTCs are still not at 100%,74 despite
standards of care being considerably higher than in many NHS hospitals,75 and it is estimated
that the independent sector could provide a further 250,000 to 300,000 procedures at the
NHS tariff through G-supp contracts.76
But the more significant point is the wider benefits of offering patients a choice, of there
being plurality in provision and there being competition between providers. As is the case
elsewhere, it is the ability of patients to compliment, complain and ultimately take their
‘business’ elsewhere that will drive providers of health care to improve. If this means more
patients choosing to have their treatment in the independent sector or the better NHS
hospitals, then they should be allowed to expand in response to this. At present there are still
local monopolies in the NHS that, in the words of Hayek, ‘prevent others from serving
customers better’.
Patient choice also offers a very effective avenue out of the postcode lottery of waits between
PCTs and NHS Trusts. If the local hospital can’t treat patients quickly and to a high
standard, the patient will simply choose to go elsewhere. As Tony Blair once said: ‘We only
got big falls in waiting times after introducing competition for routine surgery. Fact.’ 77
Many will of course argue that competition will irreparably damage the NHS, but this is
simply flawed. Yes, some NHS Trusts will inevitably have to reconfigure or even close – and
this will have to be managed properly to ensure access to chronic and emergency care is not
compromised – but this should be seen as a sign of the system as a whole becoming more
efficient and offering higher standards of care. NHS organisations should want, and have the
incentive, to treat more patients, not less in a desperate attempt to meet the 18-week target.
© CIVITAS Institute for the Study of Civil Society 2007 www.civitas.org.uk/nhs/waitingtimes_Jan_08.pdf Author: James Gubb, Civitas, 12/2007
30
And they clearly have the ability and capacity to. Sir Derek Wanless, in his recent report for
the King’s Fund, documented how the NHS could have treated an extra one million
emergency and elective patients in 2005/06 alone if it had used its extra money reasonably78
and the Healthcare Commission currently only ranks 37% of hospitals as either ‘excellent’ or
‘good’ on use of resources.79 How many more patients could NHS organisations be treating
if the incentives were right; if the Shepton Mallet experience were replicated across the
country?
To its credit, the DH has – in the Operating Framework for the NHS 2007/08 – at least put
in place the system for competition and patient choice to work. In April 2008 patients will be
able to choose between any willing provider in the country for elective procedures; the NHS
Choices website80 will be revamped to include information on the independent sector;
Choose and Book will no longer inappropriately exclude providers; rules have been
introduced to guard against block contracting and ensure providers are paid on a case-by-
case basis at the NHS tariff; and an independent competition panel has even been set up to
guard against monopolistic practice.81 The whole system of electives should be ‘patient-led’;
‘commissioners and providers should foster patient choice and ensure that patients have
accurate and reliable information to exercise more choice’.82 Included in such information
for the first time will also be patient-reported data on health outcomes, initially for hip or
knee, hernia and varicose veins operations, which will systematically measure whether
patients feel better after undergoing treatment.83 Despite the otherwise centralising feel of
the Operating Framework, this is a real step forward.84
The challenge must now be down to PCTs and GPs to encourage choice and competition to
ensure the window of opportunity that has been provided isn’t missed. ‘Commissioners
appear to be analytically underpowered and nervous about destabilising existing provider
networks’, commented John Appleby, chief economist at King’s Fund, recently ‘and they
behave as if they want to revert to central control and provider protectionism’.85 Indicative of
this, the number of patients who recalled being offered a choice of hospital for their first
outpatient appointment actually fell by 5% between March and July 2007 to a very lowly
43%86; and just 45% of GP referrals are using the Choose and Book system.87 For the benefits
of competition to be realised, and for waiting times to really accelerate downwards, this has
to change – and fast.
James Gubb
CIVITAS: The Institute for the Study of Civil Society
December 2007

© CIVITAS Institute for the Study of Civil Society 2007 www.civitas.org.uk/nhs/waitingtimes_Jan_08.pdf Author: James Gubb, Civitas, 12/2007
31
Annex 1. Fig.13 Percentage of admitted patients treated within 18 weeks of referral in each PCT, England, September 2007

© CIVITAS Institute for the Study of Civil Society 2007 www.civitas.org.uk/nhs/waitingtimes_Jan_08.pdf Author: James Gubb, Civitas, 12/2007
32

© CIVITAS Institute for the Study of Civil Society 2007 www.civitas.org.uk/nhs/waitingtimes_Jan_08.pdf Author: James Gubb, Civitas, 12/2007
33
Fig.15 Percentage of admitted patients treated within 18 weeks of referral in each NHS Trust, England, September 2007

© CIVITAS Institute for the Study of Civil Society 2007 www.civitas.org.uk/nhs/waitingtimes_Jan_08.pdf Author: James Gubb, Civitas, 12/2007
34
© CIVITAS Institute for the Study of Civil Society 2007 www.civitas.org.uk/nhs/waitingtimes_Jan_08.pdf Author: James Gubb, Civitas, 12/2007
35

© CIVITAS Institute for the Study of Civil Society 2007 www.civitas.org.uk/nhs/waitingtimes_Jan_08.pdf Author: James Gubb, Civitas, 12/2007
36
1 * All analysis of RTT data refers to admitted patients only, unless stated. Best and worst figures for NHS
Trusts/Foundation Trusts only include those that carried out more than 100 elective operations( where the known
clock stopped in September 2007) and in more than one specialty. 2 DH, Report on the National Patient Choice Survey, England – July 20077 3 Cited in: Yates, J, Why are we waiting? An analysis of hospital waiting lists, Oxford: OUP, 1987 4 Le Grand, J, The Blair Legacy: choice and competition in public services, public lecture given at the London
School of Economics, 21 February 2006, p.2 5 Department of Health, The NHS Plan: A plan for investment, a plan for reform, London: The Stationery Office,
2000, 6 O’Rourke, N, and Edwards, R, ‘Lung cancer waiting times and tumour growth’, Clinical Oncology, 12(2000)
141-144 7 Jones, G, ‘Milburn declares war on waiting’, The Daily Telegraph, 12 April 2000
8 DH, The NHS Plan, 2000 9 Appleby, J, ‘Let’s not get stuck in the queue’, The Guardian, 24 April 2006
10 Appleby. J, and Harrison, A, The War on Waiting for Hospital Treatment: What has Labour achieved and
what challenges remain?, London: King’s Fund, 2005 11 Department of Health, The NHS Improvement Plan: Putting people at the heart of public services, London:
The Stationery Office, 2004, Foreword by the Prime Minister 12
Appleby and Harrison, The War on Waiting for Hospital Treatment, 2005, p.4 13
DH, The NHS Improvement Plan, 2004, ch. 2 14 Ibid, ch.5 15
Department of Health, Report on the National Patient Choice Survey, England – July 2007, London: The
Stationery Office, 2007
The report showed that just 43 per cent of patients recalled being offered a choice of hospital for their first
outpatient appointment in July 2007, compared with 48% in March.
NHS Connecting for Health, Latest Deployment Statistics and Information, London: NHS Connecting for
Health, 2007
The latest statistics show that only around 45% of GP referrals are currently using the Choose and Book system. 16 Department of Health, The Operating Framework for the NHS in England 2008/09, London: The Stationery
Office, 2007 17
Laurance, J, ‘Minister hails end of NHS waiting lists’, The Independent, 8 June 2007 18
Department of Health, Chief Executive’s Report to the NHS – Statistical Supplement, London: The Stationery
Office, 2006 19
Department of Health, Hospital Activity Statistics, 2007. Available at:
http://www.performance.doh.gov.uk/hospitalactivity/data_requests/total_time_ae.htm (accessed on 20 December
2007)
20
Department of Health, Hospital Waiting Times/List Statistics (Commissioner based), 2007. Available at:
http://www.performance.doh.gov.uk/waitingtimes/index.htm (accessed on 20 December 2007) 21 DH, Hospital Waiting Times/List Statistics (Commissioner based), 2007. Available at:
http://www.performance.doh.gov.uk/waitingtimes/index.htm (accessed 20 December 2007) 22
The Information Centre, Hospital Episode Statistics, 2007. Available at:
http://www.hesonline.nhs.uk/Ease/servlet/ContentServer?siteID=1937&categoryID=209 (accessed 23
December 2007)
Time waited statistics from Hospital Episode Statistics (HES) are not the same as the published waiting list
statistics. HES provides counts and time waited for all patients admitted to hospital within a given period
whereas the published waiting list statistics count those waiting for treatment on a specific date and how long
they have been on the waiting list. Also, HES calculates the time waited as the difference between the admission
and decision to admit dates. Unlike published waiting list statistics this is not adjusted for self-deferrals or
periods of medical/social suspension. 23
Bevan, G and Hood, C, Have targets improved performance in the English NHS?, BMJ 2006 332: 419-422 24 Seddon, N, Quite like heaven? Options for the NHS in a consumer age, London: Civitas, 2007, p.61 25 Healthcare Commission, Patient Survey 2005 – PCTs, London: The Stationery Office, 2005, p.3 26
Audit Commission, Data Quality in the NHS, London: Audit Commission, 2004 27
Healthcare Commission, State of Healthcare 2005, London: The Stationery Office, 2005, ch.1 28 Cited in: Bevan and Hood, Have targets improved performance in the English NHS?, BMJ 2006 332: 419-422
© CIVITAS Institute for the Study of Civil Society 2007 www.civitas.org.uk/nhs/waitingtimes_Jan_08.pdf Author: James Gubb, Civitas, 12/2007
37
29 Cited in: Seddon, J, Freedom from command and control: A better way to make work work, Buckingham:
Vanguard Education Ltd., 2005, pp.211-212 30
Healthcare Commission, Patient Survey 2005 – PCTs, London: The Stationery Office, 2005, Executive
Summary 31 See, for example: Healthcare Commission, Hospital Associated Infection: What else can the NHS do?,
London: The Stationery Office, 2007. In this report, 45 per cent of the 155 NHS Trusts the Healthcare
Commission surveyed reported that waiting time targets were putting infection control measures at risk. 32
Burstow, P, The Hidden Waiting List: an investigation into hidden waiting times for diagnostics in the NHS,
2004 33
DH, The Operating Framework for the NHS in England 2008/09, 2007, p.24
While not admitting their downfalls, the current Secretary of State for Health, Alan Johnson, for example,
recently said on the Today programme: ‘Targets were very necessary when we came in, in 1997. You could
describe the NHS as being in intensive care. There was a terrible record of long waiting lists et cetera…[but
now], as we are out of intensive care and on the road to recovery in the NHS, so to speak, we need to move away
from targets.’ 34
Laurance, J, ‘Minister hails end of NHS waiting lists’, The Independent, 8 June 2007 35 DH, The NHS Improvement Plan, 2004, Section 2 36 DH, The Operating Framework for the NHS in England 2007/08, 2006, p.9 37
Harrison and Thorlby, 18-week waiting times target, 2007, p.3 38
DH, The Operating Framework for the NHS in England 2008/09, 2007, p.13 39 Carvel, J, ‘Minister allows ‘buffer zone’ for hospitals to hit 18-week target’, The Guardian, 9 November 2007 40
Department of Health, 18 Weeks Referral to Treatment (Commissioner based), 2007. Available at:
http://www.performance.doh.gov.uk/rtt/commissioner.html (accessed 20 December 2007) 41
Department of Health, 18 Weeks Referral to Treatment – Non-admitted patients (Commissioner based), 2007.
Available at: http://www.performance.doh.gov.uk/rtt/commissioner.html (accessed 20 December 2007) 42
All analysis of RTT data from this point forward refers to admitted patients only, unless stated. Best and
worst figures for NHS Trusts/Foundation Trusts only include those that carried out more than 100 elective
operations( where the known clock stopped in September 2007) and in more than one specialty. 43 Ibid. 44 Moore, A, ‘Waiting times: early runners set to be first past 18-week post’, Health Service Journal, 5
December 2007 45
Department of Health, 18 Weeks Referral to Treatment – Incomplete Pathways (Commissioner based), 2007.
Available at: http://www.performance.doh.gov.uk/rtt/commissioner.html (accessed 20 December 2007) 46
Wanless, D, et al., Our Future Health Secured? A review of NHS funding and performance, London: The
King’s Fund, 2007, p.xxi 47
DH, 18 Weeks Referral to Treatment (Commissioner based), September 2007. Available at:
http://www.performance.doh.gov.uk/rtt/commissioner.html (accessed 20 December 2007) 48
Ibid, ‘Data Completeness’ tables. 49
Moore, A, ‘Waiting times: early runners set to be first past 18-week post’, HSJ, 5 December 2007. Citing
comments made by Lynne Roswell, director of performance at Doncaster and Bassetlaw Hospitals NHS Foundation
Trust. 50
DH, 18 Weeks Referral to Treatment (Commissioner based), 2007. Available at:
http://www.performance.doh.gov.uk/rtt/commissioner.html (accessed 20 December 2007)
The indications are that the numbers waiting a long time have also falling since data was first published in
January 2007 – for example, 26,887 patients waited longer than a year – though direct comparison on absolute
numbers is probably not appropriate here due to the very high levels of incomplete data. 51 Moore, ‘Waiting times: early runners set to be first past 18-week post’, HSJ, 5 December 2007 52
DH, 18 Weeks Referral to Treatment – Incomplete Pathways (Commissioner based), 2007. Available at:
http://www.performance.doh.gov.uk/rtt/commissioner.html (accessed 20 December 2007)
The indications are that the numbers waiting a long time have also falling since data was first published in
January 2007 – for example, 26,887 patients waited longer than a year – though direct comparison on absolute
numbers is probably not appropriate here due to the very high levels of incomplete data. 53
Department of Health, Monthly and Quarterly/Biannual Diagnostics Statistics, 2007. Available at:
http://www.performance.doh.gov.uk/diagnostics/commissioner.html (accessed 20 December 2007) 54 Ibid. 55
Department of Health, ‘Johnson outlines new measures to deliver more choice and faster treatment to
patients’, Government News Network, Press release, 15 November 2007. Available at:

© CIVITAS Institute for the Study of Civil Society 2007 www.civitas.org.uk/nhs/waitingtimes_Jan_08.pdf Author: James Gubb, Civitas, 12/2007
38
https://www.gnn.gov.uk/imagelibrary/detail.asp?MediaDetailsID=223252&HUserID=878,793,889,857,779,869,
864,845,786,674,677,767,684,762,718,674,708,683,706,718,674 56
DH, 18 Weeks Referral to Treatment (Commissioner based), 2007. Available at:
http://www.performance.doh.gov.uk/rtt/commissioner.html (accessed 20 December 2007) 57 DH, 18 Weeks Referral to Treatment (Commissioner based), 2007. Available at:
http://www.performance.doh.gov.uk/rtt/commissioner.html (accessed 20 December 2007) 58
Ibid. 59
DH, 18 Weeks Referral to Treatment (Commissioner based), 2007. Available at:
http://www.performance.doh.gov.uk/rtt/commissioner.html (accessed 20 December 2007) 60
DH, 18 Weeks Referral to Treatment (Commissioner based), 2007. Available at:
http://www.performance.doh.gov.uk/rtt/commissioner.html (accessed 20 December 2007) 61
DH, The Operating Framework for the NHS in England 2008/09, 2007, pp.40-44 62 DH, 18 Weeks Referral to Treatment (Commissioner based), 2007. Available at:
http://www.performance.doh.gov.uk/rtt/commissioner.html (accessed 20 December 2007) 63
Ibid. 64
Ibid. 65 Ibid. 66 Ibid. 67
Ibid., ‘Data Completeness’ tables. 68
DH, 18 Weeks Referral to Treatment (Provider based), 2007. Available at:
http://www.performance.doh.gov.uk/rtt/provider.html (accessed 20 December 2007) 69
House of Commons Health Committee, Independent Sector Treatment Centres: Fourth Report of the Session
2005/06, London: The Stationery Office, 2006, Ev 112:Volume II 70
Healthcare Commission, The Annual Health Check 2006/07, London: The Stationery Office, 2007 71 NHS Connecting for Health, Latest Deployment Statistics and Information, London: NHS Connecting for
Health, 2007
In fact the latest data shows only 45% of patients are booking at all. 72
HM Treasury, 2004 Spending Review: Stability, security and opportunity for all – investing for Britain’s long-
term future, London: The Stationery Office, 2004 73 Already there are reports that patients are suffering delays in getting follow-up appointments as the pressure to
meet the 18-week target mounts – something not included in RTT statistics, but nonetheless vitally important.
See: Moore, A, ‘Waiting times: early runners set to be first past 18-week post’, HSJ, 5 December 2007
release, 15 November 2007 75
Healthcare Commission, Independent Sector Treatment Centres – A Review of the Quality of Care, London:
The Stationery Office, 2007 76 Timmins, N, ‘Bupa Hospitals lures NHS patients’, Financial Times, 12 July 2007 77
The Times Report on Labour Conference, 2005. Available at: http://www.timesonline.co.uk/article/0,,2-
1801240,00.html 78
Wanless, Our Future Health Secured?, 2007, p.234 79 Healthcare Commission, The Annual Health Check 2006/07, 2007 80 www.nhs.uk 81
DH, The Operating Framework for the NHS in England 2008/09, 2007, pp.24, 28, 31-33 82
Ibid, p.28 83 Timmins, N, ‘NHS in crucial step to better care’, Financial Times, 15 December 2007 84
Gainsbury, S, ‘Operating framework reasserts DH’s control’, Health Service Journal, 20 December 2007 85
Quoted in: Seddon, N, ‘Unwelcome advances’, The Guardian, 28 November 2007 86
DH, Report on the National Patient Choice Survey, England – July 20077 87 NHS Connecting for Health, Latest Deployment Statistics and Information, London: NHS Connecting for
Health, 2007

© CIVITAS Institute for the Study of Civil Society 2007 www.civitas.org.uk/nhs/waitingtimes_Jan_08.pdf Author: James Gubb, Civitas, 12/2007
39

© CIVITAS Institute for the Study of Civil Society 2007 www.civitas.org.uk/nhs/waitingtimes_Jan_08.pdf Author: James Gubb, Civitas, 12/2007
40
© Civitas 2007
77 Great Peter Street
London SW1P 2EZ
Civitas is a registered charity (no. 1085494)
and a company limited by guarantee, registered in
England and Wales (no. 04023541)
email: [email protected]
All rights reserved
Independence: Civitas: Institute for the Study of Civil Society is a registered educational charity (No.
1085494) and a company limited by guarantee (No. 04023541). Civitas is financed from a variety of
private sources to avoid over-reliance on any single or small group of donors.
All the Institute’s publications seek to further its objective of promoting the advancement of
learning. The views expressed are those of the author, not of the Institute.