Embed Size (px)
Citation preview
Nerves of steel
Who’s ready to get tough on emissions?Executive Summary
Authors: Drew Fryer, Chloe Chan and Tom Crocker
October 2016

2
CDP’s sector research for investors provides the best and most tailored environmental data in the
market. CDP’s team of analysts, voted no. 1 climate change research provider in 2015 by institutional
investors, takes an in-depth look at high emitting industries one-by-one, starting with the automotive
industry, electric utilities, diversified chemicals, metals & mining, cement, and now steel. Forthcoming
is research on the oil & gas industry.
The full report is available to CDP investor signatories and includes detailed analysis, methodology
and recommended areas of engagement for investors to raise with company management teams. In
addition, a separate engagement booklet providing further detail on company specific engagement
ideas is available to CDP signatories on request.
For more information see:
https://www.cdp.net/en/investor/sector-research

3
Linking emissions-related metrics to earnings for steel companies
OverviewThis report, covering steelmaking companies, is the latest in a series of investor-focused reports covering high emitting sectors. CDP has previously published reports on auto manufacturers (February 2015 and March 2016), European electric utilities (May 2015), chemicals companies (August 2015), diversified miners (November 2015), and cement companies (June 2016). The oil & gas sector will be the next in CDP’s sector research series. Each report features a CDP League Table that ranks companies in an industry grouping on a number of emissions and water-related metrics relevant to that industry. When taken in aggregate, we believe these metrics could have a material impact on company’s earnings and therefore investment decisions. In this report, we launch a CDP League Table for steel companies that ranks 14 of the largest and highest emitting steelmakers.
Scope of report: key areas
There are six key areas in our League Table:
{ Emissions and energy management: steel companies report that energy costs can represent over 40% of operating costs. Using company emissions and energy intensity profiles, this key area assesses which steelmakers are currently the most efficient and which may be least exposed to potential rises in energy and carbon costs.
{ Emissions targets and pathways: we examine companies’ forward-looking emissions reduction targets, comparing companies’ targets and their progress against them with science-based targets under the Sectoral Decarbonization Approach1.
{ Carbon cost exposure: examines the potential earnings impacts on the companies in our study under different carbon pricing regulation scenarios including emissions allowances allocated under intensity benchmarking, and under full global auctioning. We also assess whether companies make use of an internal carbon price.
{ Low carbon technology development: to meet global goals to limit global warming to 2 degrees Celsius, emissions intensive steelmaking processes will have to undergo a technology transformation. This key area identifies company involvement and progress in breakthrough emissions reduction projects, and compares the level of focus on research and development between companies.
{ Water resilience: we assess steel companies’ exposure to risks from water stress, undertaking facility-level analysis to assess which companies are at greater risk of business interruption due to water stress. We also compare their respective levels of water consumption and water recycling.
{ Climate governance: we use proprietary analysis by InfluenceMap2 to assess each company’s actions in supporting or opposing meaningful carbon regulation, and information on the alignment of executive and employee remuneration with climate risk management actions.
{With governments globally agreeing to limit climate change to 2 degrees Celsius at COP21, the global steel industry will face increasing pressure to reduce its significant emissions profile. The steel industry contributes 6-7% of global anthropogenic greenhouse gas emissions, and has limited potential to reduce its emissions based on currently available technology.
{This report introduces CDP’s League Table for steel, highlighting company performance across a range of emissions and water-related metrics which in aggregate could have a material impact on company performance.
{Highest ranked companies are POSCO, SSAB, ThyssenKrupp, and Hyundai Steel.
{Lowest ranked companies are United States Steel, Tata Steel, CSN, and Evraz.
1. The Sectoral Decarbonization Approach is a method for setting corporate emissions reduction targets in line with climate science. See the chapter “Emissions targets and pathways” for more details.
2. A UK-based not-for-profit whose remit is to map, analyse and score the extent to which corporations are influencing climate policy and legislation. http://influencemap.org/
4
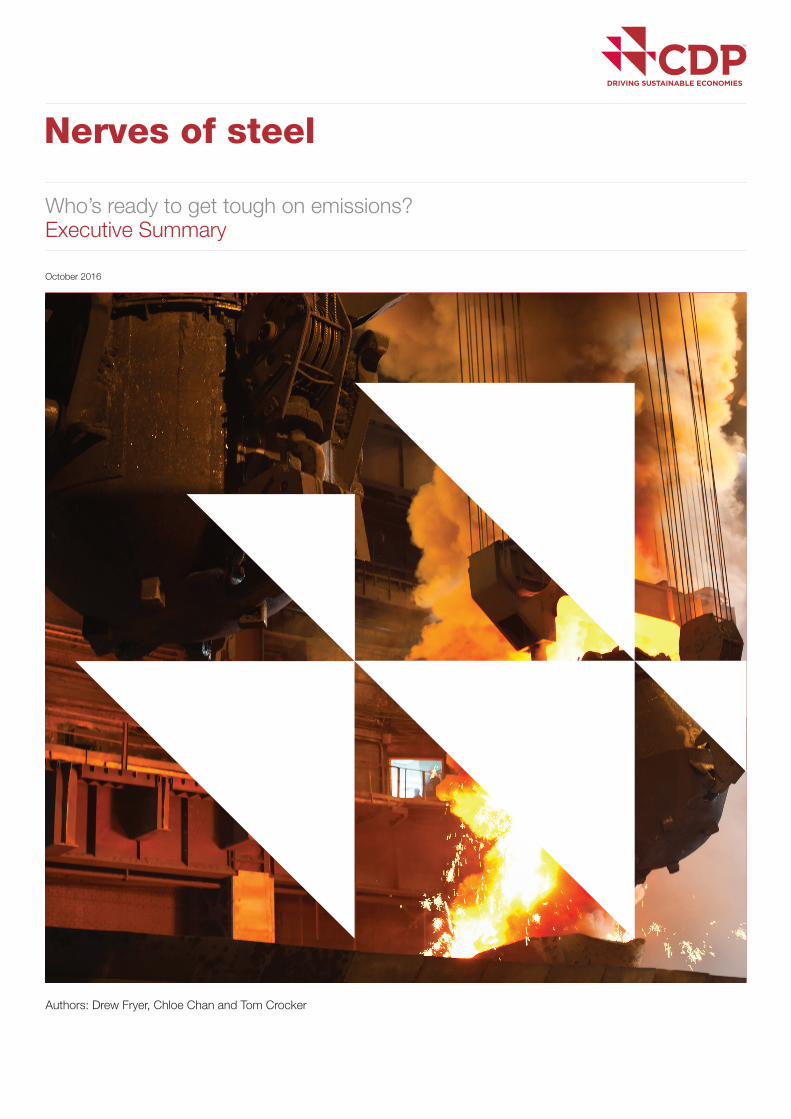
Key findings { Progress in reducing emissions and energy use is
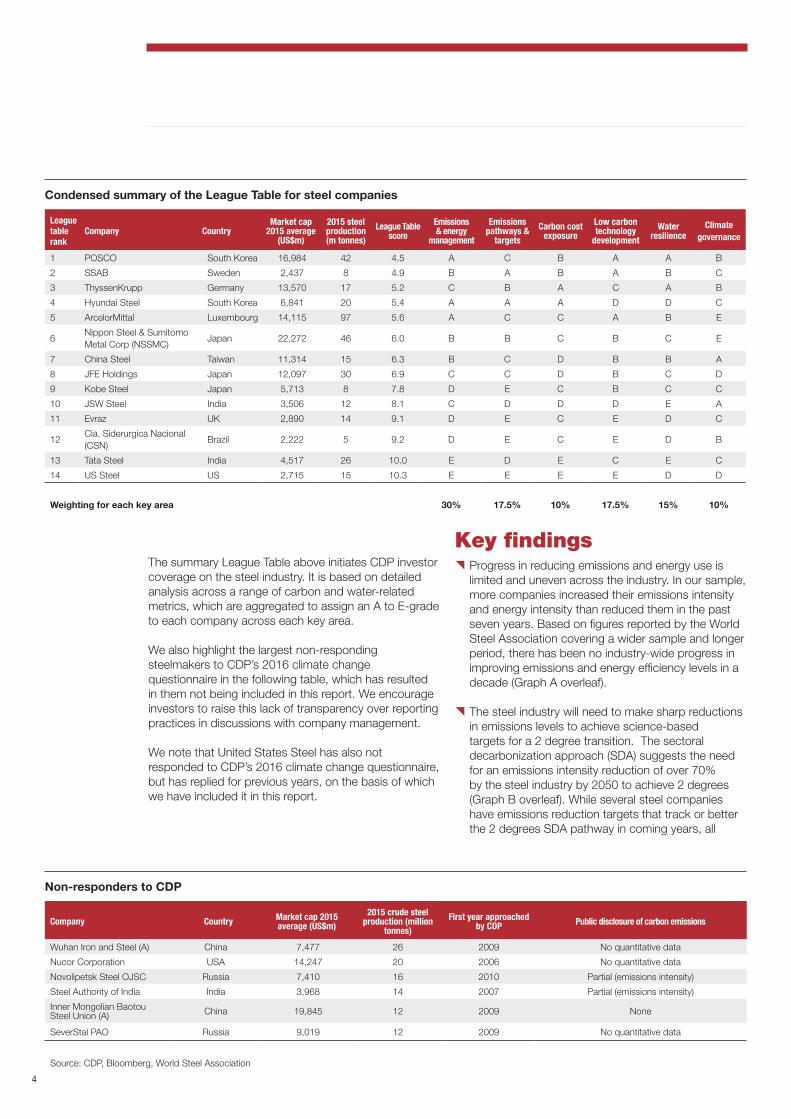
limited and uneven across the industry. In our sample, more companies increased their emissions intensity and energy intensity than reduced them in the past seven years. Based on figures reported by the World Steel Association covering a wider sample and longer period, there has been no industry-wide progress in improving emissions and energy efficiency levels in a decade (Graph A overleaf).
{ The steel industry will need to make sharp reductions in emissions levels to achieve science-based targets for a 2 degree transition. The sectoral decarbonization approach (SDA) suggests the need for an emissions intensity reduction of over 70% by the steel industry by 2050 to achieve 2 degrees (Graph B overleaf). While several steel companies have emissions reduction targets that track or better the 2 degrees SDA pathway in coming years, all
Non-responders to CDP
Company Country Market cap 2015 average (US$m)
2015 crude steel production (million
tonnes)First year approached
by CDP Public disclosure of carbon emissions
Wuhan Iron and Steel (A) China 7,477 26 2009 No quantitative data
Nucor Corporation USA 14,247 20 2006 No quantitative data
Novolipetsk Steel OJSC Russia 7,410 16 2010 Partial (emissions intensity)
Steel Authority of India India 3,968 14 2007 Partial (emissions intensity)
Inner Mongolian Baotou Steel Union (A) China 19,845 12 2009 None
SeverStal PAO Russia 9,019 12 2009 No quantitative data
Source: CDP, Bloomberg, World Steel Association
Condensed summary of the League Table for steel companies
League table rank
Company CountryMarket cap
2015 average (US$m)
2015 steel production (m tonnes)
League Table score
Emissions & energy
management
Emissions pathways &
targetsCarbon cost
exposureLow carbon technology
developmentWater
resilienceClimate
governance
1 POSCO South Korea 16,984 42 4.5 A C B A A B
2 SSAB Sweden 2,437 8 4.9 B A B A B C
3 ThyssenKrupp Germany 13,570 17 5.2 C B A C A B
4 Hyundai Steel South Korea 6,841 20 5.4 A A A D D C
5 ArcelorMittal Luxembourg 14,115 97 5.6 A C C A B E
6Nippon Steel & Sumitomo Metal Corp (NSSMC)
Japan 22,272 46 6.0 B B C B C E
7 China Steel Taiwan 11,314 15 6.3 B C D B B A
8 JFE Holdings Japan 12,097 30 6.9 C C D B C D
9 Kobe Steel Japan 5,713 8 7.8 D E C B C C
10 JSW Steel India 3,506 12 8.1 C D D D E A
11 Evraz UK 2,890 14 9.1 D E C E D C
12Cia. Siderurgica Nacional (CSN)
Brazil 2,222 5 9.2 D E C E D B
13 Tata Steel India 4,517 26 10.0 E D E C E C
14 US Steel US 2,715 15 10.3 E E E E D D
Weighting for each key area 30% 17.5% 10% 17.5% 15% 10%
The summary League Table above initiates CDP investor coverage on the steel industry. It is based on detailed analysis across a range of carbon and water-related metrics, which are aggregated to assign an A to E-grade to each company across each key area.
We also highlight the largest non-responding steelmakers to CDP’s 2016 climate change questionnaire in the following table, which has resulted in them not being included in this report. We encourage investors to raise this lack of transparency over reporting practices in discussions with company management.
We note that United States Steel has also not responded to CDP’s 2016 climate change questionnaire, but has replied for previous years, on the basis of which we have included it in this report.

5
these targets expire by 2020. Six out of fourteen companies in our sample have not published forward looking targets, or have targets that expire in 2016.
{ A range of projects are underway to develop technologies that could provide the deep decarbonization needed by the industry to achieve a 2 degree transition. However, most are at feasibility or piloting stages and not technically or commercially proven. With current low industry profitability, research and development expenses have been cut in recent years. With the timeframe for most technology transitions spanning multiple decades, slow progress now puts at risk efforts toward long-term global and country targets for decarbonization.
{ Adequate levels of funding for incremental and breakthrough emissions reduction needs to be a priority by companies and governments to ensure long term decarbonization targets are not missed. In particular, progress has been slow in realising the potential for carbon capture and sequestration (CCS), with no CCS pilots underway in the steel industry and little signs of near term progress. Recent investment announcements suggest several steelmakers currently see more potential in carbon capture and utilization (CCU) for steelmaking, though the scale of its emissions reduction potential remains unproven.
{ Over 70% of world steel production will be subject to a carbon price by end 2017, including from emissions trading schemes, carbon taxes or climate-focused coal taxes. Without success in realizing the potential of breakthrough low emissions technologies, steelmakers could face a continuously rising burden of carbon permit obligations.
{ Debate between industry and regulators over ‘carbon
leakage’ will enter a new phase in coming years as more countries introduce carbon prices. The steel industry, while generally supportive of climate change regulation in principle, has sometimes obstructed it in practice, arguing it could create distortions in production decisions between regions with and without carbon prices. The largest steelmakers in developed countries and their trade associations have been active in demanding free permit allocations and other concessions, which some have argued blunt the effectiveness of carbon prices in their current form.
{ Steelmakers are projected to face increasing water stress that could cause future localised disruption to operations. In 2015, 3% of steelmaking sites assessed were based in high water stress areas according to our analysis using WRI Aqueduct. By 2030, 20% of sites assessed are projected to be in high risk areas and 8% in extremely high risk areas.
{ Most Chinese steelmakers provide much less transparency on climate change strategies and greenhouse gas emissions than their global peers. Only one of China’s largest fifteen steelmakers, which represent 40% of Chinese production, discloses emissions. Steelmaking in China now accounts for 50% of global production, and steelmakers there face growing carbon risks, with a national emissions trading scheme to be introduced in 2017, and indications that environmental factors could frame regulator’s decisions on how to reduce China’s steel overcapacity. Investors currently lack adequate climate-related disclosures to assess individual company risk and preparedness, and make informed investment decisions.
Graph B: Steel industry 2 degree transition pathway
2.5
2.0
1.5
1.0
0.5
0 0
-50%
-100%
2013
2015
2020
2025
2030
2035
2040
2045
2050
Source: Aligning corporate greenhouse-gas emissions targets with climate goals’ in Nature Climate Change (2015), updated using IEA Energy Technology Perspectives 2016
Reductions from 2013 base (RHS)
Scope 1 & 2 emissions intensity (LHS)
tCO
2 pe
r to
nne
crud
e st
eel
-2% -7%-21%
-40% -52% -62% -68% -71%
Graph A: Steel industry emissions and energy use
2.0
1.9
1.8
1.7
1.6
1.5
1.4
1.3
26
25
24
23
22
21
20
19
2004
2005
2006
2007
2008
2009
2010
2011
2012
2013
2014
Source: World Steel Association
Emissions intensity (LHS)
Energy intensity (RHS)
Ene
rgy
inte
nsity
(GJ/
tonn
e of
cru
de s
teel
)
Em
issi
ons
inte
nsity
(ton
nes
CO
2/to
nne
crud
e st
eel)
6
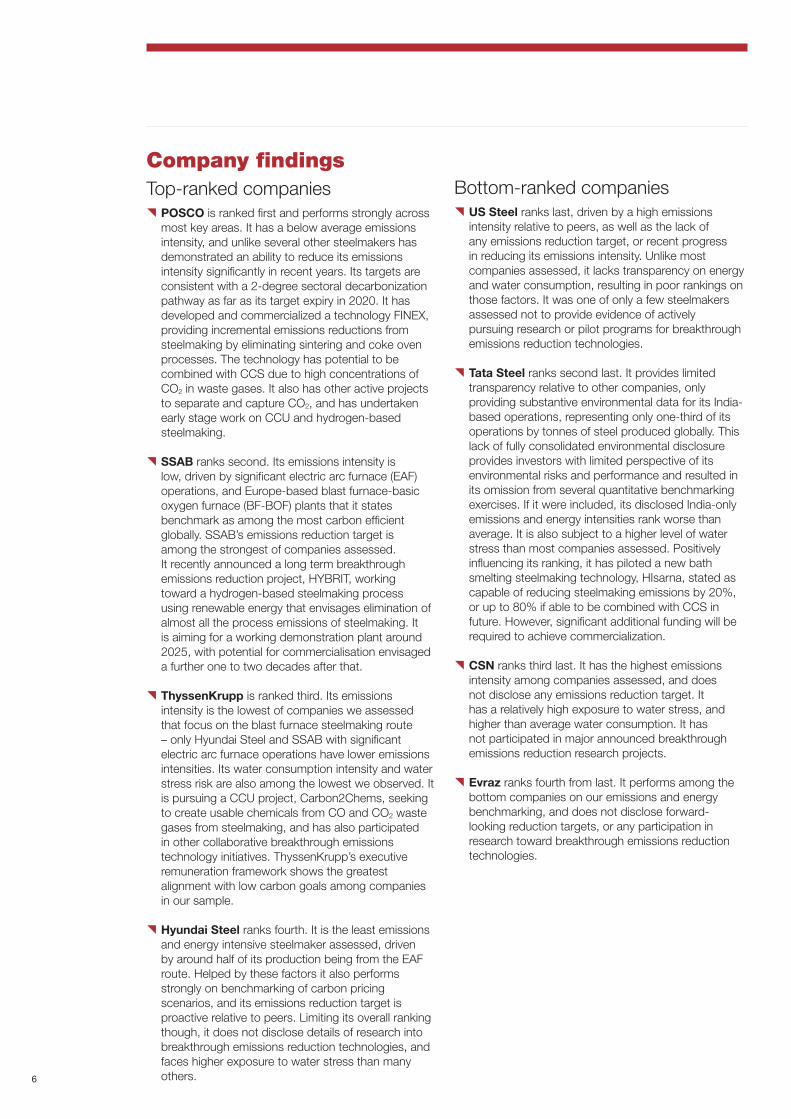
Company findingsTop-ranked companies{ POSCO is ranked first and performs strongly across
most key areas. It has a below average emissions intensity, and unlike several other steelmakers has demonstrated an ability to reduce its emissions intensity significantly in recent years. Its targets are consistent with a 2-degree sectoral decarbonization pathway as far as its target expiry in 2020. It has developed and commercialized a technology FINEX, providing incremental emissions reductions from steelmaking by eliminating sintering and coke oven processes. The technology has potential to be combined with CCS due to high concentrations of CO2 in waste gases. It also has other active projects to separate and capture CO2, and has undertaken early stage work on CCU and hydrogen-based steelmaking.
{ SSAB ranks second. Its emissions intensity is low, driven by significant electric arc furnace (EAF) operations, and Europe-based blast furnace-basic oxygen furnace (BF-BOF) plants that it states benchmark as among the most carbon efficient globally. SSAB’s emissions reduction target is among the strongest of companies assessed. It recently announced a long term breakthrough emissions reduction project, HYBRIT, working toward a hydrogen-based steelmaking process using renewable energy that envisages elimination of almost all the process emissions of steelmaking. It is aiming for a working demonstration plant around 2025, with potential for commercialisation envisaged a further one to two decades after that.
{ ThyssenKrupp is ranked third. Its emissions intensity is the lowest of companies we assessed that focus on the blast furnace steelmaking route – only Hyundai Steel and SSAB with significant electric arc furnace operations have lower emissions intensities. Its water consumption intensity and water stress risk are also among the lowest we observed. It is pursuing a CCU project, Carbon2Chems, seeking to create usable chemicals from CO and CO2 waste gases from steelmaking, and has also participated in other collaborative breakthrough emissions technology initiatives. ThyssenKrupp’s executive remuneration framework shows the greatest alignment with low carbon goals among companies in our sample.
{ Hyundai Steel ranks fourth. It is the least emissions and energy intensive steelmaker assessed, driven by around half of its production being from the EAF route. Helped by these factors it also performs strongly on benchmarking of carbon pricing scenarios, and its emissions reduction target is proactive relative to peers. Limiting its overall ranking though, it does not disclose details of research into breakthrough emissions reduction technologies, and faces higher exposure to water stress than many others.
Bottom-ranked companies{ US Steel ranks last, driven by a high emissions
intensity relative to peers, as well as the lack of any emissions reduction target, or recent progress in reducing its emissions intensity. Unlike most companies assessed, it lacks transparency on energy and water consumption, resulting in poor rankings on those factors. It was one of only a few steelmakers assessed not to provide evidence of actively pursuing research or pilot programs for breakthrough emissions reduction technologies.
{ Tata Steel ranks second last. It provides limited transparency relative to other companies, only providing substantive environmental data for its India-based operations, representing only one-third of its operations by tonnes of steel produced globally. This lack of fully consolidated environmental disclosure provides investors with limited perspective of its environmental risks and performance and resulted in its omission from several quantitative benchmarking exercises. If it were included, its disclosed India-only emissions and energy intensities rank worse than average. It is also subject to a higher level of water stress than most companies assessed. Positively influencing its ranking, it has piloted a new bath smelting steelmaking technology, HIsarna, stated as capable of reducing steelmaking emissions by 20%, or up to 80% if able to be combined with CCS in future. However, significant additional funding will be required to achieve commercialization.
{ CSN ranks third last. It has the highest emissions intensity among companies assessed, and does not disclose any emissions reduction target. It has a relatively high exposure to water stress, and higher than average water consumption. It has not participated in major announced breakthrough emissions reduction research projects.
{ Evraz ranks fourth from last. It performs among the
bottom companies on our emissions and energy benchmarking, and does not disclose forward- looking reduction targets, or any participation in research toward breakthrough emissions reduction technologies.

7
Mid-ranked companies
{ ArcelorMittal ranks fifth. Its emissions and energy intensities are better than average and most other quantitative KPIs are in the average range overall, reflecting a diverse spread of operations worldwide. It ranks highly on breakthrough emissions reduction technology development, with a demonstration sized Lanzatech CCU plant to start operating in 2017 to convert steel waste gases into usable by-products. It also made some progress toward a CCS pilot, before putting plans on hiatus and withdrawing its application for EU funding in late 2012, but emphasizes that work continues toward realising this ambition. Analysis by InfluenceMap indicates that ArcelorMittal has been the most active in opposing unilateral carbon pricing in countries where it operates, including lobbying against strengthening the carbon price signal in Europe.
{ Nippon Steel & Sumitomo Metal Corp (NSSMC) ranks sixth. Its emissions intensity is slightly better than average and it has a relatively strong emissions reduction target, though it is demonstrating little progress in reducing actual emissions. Like other Japanese steelmakers it is part of the COURSE50 consortium to develop breakthrough technologies involving hydrogen-based reduction and carbon capture. InfluenceMap analysis identifies it as among the companies most obstructive to incremental carbon regulation and pricing in the steel industry.
{ China Steel ranks seventh. It ranks poorly on emissions transparency, failing to disclose consolidated environmental data based on its full operational footprint, excluding a key 100% owned steelmaking subsidiary that accounts one-third of its steel production. Once manually consolidated, its environmental efficiency metrics generally fall in the mid-range for companies assessed. It is an early adopter of CCU technology, building one of the first demonstration sized Lanzatech plants.
{ JFE Holdings ranks eighth. Its environmental efficiency metrics fall within the average range relative to its industry. With other Japanese steelmakers it is part of the COURSE50 consortium to develop breakthrough technologies involving hydrogen-based reduction and carbon capture.
{ Kobe Steel ranks ninth. Its emissions and energy intensities are above average and higher than other Japanese steelmakers. It does not have a public emissions reduction target. With other Japanese steelmakers it is part of the COURSE50 consortium to develop breakthrough technologies involving hydrogen-based reduction and carbon capture.
{ JSW Steel ranks tenth. It has high emissions and energy intensities, though has demonstrated progress in reducing them in recent years. Its emissions reduction target runs only to 2016, and it does not appear to be involved in significant breakthrough emissions reduction technology research.
Scope of report: Company selectionWe selected the group of companies for our study as follows:
{ Started with the 31 steel companies that responded to CDP’s 2016 climate change questionnaire.
{ Reviewed the ownership and nature of business activities of these companies.
{ Excluded subsidiaries and privately owned companies.
{ Excluded remaining companies whose primary business activity is iron ore mining or steel recycling not steelmaking – these companies had much lower emissions and emissions intensities than steelmakers. One company, Vale, with primarily mining operations was also already included in CDP’s sector report on diversified miners.
{ Excluded the steel companies that focused on downstream processing and value-added products, without significant crude steelmaking operations.
{ Excluded one remaining company, Salzgitter AG, which provided its first full response to the CDP climate change questionnaire during the course of our research process.
{ Added US Steel which did not respond in 2016 but did so for 2015 and many years prior.
Following this process we were left with a set of 14 companies, which together represent approximately US$118 billion in market capitalization and account for 92% of the combined operational (Scope 1 and 2) emissions of the 31 steel companies that responded to CDP. The activities of the 14 companies are all significantly focused on steelmaking using the blast furnace-basic oxygen furnace (BF-BOF) or electric arc furnace (EAF) routes of production.
8
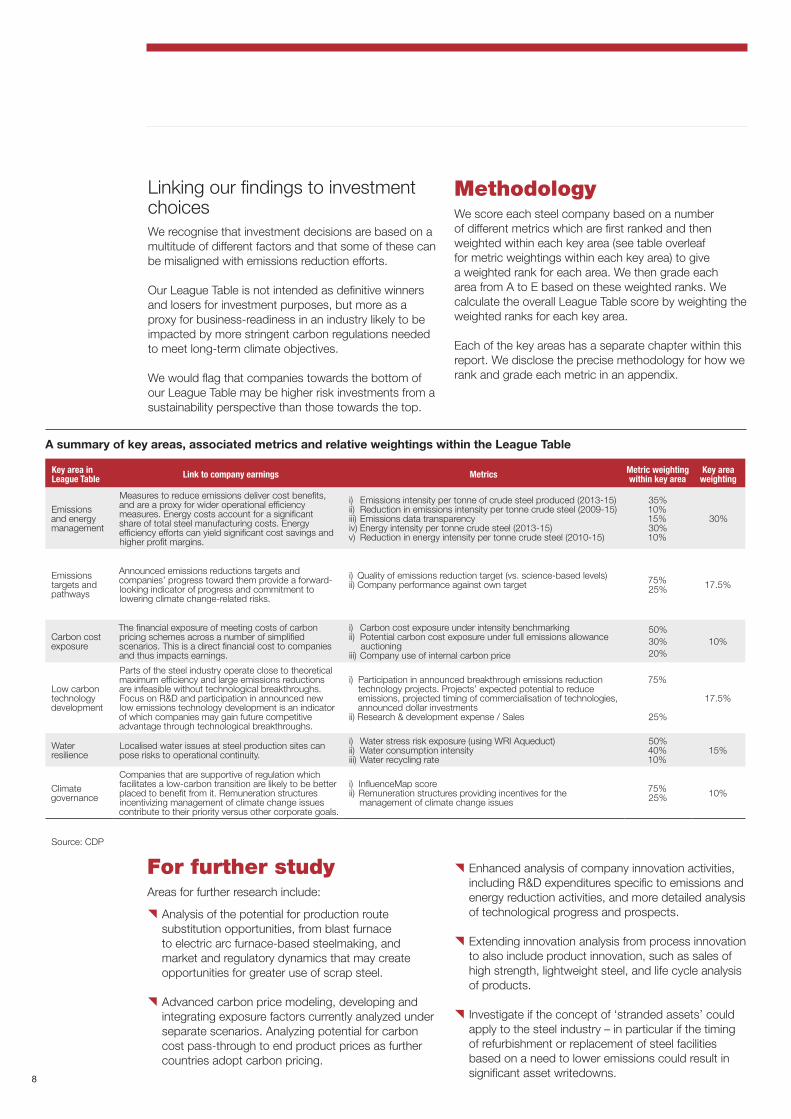
For further studyAreas for further research include:
{ Analysis of the potential for production route substitution opportunities, from blast furnace to electric arc furnace-based steelmaking, and market and regulatory dynamics that may create opportunities for greater use of scrap steel.
{ Advanced carbon price modeling, developing and integrating exposure factors currently analyzed under separate scenarios. Analyzing potential for carbon cost pass-through to end product prices as further countries adopt carbon pricing.
{ Enhanced analysis of company innovation activities, including R&D expenditures specific to emissions and energy reduction activities, and more detailed analysis of technological progress and prospects.
{ Extending innovation analysis from process innovation to also include product innovation, such as sales of high strength, lightweight steel, and life cycle analysis of products.
{ Investigate if the concept of ‘stranded assets’ could apply to the steel industry – in particular if the timing of refurbishment or replacement of steel facilities based on a need to lower emissions could result in significant asset writedowns.
A summary of key areas, associated metrics and relative weightings within the League Table
Key area in League Table Link to company earnings Metrics Metric weighting
within key areaKey area
weighting
Emissions and energy management
Measures to reduce emissions deliver cost benefits, and are a proxy for wider operational efficiency measures. Energy costs account for a significant share of total steel manufacturing costs. Energy efficiency efforts can yield significant cost savings and higher profit margins.
i) Emissions intensity per tonne of crude steel produced (2013-15) ii) Reduction in emissions intensity per tonne crude steel (2009-15)iii) Emissions data transparencyiv) Energy intensity per tonne crude steel (2013-15)v) Reduction in energy intensity per tonne crude steel (2010-15)
35%10%15%30%10%
30%
Emissions targets and pathways
Announced emissions reductions targets and companies’ progress toward them provide a forward- looking indicator of progress and commitment to lowering climate change-related risks.
i) Quality of emissions reduction target (vs. science-based levels)ii) Company performance against own target 75%
25% 17.5%
Carbon cost exposure
The financial exposure of meeting costs of carbon pricing schemes across a number of simplified scenarios. This is a direct financial cost to companies and thus impacts earnings.
i) Carbon cost exposure under intensity benchmarkingii) Potential carbon cost exposure under full emissions allowance
auctioningiii) Company use of internal carbon price
50%30%20%
10%
Low carbon technology development
Parts of the steel industry operate close to theoretical maximum efficiency and large emissions reductions are infeasible without technological breakthroughs. Focus on R&D and participation in announced new low emissions technology development is an indicator of which companies may gain future competitive advantage through technological breakthroughs.
i) Participation in announced breakthrough emissions reduction technology projects. Projects’ expected potential to reduce emissions, projected timing of commercialisation of technologies, announced dollar investments
ii) Research & development expense / Sales
75%
25%
17.5%
Water resilience
Localised water issues at steel production sites can pose risks to operational continuity.
i) Water stress risk exposure (using WRI Aqueduct)ii) Water consumption intensityiii) Water recycling rate
50%40%10%
15%
Climate governance
Companies that are supportive of regulation which facilitates a low-carbon transition are likely to be better placed to benefit from it. Remuneration structures incentivizing management of climate change issues contribute to their priority versus other corporate goals.
i) InfluenceMap scoreii) Remuneration structures providing incentives for the
management of climate change issues
75%25% 10%
Source: CDP
Linking our findings to investment choicesWe recognise that investment decisions are based on a multitude of different factors and that some of these can be misaligned with emissions reduction efforts.
Our League Table is not intended as definitive winners and losers for investment purposes, but more as a proxy for business-readiness in an industry likely to be impacted by more stringent carbon regulations needed to meet long-term climate objectives.
We would flag that companies towards the bottom of our League Table may be higher risk investments from a sustainability perspective than those towards the top.
MethodologyWe score each steel company based on a number of different metrics which are first ranked and then weighted within each key area (see table overleaf for metric weightings within each key area) to give a weighted rank for each area. We then grade each area from A to E based on these weighted ranks. We calculate the overall League Table score by weighting the weighted ranks for each key area.
Each of the key areas has a separate chapter within this report. We disclose the precise methodology for how we rank and grade each metric in an appendix.

52
CDP contacts
Frances WayCo-Chief Operating Officer
James HulseHead of Investor Initiatives
Cynthia SimonSenior Manager, Investor InitiativesNorth America+1 646 517 [email protected]
Emma HenningssonSenior Account Manager,Investor Initiatives+46 (0) 705 [email protected]
Agnes Terestchenko, CFASenior Manager,Investor Initiatives North America+1 646 668 [email protected]
Henry RepardSenior Project Officer, Investor Initiatives+44 (0) 203 818 [email protected]
Brendan BakerSenior Project Officer,Investor Initiatives+44 (0) 203 818 [email protected]
CDP Investor Research team
Rick StathersHead of Investor Research [email protected]
Tarek Soliman, CFASenior Analyst, Investor [email protected]
Drew Fryer, CFASenior Analyst, Investor [email protected]
Chloe ChanAnalyst, Investor [email protected]
Charles FruitiereAnalyst, Investor [email protected]
Tom CrockerAnalyst, Investor [email protected]
Luke FletcherAnalyst, Investor [email protected]
CDP Board of Trustees
Chairman: Alan Brown
Jane Ambachtsheer
Jeremy Burke
Kate Hampton
Jeremy Smith
Takejiro Sueyoshi
Martin Wise
CDP UKLevel 371 Queen Victoria StreetLondonEC4V 4AYTel: +44 (0) 20 3818 3900
Important Notice:
CDP is not an investment advisor, and makes no representation regarding the advisability of investing in any particular company or investment fund or other vehicle. A decision to invest in any such investment fund or other entity should not be made in reliance on any of the statements set forth in this publication. While CDP has obtained information believed to be reliable, it makes no representation or warranty (express or implied) as to the accuracy or completeness of the information and opinions contained in this report, and it shall not be liable for any claims or losses of any nature in connection with information contained in this document, including but not limited to, lost profits or punitive or consequential damages.
The contents of this report may be used by anyone providing acknowledgement is given to CDP. This does not represent a license to repackage or resell any of the data reported to CDP and presented in this report. If you intend to repackage or resell any of the contents of this report, you need to obtain express permission from CDP before doing so.