Embed Size (px)
Citation preview

Whole Number, Distribution and Co-Expression of Brn3Transcription Factors in Retinal Ganglion Cells of AdultAlbino and Pigmented RatsFrancisco M. Nadal-Nicolas1,2., Manuel Jimenez-Lopez2., Manuel Salinas-Navarro2, Paloma Sobrado-
Calvo2, Juan J. Alburquerque-Bejar2, Manuel Vidal-Sanz2, Marta Agudo-Barriuso1,2*
1 Unidad de Investigacion. Hospital Universitario Virgen de la Arrixaca. Fundacion para la Formacion e Investigacion Sanitarias de la Region de Murcia. IMIB, El Palmar,
Murcia, Spain, 2 Departamento de Oftalmologıa, Facultad de Medicina, Universidad de Murcia, IMIB, Espinardo, Murcia, Spain
Abstract
The three members of the Pou4f family of transcription factors: Pou4f1, Pou4f2, Pou4f3 (Brn3a, Brn3b and Brn3c, respectively)play, during development, essential roles in the differentiation and survival of sensory neurons. The purpose of this work isto study the expression of the three Brn3 factors in the albino and pigmented adult rat. Animals were divided into thesegroups: i) untouched; ii) fluorogold (FG) tracing from both superior colliculli; iii) FG-tracing from one superior colliculus; iv)intraorbital optic nerve transection or crush. All retinas were dissected as flat-mounts and subjected to single, double ortriple immunohistofluorescence The total number of FG-traced, Brn3a, Brn3b, Brn3c or Brn3 expressing RGCs wasautomatically quantified and their spatial distribution assessed using specific routines. Brn3 factors were studied in thegeneral RGC population, and in the intrinsically photosensitive (ip-RGCs) and ipsilateral RGC sub-populations. Our resultsshow that: i) 70% of RGCs co- express two or three Brn3s and the remaining 30% express only Brn3a (26%) or Brn3b; ii) themost abundant Brn3 member is Brn3a followed by Brn3b and finally Brn3c; iii) Brn3 a-, b- or c- expressing RGCs are similarlydistributed in the retina; iv) The vast majority of ip-RGCs do not express Brn3; v) The main difference between both ratstrains was found in the population of ipsilateral-RGCs, which accounts for 4.2% and 2.5% of the total RGC population in thepigmented and albino strain, respectively. However, more ipsilateral-RGCs express Brn3 factors in the albino than in thepigmented rat; vi) RGCs that express only Brn3b and RGCs that co-express the three Brn3 members have the biggest nuclei;vii) After axonal injury the level of Brn3a expression in the surviving RGCs decreases compared to control retinas. Finally, thiswork strengthens the validity of Brn3a as a marker to identify and quantify rat RGCs.
Citation: Nadal-Nicolas FM, Jimenez-Lopez M, Salinas-Navarro M, Sobrado-Calvo P, Alburquerque-Bejar JJ, et al. (2012) Whole Number, Distribution and Co-Expression of Brn3 Transcription Factors in Retinal Ganglion Cells of Adult Albino and Pigmented Rats. PLoS ONE 7(11): e49830. doi:10.1371/journal.pone.0049830
Editor: Alan R. Harvey, The University of Western Australia, Australia
Received July 4, 2012; Accepted October 12, 2012; Published November 16, 2012
Copyright: � 2012 Nadal-Nicolas et al. This is an open-access article distributed under the terms of the Creative Commons Attribution License, which permitsunrestricted use, distribution, and reproduction in any medium, provided the original author and source are credited.
Funding: Spanish Ministry of Economy and Competitiviness and ISCIII-FEDER ‘‘Una manera de hacer Europa’’: PI10/00187, http://www.mineco.gob.es/, http://www.isciii.es/, Fundacion Seneca 04446/GERM/07; http://www.f-seneca.org Spanish Ministry of Education and Science SAF-22010-10385 http://www.educacion.gob.es/, and Red Tematica de Investigacion Cooperativa en Oftalmologıa RD07/0062/0001 http://www.oftared.com/. The funders had no role in study design,data collection and analysis, decision to publish, or preparation of the manuscript.
Competing Interests: The authors have declared that no competing interests exist.
* E-mail: [email protected]
. These authors contributed equally to this work.
Introduction
The Brn3 family of transcription factors (Brn3a/Pou4f1, Brn3b/
Pou4f2, Brn3c/Pou4f3) [1–3] are expressed by different sets of
neurons of the trigeminal nuclei, dorsal root ganglia, inner ear and
retina [4]. They are not needed for neuronal commitment but are
crucial for neuronal differentiation and survival [5–10]. Each Brn3
is expressed in a characteristic spatiotemporal pattern that differs
among each sensory organ [4,5,7,9,11–14]. In fact, in each of
these organs a different Brn3 gene is the first to be expressed. This
initial expression is followed by an orchestrated combinatorial
expression that controls the neuronal differentiation and diversity
of each sensory organ. In addition, it has been shown that Brn3a
and Brn3b are functionally equivalent, thus during development
Brn3a can replace Brn3b function if it is expressed during the
Brn3b spatiotemporal window [15,16].
In the retina, Brn3 transcription factors are exclusively
expressed in retinal ganglion cells (RGCs). RGCs are the only
retinal neurons that send their axons (forming the optic nerve)
outside the eye to synapse with central targets: superior colliculi;
lateral geniculate nucleus; intergeniculate nucleus; the dorsal,
lateral and medial terminal nuclei, the olivary pretectal nuclei and
the supraquiasmatic nuclei (reviewed in [17]). In rodents, mice and
rats, the vast majority of RGCs project contralaterally to the
superior colliculi [18–23]. RGCs convey information that is
relevant to image-forming and non-image forming vision such as
eye movement control, pupilary light reflex and circadian photo-
entrainment. There are more than twenty types of RGCs which
are not easily distinguished since up to date there are no subtype-
specific molecular markers except for two of these subtypes, the
intrinsically photosensitive RGCs (ip-RGCs) and the RGCs that
selectively respond to upward motion [24]. ip-RGCs express a
specific photopigment, melanopsin [25,26], and are responsible of
non-image forming visual functions, although recently it has been
PLOS ONE | www.plosone.org 1 November 2012 | Volume 7 | Issue 11 | e49830

shown that they are implied as well in image forming vision
[27,28].
The role of Brn3 factors in the development, differentiation,
morphology and function of RGCs has been thoroughly studied in
mice [6,7,12,29–37]. During retinal development, the first Brn3
member to be expressed in RGCs is Brn3b, followed one day later
by Brn3a and finally by Brn3c [34]. Thus, 80% of the developing
RGCs express Brn3b in combination or not with Brn3a and Brn3c
[5,35]. Brn3b is essential for RGC differentiation, survival and
axon pathfinding [33], Brn3c seems to be required for ipsilateral
projections [6] and Brn3a is part of a regulatory network that
controls RGC dendritic stratification [36].
In rat, all the genetic analyses carried out in mouse are not
feasible and thus the role of Brn3 factors during rat development
remains to be addressed.
As in mouse, [38] adult rat RGCs express Brn3a, though in rat
this population is higher than in mouse [39]. Furthermore, in rat,
Brn3a expression is maintained in those RGCs that although
being injured, are still alive [40]. Both features make Brn3a
immunodetection an excellent tool to detect and quantify RGCs in
this species.
Albinism i.e. the lack of melanin causes a long list of
abnormalities, which in the visual system are: an impaired visual
acuity and defects in the crossing of the retinofugal projections and
optokinetic nystagmus [41–43], reviewed in [44].
Little is known about Brn3b [45] and Brn3c expression in the
adult rat retina or about their response to axonal injury. Because
of this and because, to date, there is not a comprehensive study of
the expression relationship among the three Brn3 members in this
species, the general goal of this work is to characterize the
population of Brn3 a-, b- and c- expressing RGCs in two rat
strains, one albino and one pigmented. Both strains were
compared to elucidate whether albinism has, as well, an effect
on the number and distribution of Brn3+RGCs. Finally, the
expression of the three Brn3 factors was studied in axotomized
retinas.
Results
Brn3 Co-expressionIn albino rats the percentage of Brn3a+RGCs that are FG-
traced coincides with previous reports (95.4%: 1,995 RGCs Brn3a
and FG+out of 2,088 counted Brn3a+RGCs [39]). In pigmented
rats this percentage is slightly higher (96.3%: 4,209 RGCs Brn3a
and FG+out of 4,367 counted Brn3a+RGCs; figure 1 A–C).
In the albino strain the percentage of FG+RGCs that express
Brn3a is 92.2% [39], while in the pigmented one this percentage
goes up to 96.4% (out of 4,365 FG+RGCs, 4,209 were Brn3a+as
well).
To detect Brn3a we use a goat a-Brn3a antibody [39]. But
because to assess Brn3a and Brn3b co-expression it was necessary
to use a mouse a-Brn3a antibody which had not yet been tested,
both a-Brn3a antibodies (goat and mouse) were double immuno-
detected to determine their level of co-detection (Figure 1 D–F).
Out of 2,644 (SD) and 2,681 (PVG) counted maBrn3a+RGCs all
were gaBrn3a+but no vice versa as 113 (SD) and 64 (PVG) RGCs
were only gaBrn3a+. Thus, the gaBrn3a antibody detects a 4.1%
and 2.3% more RGCs in SD and PVG retinas, respectively, than
the mouse one. These differences were not significant (Mann-
Whitney test, p = 0.623 in albino rats, p = 0.709 in pigmented
ones).
Images illustrating the double detection of Brn3a and b, Brn3a
and c, and Brn3b and c are shown in figure 1 G–O and the
quantitative data in figure 2A. Co-expression percentages were
calculated considering 100% the total number of RGCs expressing
Brn3b or Brn3c. For example, co-expression of Brn3b and Brn3c
in albino rats (fifth bar figure 2A): out of 3,512 counted
Brn3b+RGCs, 2,254 were Brn3c positive and 1,258 were Brn3c
negative. Thus 64% of Brn3b+RGCs also express Brn3c while
36% do not. This was done for all combinations, and the data
show that: i) co-expression levels are very similar between both rat
strains; ii) a higher percentage of Brn3c+RGCs express Brn3b
(73.4% albino, 77.8% pigmented) than Brn3b+RGCs express
Brn3c (64.2% albino, 69.6% pigmented); iii) practically all (99.6%
albino, 99.7% pigmented) Brn3c+RGCs express Brn3a; iv) a small
percentage of Brn3b+RGCs do not express Brn3a (6.9% albino,
7.7% pigmented), although these percentages might be overvalued
because the mouse a-Brn3a detects less RGCs that the goat one.
In figure 1 P–R is shown that the three Brn3 members are
only expressed in the ganglion cell layer.
Brn3 Expression by Intrinsically Photosensitive RGCs (ip-RGCs)
ip-RGCs are distinguished from the rest of the RGC population
because they express melanopsin [25]. Thus, melanopsin and each
of the Brn3 members were immunodetected in retinas from albino
and pigmented animals to assess their level of co-expression
(Figure 3). These results show that the vast majority of ip-RGCs
do not express these transcription factors. In fact, in both strains
none of them express Brn3c; Brn3a is expressed by a 0.23% (SD)
and 0.25% (PVG) of them, and 9.55% in the albino and 13.6% in
the pigmented strain express Brn3b.
Total Number of RGCs in Albino and Pigmented RatsQuantitative data are shown in table 1. In the pigmented
strain, the whole number of Brn3+, Brn3a+and FG-traced RGCs is
higher than in the albino strain, but this difference is not
statistically significant (Mann Whitney test p = 0.673 for FG,
p = 0.325 for Brn3a and p = 0.297 for Brn3). However, the total
number of Brn3b and Brn3c positive RGCs is similar in both
strains.
The total population of Brn3+RGCs (Brn3a+Brn3b+Brn3c
triple immunodetection using the same fluorophore) is not the sum
of the three Brn3s populations. In fact, is higher than the
population of Brn3a+RGCs only by 1,721 (SD) and 924 (PVG)
RGCs. This indicates, in agreement with the previous data, a high
level of Brn3 co-expression.
Using these data (table 1) and the level of Brn3 co-expression
(Figure 2A), the population of RGCs that express three, two or
one Brn3 was inferred for the albino strain (Figure 2B) as follows:
Out of the 54,065 Brn3b+RGCs, 93% express also
Brn3a+(50,280); of these 64% express Brn3c and 36% do not.
Thus 18,101 RGCs express Brn3b and Brn3a but do not express
Brn3c and 32,179 express the three Brn3 members. Notice that
the number of RGCs that express the three members varies
slightly if the inference is done from the Brn3b or from the Brn3c
population. Out of the total of Brn3b population 7% do not
express Brn3a (3,784); out of these 64% would also express Brn3c
but because all Brn3c+RGCs express Brn3a, these are probably
RGCs that only express Brn3b. The same procedure was applied
starting from the Brn3c population.
The number of RGCs expressing only Brn3a was calculated by
subtracting from their total population (82,979) the RGCs-Brn3a
and Brn3b and/or Brn3c positive. These calculations disclose that
over 22,000 RGCs express only Brn3a (26.6% of the Brn3a
population, 25.9% of the Brn3 population) and that around
31,500 express the three Brn3 members (37% of the Brn3
population). In addition 18,101 express Brn3a and Brn3b but no
Brn3 Expression in the Adult Rat Retina
PLOS ONE | www.plosone.org 2 November 2012 | Volume 7 | Issue 11 | e49830

Brn3 Expression in the Adult Rat Retina
PLOS ONE | www.plosone.org 3 November 2012 | Volume 7 | Issue 11 | e49830

Brn3c (21.3%) and 11,365 express Brn3c and Brn3a but no Brn3b
(13.4%). A small population of RGCs express only Brn3b (3,784,
4.5%), but as abovementioned part of these RGCs might be Brn3a
positive and thus this percentage might be lower.
In conclusion, approximately a 35% of the RGCs express the
three Brn3s, 35% two of them (a+b or a+c) and the remaining
30% one of them (a or b).
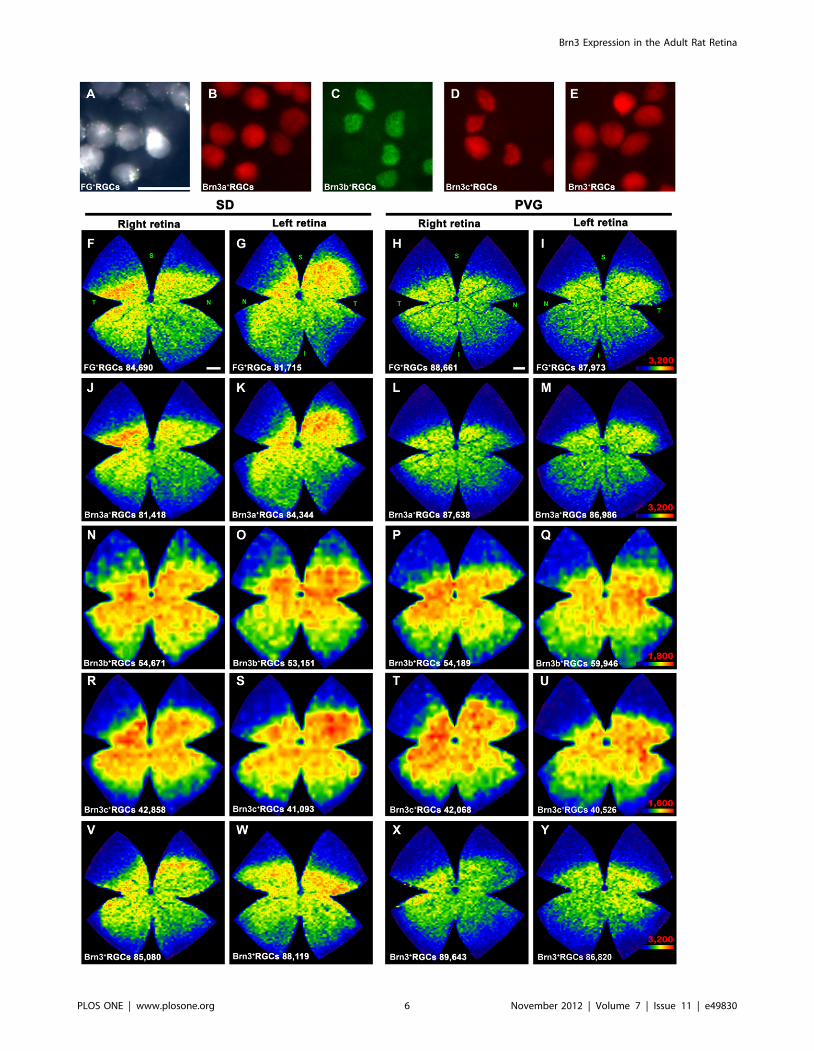
RGC Spatial DistributionIsodensity maps show the distribution of a given cell in the
retina. In each of the frames captured per retina, densities are
calculated from the data collected after the automated quantifi-
cation. In figure 4 is shown the distribution of FG-traced, Brn3a+,
Brn3b+, Brn3c+and Brn3+RGCs in both rat strains. Because
Brn3b and Brn3c populations are smaller than Brn3a, FG or Brn3,
their density was set to a lower scale, otherwise the distribution of
these RGCs would not be observed. Thus, red (highest densities) in
the Brn3a, FG or Brn3 maps correspond to 3,200 or more RGCs
and in the Brn3b and Brn3c ones to 1,800 and 1,600 or more
RGCs, respectively.
In both strains all RGC populations are similarly distributed:
they are denser in the medial-central retina and scarcer in the
periphery. FG-traced and Brn3a+RGCs are densest in the superior
temporal pole above the optic nerve while Brn3b+and
Brn3c+RCGs although being denser in the central retina, are
not clearly densest in the superotemporal quadrant.
PVG isodensity maps have cooler colours (lower RGC densities)
than SD ones, in spite of the fact that there are more RGCs in this
strain. This is because PVG retinas have a significantly bigger area
(t-test p,0.001) than SD retinas (see table 1), thus their mean
RGC density is lower.
Population of Ipsilateral and Contralateral RGCsIn rats and mice the vast majority of RGCs project to the
superior colliculi [18,19,22,23,46,47]. To find out how many of
them project to the contralateral or the ipsilateral SCi, FG was
applied only to one SCi.
Table 2 shows the total number of contralateral- and
ipsilateral- RGCs in both rat strains. Out of the total of RGCs
that project to the SCi (i.e RGCs traced from both SCi, see
table 1) 2.5% and 4.2% are ipsilateral-RGCs in albino and
pigmented rats, respectively. Of these, 43% (SD) and 37.6%
(PVG) express Brn3a, 24% (SD) and 22% (PVG) express Brn3b
and 9.7% (SD) and 7.3% (PVG) express Brn3c. This means,
without considering co-expression in this RGC population, that at
least there is a 23.7% (SD) and a 33% (PVG) of ipsilateral-RGCs
that do not express Brn3 (Figure 5 I–L and table 2).
Considering as 100% the total population of Brn3 a-, b- or c-
positive RGCs, there is, respectively, a 1.06%, 0.91%, 0.48% in
the albino strain and a 1.57%, 1.41% or 0.63% in the pigmented
strain of Brn3a+, Brn3b+and Brn3c+RGCs that project ipsilaterally
(Figure 5I).
Distribution of ipsilateral-RGCs in the right retinas is shown in
figure 5. These cells are more abundant in the inferotemporal
quadrant adopting a distribution that has the shape of a crescent
moon going from the superotemporal to the inferonasal quadrant
(Figure 5 A, E). Within the rest of the retina they are scarce and
distributed without any apparent organization. This distribution is
the same for ipsilateral-RGCs expressing Brn3a, b or c (Figure 5B–D, F–H).
Figure 1. Co-expression of Brn3 transcription factors in albino and pigmented rats. A–O: Magnifications from SD flat mounted retinas inwhich FG and Brn3a (A–C); Brn3a detected with two different antibodies -goat and mouse anti-Brn3a-(D–F); Brn3a and b (G–H), Brn3a and c (J–L)and Brn3b and c (M–O) have been double detected. In images like these taken from SD (albino) and PVG (pigmented) rat retinas the percentage ofco-localization of each marker (see figure 2) was calculated. P–R: cross-sections from SD rat retinas, in which Brn3a (P), Brn3b (Q) and Brn3c (R) havebeen detected to show that these proteins are only expressed in the ganglion cell layer. In these images, all nuclei have been counterstained withDAPI. Arrows point to those RGCs that only express one of the Brn3s. Bar: 50 mm (C,R).doi:10.1371/journal.pone.0049830.g001
Figure 2. Brn3 co-expression in albino and pigmented rat retinas. A: Stacked-bar graph showing the percentage of Brn3 co-expression inboth rat strains. In each bar is shown the number of cells counted. First and second bars: percentage of Brn3b+RGCs that express or not Brn3a. Thirdand fourth bars: percentage of Brn3c+RGCs that express or not Brn3a. Fifth and sixth bars: percentage of Brn3b+RGCs that express or not Brn3c.Seventh and eighth bars: percentage of Brn3c+RGCs that express or not Brn3b. Percentage was calculated considering 100% the total number of cellsper marker (see results for further explanation). B: Inference of the total number of RGCs that express one, two or the three Brn3 members in thealbino strain. These numbers were calculated based on the co-expression percentages and on the total number of RGCs (see table 1 and results). Thefinal population for each marker combination is shown in the grey squares.doi:10.1371/journal.pone.0049830.g002
Brn3 Expression in the Adult Rat Retina
PLOS ONE | www.plosone.org 4 November 2012 | Volume 7 | Issue 11 | e49830
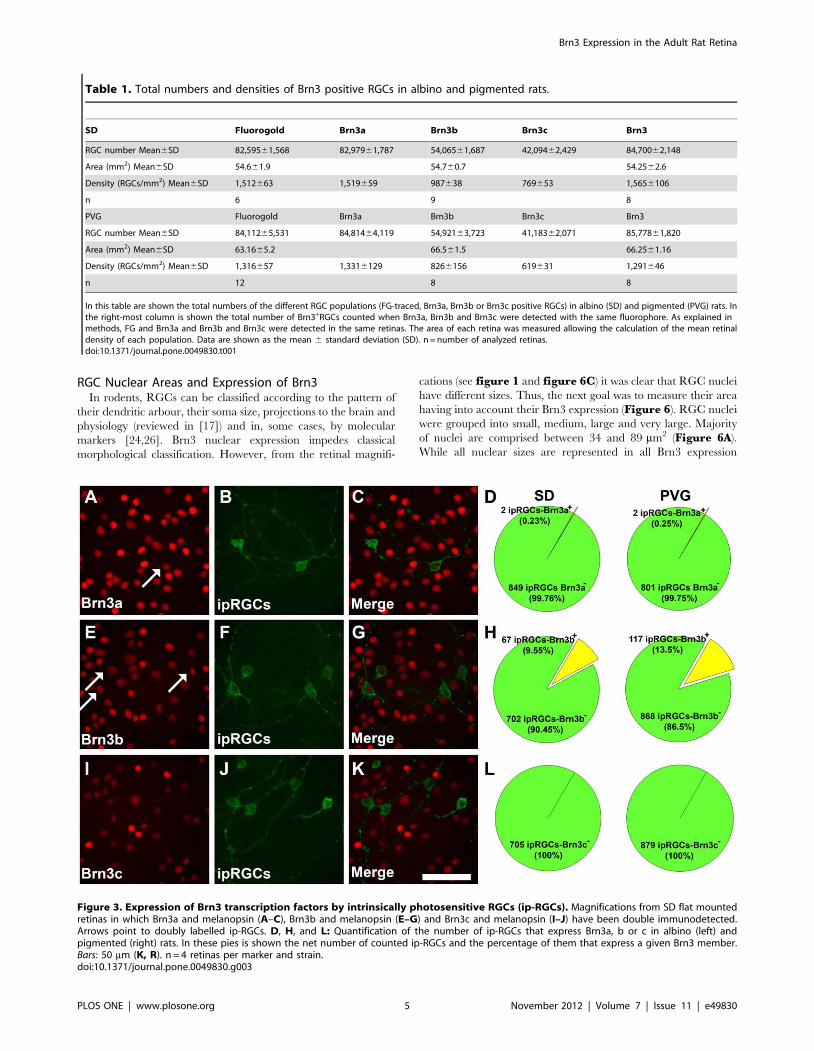
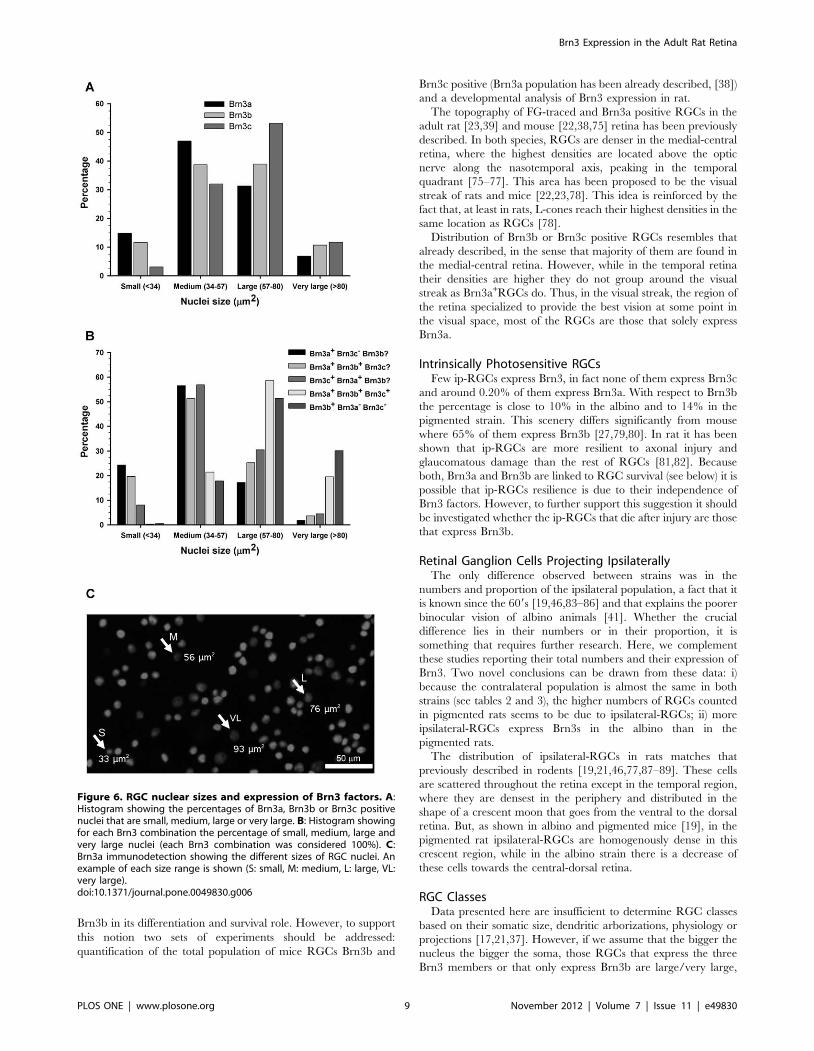
RGC Nuclear Areas and Expression of Brn3In rodents, RGCs can be classified according to the pattern of
their dendritic arbour, their soma size, projections to the brain and
physiology (reviewed in [17]) and in, some cases, by molecular
markers [24,26]. Brn3 nuclear expression impedes classical
morphological classification. However, from the retinal magnifi-
cations (see figure 1 and figure 6C) it was clear that RGC nuclei
have different sizes. Thus, the next goal was to measure their area
having into account their Brn3 expression (Figure 6). RGC nuclei
were grouped into small, medium, large and very large. Majority
of nuclei are comprised between 34 and 89 mm2 (Figure 6A).
While all nuclear sizes are represented in all Brn3 expression
Table 1. Total numbers and densities of Brn3 positive RGCs in albino and pigmented rats.
SD Fluorogold Brn3a Brn3b Brn3c Brn3
RGC number Mean6SD 82,59561,568 82,97961,787 54,06561,687 42,09462,429 84,70062,148
Area (mm2) Mean6SD 54.661.9 54.760.7 54.2562.6
Density (RGCs/mm2) Mean6SD 1,512663 1,519659 987638 769653 1,5656106
n 6 9 8
PVG Fluorogold Brn3a Brn3b Brn3c Brn3
RGC number Mean6SD 84,11265,531 84,81464,119 54,92163,723 41,18362,071 85,77861,820
Area (mm2) Mean6SD 63.1665.2 66.561.5 66.2561.16
Density (RGCs/mm2) Mean6SD 1,316657 1,3316129 8266156 619631 1,291646
n 12 8 8
In this table are shown the total numbers of the different RGC populations (FG-traced, Brn3a, Brn3b or Brn3c positive RGCs) in albino (SD) and pigmented (PVG) rats. Inthe right-most column is shown the total number of Brn3+RGCs counted when Brn3a, Brn3b and Brn3c were detected with the same fluorophore. As explained inmethods, FG and Brn3a and Brn3b and Brn3c were detected in the same retinas. The area of each retina was measured allowing the calculation of the mean retinaldensity of each population. Data are shown as the mean 6 standard deviation (SD). n = number of analyzed retinas.doi:10.1371/journal.pone.0049830.t001
Figure 3. Expression of Brn3 transcription factors by intrinsically photosensitive RGCs (ip-RGCs). Magnifications from SD flat mountedretinas in which Brn3a and melanopsin (A–C), Brn3b and melanopsin (E–G) and Brn3c and melanopsin (I–J) have been double immunodetected.Arrows point to doubly labelled ip-RGCs. D, H, and L: Quantification of the number of ip-RGCs that express Brn3a, b or c in albino (left) andpigmented (right) rats. In these pies is shown the net number of counted ip-RGCs and the percentage of them that express a given Brn3 member.Bars: 50 mm (K, R). n = 4 retinas per marker and strain.doi:10.1371/journal.pone.0049830.g003
Brn3 Expression in the Adult Rat Retina
PLOS ONE | www.plosone.org 5 November 2012 | Volume 7 | Issue 11 | e49830
Brn3 Expression in the Adult Rat Retina
PLOS ONE | www.plosone.org 6 November 2012 | Volume 7 | Issue 11 | e49830

patterns (Figure 6B), some differences were observed: i) The
major proportion of small nuclei corresponds to Brn3a+ones that
do not express Brn3c; ii) Brn3a and Brn3b or Brn3c co-expression
is more frequent in medium sized nuclei; ii) Nuclei that show triple
Brn3 expression or expression of Brn3b only, are the biggest; iii) In
accordance, the percentage of small nuclei expressing only Brn3b
or that are triple positive is insignificant (0.3 and 0.5%
respectively).
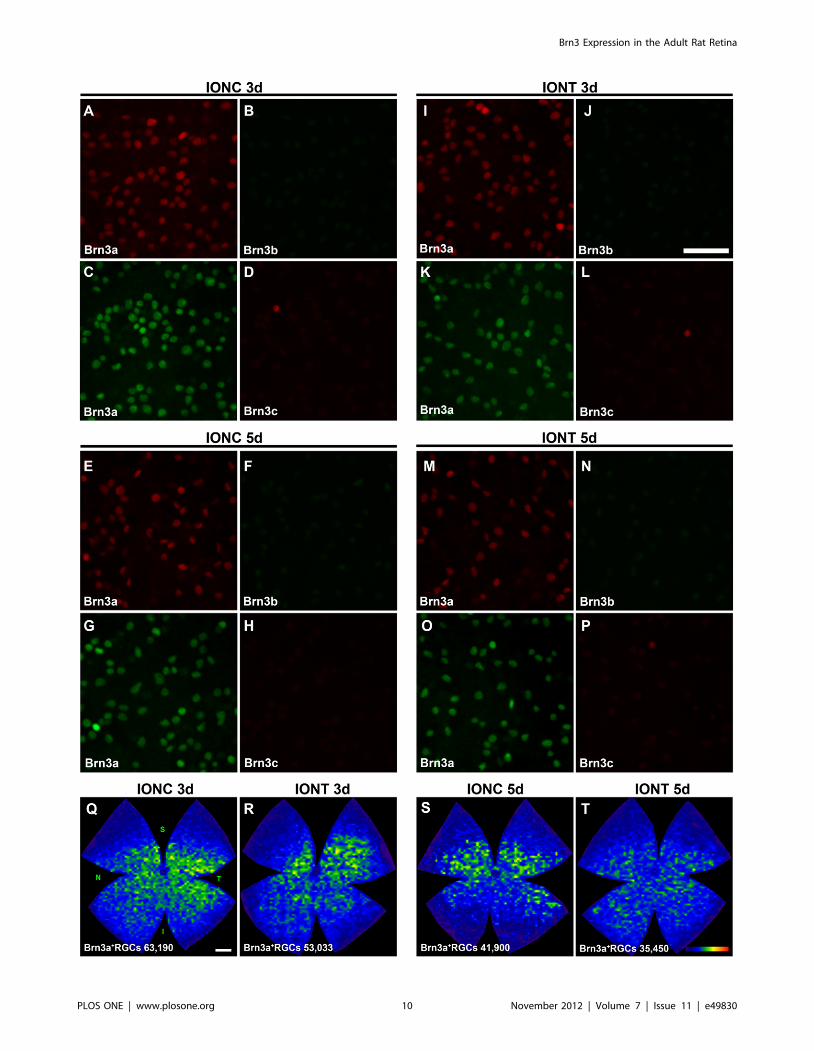
Response of Brn3b and Brn3c to Optic Nerve (ON) InjuryTo learn the effect of ON injury on Brn3b and Brn3c
expression, three and five days after intraorbital optic nerve
transection (IONT) or intraorbital optic nerve crush (IONC), these
transcription factors were immunodetected. As internal control,
Brn3a was detected as well (Figure 7 A–P). These images show
that Brn3b and Brn3c expression decreased below the sensitivity of
our automated routine, while Brn3a signal was strong enough to
run the automated quantification and to generate isodensity maps
of the surviving Brn3a+RGCs (Figure 7 Q–T). Thus, in these
retinas the number of surviving Brn3a+RGCs was 60,69163,653
or 52,68463,099 (mean6SD) 3 days after IONC or IONT
respectively and 40,55563,932 or 30,11463,116 5 days after
IONC or IONT, respectively. At both time points, RGC loss was
significant compared to the number of Brn3a+RGCs present in
control retinas (Tukey t-test p,0.001). There is also a significant
decrease between 3 and 5 days in both lesion models (Tukey t-test
p,0.001). Finally, at both time points the loss of Brn3a+RGCs
after IONT is significantly higher than after IONC (Tukey t-test,
p = 0.005 at 3 days, p,0.001 at 5 days). This is graphically
observed in the isodensity maps shown in figure 7 Q–T.
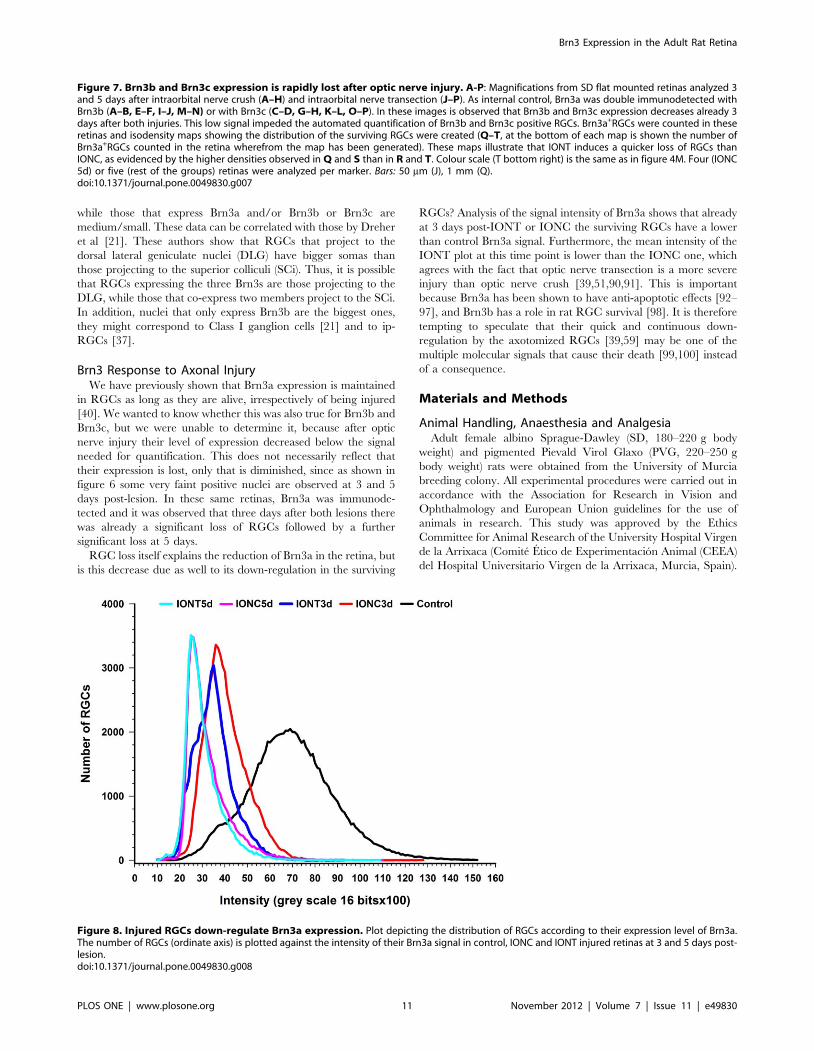
Brn3a signal is detected in injured retinas but, do RGCs down-
regulate this transcription factor when injured? In other words, is
there a decrease of Brn3a level in the injured but still alive RGC?
In figure 8 is shown that the mean intensity of Brn3a signal
decreases already at 3 days post-lesion, being this decrease slightly
more pronounced after IONT than after IONC. By 5 days post
lesion the level of Brn3a signal has decreased further and at this
time point both lesions are matched.
Discussion
Here we present the first comprehensive analysis of the
expression of the three Brn3 members of transcription factors in
albino and pigmented rat retinas.
With respect to Brn3 differences between albino and pigmented
rats, we have found that in both strains their number, proportion,
co-expression, and distribution are similar. Thus discussion of
these data refers to both strains. The only significant difference
found between both strains is in the ipsilateral-projections, this is
further addressed below.
Identification of Retinal Ganglion CellsNeuronal tracers have been used extensively to identify RGCs
in control and injured retinas [48–52], although the lesion involves
spurious labelling of microglial cells [53–56], making it difficult to
ascertain RGC survival. There are a number of molecular markers
that are associated with RGCs, such as c-synuclein, Bex1/2,
Thy1, NeuN, or Brn3a [39,57–63]. Currently, two of these
markers stand out: detection of c-synuclein RNA [61–63] and
immunodetection of Brn3a [39]. Brn3a immunodetection is an ex
vivo method that can be easily set up in any laboratory to detect,
quantify, and assess the spatial distribution of RGCs in health,
disease and neuroprotection [64–72].
Previously, we documented that in rat, Brn3a is expressed in
92.2% of the FG-traced RGC population [39]. So, which RGCs
are not being detected by Brn3a? Data presented here show that
Brn3a is expressed in 43% (SD) and 38% (PVG) of the ipsilateral
population, and by a minute proportion of the intrinsically
photosensitive RGCs. In other words, when using Brn3a to
Figure 4. Spatial distribution of RGCs in albino and pigmented rats. A–E: magnifications from flat mounted retinas showing RGCs detectedby FG tracing (A), Brn3a (B), Brn3b (C), Brn3c (D) and Brn3a+b+c immunodetection. A, B and C, D are images taken from the same retinal frame. In Ethe three Brn3 members were detected using the same fluorophore (Brn3+RGCs). F–Y: Representative isodensity maps showing the retinaldistribution of RGCs in SD (albino) and PVG (pigmented rats). F–I: fluorogold traced RGCs, J–M: Brn3a+RGCs, N–Q: Brn3b+RGCs, R–U: Brn3c+RGCs, V–Y: Brn3+RGCs. For each marker and strain is shown the distribution of RGCs in one left and one right retina. Notice that, because FG and Brn3a orBrn3b and Brn3c were double detected, maps F&J, G&K, H&L, I&M, N&R, O&S, P&T and Q&U come from the same retinas. Isodensity maps are createdfrom the data gathered after automated quantification. At the bottom of each one is shown the number of RGCs counted in the retina wherefrom themap has been generated. These maps express the RGC density according to a colour scale (bottom right in I, M, Q, U and Y) that ranges from 0RGCs/mm2 (blue) to a maximum density (red) that is 3,200 RGCs/mm2 or more for FG+, Brn3a+and Brn3+RGCs; 1,800 RGCs/mm2 or more forBrn3b+RGCs, and 1,600 RGCs/mm2 or more for Brn3c+RGCs. The maximum density was adjusted to these numbers to allow the visualization of highand low density areas within the retina. Retinal orientation is shown in F–I: superior (S), nasal (N) temporal (T) and inferior (I). Bars: 20 mm (A), 1 mm (F,H).doi:10.1371/journal.pone.0049830.g004
Table 2. Total number of contralateral and ipsilateral RGCs in albino and pigmented rats.
Total number of RGCs
Contralateral Ipsilateral* Ipsilateral Brn3a+1 Ipsilateral Brn3b+1 Ipsilateral Brn3c+1
SD Mean±SD 80,04963,713 2,0646264 880633 493638 201628
n 14 14 5 4 5
PVG Mean±SD 79,72563,455 3,5486497 1,334640 779626 261617
n 9 9 3 3 3
Mean number 6 standard deviation (SD) of contralateral-RGCs (left retinas) and ipsilateral-RGCs (right retinas) in the albino (SD) and pigmented (PVG) rats. It is shown aswell the number of ipsilateral-RGCs that express Brn3a, Brn3b or Brn3c. n = number of analyzed retinas. *The pigmented strain has significantly more ipsilateral-RGCsthan the albino one (t-test p,0.001). 1In the albino strain there are significantly more ipsilateral-RGCs that express Brn3a, Brn3b or Brn3c than in the pigmented one (t-test p,0.001).doi:10.1371/journal.pone.0049830.t002
Brn3 Expression in the Adult Rat Retina
PLOS ONE | www.plosone.org 7 November 2012 | Volume 7 | Issue 11 | e49830

identify RGCs, the RGC sub-populations that are not being
detected are half of the ipsilateral-RGCs and all of the ip-RGCs.
Brn3 Co-expression, Total Numbers and DistributionIn the pigmented strain the total number of RGCs is higher
than in the albino one, although this difference is not significant.
The more abundant Brn3 member is Brn3a which is expressed
by the vast majority of FG-traced RGCs. So, with respect to
Brn3a, Brn3b is expressed by 65% (SD and PVG) of the total
RGC population, while Brn3c is expressed by 51% (SD) and 49%
(PVG) of them. Thus, while the pigmented strain has more RGCs
than the albino one, the proportions that express each Brn3
member are maintained.
The level of Brn3 co-expression reaches 70% of the RGC
population. Out of this 61% of the RGCs express the three
members (37% of the total population) while RGCs that only
express one Brn3 are mainly Brn3a+(26%) being the rest Brn3b+.
In mouse there is not such a detailed study. Gathered from
Badea’s et al work [4] there are two main differences between
both species: i) in mouse 20% of Brn3c+RGCs do not express
Brn3a, and ii) the level of Brn3b and Brn3c co-expression is over
90%. These data are slightly different from those of Xiang et al [5]
that reported that 36% of the cells in the mouse ganglion cell layer
(GCL) were Brn3a+and 35% were Brn3b+while a 37% were
labeled when both proteins were detected at the same time. Brn3c
only labeled 15% of neurons in the GCL, and when it was
combined with Brn3b or Brn3a the percentage of detected nuclei
was close to that observed with Brn3a or Brn3b only. Because in
the GCL approximately one half of the neurons are RGCs [73,74]
then, a 72% of RGCs in mice express Brn3a, 70% Brn3b and 30%
Brn3c. In addition, their data also show that most of the mouse
RGCs co-express Brn3a and Brn3b, and that all Brn3c RGCs are
a subset of those expressing Brn3a and Brn3b.
All these data prompt to speculate that because in mouse Brn3b
is the first Brn3 to be expressed and it is needed for RGC
differentiation and survival then, most adult RGCs in this species
would continue expressing Brn3b. Conversely, in the adult rat
retina Brn3a is the dominating Brn3 factor and it might replace
Figure 5. Distribution of ipsilateral RGCs in albino and pigmented rats. A, E Photomontages of an albino (A) and a pigmented (E) retinashowing RGCs traced from the ipsilateral colliculi (ipsilateral-RGCs). B–D, F–H: retinal silhouettes showing the distribution of Brn3a+ipsilateral-RGCs(B, F), Brn3b+ipsilateral-RGCs (C, D) and Brn3c+ipsilateral-RGCs (D, H) in albino (B–D) and pigmented (F–H) rats. At the bottom of each retina isshown its number of ipsilateral-RGCs (in brackets). I: Histogram showing the percentage of Brn3a, Brn3b and Brn3c positive ipsilateral-RGCs withrespect to their total number. J–L: Magnifications from the inferotemporal quadrant of ipsilaterally-traced retinas showing ipsilateral-RGCs and Brn3a(J), Brn3b (K) and Brn3c (L) RGCs. Arrows point to ipsilateral-RGCs that are Brn3 positive. Retinal orientation is shown in A: superior (S), nasal (N)temporal (T) and inferior (I). Bars: 1 mm (A,E), 50 mm (J).doi:10.1371/journal.pone.0049830.g005
Brn3 Expression in the Adult Rat Retina
PLOS ONE | www.plosone.org 8 November 2012 | Volume 7 | Issue 11 | e49830
Brn3b in its differentiation and survival role. However, to support
this notion two sets of experiments should be addressed:
quantification of the total population of mice RGCs Brn3b and
Brn3c positive (Brn3a population has been already described, [38])
and a developmental analysis of Brn3 expression in rat.
The topography of FG-traced and Brn3a positive RGCs in the
adult rat [23,39] and mouse [22,38,75] retina has been previously
described. In both species, RGCs are denser in the medial-central
retina, where the highest densities are located above the optic
nerve along the nasotemporal axis, peaking in the temporal
quadrant [75–77]. This area has been proposed to be the visual
streak of rats and mice [22,23,78]. This idea is reinforced by the
fact that, at least in rats, L-cones reach their highest densities in the
same location as RGCs [78].
Distribution of Brn3b or Brn3c positive RGCs resembles that
already described, in the sense that majority of them are found in
the medial-central retina. However, while in the temporal retina
their densities are higher they do not group around the visual
streak as Brn3a+RGCs do. Thus, in the visual streak, the region of
the retina specialized to provide the best vision at some point in
the visual space, most of the RGCs are those that solely express
Brn3a.
Intrinsically Photosensitive RGCsFew ip-RGCs express Brn3, in fact none of them express Brn3c
and around 0.20% of them express Brn3a. With respect to Brn3b
the percentage is close to 10% in the albino and to 14% in the
pigmented strain. This scenery differs significantly from mouse
where 65% of them express Brn3b [27,79,80]. In rat it has been
shown that ip-RGCs are more resilient to axonal injury and
glaucomatous damage than the rest of RGCs [81,82]. Because
both, Brn3a and Brn3b are linked to RGC survival (see below) it is
possible that ip-RGCs resilience is due to their independence of
Brn3 factors. However, to further support this suggestion it should
be investigated whether the ip-RGCs that die after injury are those
that express Brn3b.
Retinal Ganglion Cells Projecting IpsilaterallyThe only difference observed between strains was in the
numbers and proportion of the ipsilateral population, a fact that it
is known since the 609s [19,46,83–86] and that explains the poorer
binocular vision of albino animals [41]. Whether the crucial
difference lies in their numbers or in their proportion, it is
something that requires further research. Here, we complement
these studies reporting their total numbers and their expression of
Brn3. Two novel conclusions can be drawn from these data: i)
because the contralateral population is almost the same in both
strains (see tables 2 and 3), the higher numbers of RGCs counted
in pigmented rats seems to be due to ipsilateral-RGCs; ii) more
ipsilateral-RGCs express Brn3s in the albino than in the
pigmented rats.
The distribution of ipsilateral-RGCs in rats matches that
previously described in rodents [19,21,46,77,87–89]. These cells
are scattered throughout the retina except in the temporal region,
where they are densest in the periphery and distributed in the
shape of a crescent moon that goes from the ventral to the dorsal
retina. But, as shown in albino and pigmented mice [19], in the
pigmented rat ipsilateral-RGCs are homogenously dense in this
crescent region, while in the albino strain there is a decrease of
these cells towards the central-dorsal retina.
RGC ClassesData presented here are insufficient to determine RGC classes
based on their somatic size, dendritic arborizations, physiology or
projections [17,21,37]. However, if we assume that the bigger the
nucleus the bigger the soma, those RGCs that express the three
Brn3 members or that only express Brn3b are large/very large,
Figure 6. RGC nuclear sizes and expression of Brn3 factors. A:Histogram showing the percentages of Brn3a, Brn3b or Brn3c positivenuclei that are small, medium, large or very large. B: Histogram showingfor each Brn3 combination the percentage of small, medium, large andvery large nuclei (each Brn3 combination was considered 100%). C:Brn3a immunodetection showing the different sizes of RGC nuclei. Anexample of each size range is shown (S: small, M: medium, L: large, VL:very large).doi:10.1371/journal.pone.0049830.g006
Brn3 Expression in the Adult Rat Retina
PLOS ONE | www.plosone.org 9 November 2012 | Volume 7 | Issue 11 | e49830
Brn3 Expression in the Adult Rat Retina
PLOS ONE | www.plosone.org 10 November 2012 | Volume 7 | Issue 11 | e49830
while those that express Brn3a and/or Brn3b or Brn3c are
medium/small. These data can be correlated with those by Dreher
et al [21]. These authors show that RGCs that project to the
dorsal lateral geniculate nuclei (DLG) have bigger somas than
those projecting to the superior colliculi (SCi). Thus, it is possible
that RGCs expressing the three Brn3s are those projecting to the
DLG, while those that co-express two members project to the SCi.
In addition, nuclei that only express Brn3b are the biggest ones,
they might correspond to Class I ganglion cells [21] and to ip-
RGCs [37].
Brn3 Response to Axonal InjuryWe have previously shown that Brn3a expression is maintained
in RGCs as long as they are alive, irrespectively of being injured
[40]. We wanted to know whether this was also true for Brn3b and
Brn3c, but we were unable to determine it, because after optic
nerve injury their level of expression decreased below the signal
needed for quantification. This does not necessarily reflect that
their expression is lost, only that is diminished, since as shown in
figure 6 some very faint positive nuclei are observed at 3 and 5
days post-lesion. In these same retinas, Brn3a was immunode-
tected and it was observed that three days after both lesions there
was already a significant loss of RGCs followed by a further
significant loss at 5 days.
RGC loss itself explains the reduction of Brn3a in the retina, but
is this decrease due as well to its down-regulation in the surviving
RGCs? Analysis of the signal intensity of Brn3a shows that already
at 3 days post-IONT or IONC the surviving RGCs have a lower
than control Brn3a signal. Furthermore, the mean intensity of the
IONT plot at this time point is lower than the IONC one, which
agrees with the fact that optic nerve transection is a more severe
injury than optic nerve crush [39,51,90,91]. This is important
because Brn3a has been shown to have anti-apoptotic effects [92–
97], and Brn3b has a role in rat RGC survival [98]. It is therefore
tempting to speculate that their quick and continuous down-
regulation by the axotomized RGCs [39,59] may be one of the
multiple molecular signals that cause their death [99,100] instead
of a consequence.
Materials and Methods
Animal Handling, Anaesthesia and AnalgesiaAdult female albino Sprague-Dawley (SD, 180–220 g body
weight) and pigmented Pievald Virol Glaxo (PVG, 220–250 g
body weight) rats were obtained from the University of Murcia
breeding colony. All experimental procedures were carried out in
accordance with the Association for Research in Vision and
Ophthalmology and European Union guidelines for the use of
animals in research. This study was approved by the Ethics
Committee for Animal Research of the University Hospital Virgen
de la Arrixaca (Comite Etico de Experimentacion Animal (CEEA)
del Hospital Universitario Virgen de la Arrixaca, Murcia, Spain).
Figure 7. Brn3b and Brn3c expression is rapidly lost after optic nerve injury. A-P: Magnifications from SD flat mounted retinas analyzed 3and 5 days after intraorbital nerve crush (A–H) and intraorbital nerve transection (J–P). As internal control, Brn3a was double immunodetected withBrn3b (A–B, E–F, I–J, M–N) or with Brn3c (C–D, G–H, K–L, O–P). In these images is observed that Brn3b and Brn3c expression decreases already 3days after both injuries. This low signal impeded the automated quantification of Brn3b and Brn3c positive RGCs. Brn3a+RGCs were counted in theseretinas and isodensity maps showing the distribution of the surviving RGCs were created (Q–T, at the bottom of each map is shown the number ofBrn3a+RGCs counted in the retina wherefrom the map has been generated). These maps illustrate that IONT induces a quicker loss of RGCs thanIONC, as evidenced by the higher densities observed in Q and S than in R and T. Colour scale (T bottom right) is the same as in figure 4M. Four (IONC5d) or five (rest of the groups) retinas were analyzed per marker. Bars: 50 mm (J), 1 mm (Q).doi:10.1371/journal.pone.0049830.g007
Figure 8. Injured RGCs down-regulate Brn3a expression. Plot depicting the distribution of RGCs according to their expression level of Brn3a.The number of RGCs (ordinate axis) is plotted against the intensity of their Brn3a signal in control, IONC and IONT injured retinas at 3 and 5 days post-lesion.doi:10.1371/journal.pone.0049830.g008
Brn3 Expression in the Adult Rat Retina
PLOS ONE | www.plosone.org 11 November 2012 | Volume 7 | Issue 11 | e49830
In the animals groups subjected to surgery for anaesthesia a
mixture of xylazine (10 mg/kg body weight; RompunH; Bayer,
Kiel, Germany) and ketamine (60 mg/kg body weight; KetolarH;
Pfizer, Alcobendas, Madrid, Spain) was used intraperitoneally
(i.p.). After surgery, an ointment containing tobramicin (Tobrex;
Alcon S.A., Barcelona, Spain) was applied on the cornea to
prevent its desiccation. Rats were given oral analgesia (Buprex,
Buprenorphine 0.3 mg/mL, Schering-Plough, Madrid, Spain) at
0.5 mg/kg (prepared in strawberry-flavoured gelatine) the day of
the surgery and during the next 3 days.
All animals were sacrificed with an i.p. injection of an overdose
of pentobarbital (Dolethal, VetoquinolH, Especialidades Veter-
inarias, S.A., Alcobendas, Madrid, Spain).
SurgeryRGC tracing from both superior colliculi. Fluorogold
(FG, 3% diluted in 10% DMSO-saline, Fluorochrome, LLC,
USA) was applied to both superior colliculi (SCi) in albino and
pigmented rats one week prior animal processing, following
standard techniques in our laboratory [39,51,66,67,90].
Tracing of RGCs projecting ipsilaterally. In both rat
strains, the left SCi was removed by aspiration. One week later
Fluorogold was applied to the right SCi and animals were
processed a week later.
Optic nerve (ON) axotomy. In albino SD rats, the left ON
was intraorbitally injured according to standard procedures in our
laboratory [39,51,52,90]. For intra-orbital optic nerve transection
(IONT), the ON was sectioned 0.5 mm from the optic disc, while
for intra-orbital optic nerve crush (IONC) the ON was crushed
during 10 seconds at the same distance from the optic disc using
watchmaker’s forceps.
Experimental DesignFlat mounted retinas from untouched albino and
pigmented rats. -Double immunodetection of: i) Brn3a and
Brn3b, ii) Brn3a and Brn3c; iii) Brn3b and Brn3c; iv) melanopsin
and Brn3a; v) melanopsin and Brn3b; vi) melanopsin and Brn3c.
These groups were prepared to assess the percentage of Brn3 co-
expression and the population of intrinsically photosensitive RGCs
(ip-RGCs) that express each member of the Brn3 family. Group iii
was used, as well, to quantify the whole population of Brn3b or
Brn3c positive RGCs.
-Double immunodetection of mouse anti-Brn3a and goat anti-
Brn3a. This group was prepared to check if both antibodies
recognized the same RGC population.
-Triple immunodetection of Brn3a, Brn3b and Brn3c, detecting
all of them with the same fluorophore. This group permitted to
quantify the whole number of Brn3 positive RGCs (Brn3+RGCs).
Retinal cross sections from untouched albino
rats. Single immunodetection of Brn3a, Brn3b and Brn3c.
Flat mounted retinas from albino and pigmented rats
traced from both superior colliculi. FG-tracing from both
SCi labels 98% of RGCs in albino and pigmented rats [23]. Brn3a
immunodetection in albino rats detects 92.2% of the FG-traced
population [39]. This group was used to quantify the whole
number of Brn3a+RGCs and of RGCs traced from both SCi
(henceforth FG-traced RGCs) in both rat strains, and served as
baseline to calculate the proportion, with respect to the total RGC
population, of RGCs that express Brn3b or Brn3c.
Flat mounted retinas from albino and pigmented rats
traced from one superior colliculi. Retinas ipsilateral to the
labelled colliculus (right) were used. In these, Brn3a, Brn3b and
Brn3c were single immunodetected. With this group it was
quantified the whole population of RGCs that project ipsilaterally
(henceforth ipsilateral-RGCs) and assessed the expression of the
three Brn3 members in this RGC subpopulation. In addition, the
total number of FG-traced RGCs in the left retina (contralateral-
RGCs) was quantified as well.
Flat mounted retinas from albino rats subjected to optic
nerve injury. In these retinas Brn3a and Brn3b or Brn3a and
Brn3c were double immunodetected.
The number of retinas analyzed per group and analysis ranged
from 6 to 12 except for ON injured retinas and ip-RGCs (n = 425
per analysis, injury and time point). For details see results (table 1,
table 2 and figure 3 legend).
Retinal DissectionAnimals were perfused transcardially with 4% paraformalde-
hyde (PFA) in phosphate buffer 0.1M after a saline rinse.
Right after deep anesthesia and before fixation a suture was
placed on the dorsal pole of each eye. Retinas were dissected as
flattened whole-mounts by making four radial cuts (the deepest
one in the dorsal pole), post-fixed for an additional hour in 4%PFA
and kept in phosphate buffered saline (PBS) till further processing.
For cryostate sectioning, dissected eyes were cryoprotected in 30%
sucrose (Sigma, Alcobendas, Madrid, Spain) before embedding
them in optimal cutting temperature (OCT) compound (Sakura
Finetek, Torrance, CA).
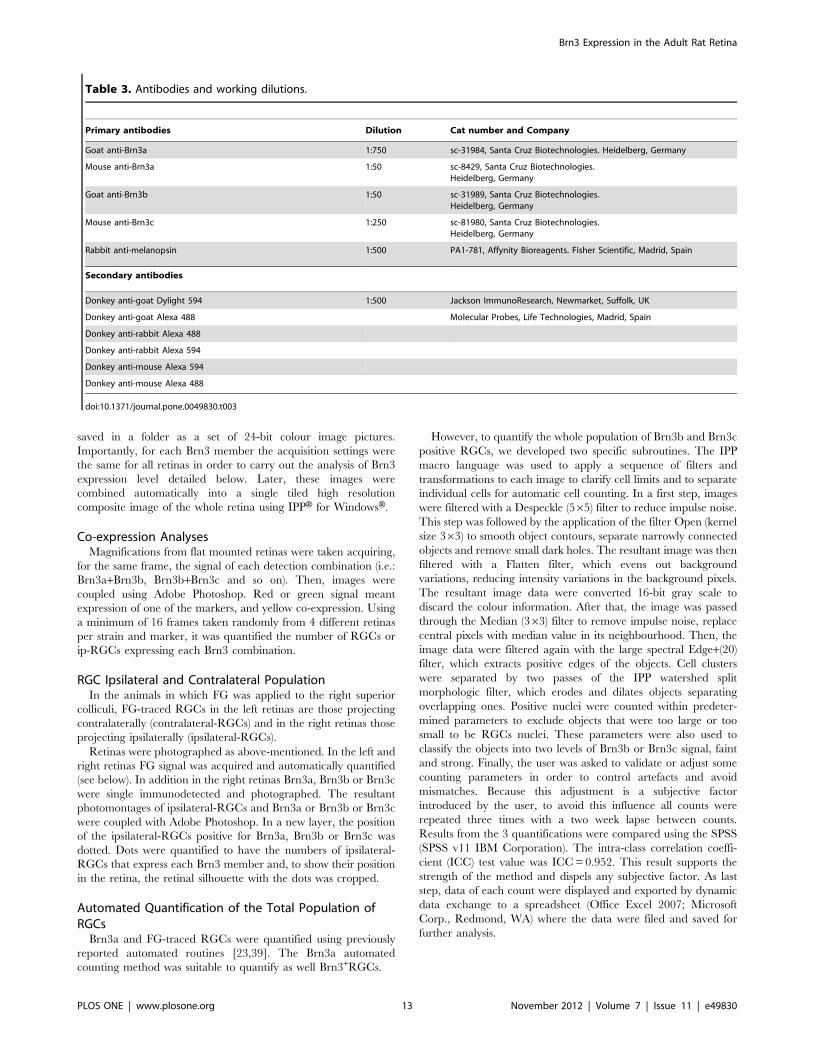
Immunohistofluorescence ProtocolAntibody list and working dilutions are shown in table 3.
Flat mounted retinas. Whole mounts were permeated in
PBS 0.5% Tritonx100 (Sigma Aldrich Quımica, Madrid, Spain)
by freezing them during 15 minutes at 270uC, rinsed in new PBS
0.5%Triton and incubated overnight at 4uC with the appropriate
antibody combination diluted in blocking buffer (PBS, 2% normal
donkey serum, 2% Triton). Afterwards, retinas were washed three
times in PBS-0.5% Triton and incubated 2 hours at room
temperature with fluorescence conjugated-secondary antibodies
diluted in blocking buffer. Finally, after thorough washing in PBS-
0.5% Triton, retinas were rinsed in PBS, mounted vitreal side up
and covered with anti-fading solution (Vecta-Shield Mounting
Medium, Vector Laboratories, Alicante, Spain).
Retinal cross-sections. Sections (15 mm) were washed 3
times with PBS to eliminate the OCT; then, sections were
incubated overnight at 4uC with the appropriate antibodies diluted
in blocking buffer (PBS, 2% donkey normal serum, 0.1%
Tritonx100). Next day, sections were washed with PBS-0.1%
Triton and incubated 1 h at room temperature with fluorescence
conjugated-secondary antibodies diluted in the same blocking
buffer. Finally, after thorough washing in PBS-0.1% Triton,
sections were rinsed in PBS and mounted with anti-fading Vecta-
Shield Mounting Medium with DAPI (Vector Laboratories,
Alicante, Spain).
Image AcquisitionAll samples were photographed with an epifluorescence
microscope (Axioscop 2 Plus; Zeiss Mikroskopie, Jena, Germany)
equipped with a computer-driven motorized stage (ProScanTM
H128 Series, Prior Scientific Instruments, Cambridge, UK),
controlled by the Image Pro Plus software, (IPP 5.1 for WindowsH;
Media Cybernetics, Silver Spring, MD, USA), as previously
described [23,39,78]. Briefly: to make reconstructions of retinal
whole-mounts, retinal multi-frame acquisitions were taken for
each fluorophore in a raster scan pattern. Frames were captured
contiguously side-by-side with no gap or overlap between them
using an 610 objective (Plan-Neofluar, 106/0.30; Zeiss Mikros-
kopie, Jena, Germany). The images taken for each retina were
Brn3 Expression in the Adult Rat Retina
PLOS ONE | www.plosone.org 12 November 2012 | Volume 7 | Issue 11 | e49830
saved in a folder as a set of 24-bit colour image pictures.
Importantly, for each Brn3 member the acquisition settings were
the same for all retinas in order to carry out the analysis of Brn3
expression level detailed below. Later, these images were
combined automatically into a single tiled high resolution
composite image of the whole retina using IPPH for WindowsH.
Co-expression AnalysesMagnifications from flat mounted retinas were taken acquiring,
for the same frame, the signal of each detection combination (i.e.:
Brn3a+Brn3b, Brn3b+Brn3c and so on). Then, images were
coupled using Adobe Photoshop. Red or green signal meant
expression of one of the markers, and yellow co-expression. Using
a minimum of 16 frames taken randomly from 4 different retinas
per strain and marker, it was quantified the number of RGCs or
ip-RGCs expressing each Brn3 combination.
RGC Ipsilateral and Contralateral PopulationIn the animals in which FG was applied to the right superior
colliculi, FG-traced RGCs in the left retinas are those projecting
contralaterally (contralateral-RGCs) and in the right retinas those
projecting ipsilaterally (ipsilateral-RGCs).
Retinas were photographed as above-mentioned. In the left and
right retinas FG signal was acquired and automatically quantified
(see below). In addition in the right retinas Brn3a, Brn3b or Brn3c
were single immunodetected and photographed. The resultant
photomontages of ipsilateral-RGCs and Brn3a or Brn3b or Brn3c
were coupled with Adobe Photoshop. In a new layer, the position
of the ipsilateral-RGCs positive for Brn3a, Brn3b or Brn3c was
dotted. Dots were quantified to have the numbers of ipsilateral-
RGCs that express each Brn3 member and, to show their position
in the retina, the retinal silhouette with the dots was cropped.
Automated Quantification of the Total Population ofRGCs
Brn3a and FG-traced RGCs were quantified using previously
reported automated routines [23,39]. The Brn3a automated
counting method was suitable to quantify as well Brn3+RGCs.
However, to quantify the whole population of Brn3b and Brn3c
positive RGCs, we developed two specific subroutines. The IPP
macro language was used to apply a sequence of filters and
transformations to each image to clarify cell limits and to separate
individual cells for automatic cell counting. In a first step, images
were filtered with a Despeckle (565) filter to reduce impulse noise.
This step was followed by the application of the filter Open (kernel
size 363) to smooth object contours, separate narrowly connected
objects and remove small dark holes. The resultant image was then
filtered with a Flatten filter, which evens out background
variations, reducing intensity variations in the background pixels.
The resultant image data were converted 16-bit gray scale to
discard the colour information. After that, the image was passed
through the Median (363) filter to remove impulse noise, replace
central pixels with median value in its neighbourhood. Then, the
image data were filtered again with the large spectral Edge+(20)
filter, which extracts positive edges of the objects. Cell clusters
were separated by two passes of the IPP watershed split
morphologic filter, which erodes and dilates objects separating
overlapping ones. Positive nuclei were counted within predeter-
mined parameters to exclude objects that were too large or too
small to be RGCs nuclei. These parameters were also used to
classify the objects into two levels of Brn3b or Brn3c signal, faint
and strong. Finally, the user was asked to validate or adjust some
counting parameters in order to control artefacts and avoid
mismatches. Because this adjustment is a subjective factor
introduced by the user, to avoid this influence all counts were
repeated three times with a two week lapse between counts.
Results from the 3 quantifications were compared using the SPSS
(SPSS v11 IBM Corporation). The intra-class correlation coeffi-
cient (ICC) test value was ICC = 0.952. This result supports the
strength of the method and dispels any subjective factor. As last
step, data of each count were displayed and exported by dynamic
data exchange to a spreadsheet (Office Excel 2007; Microsoft
Corp., Redmond, WA) where the data were filed and saved for
further analysis.
Table 3. Antibodies and working dilutions.
Primary antibodies Dilution Cat number and Company
Goat anti-Brn3a 1:750 sc-31984, Santa Cruz Biotechnologies. Heidelberg, Germany
Mouse anti-Brn3a 1:50 sc-8429, Santa Cruz Biotechnologies.Heidelberg, Germany
Goat anti-Brn3b 1:50 sc-31989, Santa Cruz Biotechnologies.Heidelberg, Germany
Mouse anti-Brn3c 1:250 sc-81980, Santa Cruz Biotechnologies.Heidelberg, Germany
Rabbit anti-melanopsin 1:500 PA1-781, Affynity Bioreagents. Fisher Scientific, Madrid, Spain
Secondary antibodies
Donkey anti-goat Dylight 594 1:500 Jackson ImmunoResearch, Newmarket, Suffolk, UK
Donkey anti-goat Alexa 488 Molecular Probes, Life Technologies, Madrid, Spain
Donkey anti-rabbit Alexa 488
Donkey anti-rabbit Alexa 594
Donkey anti-mouse Alexa 594
Donkey anti-mouse Alexa 488
doi:10.1371/journal.pone.0049830.t003
Brn3 Expression in the Adult Rat Retina
PLOS ONE | www.plosone.org 13 November 2012 | Volume 7 | Issue 11 | e49830
Validation of the Brn3b and Brn3c Automated CountingMethod
To validate the Brn3b and Brn3c automated counting routine,
three different experienced investigators counted manually and in
a masked fashion, a total of 7,818 Brn3b+RGCs and 6,920
Brn3c+RGCs present in 17 frames. These frames represented
different RGC density regions and were randomly selected from
seven whole-mounted retinas. These results were plotted against
the counts obtained automatically (7,583 Brn3b and 6,630 Brn3c
positive nuclei). The high correlation between both methods
(Pearson correlation test, R2 = 0.95 for Brn3b and R2 = 0.96 for
Brn3c) validates the automated method.
Measurement of Brn3a Expression IntensityAs a last step of the previously described counting routines, a
new transformation was performed by the creation of a black and
white mask in which the counted nuclei were represented as white
and the rest of the image as black. The original image was then
multiplied by this new black and white mask and a new clean
image, containing only the counted nuclei as they were in the
original image (i.e. each nuclei with its original intensity), was
produced. This image was then transformed into a 16-bit gray
scale image where the signal intensity of each nucleus was
measured in fluorescence arbitrary units, where white (maximum
signal) was 65,535 and black (no signal) was 0. These values were
exported to an Excel sheet and plotted using SigmaPlot 10.0
(Systat Software Inc).
Measurement of Nuclei AreaIn the magnifications from the albino strain used for the co-
expression analysis, Brn3+nuclei area was measured. The perim-
eter of each nuclei was manually outlined and the area within
automatically measured using the IPP software. Areas were
collected from 8,494 nuclei; of these 8,315 were Brn3a+, 4,855
Brn3b+and 3,599 Brn3c+. Having into account Brn3 co-expres-
sion, 2,828 were Brn3a&Brn3b+, 1,329 Brn3a&Brn3c+, 1,848
Brn3b&Brn3c+(therefore also Brn3a+, see results), 2,310
Brn3a+and Brn3c-, and 179 Brn3b+, Brn3a- and Brn3c2. Notice
that in all cases of double expression, nuclei could also express the
third Brn3 member, but because two fluorophores were used it
was not possible to determine how many. In addition, this
precluded as well the assessment of nuclei expressing only Brn3a.
Values were exported to an Excel sheet and plotted using
SigmaPlot 10.0 (Systat Software Inc).
Isodensity MapsDetailed spatial distribution of the different populations of
RGCs over the entire retinas was demonstrated with isodensity
maps constructed as previously described [23,39], with the
exception that Brn3b and Brn3c densities were calculated in
areas of interest of 0.0767 mm2 instead of 0.0074 mm2. Isodensity
maps are created from the data gathered after automated
quantification. With these maps is illustrated the RGC density
and its distribution in the whole retina according to a colour scale
that goes from 0 RGCs/mm2 to a maximum density that was set
to: 3,200 RGCs/mm2 or more for FG+, Brn3a+and Brn3+RGCs,
1,800 RGCs/mm2 or more for Brn3b+RGCs and 1,600 RGCs/
mm2 or more for Brn3c+RGCs. The maximum density was
adjusted to these numbers to allow the visualization of high and
low density areas within the retina.
StatisticsData were analyzed with Sigma Stats Ver. 3.11 (Systat Software
Inc, 2004). Tests are detailed in results. Differences were
considered significant when p,0.05.
Acknowledgments
We thank Leticia Nieto Lopez for her technical support.
Author Contributions
Conceived and designed the experiments: MAB MVS FNN MSN.
Performed the experiments: FNN MJL MSN PSC JAB. Analyzed the
data: MAB FNN MJL. Contributed reagents/materials/analysis tools:
MAB MVS. Wrote the paper: MAB MVS.
References
1. Ninkina NN, Stevens GE, Wood JN, Richardson WD (1993) A novel Brn3-like
POU transcription factor expressed in subsets of rat sensory and spinal cordneurons. Nucleic Acids Res 21: 3175–3182.
2. Lillycrop KA, Budrahan VS, Lakin ND, Terrenghi G, Wood JN et al. (1992) Anovel POU family transcription factor is closely related to Brn-3 but has a
distinct expression pattern in neuronal cells. Nucleic Acids Res 20: 5093–5096.
3. He X, Treacy MN, Simmons DM, Ingraham HA, Swanson LW et al. (1989)Expression of a large family of POU-domain regulatory genes in mammalian
brain development. Nature 340: 35–41.
4. Badea TC, Williams J, Smallwood P, Shi M, Motajo O et al. (2012)
Combinatorial expression of Brn3 transcription factors in somatosensoryneurons: genetic and morphologic analysis. J Neurosci 32: 995–1007.
5. Xiang M, Zhou L, Macke JP, Yoshioka T, Hendry SH et al. (1995) The Brn-3
family of POU-domain factors: primary structure, binding specificity, andexpression in subsets of retinal ganglion cells and somatosensory neurons.
J Neurosci 15: 4762–4785.
6. Wang SW, Mu X, Bowers WJ, Kim DS, Plas DJ et al. (2002) Brn3b/Brn3c
double knockout mice reveal an unsuspected role for Brn3c in retinal ganglioncell axon outgrowth. Development 129: 467–477.
7. Latchman DS (1999) POU family transcription factors in the nervous system.
J Cell Physiol 179: 126–133.
8. Ichikawa H, Qiu F, Xiang M, Sugimoto T (2005) Brn-3a is required for thegeneration of proprioceptors in the mesencephalic trigeminal tract nucleus.
Brain Res 1053: 203–206.
9. Huang EJ, Liu W, Fritzsch B, Bianchi LM, Reichardt LF et al. (2001) Brn3a is a
transcriptional regulator of soma size, target field innervation and axonpathfinding of inner ear sensory neurons. Development 128: 2421–2432.
10. Ensor E, Smith MD, Latchman DS (2001) The BRN-3A transcription factor
protects sensory but not sympathetic neurons from programmed cell death/
apoptosis. J Biol Chem 276: 5204–5212.
11. Zou M, Li S, Klein WH, Xiang M (2012) Brn3a/Pou4f1 regulates dorsal root
ganglion sensory neuron specification and axonal projection into the spinal cord.Dev Biol 364: 114–127.
12. Xiang M, Gan L, Li D, Zhou L, Chen ZY, Wagner D et al. (1997) Role of theBrn-3 family of POU-domain genes in the development of the auditory/
vestibular, somatosensory, and visual systems. Cold Spring Harb Symp QuantBiol 62: 325–336.
13. Eng SR, Lanier J, Fedtsova N, Turner EE (2004) Coordinated regulation of geneexpression by Brn3a in developing sensory ganglia. Development 131: 3859–
3870.
14. Eng SR, Dykes IM, Lanier J, Fedtsova N, Turner EE (2007) POU-domain factor
Brn3a regulates both distinct and common programs of gene expression in the
spinal and trigeminal sensory ganglia. Neural Dev 2: 3.
15. Pan L, Yang Z, Feng L, Gan L (2005) Functional equivalence of Brn3 POU-
domain transcription factors in mouse retinal neurogenesis. Development 132:703–712.
16. Liu W, Khare SL, Liang X, Peters MA, Liu 6 et al. (2000) All Brn3 genes canpromote retinal ganglion cell differentiation in the chick. Development 127:
3237–3247.
17. Sefton AJ, Dreher B, Harvey A (2004) Visual system. In: Paxinos G, editors. The
rat nervous system. USA: Elsevier. 1083–1165.
18. Linden R, Perry VH (1983) Massive retinotectal projection in rats. Brain Res
272: 145–149.
19. Drager UC, Olsen JF (1980) Origins of crossed and uncrossed retinal projections
in pigmented and albino mice. J Comp Neurol 191: 383–412.
20. Hofbauer A, Drager UC (1985) Depth segregation of retinal ganglion cells
projecting to mouse superior colliculus. J Comp Neurol 234: 465–474.
21. Dreher B, Sefton AJ, Ni SY, Nisbett G (1985) The morphology, number,
distribution and central projections of Class I retinal ganglion cells in albino andhooded rats. Brain Behav Evol 26: 10–48.
Brn3 Expression in the Adult Rat Retina
PLOS ONE | www.plosone.org 14 November 2012 | Volume 7 | Issue 11 | e49830
22. Salinas-Navarro M, Jimenez-Lopez M, Valiente-Soriano FJ, Alarcon-MartinezL, Aviles-Trigueros M et al. (2009) Retinal ganglion cell population in adult
albino and pigmented mice: a computerized analysis of the entire population
and its spatial distribution. Vision Res 49: 637–647.
23. Salinas-Navarro M, Mayor-Torroglosa S, Jimenez-Lopez M, Aviles-Trigueros
M, Holmes TM et al. (2009) A computerized analysis of the entire retinalganglion cell population and its spatial distribution in adult rats. Vision Res 49:
115–126.
24. Kim IJ, Zhang Y, Yamagata M, Meister M, Sanes JR (2008) Molecularidentification of a retinal cell type that responds to upward motion. Nature 452:
478–482.
25. Provencio I, Rodriguez IR, Jiang G, Hayes WP, Moreira EF et al. (2000) A
novel human opsin in the inner retina. J Neurosci 20: 600–605.
26. Provencio I, Rollag MD, Castrucci AM (2002) Photoreceptive net in themammalian retina. This mesh of cells may explain how some blind mice can still
tell day from night. Nature 415: 493.
27. Schmidt TM, Chen SK, Hattar S (2011) Intrinsically photosensitive retinal
ganglion cells: many subtypes, diverse functions. Trends Neurosci 34: 572–580.
28. Ecker JL, Dumitrescu ON, Wong KY, Alam NM, Chen SK, LeGates T et al.(2010) Melanopsin-expressing retinal ganglion-cell photoreceptors: cellular
diversity and role in pattern vision. Neuron 67: 49–60.
29. Isenmann S, Kretz A, Cellerino A (2003) Molecular determinants of retinalganglion cell development, survival, and regeneration. Prog Retin Eye Res 22:
483–543.
30. Xiang M, Zhou H, Nathans J (1996) Molecular biology of retinal ganglion cells.
Proc Natl Acad Sci U S A 93: 596–601.
31. Kiyama T, Mao CA, Cho JH, Fu X, Pan P et al. (2011) Overlappingspatiotemporal patterns of regulatory gene expression are required for neuronal
progenitors to specify retinal ganglion cell fate. Vision Res 51: 251–259.
32. Quina LA, Pak W, Lanier J, Banwait P, Gratwick K et al. (2005) Brn3a-
expressing retinal ganglion cells project specifically to thalamocortical and
collicular visual pathways. J Neurosci 25: 11595–11604.
33. Qiu F, Jiang H, Xiang M (2008) A comprehensive negative regulatory program
controlled by Brn3b to ensure ganglion cell specification from multipotentialretinal precursors. J Neurosci 28: 3392–3403.
34. Mu X, Klein WH (2004) A gene regulatory hierarchy for retinal ganglion cell
specification and differentiation. Semin Cell Dev Biol 15: 115–123.
35. Gan L, Xiang M, Zhou L, Wagner DS, Klein WH et al. (1996) POU domain
factor Brn-3b is required for the development of a large set of retinal ganglion
cells. Proc Natl Acad Sci U S A 93: 3920–3925.
36. Badea TC, Cahill H, Ecker J, Hattar S, Nathans J (2009) Distinct roles of
transcription factors brn3a and brn3b in controlling the development,morphology, and function of retinal ganglion cells. Neuron 61: 852–864.
37. Badea TC, Nathans J (2011) Morphologies of mouse retinal ganglion cells
expressing transcription factors Brn3a, Brn3b, and Brn3c: analysis of wild typeand mutant cells using genetically-directed sparse labeling. Vision Res 51: 269–
279.
38. Galindo-Romero C, Aviles-Trigueros M, Jimenez-Lopez M, Valiente-Soriano
FJ, Salinas-Navarro M et al. (2011) Axotomy-induced retinal ganglion cell death
in adult mice: quantitative and topographic time course analyses. Exp Eye Res92: 377–387.
39. Nadal-Nicolas FM, Jimenez-Lopez M, Sobrado-Calvo P, Nieto-Lopez L,Canovas-Martinez I et al. (2009) Brn3a as a marker of retinal ganglion cells:
qualitative and quantitative time course studies in naive and optic nerve-injured
retinas. Invest Ophthalmol Vis Sci 50: 3860–3868.
40. Sanchez-Migallon MC, Nadal-Nicolas FM, Jimenez-Lopez M, Sobrado-Calvo
P, Vidal-Sanz M et al. (2011) Brain derived neurotrophic factor maintains Brn3aexpression in axotomized rat retinal ganglion cells. Exp Eye Res 92: 260–267.
41. Balkema GW, Drager UC (1991) Impaired visual thresholds in hypopigmented
animals. Vis Neurosci 6: 577–585.
42. Balkema GW, Jr., Pinto LH, Drager UC, Vanable JW, Jr. (1981) Character-
ization of abnormalities in the visual system of the mutant mouse pearl.J Neurosci 1: 1320–1329.
43. Prusky GT, Harker KT, Douglas RM, Whishaw IQ (2002) Variation in visual
acuity within pigmented, and between pigmented and albino rat strains. BehavBrain Res 136: 339–348.
44. Drager UC, Balkema GW (1987) Does melanin do more than protect from
light? Neurosci Res Suppl 6: S75–S86.
45. Leahy KM, Ornberg RL, Wang Y, Zhu Y, Gidday JM et al. (2004) Quantitative
ex vivo detection of rodent retinal ganglion cells by immunolabeling Brn-3b. ExpEye Res 79: 131–140.
46. Lund RD (1965) Uncrossed Visual Pathways of Hooded and Albino Rats.
Science 149: 1506–1507.
47. Cowey A, Perry VH (1979) The projection of the temporal retina in rats, studied
by retrograde transport of horseradish peroxidase. Exp Brain Res 35: 457–464.
48. Wang S, Villegas-Perez MP, Holmes T, Lawrence JM, Vidal-Sanz M et al.
(2003) Evolving neurovascular relationships in the RCS rat with age. Curr Eye
Res 27: 183–196.
49. Casson RJ, Chidlow G, Wood JP, Vidal-Sanz M, Osborne NN (2004) The effect
of retinal ganglion cell injury on light-induced photoreceptor degeneration.Invest Ophthalmol Vis Sci 45: 685–693.
50. Lindqvist N, Peinado-Ramon P, Vidal-Sanz M, Hallbook F (2004) GDNF, Ret,
GFRalpha1 and 2 in the adult rat retino-tectal system after optic nervetransection. Exp Neurol 187: 487–499.
51. Peinado-Ramon P, Salvador M, Villegas-Perez MP, Vidal-Sanz M (1996) Effects
of axotomy and intraocular administration of NT-4, NT-3, and brain-derived
neurotrophic factor on the survival of adult rat retinal ganglion cells. A
quantitative in vivo study. Invest Ophthalmol Vis Sci 37: 489–500.
52. Villegas-Perez MP, Vidal-Sanz M, Rasminsky M, Bray GM, Aguayo AJ (1993)
Rapid and protracted phases of retinal ganglion cell loss follow axotomy in the
optic nerve of adult rats. J Neurobiol 24: 23–36.
53. Thanos S (1991) Specific transcellular carbocyanine-labelling of rat retinal
microglia during injury-induced neuronal degeneration. Neurosci Lett 127: 108–
112.
54. Thanos S, Pavlidis C, Mey J, Thiel HJ (1992) Specific transcellular staining of
microglia in the adult rat after traumatic degeneration of carbocyanine-filled
retinal ganglion cells. Exp Eye Res 55: 101–117.
55. Sobrado-Calvo P, Vidal-Sanz M, Villegas-Perez MP (2007) Rat retinal
microglial cells under normal conditions, after optic nerve section, and after
optic nerve section and intravitreal injection of trophic factors or macrophage
inhibitory factor. J Comp Neurol 501: 866–878.
56. Salvador-Silva M, Vidal-Sanz M, Villegas-Perez MP (2000) Microglial cells in
the retina of Carassius auratus: effects of optic nerve crush. J Comp Neurol 417:
431–447.
57. Bernstein SL, Koo JH, Slater BJ, Guo Y, Margolis FL (2006) Analysis of optic
nerve stroke by retinal Bex expression. Mol Vis 12: 147–155.
58. Barnstable CJ, Drager UC (1984) Thy-1 antigen: a ganglion cell specific marker
in rodent retina. Neuroscience 11: 847–855.
59. Weishaupt JH, Klocker N, Bahr M (2005) Axotomy-induced early down-
regulation of POU-IV class transcription factors Brn-3a and Brn-3b in retinal
ganglion cells. J Mol Neurosci 26: 17–25.
60. Buckingham BP, Inman DM, Lambert W, Oglesby E, Calkins DJ et al. (2008)
Progressive ganglion cell degeneration precedes neuronal loss in a mouse model
of glaucoma. J Neurosci 28: 2735–2744.
61. Soto I, Oglesby E, Buckingham BP, Son JL, Roberson ED et al. (2008) Retinal
ganglion cells downregulate gene expression and lose their axons within the optic
nerve head in a mouse glaucoma model. J Neurosci 28: 548–561.
62. Surgucheva I, Weisman AD, Goldberg JL, Shnyra A, Surguchov A (2008)
Gamma-synuclein as a marker of retinal ganglion cells. Mol Vis 14: 1540–1548.
63. Nguyen JV, Soto I, Kim KY, Bushong EA, Oglesby E et al. (2011) Myelination
transition zone astrocytes are constitutively phagocytic and have synuclein
dependent reactivity in glaucoma. Proc Natl Acad Sci U S A 108: 1176–1181.
64. Garcia-Ayuso D, Salinas-Navarro M, Agudo M, Cuenca N, Pinilla I et al. (2010)
Retinal ganglion cell numbers and delayed retinal ganglion cell death in the
P23H rat retina. Exp Eye Res 91: 800–810.
65. Garcia-Ayuso D, Salinas-Navarro M, Agudo-Barriuso M, Alarcon-Martinez L,
Vidal-Sanz M et al. (2011) Retinal ganglion cell axonal compression by retinal
vessels in light-induced retinal degeneration. Mol Vis 17: 1716–1733.
66. Salinas-Navarro M, Alarcon-Martinez L, Valiente-Soriano FJ, Ortin-Martinez
A, Jimenez-Lopez M et al. (2009) Functional and morphological effects of laser-
induced ocular hypertension in retinas of adult albino Swiss mice. Mol Vis 15:
2578–2598.
67. Salinas-Navarro M, Alarcon-Martinez L, Valiente-Soriano FJ, Jimenez-Lopez
M, Mayor-Torroglosa S et al. (2010) Ocular hypertension impairs optic nerve
axonal transport leading to progressive retinal ganglion cell degeneration. Exp
Eye Res 90: 168–183.
68. Zhang PP, Yang XL, Zhong YM (2012) Cellular localization of P2Y(6) receptor
in rat retina. Neuroscience 220: 62–69.
69. Li C, Wang L, Huang K, Zheng L (2012) Endoplasmic reticulum stress in retinal
vascular degeneration: protective role of resveratrol. Invest Ophthalmol Vis Sci
53: 3241–3249.
70. Voyatzis S, Muzerelle A, Gaspar P, Nicol6 (2012) Modeling activity and target-
dependent developmental cell death of mouse retinal ganglion cells ex vivo.
PLoS One 7: e31105.
71. Ganesh BS, Chintala SK (2011) Inhibition of reactive gliosis attenuates
excitotoxicity-mediated death of retinal ganglion cells. PLoS One 6: e18305.
72. Bouaita A, Augustin S, Lechauve C, Cwerman-Thibault H, Benit P et al. (2012)
Downregulation of apoptosis-inducing factor in Harlequin mice induces
progressive and severe optic atrophy which is durably prevented by AAV2-
AIF1 gene therapy. Brain 135: 35–52.
73. Jeon CJ, Strettoi E, Masland RH (1998) The major cell populations of the mouse
retina. J Neurosci 18: 8936–8946.
74. Vidal-Sanz M, Salinas-Navarro M, Nadal-Nicolas FM, Alarcon-Martinez L,
Valiente-Soriano FJ et al. (2012) Understanding glaucomatous damage:
anatomical and functional data from ocular hypertensive rodent retinas. Prog
Retin Eye Res 31: 1–27.
75. Drager UC, Olsen JF (1981) Ganglion cell distribution in the retina of the
mouse. Invest Ophthalmol Vis Sci 20: 285–293.
76. Fukuda Y (1977) A three-group classification of rat retinal ganglion cells:
histological and physiological studies. Brain Res 119: 327–334.
77. Reese BE, Cowey A (1986) Large retinal ganglion cells in the rat: their
distribution and laterality of projection. Exp Brain Res 61: 375–385.
78. Ortin-Martinez A, Jimenez-Lopez M, Nadal-Nicolas FM, Salinas-Navarro M,
Alarcon-Martinez L et al. (2010) Automated quantification and topographical
distribution of the whole population of S- and L-cones in adult albino and
pigmented rats. Invest Ophthalmol Vis Sci 51: 3171–3183.
Brn3 Expression in the Adult Rat Retina
PLOS ONE | www.plosone.org 15 November 2012 | Volume 7 | Issue 11 | e49830

79. Jain V, Ravindran E, Dhingra NK (2012) Differential expression of Brn3
transcription factors in intrinsically photosensitive retinal ganglion cells inmouse. J Comp Neurol 520: 742–755.
80. Chen SK, Badea TC, Hattar S (2011) Photoentrainment and pupillary light
reflex are mediated by distinct populations of ip-RGCs. Nature 476: 92–95.81. Li SY, Yau SY, Chen BY, Tay DK, Lee VW et al. (2008) Enhanced survival of
melanopsin-expressing retinal ganglion cells after injury is associated with thePI3 K/Akt pathway. Cell Mol Neurobiol 28: 1095–1107.
82. Li RS, Chen BY, Tay DK, Chan HH, Pu ML et al. (2006) Melanopsin-
expressing retinal ganglion cells are more injury-resistant in a chronic ocularhypertension model. Invest Ophthalmol Vis Sci 47: 2951–2958.
83. Balkema GW, Drager UC (1990) Origins of uncrossed retinofugal projections innormal and hypopigmented mice. Vis Neurosci 4: 595–604.
84. Lund RD, Land PW, Boles J (1980) Normal and abnormal uncrossedretinotectal pathways in rats: an HRP study in adults. J Comp Neurol 189:
711–720.
85. Martin PR, Sefton AJ, Dreher B (1983) The retinal location and fate of ganglioncells which project to the ipsilateral superior colliculus in neonatal albino and
hooded rats. Neurosci Lett 41: 219–226.86. Lund JS, Remington FL, Lund RD (1976) Differential central distribution of
optic nerve components in the rat. Brain Res 116: 83–100.
87. Reese BE (1986) The topography of expanded uncrossed retinal projectionsfollowing neonatal enucleation of one eye: differing effects in dorsal lateral
geniculate nucleus and superior colliculus. J Comp Neurol 250: 8–32.88. Drager UC (1985) Birth dates of retinal ganglion cells giving rise to the crossed
and uncrossed optic projections in the mouse. Proc R Soc Lond B Biol Sci 224:57–77.
89. Young MJ, Lund RD (1998) The retinal ganglion cells that drive the
pupilloconstrictor response in rats. Brain Res 787: 191–202.90. Parrilla-Reverter G, Agudo M, Sobrado-Calvo P, Salinas-Navarro M, Villegas-
Perez MP et al. (2009) Effects of different neurotrophic factors on the survival ofretinal ganglion cells after a complete intraorbital nerve crush injury: a
quantitative in vivo study. Exp Eye Res 89: 32–41.
91. Parrilla-Reverter G, Agudo M, Nadal-Nicolas F, Alarcon-Martinez L, Jimenez-
Lopez M et al. (2009) Time-course of the retinal nerve fibre layer degeneration
after complete intra-orbital optic nerve transection or crush: a comparative
study. Vision Res 49: 2808–2825.
92. Budhram-Mahadeo V, Morris P, Ndisang D, Irshad S, Lozano G et al. (2002)
The Brn-3a POU family transcription factor stimulates p53 gene expression in
human and mouse tumour cells. Neurosci Lett 334: 1–4.
93. Faulkes DJ, Ensor E, Le Rouzic E, Latchman DS (2004) Distinct domains of
Brn-3a regulate apoptosis and neurite outgrowth in vivo. Neuroreport 15: 1421–
1425.
94. Hudson CD, Morris PJ, Latchman DS, Budhram-Mahadeo VS (2005) Brn-3a
transcription factor blocks p53-mediated activation of proapoptotic target genes
Noxa and Bax in vitro and in vivo to determine cell fate. J Biol Chem 280:
11851–11858.
95. Smith MD, Melton LA, Ensor EA, Packham G, Anderson P et al. (2001) Brn-3a
activates the expression of Bcl-x(L) and promotes neuronal survival in vivo as
well as in vitro. Mol Cell Neurosci 17: 460–470.
96. Smith MD, Ensor EA, Kinloch RA, Latchman DS (2001) The POU domain
transcription factor Brn-3a protects cortical neurons from apoptosis. Neurore-
port 12: 3183–3188.
97. Farooqui-Kabir SR, Budhram-Mahadeo V, Lewis H, Latchman DS, Marber
MS et al. (2004) Regulation of Hsp27 expression and cell survival by the POU
transcription factor Brn3a. Cell Death Differ 11: 1242–1244.
98. Calissano M, Latchman DS (2010) Cell-specific regulation of the pro-survival
Brn-3b transcription factor by microRNAs. Mol Cell Neurosci 45: 317–323.
99. Agudo M, Perez-Marin MC, Lonngren U, Sobrado P, Conesa A et al. (2008)
Time course profiling of the retinal transcriptome after optic nerve transection
and optic nerve crush. Mol Vis 14: 1050–1063.
100. Agudo M, Perez-Marin MC, Sobrado-Calvo P, Lonngren U, Salinas-Navarro
M et al. (2009) Immediate upregulation of proteins belonging to different
branches of the apoptotic cascade in the retina after optic nerve transection and
optic nerve crush. Invest Ophthalmol Vis Sci 50: 424–431.
Brn3 Expression in the Adult Rat Retina
PLOS ONE | www.plosone.org 16 November 2012 | Volume 7 | Issue 11 | e49830

![Comm Dermatol J 2014; 11: 1-12 Albinism · Albinism is a common medical condition in which there is a defect in the ability of the body to synthesise melanin [1]. Conventionally albinism](https://img.dokumen.tips/doc/110x75/5f0b8a0a7e708231d43103b9/comm-dermatol-j-2014-11-1-12-albinism-albinism-is-a-common-medical-condition-in.jpg)


![Albinism powerpoint[1]](https://img.dokumen.tips/doc/110x75/54b9286f4a795900608b4569/albinism-powerpoint1.jpg)