Embed Size (px)
Citation preview
BioMed CentralBMC Genetics
ss
Open AcceProceedingsWhole-genome association analysis to identify markers associated with recombination rates using single-nucleotide polymorphisms and microsatellitesSong Huang1, Shuang Wang2, Nianjun Liu3,4, Liang Chen5, Cheongeun Oh3,6 and Hongyu Zhao*3,7Address: 1Program of Computational Biology and Bioinformatics, Yale University, New Haven, CT 06520, USA, 2Department of Biostatistics, Mailman School of Public Health, Columbia University, New York, NY 10032, USA, 3Department of Epidemiology and Public Health, Yale University, New Haven, CT 06520, USA, 4Department of Biostatistics, University of Alabama at Birmingham, Birmingham, AL 35294, USA, 5Department of Molecular, Cellular and Developmental Biology, Yale University, New Haven, CT 06520, USA, 6Division of Biostatistics, Department of Preventive Medicine, University of Medicine and Dentisry of New Jersey, Newark, NJ 07101, USA and 7Department of Genetics, Yale University, New Haven, CT 06520, USA
Email: Song Huang - [email protected]; Shuang Wang - [email protected]; Nianjun Liu - [email protected]; Liang Chen - [email protected]; Cheongeun Oh - [email protected]; Hongyu Zhao* - [email protected]
* Corresponding author
AbstractRecombination during meiosis is one of the most important biological processes, and the level ofrecombination rates for a given individual is under genetic control. In this study, we conductedgenome-wide association studies to identify chromosomal regions associated with recombinationrates. We analyzed genotype data collected on the pedigrees in the Collaborative Study on theGenetics on Alcoholism data provided by Genetic Analysis Workshop 14. A total of 315microsatellites and 10,081 single-nucleotide polymorphisms from Affymetrix on 22 autosomalchromosomes were used in our association analysis. Genome-wide gender-specific recombinationcounts for family founders were inferred first and association analysis was performed using multiplelinear regressions. We used the positive false discovery rate (pFDR) to account for multiplecomparisons in the two genome-wide scans. Eight regions showed some evidence of associationwith recombination counts based on the single-nucleotide polymorphism analysis after adjusting formultiple comparisons. However, no region was found to be significant using microsatellites.
BackgroundRecombination between two homologous chromosomesduring meiosis generates novel gene combinations andcreates genetic diversity among chromosomes. Further-more, recombination is critical for proper segregation ofhomologous chromosomes, and is a major factor shapinglinkage disequilibrium (LD) patterns in the genome [1].Much research has been done recently to establish humangenetic maps based on recombination and on estimatinglocal recombination rates to augment LD studies and aid
in LD study design and interpretation [1-8]. Kong et al. [2]found marked regional differences in recombination ratesand concluded that DNA changes contributing to evolu-tion may not be completely random, but more concen-trated within specific regions. This difference may bedriven by sequence features. In addition, recombinationrate is under genetic control, as exemplified in the findingby Ji et al. [9] that maize meiotic mutant desynaptic is arecombination modifier that controls recombinationrates. In this study, seeking to identify regions potentially
from Genetic Analysis Workshop 14: Microsatellite and single-nucleotide polymorphismNoordwijkerhout, The Netherlands, 7-10 September 2004
Published: 30 December 2005
BMC Genetics 2005, 6(Suppl 1):S51 doi:10.1186/1471-2156-6-S1-S51<supplement> <title> <p>Genetic Analysis Workshop 14: Microsatellite and single-nucleotide polymorphism</p> </title> <editor>Joan E Bailey-Wilson, Laura Almasy, Mariza de Andrade, Julia Bailey, Heike Bickeböller, Heather J Cordell, E Warwick Daw, Lynn Goldin, Ellen L Goode, Courtney Gray-McGuire, Wayne Hening, Gail Jarvik, Brion S Maher, Nancy Mendell, Andrew D Paterson, John Rice, Glen Satten, Brian Suarez, Veronica Vieland, Marsha Wilcox, Heping Zhang, Andreas Ziegler and Jean W MacCluer</editor> <note>Proceedings</note> </supplement>
Page 1 of 5(page number not for citation purposes)
BMC Genetics 2005, 6:S51
affecting recombination rates, we conducted genome-wide association studies based on microsatellites and sin-gle-nucleotide polymorphisms (SNPs) of the Collabroa-tive Study on the Genetics of Alcoholism (COGA) dataprovided by Genetic Analysis Workshop 14 (GAW14). Atotal of 315 microsatellites and 10,081 SNPs fromAffymetrix on 22 autosomal chromosomes were ana-lyzed. We found eight regions/thirteen SNPs that showedsome evidence of association with recombination counts.No region was found to be significant using microsatel-lites after adjusting for multiple comparisons based on thepositive false discovery rate (pFDR) criterion.
MethodsRecombination CountsThe COGA data consist of 143 pedigrees with 1,614 indi-viduals, including 1,109 male and female meioses.Genetic maps for microsatellites and SNPs were both pro-vided by GAW14. Some of the distinct SNPs have thesame genetic map position, which made inferring recom-bination events between these SNPs impossible. There-fore, we added 1.0 × 10⁻⁶ at these SNPs' genetic mappositions to make them distinguishable. To estimate thenumber of both maternal and paternal recombinationevents for each female or male meiosis, we used the Bestoption in the haplotyping analysis in MERLIN [10], whichoutputs the most likely haplotype as well as the mostlikely sites for recombination throughout a pedigree. Thetotal number of gender-specific recombination counts foreach parent was obtained by averaging the numbers ofrecombination events of all the offspring, which was cal-culated as the total number of recombination eventsobserved in the 22 autosomal chromosomes. For pedi-grees with only two generations, i.e., the nuclear families,the inferred average total number of recombinationevents from each meiosis of the founders was then treatedas a quantitative trait and genome-wide association testswere conducted to identify markers associated with thisquantitative trait. For the pedigrees with three or moregenerations, only recombination information from thefounders were extracted and considered in the associationtests. We compared the results from the two scans usingeither microsatellites or SNPs.
Genotyping error detectionBecause genotyping error may lead to double recombina-tions within a short distance, it can significantly affect theoverall recombination counts. To minimize this impact,the error-checking algorithm implemented in MERLIN,which identifies unlikely genotypes based on doublerecombination events, was applied and the erroneousgenotypes were excluded before applying haplotypinganalysis. We used the default parameter in MERLIN,where the erroneous genotypes with a likelihood ratio p ≤
0.025 were excluded [11]. The same procedure wasapplied to both SNPs and microsatellies.
Association analysis to identify markers associated with recombination ratesWe used multiple linear regressions to evaluate the rela-tion between recombination counts and markers across22 autosomal chromosomes with adjustments for age andgender for both SNPs and microsatellites. Analysis wascarried out based on Whites only to reduce potential con-founding factors related to ethnic differences. To accountfor the multiple comparison problem in the two whole-genome scans, we used pFDR through q-values [12],where a cut-off point of 5% is chosen. The q-value is ameasure of significance in terms of the pFDR, and it isdefined to be the minimum pFDR at which the statisticcan be called significant. A pFDR of 5% means that amongall of the features that are called significant, 5% of themmay correspond to the true null hypotheses on average.To get the q-value for each marker, we used the softwareQVALUE [12] on the p-values obtained from the multipleregressions.
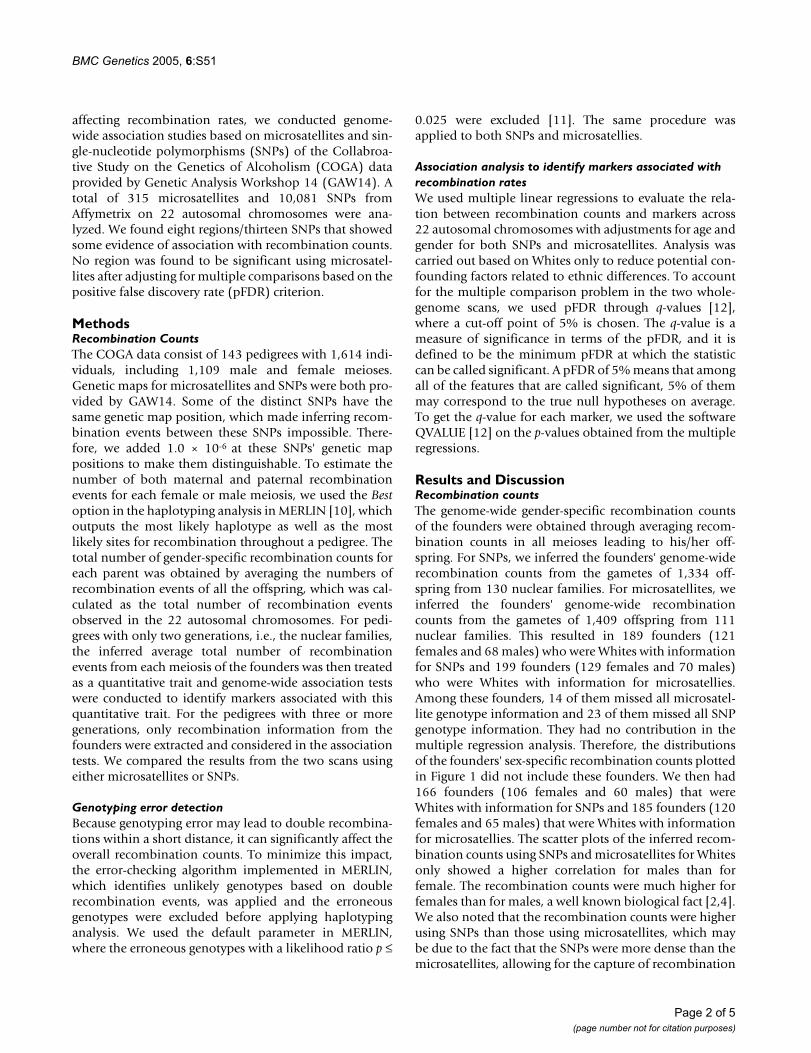
Results and DiscussionRecombination countsThe genome-wide gender-specific recombination countsof the founders were obtained through averaging recom-bination counts in all meioses leading to his/her off-spring. For SNPs, we inferred the founders' genome-widerecombination counts from the gametes of 1,334 off-spring from 130 nuclear families. For microsatellites, weinferred the founders' genome-wide recombinationcounts from the gametes of 1,409 offspring from 111nuclear families. This resulted in 189 founders (121females and 68 males) who were Whites with informationfor SNPs and 199 founders (129 females and 70 males)who were Whites with information for microsatellies.Among these founders, 14 of them missed all microsatel-lite genotype information and 23 of them missed all SNPgenotype information. They had no contribution in themultiple regression analysis. Therefore, the distributionsof the founders' sex-specific recombination counts plottedin Figure 1 did not include these founders. We then had166 founders (106 females and 60 males) that wereWhites with information for SNPs and 185 founders (120females and 65 males) that were Whites with informationfor microsatellies. The scatter plots of the inferred recom-bination counts using SNPs and microsatellites for Whitesonly showed a higher correlation for males than forfemale. The recombination counts were much higher forfemales than for males, a well known biological fact [2,4].We also noted that the recombination counts were higherusing SNPs than those using microsatellites, which maybe due to the fact that the SNPs were more dense than themicrosatellites, allowing for the capture of recombination
Page 2 of 5(page number not for citation purposes)

BMC Genetics 2005, 6:S51
Page 3 of 5(page number not for citation purposes)
Distribution of the gender-specific recombination countsFigure 1Distribution of the gender-specific recombination counts. Results shown are for Whites only when erroneous geno-types are excluded and whenfounders with all genotype information missing are excluded as well. MS, microsatellite.
0 20 40 60 80 100 120
010
2030
40White only, fem ale
Recombination counts for SNP
Rec
ombi
natio
n co
unts
for
MS
outlier
cor (w ith outliers) = 0.312cor (no outliers) = 0.307
0 20 40 60 80 100 120
010
2030
40
White only, m ale
Recombination counts for SNP
Rec
ombi
natio
n co
unts
for
MS
cor = 0.487
SNP (fem ale , n= 106 ) White only
SNP crossover counts
Fre
quen
cy
20 40 60 80 100
05
1015
2025
30 f emale mean SNP counts = 35.83female median SNP counts = 35.1
female mean SNP counts no outlier = 35.17female median SNP counts no outlier = 35
SNP (m ale , n= 60 ) White only
SNP crossover counts
Fre
quen
cy
12 14 16 18 20 22 24
02
46
810 male mean SNP counts = 19.57
male median SNP counts = 19.6
M S (fem ale , n= 120 ) White only
MS crossover counts
Fre
quen
cy
20 25 30 35
05
1015 f emale mean MS counts = 25.2
female median MS counts = 25.38
MS (m ale , n= 65 ) White only
MS crossover counts
Fre
quen
cy
14 16 18 20 22
05
1015 male mean MS counts = 17.06
male median MS counts = 17

BMC Genetics 2005, 6:S51
events missed by the microsatellites. The mean andmedian genome-wide gender-specific recombinationcounts are summarized in Table 1. From the scatter plotfor the females, we noted that there were two femalefounders who had very high inferred recombinationcounts using the SNPs, 105.4 and 77.8, respectively. Inour analysis, we removed the female founder with theaverage recombination count of 105.4. The above analysiswas conducted after removing the possible erroneous gen-otypes. There were 1,295 microsatellite genotypes thatwere likely to be erroneous and were set missing with theMERLIN's error checking algorithm, making the estimatedgenotyping error rate for the microsatellite to be 0.367%.Among the 1,614 individuals and the 315 microsatellites,there were a total of 353,015 genotypes. Similarly, therewere 27,338 SNP genotypes that were likely to be errone-ous and were set missing with the MERLIN's error check-ing algorithm. This led to the estimated genotyping errorrate for the SNPs to be 0.204% from among the 1,614individuals and the 10,081 SNPs genotyped. There were atotal of 13,395,832 genotypes examined.
We noted that our inferred female and male genome-widerecombination counts were slightly lower than that fromprevious studies [4]. One reason may be that the 10,081SNPs did not cover the entire 22 autosomes since the
updated SNP data from Affymetrix were not included inthe analysis. Another possible reason was that some por-tion of the corrected genotypes was excluded as erroneousgenotypes from the genotyping error detection algorithm.
Markers associated with recombination countsMultiple linear regressions with adjustments for age andgender generated p-values for each marker, which werenot adjusted for multiple comparisons. The correspond-ing q-values based on the pFDR were calculated using thesoftware QVALUE. We applied the 0.05 q-value cut-off,which gave us 8 regions/13 SNPs that showed some evi-dence of association with recombination counts. Thepositions of those regions together with the raw p-valuesand q-values were summarized in Table 2. The 0.05 q-value cut-off suggested that 1 out of these 13 SNPs maynot be associated with recombination counts. For micros-atellites, no region was found to be significant after adjust-ing for multiple comparisons using pFDR.
ConclusionIn summary, we have identified several candidate SNPslikely associated with recombination events, and furtherstudies on these genes may help us gain valuable knowl-edge on recombination, better understand LD patterns,and lead to more efficient methods to map disease genes.
Table 1: Mean and median genome-wide gender-specific recombination counts using SNPs and microsatellites.
SNP Microsatellite
Mean (SD) Median Mean (SD) Median
Female + outlier 35.83 (9.35) 35.1 25.20 (3.74) 25.38- outlier 35.17 (6.42) 35.0
Male 19.57 (2.34) 19.6 17.06 (2.23) 17.0
Results shown are after removing erroneous genotypes and removing founders that have all genotype information missing for Whites only.
Table 2: Significant results (q-value < 0.05) for genome-wide association analysis for recombination rates using SNPs.
Chr Position (cM) (Marker) Unadjusted p-value q-value
1q 129.761 tsc0831812 3.99 × 10⁻⁵ 0.032874173.005 tsc1229896 3.64 × 10⁻⁶ 0.005141176.25a tsc1687896 3.74 × 10⁻⁵ 0.032874
2q 136.452a tsc0333128 1.01 × 10⁻⁵ 0.012482167.814 tsc0045403 2.00 × 10⁻⁸ 0.000198167.817 tsc1108827 1.21 × 10⁻⁶ 0.001994
3q 70.968 tsc0753329 4.95 × 10⁻⁵ 0.0376624q 94.916 tsc0056600 8.00 × 10⁻⁸ 0.0002648q 103.504 tsc1305199 6.00 × 10⁻⁸ 0.00026410q 45.654 tsc0615240 2.60 × 10⁻⁷ 0.000514
74.381 tsc0046577 1.45 × 10⁻⁵ 0.01569113q 50.514 tsc0616973 2.40 × 10⁻⁷ 0.00051414q 85.42a tsc1112831 1.59 × 10⁻⁵ 0.015691
No significant results are found with microsatellites using the pFDR 0.05 cutoffaindicates that the marker identified was from the markers that had the same map position
Page 4 of 5(page number not for citation purposes)

BMC Genetics 2005, 6:S51
Publish with BioMed Central and every scientist can read your work free of charge
"BioMed Central will be the most significant development for disseminating the results of biomedical research in our lifetime."
Sir Paul Nurse, Cancer Research UK
Your research papers will be:
available free of charge to the entire biomedical community
peer reviewed and published immediately upon acceptance
cited in PubMed and archived on PubMed Central
yours — you keep the copyright
Submit your manuscript here:http://www.biomedcentral.com/info/publishing_adv.asp
BioMedcentral
AbbreviationsCOGA: Collaborative Study on the Genetics on Alcohol-ism
GAW14: Genetic Analysis Workshop 14
LD: Linkage disequilibrium
pFDR: Positive false discovery rate
SNP: Single-nucleotide polymorphism
Authors' contributionsSH participated in the design of the study, performed theanalysis, and drafted the manuscript. SW helped to obtainrecombination counts and preparation of the manuscript.SW, NL, LC, and CO participated in the design and thediscussion of the study. HZ conceived the study andhelped to draft the manuscript. All authors read andapproved the final manuscript.
AcknowledgementsSupported in part by NIH grant R01 GM59507 and NSF grant DMS 0241160.
References1. Pritchard JK, Przeworski M: Linkage disequilibrium in humans:
models and data. Am J Hum Genet 2001, 69:1-14.2. Kong A, Gudbjartsson DF, Sainz J, Jonsdottir GM, Gudjonsson SA,
Richardsson B, Sigurdardottir S, Barnard J, Hallbeck B, Masson G, Shl-ien A, Palsson ST, Frigge ML, Thorgeirsson TE, Gulcher JR, StefanssonK: A high-resolution recombination map of the humangenome. Nat Genet 2002, 31:241-247.
3. Yu A, Zhao C, Fan Y, Jang W, Mungall AJ, Deloukas P, Olsen A, Dog-gett NA, Ghebranious N, Broman KW, Weber JL: Comparison ofhuman genetic and sequence-based physical maps. Nature2001, 409:951-953.
4. Broman KW, Murray JC, Sheffield VC, White RL, Weber JL: Com-prehensive human genetic maps: individual and sex-specificvariation in recombination. Am J Hum Genet 1998, 63:861-869.
5. Yu J, Lazzeroni L, Qin J, Huang MM, Navidi W, Erlich H, Arnheim N:Individual variation in recombination among human males.Am J Hum Genet 1996, 59:1186-1192.
6. Hudson RR: Two-locus sampling distributions and their appli-cation. Genetics 2001, 159:1805-1817.
7. McVean GA, Awasalla P, Fearnhead P: A coalescent-basedmethod for detecting and estimating recombination fromgene sequences. Genetics 2002, 160:1231-1241.
8. Stumpf MP, McVean GA: Estimating recombination rates frompopulation-genetic data. Nat Rev Genet 2003, 4:959-968.
9. Ji YF, Stelly DM, Donato MD, Goodman MM, Williams CG: A candi-date recombination modifier gene for Zea mays L. Genetics1999, 151:821-830.
10. Abecasis G, Cherny SS, Cookson WO, Cardon LR: Merlin-rapidanalysis of dense genetic maps using sparse gene flow trees.Nat Genet 2002, 30:97-101 [http://www.sph.umich.edu/csg/abecasis/Merlin/].
11. John S, Shephard N, Liu G, Zeggini E, Cao M, Chen W, Vasavda N,Mills T, Barton A, Hinks A, Eyre S, Jones KW, Ollier W, Silman A, Gib-son N, Worthington J, Kennedy GC: Whole-genome scan, in acomplex disease, using 11,245 single-nucleotide polymor-phisms: comparison with microsatellies. Am J Hum Genet 2004,75:54-64.
12. Story JD, Tibshirani R: Statistical significance for genomewidestudies. Proc Natl Acad Sci U S A 2003, 100:9440-9445 [http://faculty.washington.edu/~jstorey/qvalue/].
Page 5 of 5(page number not for citation purposes)