Embed Size (px)
Citation preview

WHO/BS/2012.2190
ENGLISH ONLY
EXPERT COMMITTEE ON BIOLOGICAL STANDARDIZATION
Geneva, 15 to 19 October 2012
Report of a WHO collaborative study to assess the suitability of a candidate
replacement International Standard for antibody to pandemic H1N1
influenza virus
Diane Major
1, Alan Heath
2 and John Wood
1
Division of Virology1 and Biostatistics
2
National Institute for Biological Standards and Control, Blanche Lane, South Mimms,
Potters Bar, Herts EN6 3QG, UK
Study coordinator: Diane Major1
Phone: +44 (0)1707 641550, Fax: +44 (0)1707 641, Email:[email protected]
This document has been prepared for the purpose of inviting comments and suggestions on
the proposals contained therein, which will then be considered by the Expert Committee on
Biological Standardization (ECBS). Comments MUST be received by 01 October 2012 and
should be addressed to the World Health Organization, 1211 Geneva 27, Switzerland,
attention: Quality Safety and Standards (QSS). Comments may also be submitted
electronically to the Responsible Officer: Dr Tiequn Zhou at email: [email protected].
© World Health Organization 2012 All rights reserved. Publications of the World Health Organization are available on the WHO web site (www.who.int) or can be
purchased from WHO Press, World Health Organization, 20 Avenue Appia, 1211 Geneva 27, Switzerland (tel.: +41 22 791 3264;
fax: +41 22 791 4857; e-mail: [email protected]).
Requests for permission to reproduce or translate WHO publications – whether for sale or for noncommercial distribution – should
be addressed to WHO Press through the WHO web site (http://www.who.int/about/licensing/copyright_form/en/index.html).
The designations employed and the presentation of the material in this publication do not imply the expression of any opinion
whatsoever on the part of the World Health Organization concerning the legal status of any country, territory, city or area or of its
authorities, or concerning the delimitation of its frontiers or boundaries. Dotted lines on maps represent approximate border lines for
which there may not yet be full agreement.
The mention of specific companies or of certain manufacturers’ products does not imply that they are endorsed or recommended by
the World Health Organization in preference to others of a similar nature that are not mentioned. Errors and omissions excepted, the
names of proprietary products are distinguished by initial capital letters.
All reasonable precautions have been taken by the World Health Organization to verify the information contained in this publication.
However, the published material is being distributed without warranty of any kind, either expressed or implied. The responsibility
for the interpretation and use of the material lies with the reader. In no event shall the World Health Organization be liable for
damages arising from its use. The named authors alone are responsible for the views expressed in this publication.
WHO/BS/2012.2190
Page 2
Abstract Haemagglutination-inhibition (HI) and virus neutralisation (VN) serology assays are being used
to assess immunogenicity of pandemic H1N1 (H1N1pdm) vaccines in clinical trial throughout
the world, yet the assays are poorly standardised and previous studies have shown that results of
such assays to be variable between different laboratories. A freeze dried International Standard
(IS) for H1N1pdm antibody was established by WHO in 2010 and this has been distributed to
numerous laboratories conducting H1N1pdm serology. Due to the urgent need to make this
material available it was only possible to prepare a limited number of vials and stocks are now
completely depleted. A freeze dried candidate replacement IS for H1N1pdm antibody was
prepared from pooled plasma of subjects who had received a split pandemic H1N1 vaccine
prepared from the reassortant virus NYMC X-179A (derived from A/California/2009 virus).
Eighteen laboratories from eleven countries tested the candidate IS 10/202 and a panel of human
plasmas from recipients of A/California/7/2009 pandemic vaccine; eighteen using HI assays and
sixteen also using VN assays. A plasma negative for antibody to H1N1pdm was also included in
the panel. In most laboratories the tests were performed on at least three occasions using the
reassortant viruses NYMC X-179A (seventeen laboratories) and/or NYMC X-181(twelve
laboratories). Tests were also performed with A/California/2009 virus (two laboratories),
A/Christchurch/16/2010 virus (one laboratory) and NIBRG-121 virus (one laboratory). For tests
of antibody to NYMC X-179A and NYMC X-181, the % geometric coefficients of variation
(%GCV) for 10/202 between laboratories were 143% and 137% respectively for HI and 441%
and 372% respectively for VN. For tests of all sera, the % GCV ranged from 108-157% for HI
and 189-354% for VN, but for the titres relative to 10/202 the median % GCV was much
reduced (HI 36-144%; VN 29-178%).
H1N1pdm viruses continue to circulate and to date there has been very little antigenic drift
observed in the isolates [1]. Whilst there is no requirement to conduct clinical trials for the
H1N1pdm component of currently licensed influenza vaccines the H3N2 and B components of
seasonal influenza vaccines have been updated and therefore vaccines containing H1N1pdm
continue to be evaluated in clinical trials. Consequently, there is a continuing need to standardise
serology assays for antibody to H1N1pdm virus.
The results demonstrate that the candidate IS 10/202 will be of use in standardisation of HI and
VN assays of antibody to H1N1pdm virus vaccines. It was also shown that the relationship
between HI and VN titres for the 1st IS 09/194 and the candidate IS 10/202 are different.
Consequently it is proposed that 10/202 be established as the second IS for antibody to
A/California/2009 (H1N1) virus with an assigned potency for use in HI assay of 1200
International Units per ampoule ie 2400 IU/ml when reconstituted as directed with 0.5 ml dH2O
and that the consensus VN titre is stated in the Instructions for Use for 10/202.

WHO/BS/2012.2190
Page 3
Introduction
Recent WHO collaborative studies to evaluate influenza H3N2, H5N1 and H1N1pdm
serological tests have found a high degree of variability between VN and HI results from
different laboratories. However the use of a standard serum or plasma significantly reduced inter
laboratory variability [ 2, 3, 4]. Difficulties in comparing VN and HI titres include the lack of
standard protocols, differences in sensitivity and specificity of reagents and assay variability. An
International Standard (IS 09/194) for H1N1pdm antibody was established in 2010 and a recent
study in which panels of sera from several clinical trials were retested in a single laboratory
(separate laboratories for HI and VN) has demonstrated that use of the standard significantly
improved agreement in assay results between laboratories. [5]
Stocks of the first IS for antibody to H1N1pdm virus (09/194) are completely depleted and a
proposal by NIBSC to establish a replacement was approved by ECBS in October 2010.
The aims of the collaborative study are:
To evaluate the suitability of a freeze-dried plasma pool to serve as a replacement for
09/194, the first IS for antibody to H1N1pdm virus with an assigned potency in
International Units per ampoule for use in HI and VN assays. There is no international
conventional reference measurement procedure and this measurement is not traceable to
International System of Units (SI) of quantity.
To assess the candidate IS in terms of reactivity in the conventional HI and VN assays
used to detect H1N1pdm antibody.
To assess commutability ie to establish the extent to which the IS is suitable to serve as a
standard for the variety of different samples and viruses being assayed.
Materials
Candidate International Standard code 10/202 This is a batch of ampoules containing a freeze-dried pool of plasma obtained from:
6 human subjects who had received Shanghai Institute of Biological Products
inactivated split influenza vaccine containing the H1N1pdm strain NYMC X-179A
(A/California/7/2009).
Subjects gave informed consent for the use of their plasma which was approved by the ethical
committee of NIBSC.
The donations were tested and found negative for HBsAg, antibodies to HIV-1, 2 and HCV RNA
by nucleic acid amplification tests. After being tested and found positive for antibody to NYMC
X-179A virus by HI and VN, the donations were pooled (volume 900ml) and diluted in human
plasma tested and found negative for HBsAg, antibodies to HIV-1, 2 and HCV RNA and
negative for antibody against H1N1pdm virus (volume 4100 ml). The pooled plasma was filled
in ampoules and freeze-fried at NIBSC on 4 November 2010 following documented procedures.
At the end of processing, the ampoules were back-filled with Nitrogen (from liquid nitrogen
99.999% purity) and sealed by heat fusion of the glass. The integrity of the sealing of the
ampoules was checked visually. This was a 0.5g fill weight with a mean filled weight of 0.5153g
(contents of 396 ampoules weighed) and mean dry weight of 0.0406g (contents of 6 ampoules

WHO/BS/2012.2190
Page 4
weighed). The coefficient of variation (CV) for filled weights was 1.33%. 9917 ampoules were
filled and 9655 were available for issue. Residual moisture determined by colorimetric Karl
Fisher titration on 12 samples was 0.4347% with a CV of 18.92%.Oxygen headspace
determined using a Lighthouse laser head space analyser measured in 12 ampoules was 0.18%
with a CV of 48.25%. Bioburden of the contents of four samples was determined by total viable
count. This was 3cfu for one vial, the remaining three were negative. The ampoules were stored
at NIBSC at -20oC. Currently there are 9305 ampoules of 10/202 available for use. A summary
of the production of 10/202 and key parameters tested is given in appendix 3.
Additional coded study samples In order to demonstrate that the candidate IS is suitable for use in a variety of situations; the
following antiserum preparations were included as coded samples along with the first IS:
Sample code Description
A Freeze dried Human plasma negative for antibody to H1N1pdm
E Post vaccination plasma (H1N1pdm) - low titre
B Post vaccination plasma (H1N1pdm) - medium titre
C Post vaccination plasma (H1N1pdm) - high titre
F Freeze dried pool of human plasma candidate replacement
(10/202) for 09/194
D Duplicate of F
Viruses supplied If needed, participants were supplied with the following H1N1pdm viruses:
NYMC X-179A (X-179A) reassortant derived from A/California/7/2009 (used for
pandemic H1N1 vaccine production)
NYMC X-181 (X-181) reassortant derived from A/California/7/2009 (used for
pandemic H1N1 vaccine production)
Participants were expected to grow their own stocks of virus in readiness for serology tests
Design of study
Participants were requested to store sera at -20oC and viruses at -70
oC until use. Participants
were asked to reconstitute freeze dried samples with 0.5 ml distilled water and then to test
09/194 and the coded study samples for antibody to the two H1N1pdm viruses concurrently, on
three separate occasions. It was recommended that wherever possible, new ampoules of the
standards and samples were used for each assay. An excel spreadsheet was supplied for reporting
of the raw data from each test.
Statistical methods The results for the HI and VN tests were provided by participants as absolute titres (reciprocal
end-point dilutions). Within each laboratory, replicate titres were combined as geometric means.
Where a titre was negative, or below the starting dilution, a value of half the starting dilution was
assigned (e.g. a titre of <10 was taken as 5) to allow calculations of geometric means. Similarly,
for values reported as greater than a final dilution, a value of twice the final dilution was
assigned (e.g. >1280 was taken as 2560). Overall mean titres were calculated as the geometric
mean of the individual laboratory means. Variation between laboratories was expressed as the
percentage geometric coefficient of variation (%GCV).

WHO/BS/2012.2190
Page 5
To assess within laboratory reproducibility, a comparison was made of replicate tests in each
laboratory and calculating the percentage of tests giving greater than 2-fold or greater than 4-fold
variation in titres for all study samples. Each laboratory was requested to test the 7 samples
using the two viruses, giving 14 sets of replicate titres. The calculations were also performed for
the human plasmas E, B, C, F, and D and 09/194 alone.
To assess the effect of using a common standard, titres were expressed relative to the first IS
09/194 and the candidate replacement standard 10/202 (sample F), by taking the ratio of the
mean titre for a sample to the mean titre for 09/194 or 10/202 obtained by a laboratory, and
multiplying by an “assigned” value for 09/194 or 10/202.
The distribution of geometric mean titres between laboratories for each sample is also displayed
in histogram form, where each box represents the mean obtained by an individual laboratory, and
is labelled with the laboratory code number. Where a laboratory obtained a negative result, the
results are plotted as “-ve” (ie negative) in a position equivalent to a titre of 5.
Participants Although thirty two participants were invited, only eighteen participants from eleven countries
took part in the study. Participants were selected for their previous experience of influenza
serology, for their public health importance and for geographical distribution. The participants
are listed in Appendix 1 and were randomly assigned a laboratory code number, not necessarily
in the order listed.
Assay methods As there are no established standard protocols for HI or VN assays, participants were requested
to use their in-house methods. A checklist was supplied to each participant to indicate the key
parameters used in their methods. One of the benefits of an IS would be to reduce errors
associated with protocol variation.
VN protocols Thirteen of eighteen (72%) laboratories returning VN data also supplied checklists (table 1).
Most VN protocols could be grouped under a single methodology, with three different protocols
being used by a minority of laboratories.
(i) Cell suspension method and short incubation time of assay to endpoint (<26 hr): used
by labs 1, 2, 3, 5, 6, 7, 8, 10, 14, 15 and 17
(ii) Preformed cell monolayer and long incubation time of assay to endpoint (≥3 days): used
by labs 1, 11 and 16
(iii) Preformed cell monolayer and short incubation time of assay to endpoint(<26 hours):
used by lab 13
(iv) Plaque reduction assay: used by lab 18
Another variable was the quantity of input virus, which could affect the VN titre. Labs 1, 2, 7,
10, 11, 14, 15 and 17 used 100 TCID50/well whereas labs 5, 6 and 8 used 200 TCID50/well. Lab
3 calculated input virus based on pfu/ml and lab13 based on ffu/ml. Labs 3 and 10 incubated
virus/serum mixtures at room temperature whereas all the other laboratories which supplied
checklists performed this step at 35-37oC.

WHO/BS/2012.2190
Page 6
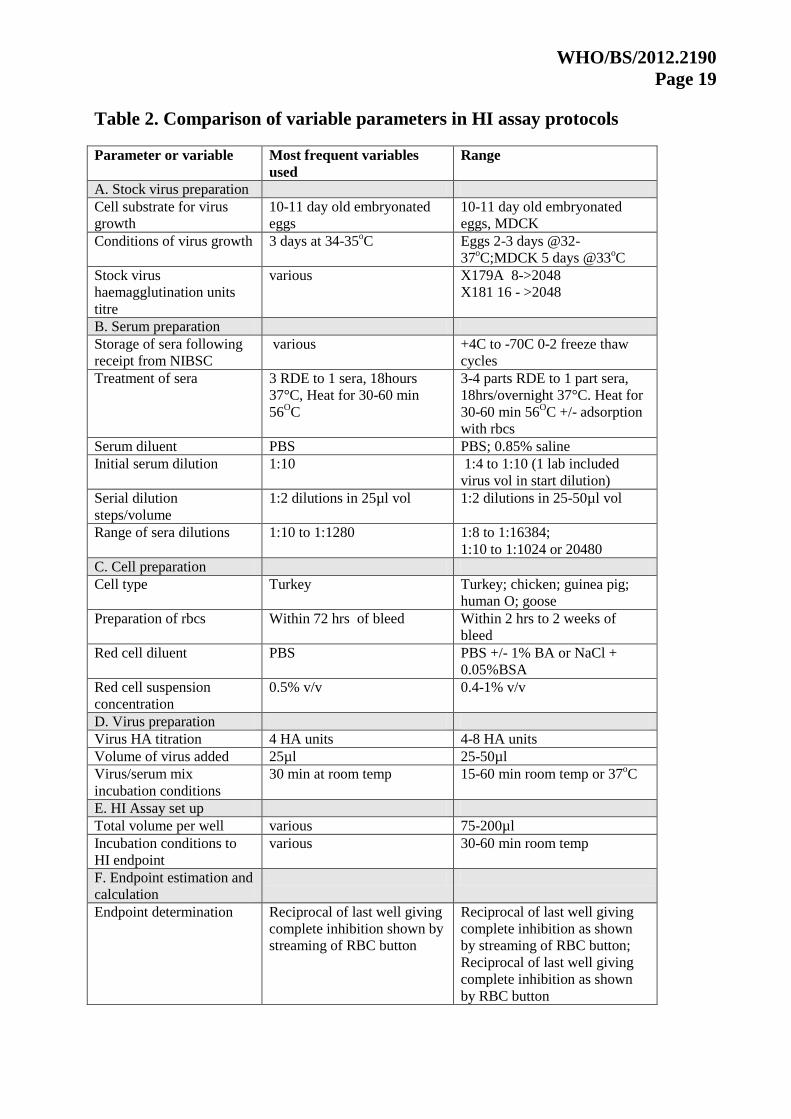
HI protocols Thirteen of eighteen (72%) returning HI data also supplied checklists (table 2). HI protocols
were generally similar. The variable parameters considered to be critical are:
(i) Red cell type: turkey rbc (used by labs 3, 6, 7, 8, 10, 11, 13, 14 and 17), chicken rbc
(used by labs 1 and 2), guinea pig (used by lab 5), human O (used by lab 15) or goose
(used by lab 16)
(ii) Rbc concentration ranged from 0.4% (lab 1) to 1% (lab5)
(iii) Virus added was either 4 Agglutinating Doses (Ads) (labs 2, 3, 5, 7, 8, 11, 13, 14, 15
and 17) or 8Ads (labs 1, 6, and 10)
(iv) Adsorption of sera with rbcs to remove nonspecific agglutinins (labs 5 and 14)
Lab 14 incubated serum/virus mixtures at 37oC. All other laboratories which supplied checklists
performed this step at room temperature.
Results and data analysis
Data Received
Study samples were sent to twenty one laboratories. Data were received from eighteen
laboratories. Two laboratories only returned data from HI assays, while the other sixteen
performed HI and VN assays. For HI assay seventeen laboratories that returned data used the
X179A virus. In addition X-181 was used by twelve of the laboratories and A/California/7/2009
(A/California), A/Christchurch/16/2010 (A/Chch) and NIBRG-121 by one laboratory each. One
laboratory returned data for A/California only. Nine laboratories provided data for VN assays
using X179A and X181. One of these also returned VN data using NIBRG-121. The remaining
laboratories returned data for one virus only, X-179 (laboratories 6, 7, 13 and 14), X-181
(laboratory 11), A/California (laboratory 8) and A/Chch (laboratory 5). Laboratory 1 provided
two sets of VN assay results using two different methodologies.
In previous studies the definition of titre appeared to differ, depending on whether addition of
virus was considered to be part of the dilution. In this study titres were reported as those prior to
addition of virus or cell suspension by all laboratories that returned assay check lists except one.
This laboratory included the virus volume in the expression of initial serum dilution for both HI
and VN assays. Laboratory 16 reported that the ELISA based VN assay would not work with
X179A and reported data for a CPE based assay as an alternative.
One laboratory returned data for single radial haemolysis assay (SRH) in addition to HI and VN
data. The SRH data for the individual samples reflected the overall pattern of antibody titres
observed for HI and VN assays and reproducibility of the assay within the laboratory was very
good. However the SRH data was not included in the analyses as there was only a single data set.
Assay reproducibility – replicate assays
The within laboratory reproducibility was assessed by comparing the replicate titres within each
laboratory for each sample and virus across replicate tests. The negative control sample A was
not included. The percentages with a range greater than 2-fold, and greater than 4-fold, are
shown in table 3. No analysis of reproducibility could be performed for Laboratory 16, which
only returned a single result for each sample.

WHO/BS/2012.2190
Page 7
The reproducibility of both HI and VN assays is good, with the majority of laboratories having
no replicate tests varying by more than 2-fold. Laboratory 2 had poorer reproducibility with 50%
of replicate VN tests varying by more than 2-fold. Their HI tests were more consistent, although
for the current standard 09/194 the HI for the 3rd
replicate test was reported as 8-16 compared to
128 for the previous 2 tests (with both X179A and X181). The other samples in the 3rd
test gave
HI titres that were consistent across tests. Laboratory 17 also had some variability with their VN
tests, with 33% giving titres that differed by more than 2-fold, although none were greater than
4-fold.
Laboratory 15 performed repeat series of tests using isolates from different ampoules of virus
(X179A), which gave some differences in titres, particularly for the VN tests. The comparison
between replicate titres was performed separately for each of the repeat sets of tests, and so these
differences in titres resulting from different isolates are not reflected in table 3. If comparisons
were made across the tests with the different isolates, 42% of VN tests would have replicates
greater than 2-fold, and 17% greater than 4-fold.
Assay reproducibility – duplicate samples Samples D and F were duplicates of the candidate replacement IS (10/202). When the laboratory
GMTs for samples D and F were compared, the HI GMTs were within a 2-fold range for all
laboratories. The VN GMTs were within 2-fold for all laboratories except laboratory 2, which
had GMTs of 1345 and 3200 for samples D and F respectively, for both viruses X179A and
X181. Laboratory 16 was not included in the analysis, because of a potential mixing of sample
results, (reported under absolute titres: their results for sample D are all negative).
Comparing titres of samples D and F within individual assays, none of the HI tests had titres that
differed by more than 2-fold. For the VN tests, only laboratory 2 had titres that differed by more
than 2-fold. Laboratory 2 had 4 out of 8 repeat tests with a titre of 6400 for sample F and a titre
of 1600 for sample D. Apart from this, there was good reproducibility within assays for the
duplicate samples.
Absolute Titres Most laboratories obtained negative HI or VN titres for the negative sample A, with the
following exceptions:
Laboratory 1 obtained VN titres of 10 for 5 out of 12 replicate tests of sample A with their cpe
neutralisation assay (1A), but negative (<10) for all HI and all ELISA (1B) neutralisation assays.
Laboratory 2 obtained a titre of 20 for 1 out of 8 replicate tests with their VN assay, and titres of
10 were reported for the remaining replicates.
Laboratory 5 obtained a titre of 10 for 2 out of 8 replicate HI tests, but negative (<10) for all
other replicate HI tests and all VN tests.
Laboratory 16 reported titres of 20 or 40 for sample A in their HI and VN tests, but for sample
D, the candidate replacement IS, they reported negative (<10) or 10. It is possible that there was
a mix up of the samples either during the testing or the reporting of the results.
Laboratory 18 reported titres of 40 for 4 out of 6 replicate plaque reduction VN tests, using a
50% reduction threshold (18A), with the 2 other replicates giving negative results. Using a 100%

WHO/BS/2012.2190
Page 8
reduction threshold (18B), 5 out of 6 replicates gave negative results, and one replicate gave a
titre of 10. All HI tests were negative.
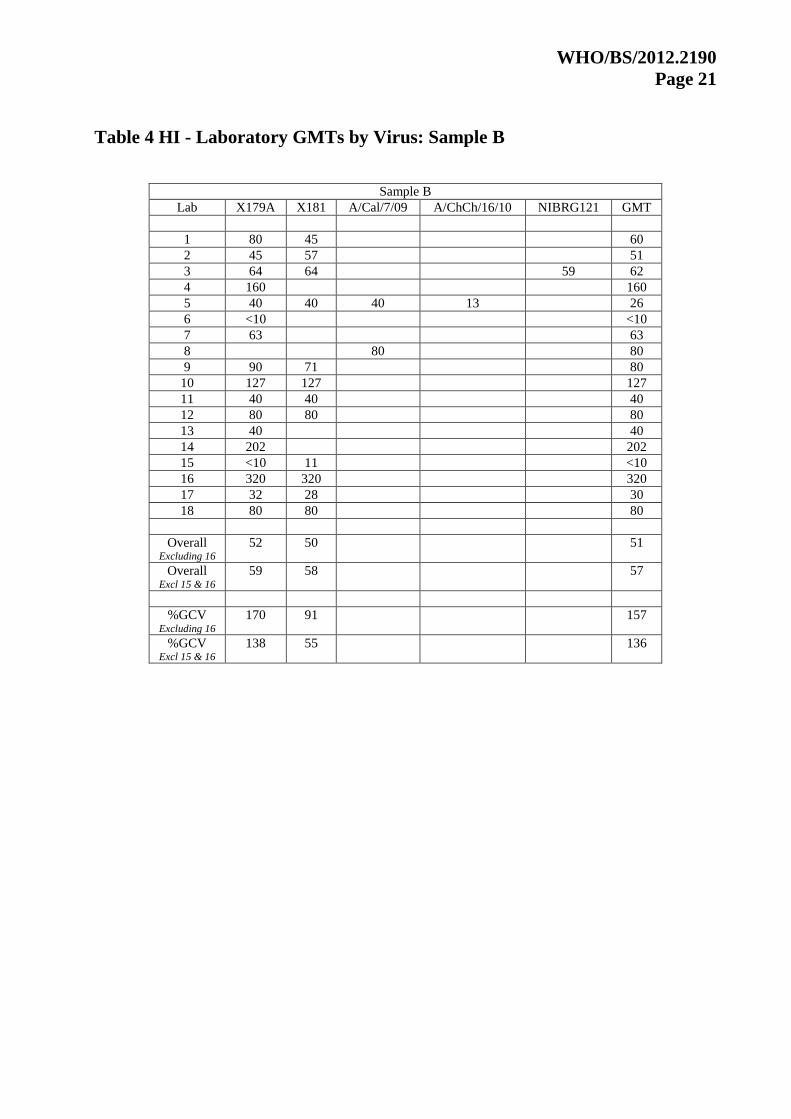
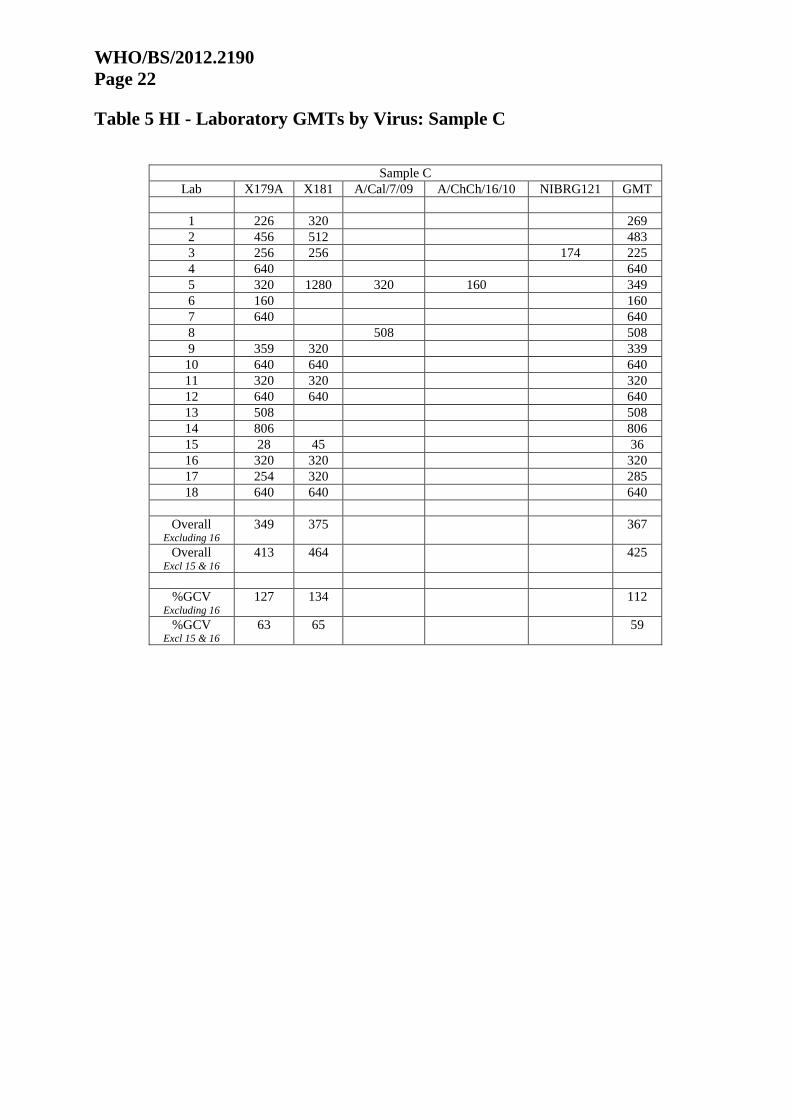
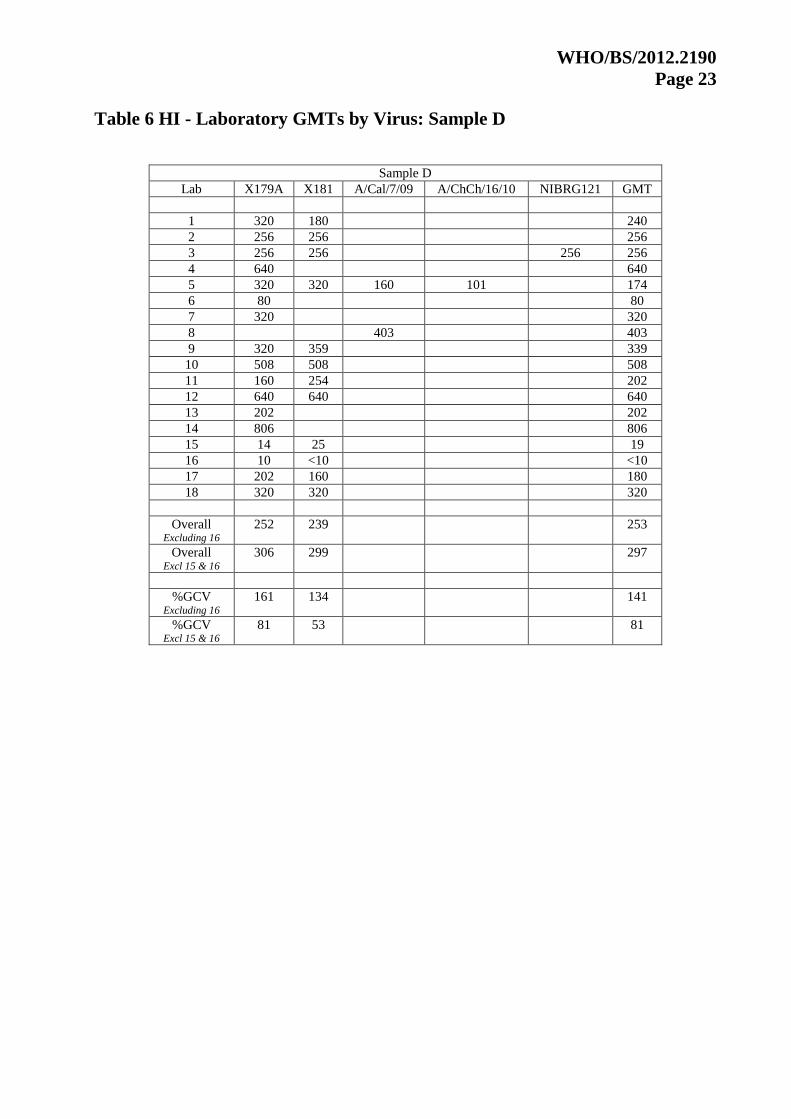
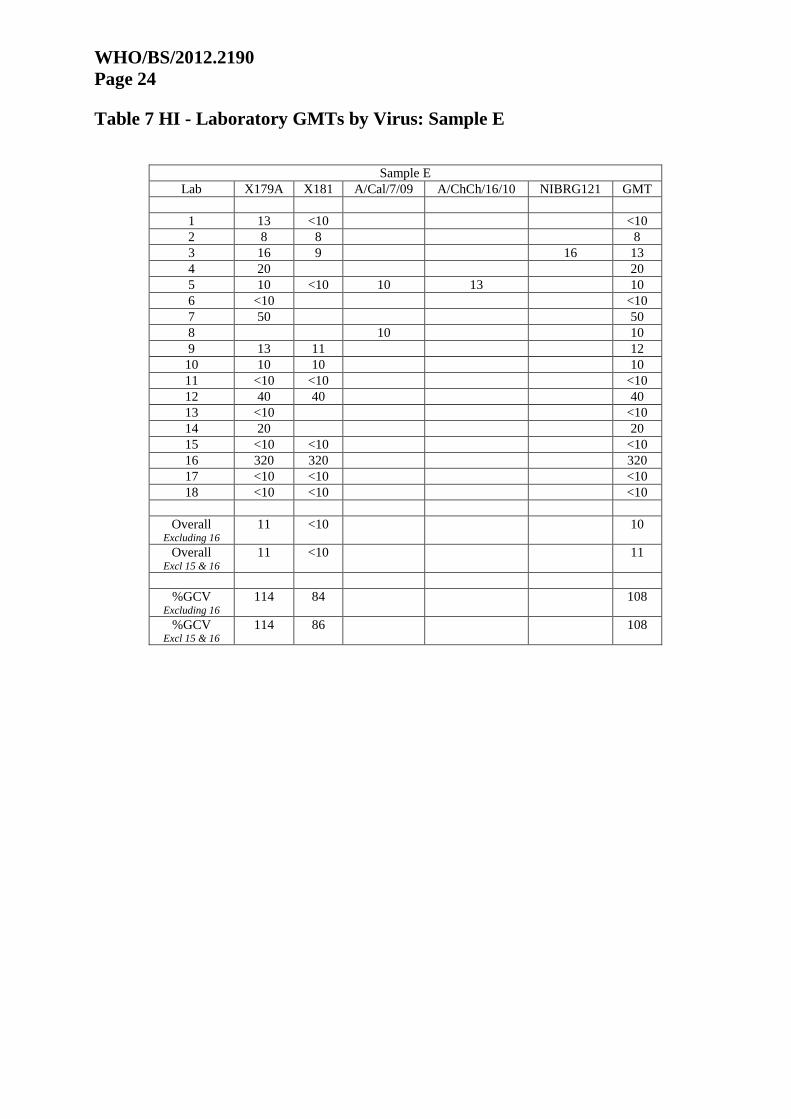
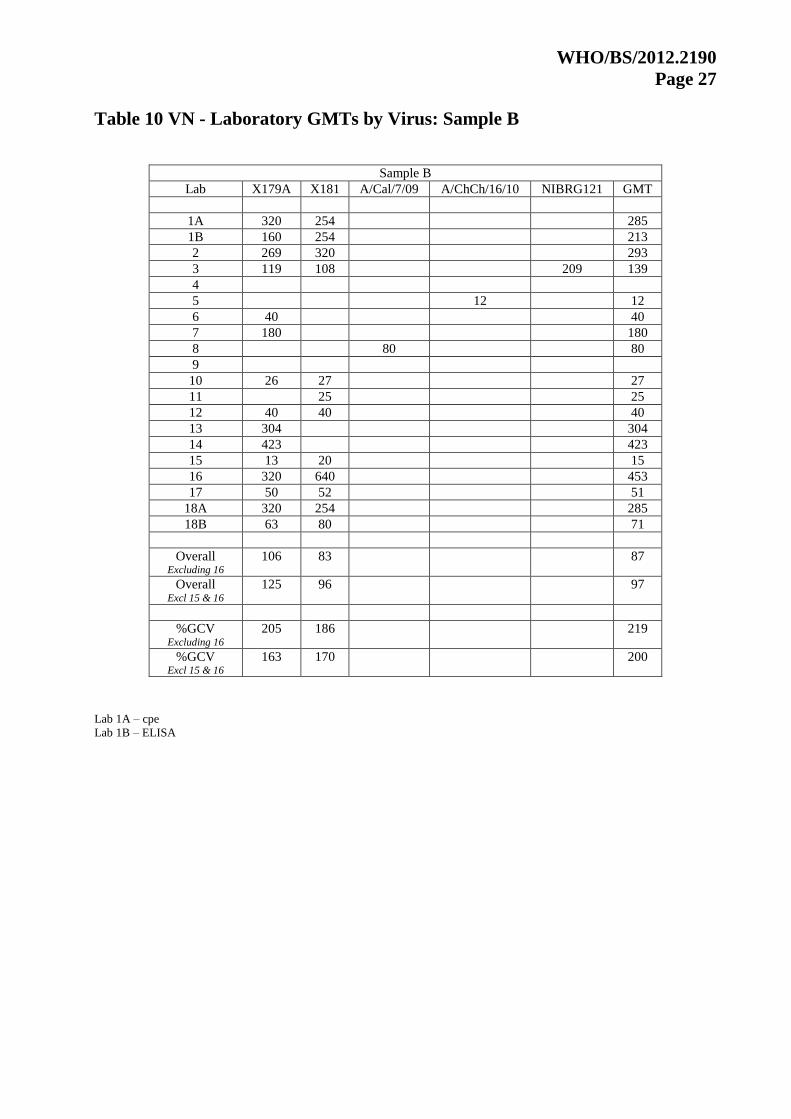
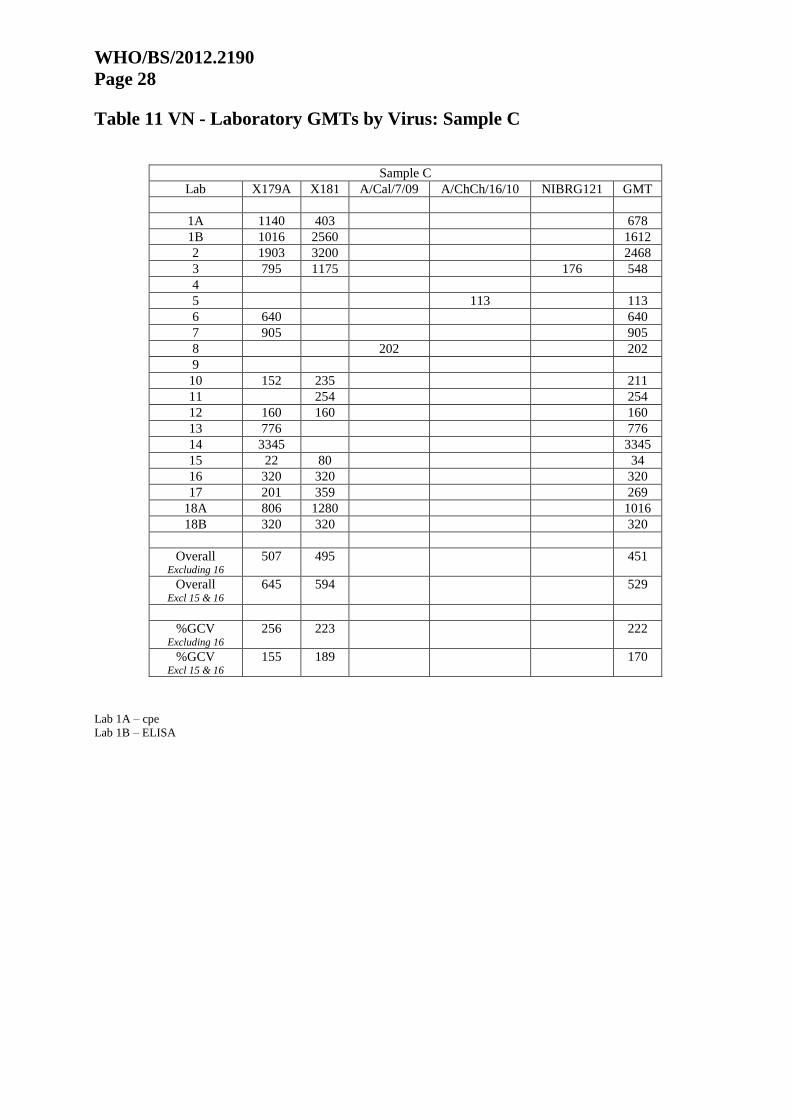
The laboratory GMTs for the study samples (excluding the negative control sample A) are
shown in tables 4-9 for the HI assays, and tables 10-15 for the VN assays. Results obtained with
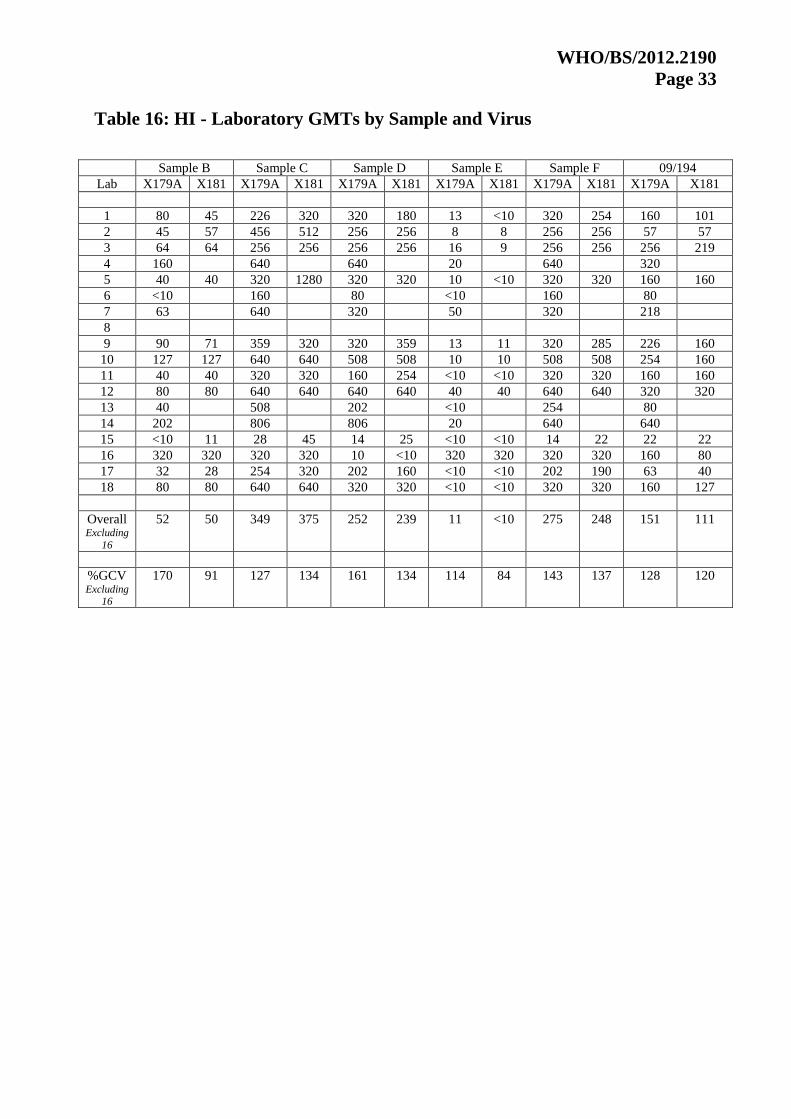
X179A and X181 viruses are shown separately in tables 16 (HI) and 17 (VN). For each
laboratory and sample, the overall GMT obtained from pooling results with all viruses is also
shown. The overall GMT (Geometric mean of the laboratory GMTs) and the between laboratory
percentage geometric coefficient of variation (%GCV) are also shown, excluding laboratory 16.
The results for laboratory 15 are generally lower than for other laboratories. The GMT and
%GCVs are also shown excluding laboratory 15, for comparison.
All laboratories obtained positive GMTs for samples C, D, F and 09/194 (with the exception of
laboratory 16, sample D, noted above). For the medium titre sample B, laboratories 6 and 15
obtained negative (<10) HI GMTs for virus X179A. Laboratory 6 did not use virus X181, and
laboratory 15 obtained a low positive HI GMT of 11. The VN tests gave positive titres for
sample B in all laboratories that performed them. For the low titre sample E, laboratories 6, 11,
13, 15, 17 and 18 obtained negative HI titres. Laboratories 1 and 5 also obtained negative HI
titres with X181, but low positives with X179A. Laboratories 10, 11, 15 and 18B obtained
negative VN titres, laboratory 1A a negative with X179A but positive with X181, and laboratory
17 a negative with X181 but a low positive with X179A.
The laboratory GMTs for the different samples are also shown in histogram form in figure 1.
Each box represents the GMT from an individual laboratory, and is labelled with the laboratory
code number. Results obtained with different viruses are shown separately, and colour coded.
The histograms illustrate that there was considerable variation between the GMTs from different
laboratories. There is no apparent consistent difference in laboratory GMTs between the different
viruses used. A paired comparison of results from laboratories that used both X179A and X181
showed no significant differences (p > 0.01) for any sample, for HI or VN tests.
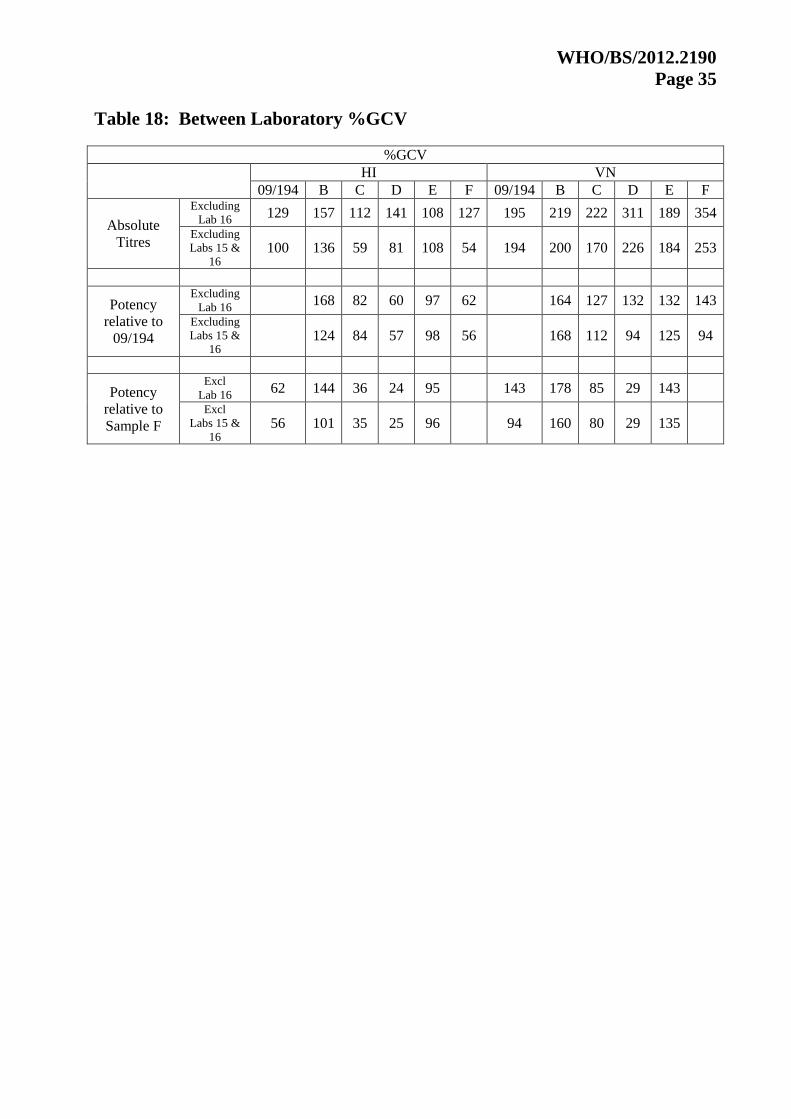
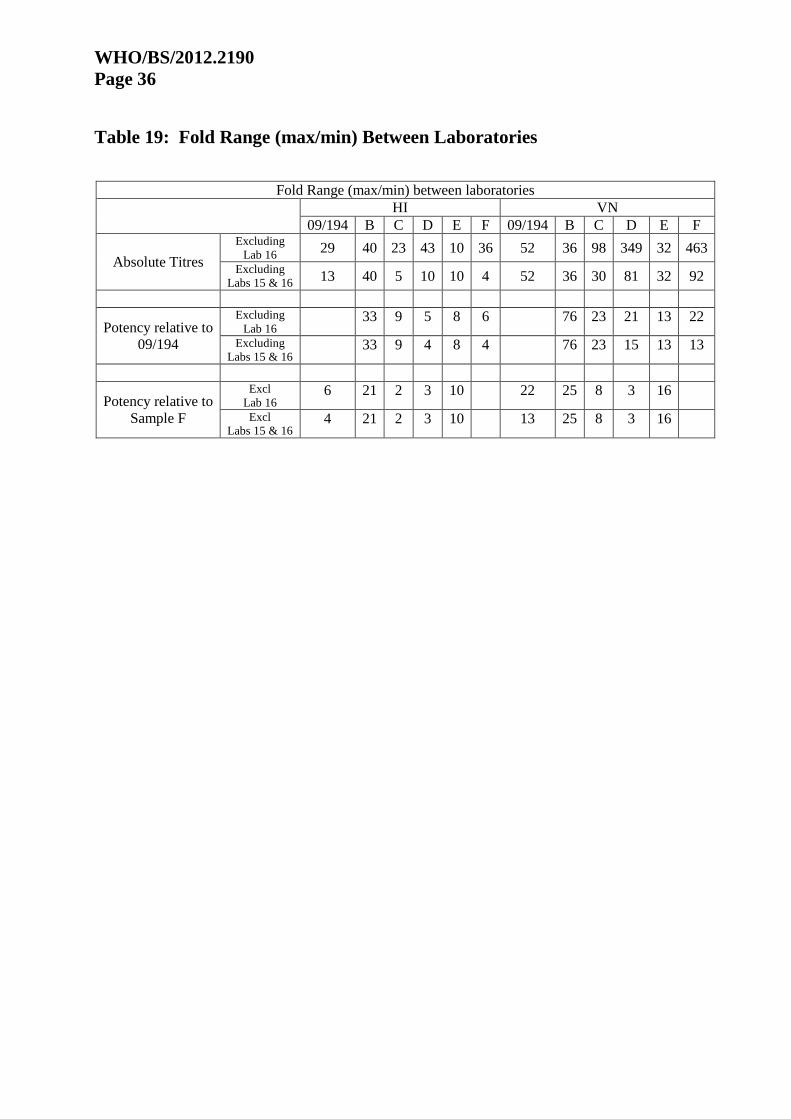
The variation between laboratories is also reflected in the high %GCVs (pooling results from all
viruses), summarised in table 18, and in the fold range (max/min) between labs for the different
samples, summarised in table 19. The variability is generally greater between the VN assays than
the HI assays. The range (max/min) for the HI GMTs is between 10-fold (sample E) and 43-fold
(sample D). For the VN assays, the range is between 32-fold (sample E) and 463-fold (sample
F). These figures would be reduced if the results from laboratory 15 were excluded.
The overall GMTs for the candidate standard (10/202, samples D and F), pooling results from all
viruses, were 263 for HI assays and 381 for VN assays (excluding lab 16). These figures rise to
311 for HI and 601 for VN if the results from laboratory 15 are also excluded.
The overall GMTs for the current IS 09/194, pooling results from all viruses, were 149 for HI
and 520 for VN (excluding lab 16). These figures rise to 167 for HI and 557 for VN if the results
from laboratory 15 are also excluded. The previous collaborative study to establish the 1st IS
obtained “consensus” titres of 183 (HI) and 516 (VN) for 09/194. There is therefore very good
agreement between the two studies, despite the large variation in results between individual
laboratories.
WHO/BS/2012.2190
Page 9
Use of 09/194 as a standard
Expression in IU The 1
st IS 09/194 was assigned a value of 650 International Units (IU) per ampoule, or 1300
IU/ml on reconstitution. The laboratory results for samples B – F were expressed in IU relative
to 09/194. To express the titre of a sample in IU, the ratio of the GMT obtained for the sample to
the GMT obtained for the concurrently tested IS is calculated, and multiplied by the assigned
value of 1300 IU/ml for the IS. For example, if an assay gives titres of 640 for sample X and 320
for the standard, then the titre of X relative to the standard is 2600 IU/ml ( = 1300 x 640/320), or
twice the assigned value of the IS.
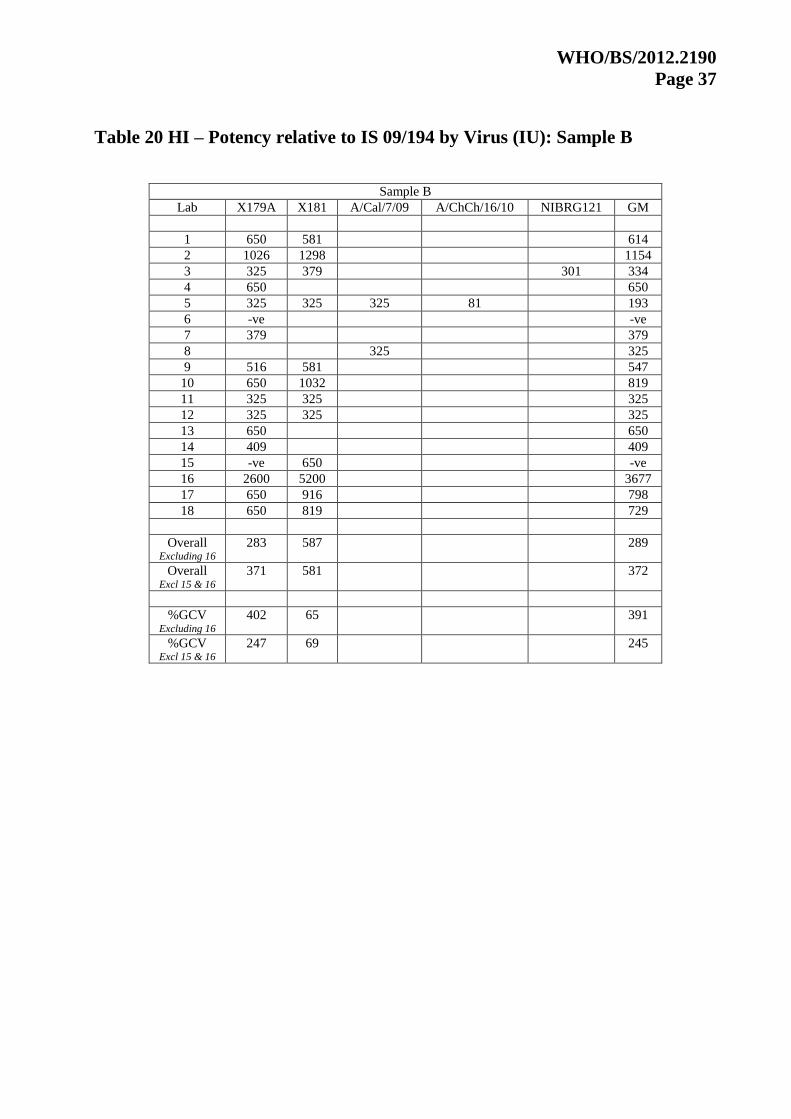
The potencies of the samples B to F are shown in tables 20-29, split by virus, and also the overall
values for each laboratory, pooling the data for all viruses. They are also shown in histogram
form in figure 1 with different viruses are shown separately, and colour coded. Although the
values on the histograms in figure 1 are in IU rather than titres, the same scale has been used,
allowing direct comparison of inert-laboratory variability between absolute titres and potencies
in IU. To achieve this, negative results are plotted as 5 IU. A negative result is defined as a
negative titre (<10 or <8) for the sample before any conversion to IU. A value of 5 IU has also
been used to calculate the overall geometric means shown in tables 4-15. As a result, where there
is a mixture of positive and negative results, as with samples B and E, the overall geometric
mean in IU may be unrealistically low. However, it is difficult to select a more appropriate value
in IU to represent a negative result, as there are positive results (for example, laboratory 5 VN
results for samples B and E) which are as low as 12.
Inter-laboratory variability In figure 1, the histograms of absolute GMTs and the corresponding potencies expressed in IU
relative to the 1st IS 09/194 are shown together for both HI and VN tests, allowing direct
comparison of the inter-laboratory variability. As noted above, some of the results from
laboratory 16 appear anomalous, possibly as a result of a mix-up in reporting of sample results.
Expression of results in IU does not alter this. The results from laboratory 15, which were
generally much lower in absolute titres than other laboratories, for all samples, are more
consistent with other laboratories when expressed in IU relative to 09/194. Apart from the results
from laboratory 15, for the HI tests there is little apparent improvement in agreement between
laboratories from expressing results in IU relative to 09/194. There is reasonable agreement
between laboratories (excepting 15 and 16) for the absolute GMTs. For samples B and E, the
histograms show an apparent increased separation between the negative and positive results.
However, this is an artefact of plotting the negatives as 5 for both absolute titres (derived from
negative being typically <10 with doubling dilutions) and for IU, as noted above.
For the VN tests, there is greater variability between laboratories for absolute GMTs, and
expressing results in IU relative to 09/194 does improve the agreement between laboratories.
The variation between laboratories for results relative to 09/194 is also summarised as %GCVs
(pooling results from all viruses), in table 18, and in the fold range (max/min) between
laboratories for the different samples, summarised in table 19. The calculations are shown
excluding laboratory 16, and also excluding both laboratories 15 and 16.
The %GCVs and fold ranges for results relative to 09/194 were calculated using “corrected
titres”, rather than IU. The corrected titre is calculated in a similar way to the IU, but rather than
using an assigned IU for 09/194, the consensus titres obtained from the original collaborative

WHO/BS/2012.2190
Page 10
study are used. These were 1:183 for HI tests and 1:516 for VN tests. For example, if an assay
gives an HI titre of 640 for sample X and 320 for 09/194, then the corrected titre of X relative to
09/194 is 366 ( = 183 x 640/320), or twice the consensus titre of 09/194. Where there is a
mixture of negative and positive results across laboratories, as for samples B and E, the choice of
a value to assign negative results has a large impact on the resulting %GCVs and fold-ranges.
Taking a value of 5 for a negative (<10) appears more appropriate for titres than for potencies in
IU, where the most appropriate assignment of an IU value to a negative result is not clear, as
discussed above. For this reason, the calculations were based on corrected titres. For all other
samples, where the results were positive for each laboratory, there is no difference in GCV or
fold range using either IU or titres, as there is simply a scale difference between the different
units.
From the table of %GCVs, looking at the results for the HI tests, excluding laboratory 16, there
is some reduction in inter-laboratory variability, particularly for samples D & F. However,
looking at the results excluding laboratory 15, it appears that this reduction is entirely due to the
low titres from laboratory 15 for these samples being brought into line by expressing them
relative to 09/194. There is no discernible improvement in inter-laboratory agreement for the HI
tests for the other laboratories. This pattern is mirrored with the fold-ranges between
laboratories, and from the histograms.
The results for the VN test show greater variability than the HI tests. For the current IS 09/194
the between laboratory %GCV of absolute titres is 195% for VN compared to 129% for HI. For
the candidate replacement standard, samples D and F, the %GCVs are 311% and 354% for VN,
and 141% and 127% for HI. Excluding laboratory 15, the values for D and F are 226% and
253% for VN and 81% and 54% for HI. The corresponding fold-ranges are 80-90 fold for VN
compared to 4-10 fold for HI. Expressing results relative to 09/194 does lead to a reduction in
inter-laboratory variation, particularly for the higher titre samples C, D and F, where the GCVs
(excluding laboratory 15) drop from 170%, 226% and 253% to 112%, 94% and 94%
respectively. The improvement in inter-laboratory agreement for the VN tests is most clearly
seen from the histograms.
The VN titres obtained by laboratory 5 using the A/ChCh virus are low for all samples, but the
laboratory only used this virus in VN tests, so it is not clear whether it is something specific to
the virus. Their HI results with this virus are generally lower than their HI results with other
viruses however. Apart from this observation, there were no apparent trends indicating
differences in results with the different viruses used.
Use of Candidate Replacement Standard (10/202)
Expression in IU The laboratory results for samples B, C, D, E and 09/194 were expressed in IU relative to sample
F (10/202). For the purpose of these calculations, Sample F was assigned a candidate unitage of
2400 IU/ml, based on the calibration against 09/194 from the HI tests.
The potencies of the samples B, C, D, E and 09/194 are shown in tables 30-39, split by virus, and
also the overall values for each laboratory, pooling the data for all viruses. They are also shown
in histogram form in figure 2 with the different viruses are shown separately, and colour coded.
As with the calculations and histograms relative to 09/194, negative results were plotted as 5 IU,
to maintain identical scales allowing direct comparisons.

WHO/BS/2012.2190
Page 11
Inter-laboratory variability Figure 2 shows the histograms of absolute GMTs and the corresponding potencies expressed in
IU relative to sample F together for both HI and VN tests, allowing direct comparison of the
inter-laboratory variability. Comments on the results from laboratories 15 and 16 are as before.
The variation between laboratories for results relative to sample F is also summarised as %GCVs
(pooling results from all viruses), in table 18, and in the fold range (max/min) between
laboratories for the different samples, summarised in table 19. The calculations are shown
excluding laboratory 16, and also excluding both laboratories 15 and 16. As before, the %GCVs
and fold ranges for results relative to 09/194 were calculated using “corrected titres”, rather than
IU.
For sample D, the duplicate of sample F, expressing results relative to sample F leads to
excellent agreement between laboratories for both HI and VN tests, which can be clearly seen
from the histograms. This is not unexpected, as essentially it is expressing the candidate standard
against itself. The %GCVs are reduced from 81% to 25% for HI tests, and from 226% to 29%
for VN tests.
For the other samples, any improvement in agreement is less marked. For the higher titre
samples C and 09/194 there is some improvement, mainly for the VN tests, but for samples B
and E there is less impact. For sample C the %GCV drops from 59% to 35% for HI tests and
from 170% to 80% for VN tests. In contrast for sample B the %GCV drops from 136% to 101%
for HI tests and from 200% to 160% for VN tests.
Using sample F as a candidate standard appears to give better improvement in inter-laboratory
agreement for sample C compared to using 09/194 (%GCVs of 35% and 84% respectively for
HI, and 80% and 112% for VN). For the other samples, apart from the duplicate D, there is little
difference in the effectiveness of the candidate standard compared to 09/194.
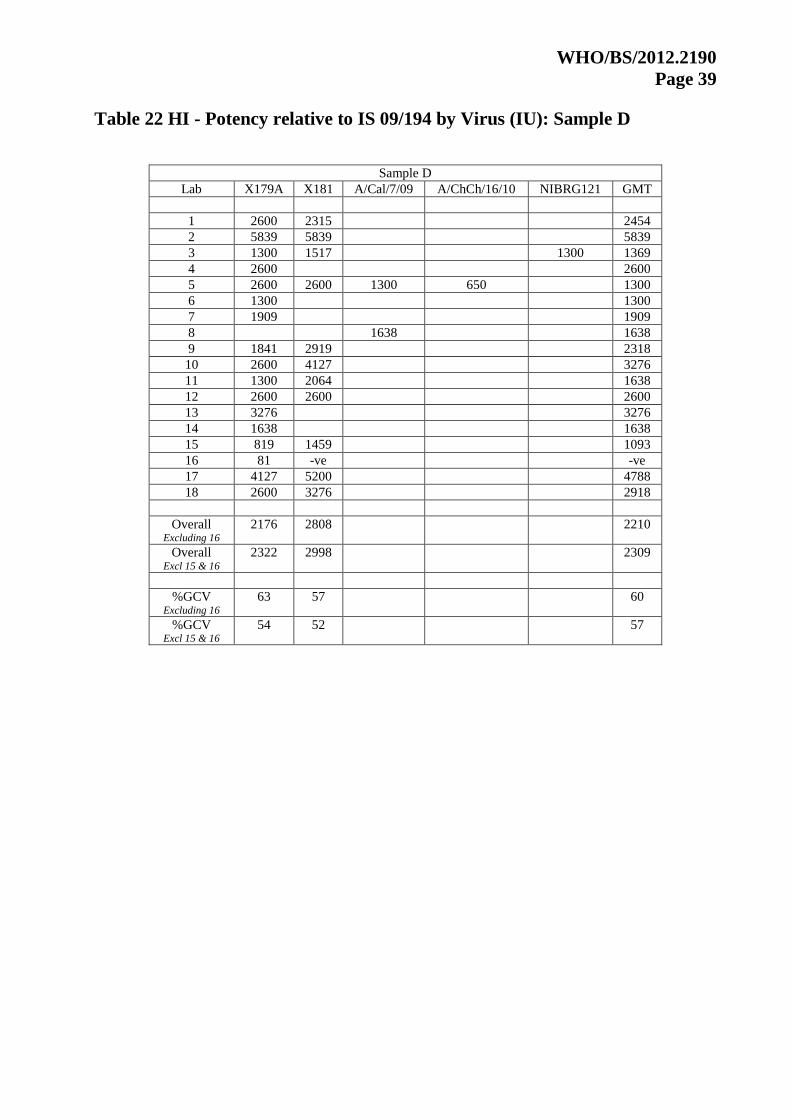
Calibration of Candidate Replacement Standard 10/202 The candidate replacement standard was included in duplicate as samples D and F. From tables
22 and 24, the overall means of the HI tests across laboratories (excluding laboratories 15 and
16), when expressed in IU/ml relative to 09/194, were 2309 and 2531 (geometric mean 2417).
For the VN tests the means were 1321 and 1488 (geometric mean 1402). These values represent
good agreement between the duplicate samples. However, they demonstrate considerable
differences in the calibration of the candidate replacement standard against the current IS 09/194
depending on whether HI or VN tests are used. For HI tests, an assigned value of 2400 IU/ml
would be appropriate for the candidate standard, but for VN tests, 1400 IU/ml would be
appropriate.
The relationship between the HI titres and the VN titres is different for the current IS and the
candidate replacement, which leads to this difference in calibrations. For the current IS, 09/194,
the overall consensus titres from the original collaborative study were 1:183 for HI and 1:516 for
VN. These were matched closely in the current study with values of 1:167 for HI and 1:557 for
VN. The VN titres are therefore approximately three times the HI titre. For the candidate
replacement standard, the corresponding means of the absolute HI titres were 297 and 326 for D
and F, with a mean of 311, and for VN titres the means were 567 and 638, with a mean of 601.
The VN titres are therefore approximately two times the HI titres for the candidate replacement
standard, compared to three times for the current IS.

WHO/BS/2012.2190
Page 12
Stability studies on 10/202 Samples of the candidate standard, NIBSC code 10/202, were stored at temperatures ranging
from -150˚C to +45˚C for 18 months. They were assayed concurrently at NIBSC, using X-181
virus in both haemagglutination-inhibition (HI) assays and a virus neutralisation (VN) assay.
Three different ampoules stored at each temperature were tested.
The samples stored at 45˚C could not be reconstituted, and could not be tested. The individual
assay results for the other samples are shown in table 40, along with the geometric mean titre.
For the HI tests, it is impossible to distinguish between the sample stored at +37˚C for 18 months,
and the baseline sample stored at -150˚C. For the VN tests there is an apparent drop in titre for
the +37˚C sample, but no apparent differences between the other samples, given the assay
variability present. With the problems in reconstitution experienced with the +45˚C samples, it is
possible that the apparent drop in titre at +37˚C may also be partly due to problems in
reconstitution, although the HI results have not been affected.
There is insufficient data to apply the usual Arrhenius model to predict the rate of degradation at
different temperatures. However, applying the ‘rule of thumb’ that the degradation rate will
double for every increase of 10˚C in temperature, the lack of any observed degradation after 18
months at +20˚C in either HI or VN tests is equivalent to non-observable degradation for a
minimum of 12 years when stored at -20˚C.
The stability studies will continue. With the current data there is no indication of any issues with
stability and 10/202 appears suitable to serve as an International Standard.
Discussion and conclusions There was considerable variation observed between participating laboratories in the level of
titres obtained for the same serum samples. Differences of up to 43-fold between laboratories
were observed for HI and up to 463-fold for VN tests. This level of variability is consistent with
that seen in previous collaborative studies [1,2,3]. Consensus HI and VN titres for IS 09/194
from this study are similar to those obtained in the previous collaborative study to establish the
IS showing very good agreement between the two studies.
In a previous study [3] most of the laboratories, recorded higher titres for tests using the
reassortant X-179A virus than those using the wild type A/California virus. In this study there
were no apparent trends associated with the use of different viruses however; most laboratories
only used X179A and X181 viruses so any differences related to the use of A/California, A/Chch
or NIBRG-121 are limited to observations of single laboratory comparisons.
Expressing titres relative to the IS 09/194 gives a reduction in the variation between laboratories
in nearly all cases. However as discussed previously the improvement in agreement for the HI
data is entirely due to bringing low titres from laboratory 15 in line by expressing them relative
to 09/194. For VN there is a clear improvement in inter laboratory agreement when titres are
expressed relative to 09/194.
Expressing titres relative to the candidate replacement IS 10/202 gives a reduction in the
variation between laboratories similar to that observed with the use of 09/194 for samples B and
E and greater than using 09/194 for samples C and D. As discussed previously this is not
unexpected for sample D which is a duplicate of 10/202. Sample C is an aliquot of one of the

WHO/BS/2012.2190
Page 13
plasma donations used to prepare 10/202 and consequently an improved reduction in variability
against 10/202 compared to 09/194 is not surprising.
The candidate replacement IS was included in the study as duplicate sera F and D and the overall
means for the duplicates were in good agreement for both HI and VN assay. However when the
absolute titres were converted into IU by calibration against the IS 09/194 there was a
considerable discrepancy in value depending on whether HI or VN titres were used.
Previous studies [2, 3] have demonstrated that there is no consistent correlation between HI and
VN titres either between laboratories or to a lesser extent for individual sera.
This study has demonstrated that the relationship between HI and VN titre is different for the IS
09/194 and candidate replacement IS 10/202. VN titres are approximately two times the HI titres
for the candidate replacement standard, compared to three times for the current IS.
The candidate replacement IS has been prepared exclusively from donations from immunized
subjects, whereas the IS 09/194 was prepared from donations mainly from convalescent subjects.
It is plausible that convalescent sera contain a higher proportion of antibodies directed against
antigenic determinants that function in VN assay but not in HI assay compared to antibodies in
post immunisation sera.
Based on results of this collaborative study, different unitages would apply depending on
whether HI or VN assays were used. However there is no consistent relationship between HI and
VN titres in different laboratories [3, 4] and it therefore does not appear appropriate to assign a
unitage based on VN titres. This belief is consistent with the approach taken to assign unitage to
09/194 where linkage to the 1st IS for antibody to H5N1 antibody clade 1 07/150 by HI and not
VN assays was used (see below).
Due to the pandemic situation, 09/194 was prepared, evaluated and distributed before evaluation
by ECBS could take place and was assigned a consensus HI titre of 1:183 and VN titre of 1:516
(obtained by using X-179A virus). Subsequently it was evaluated by ECBS and assigned a
unitage of 1300 IU/ml linked with the value assigned to the first established IS for influenza
serology; 1st IS for antibody to H5N1 antibody clade 1 07/150. The value was based on a
consensus of HI titres.
Stocks of 09/194 are completely depleted; consequently 10/202 has been evaluated and
distributed before evaluation by ECBS. It has been assigned an interim consensus HI titre of 311,
based on comparison with the 1st IS 09/194.
Proposal 10/202 should be established as the 2
nd IS for antibody to influenza A/California/7/2009
(H1N1)pdm virus with an assigned potency for use in HI assay of 1200 IU per ampoule (2400
IU/ml on reconstitution). This potency has been linked to the potency of the 1st IS for antibody to
(H1N1)pdm 09/194 using the HI titre of 09/194 (1:183), to give equivalent conversion factors
from IU to consensus HI titre for both standards. It is also proposed that the consensus HI titre of
1:310 and VN titre of 1:600 be declared in the “Instructions for Use” that accompany 10/202.
(titres rounded to simplify conversion calculations)
The material is suitable for use in HI and VN assays of human sera for antibody to
A/California/7/2009 (H1N1)pdm like viruses.
WHO/BS/2012.2190
Page 14
Comments from participants A draft of this report was sent to participants who were invited to check their data for errors and
asked if they agreed with the conclusions and recommendations of the report.
Twelve of the eighteen participants responded. Of these, four indicated agreement with the report
content, three stated agreement with the conclusions and one also stated agreement with the
recommendation of the report. None of the respondents indicated any specific direct
disagreement with either the conclusions or the proposal.
Laboratory 1 Correction to participant information – text corrected
Minor corrections to text – text corrected
In agreement with report
Laboratory 2 No errors in presentation of own data
In agreement with report and conclusions.
Laboratory 3 In agreement with presentation of own data and conclusions of report.
Correction to participant information – text corrected
Laboratory 5 Query regarding the method used to calculate GMTs. – methods checked and verified.
Explanation of method used sent to laboratory.
Laboratory 6 Correction to participant information – text corrected
Laboratory 7 Under HI protocols. We titrate the virus at 8 HA, but we add 4 HA into the assay itself. –
text corrected
Question under Results and data analysis/Data Received. Are we the only laboratory that
reports an initial serum dilution that includes the virus volume? – this was the only
laboratory that reported including virus volume in initial serum dilution
Laboratory 8 In agreement with the conclusions and recommendation.
Laboratory 13 Responded, but had no comments
Laboratory 14 Some minor editorial changes – text corrected
Sentence in section VN protocols. Thirteen of eighteen (72%) laboratories returning VN
data also supplied checklists. Comment ‘Information is listed for 14 laboratories’. -

WHO/BS/2012.2190
Page 15
Thirteen laboratories returned checklists, laboratory 18 did not return a checklist but
specified the use of a plaque reduction assay on their result sheet.
Sentence in section Inter-laboratory variability. Using sample F as a candidate standard
appears to give better improvement in inter-laboratory agreement for sample C compared
to using 09/194. Comment: ‘Is that possible to discuss this a bit further in the discussion
section? Why such high range of difference were seen since sample F (replacement IS) is
calibrated off the 09/194’ – sentence added to discussion. Sentence in section Inter-laboratory variability: For the other samples apart from the
duplicate D, there is little difference in the effectiveness of the candidate standard
compared to 09/194. Comment ‘Also, is that possible to discuss this non-linear impact
among different samples after converting to IU/ml – will this non-linear normalization
change the interpretation of the trial results?’ - The results are showing that both the
candidate standard 10/202 and the existing standard 09/194 are similar in their
effectiveness. It is not expected that switching from using 09/194 to 10/202 will have an
impact on the interpretation of trial results. The use of IU rather than absolute titres
should facilitate the comparison of results between different trials.
Sentence in section Calibration of Candidate Replacement Standard 10/202: The VN
titres are therefore approximately two times the HI titres for the candidate replacement
standard, compared to three times for the current IS. Comment ‘It would be interesting to
see the relationship between VN and HI, as expressed in original reported titers and the
converted or corrected IU/ml as calculated from both 09/194 and 10/202 separately, for
each sample from each individual lab. It seems very different pictures can be derived –
the relationship can be reverted when converted to IU/ml …’- It has been established in
previous studies that there is no consistent relationship between HI and VN titres
between laboratories and since the proposal is that 10/202 is for use as an IS for HI
assay only it was not considered that detailed analysis of VN/HI ratios was relevant to
this report. A detailed analysis of the relationship between VN and HI titres in this study
is however of great interest generally and will be included in a subsequent publication.
Sentence in Discussion and conclusions: It is plausible that convalescent sera contain a
higher proportion of antibodies directed against antigenic determinants that function in
VN assay but not in HI assay compared to antibodies in post immunisation sera.
Comment ‘It is possible that Abs with different avidities were generated from
convalescent sera as compared to the Abs generated from the post immunization. Lab 14
uses the condition of incubating virus/serum mixture at 37oC to enhance the Ab and virus
binding (interaction), high VN/HI tier ratio were seen for all test samples without losing
the assay specificity (Sample A remain negative for both HI and VN)’- We agree with the
suggestion that populations of antibody with different avidities may be generated in post
infection and post immunisation sera. However, most laboratories use 37oC for the
virus/serum mixture incubation step, so this is unlikely the reason that lab 14 records
higher titres in VN assay. Information on virus/serum incubation conditions added to
protocol sections.
It is valuable to use the 10/202 candidate 2nd
H1N1 International Standard (IS) to
evaluate the variability of the HI and VN within and among laboratories. However, the
10/202 IS should be used with caution. The relationship between the HI titer and the VN
titer for the 1st H1N1 IS (09/194) and the candidate 2
nd H1N1 IS is different, making it
challenging to propose a consensus VN titer to 10/202. In addition, the 10/202 candidate
2nd
H1N1 IS would be most valuable if the assigned potency was determined with data
from HI and VN assays with certain inclusion criteria; for example, assigned IS potency
with data generated from assays measuring same type of immune response(s) and with no
extreme outliers (outside the 2SD range of the GMT) contributing to the assignments.

WHO/BS/2012.2190
Page 16
The current assigned value of 10/202 was established from labs with variable assay
reproducibility or measuring different types of immune responses, which may
misrepresent the true value of the 10/202 2nd
H1N1 candidate IS. - We accept that the
various serology assays may be measuring different antibody populations, but in this
study the candidate IS 10/202 reduced inter-laboratory variability for all the assays used.
The issue of the consensus titre being derived from a variety of labs each with different
assay sensitivities and validity criteria is difficult to address. It would be difficult to select
which labs’ results to use, or be able to justify it, as the IS needs to be accepted for use by
all labs. However if the potency of 10/202 is described in IU, then the actual consensus
GMT is not important.
Laboratory 15 Responded but had no comments
Noted low titres and are investigating cause.
Correction to participant information – text corrected
Laboratory 16 Confirmed the mix up in reporting of their data and provided corrected data sheets – It is
too late to modify the data analysis for this report and the data for laboratory 16 has not
been included in the assignment of unitage for reagent 10/202. The corrected results
appear to agree with data from other laboratories, in particular individual titres are
close to overall study GMTs for most samples and assays. Consequently, the inclusion of
the data would not have a significant impact on the assignment of unitage for reagent
10/202.
Data analysis will be updated to include lab 16 for subsequent publications.
A completed protocol checklist was supplied – information added to study documents.
Assay parameters all fall within ranges in comparison tables, no corrections required.
Lab 16 did perform replicate assays, however there was a misunderstanding regarding the
way in which titres should be reported and only a single data set was originally
submitted. A full data set has now been submitted. - Data analysis will be updated for
subsequent publications
Laboratory 18
Responded but had no comments

WHO/BS/2012.2190
Page 17
References
1. Recommended composition of influenza virus vaccines for use in the 2012-2013 northern
hemisphere influenza season.
WHO Weekly epidemiological record 2012; No 10, 87: 83-95
2. Stephenson I, Das R, Wood J, Katz J. Comparison of neutralising antibody assays for
detection of antibody to influenza A/H3N2 viruses: an international collaborative study.
Vaccine 2007; 25: 4056-65.
3. Stephenson I, Heath A, Major D, Newman R, Hoschler K, Wang-Junzi, Katz J, Weir J,
Zambon MC, Wood JM. Reproducibility of serologic assays for influenza virus A (H5N1).
Emerging Infectious Diseases 2009;15: 1250-1259
4. Wood JM, Major D, Heath A, Newman RW, Höschler K, Stephenson I, Clark T, Katz JM,
Zambon MC. Reproducibility of serology assays for pandemic influenza H1N1: collaborative
study to evaluate a candidate WHO International Standard.
Vaccine 2012; 30(2):210-7
5. Wagner R, Göpfert C, Hammann J, Neumann B, Wood J, Newman R, Wallis C, Alex N,
Pfleiderer M. Enhancing the reproducibility of serological methods used to evaluate
immunogenicity of pandemic H1N1 influenza vaccines-An effective EU regulatory approach.
Vaccine 2012; 30(27):4113-22
Acknowledgements We are grateful to Dr Wang Junzhi (NIFDC) and Dr Chaggui Li (NIFDC) for donation of the
plasma used in production of the candidate IS.
We are also grateful to Dr. Paul Metcalf (NIBSC), Dr Dorothy Xing (NIBSC) and Dr Jackie
Katz (CDC) for assistance in design and co-ordination of the study.
We thank Kate Guilfoyle, Sarah Roseby and Paul Jefferson for organisation of the study at
NIBSC and the study participants.

WHO/BS/2012.2190
Page 18
Table 1. Comparison of variable parameters in VN assay protocols
Parameter or variable Most frequent variables used Range
A. Stock virus preparation
Cell substrate for virus
growth
10-11 day old embryonated
eggs
10-11 day old embryonated eggs
MDCK
Conditions of virus growth Various used Eggs 2-3 days @32-37oC
MDCK 2-5 days @33oC
Stock virus infectivity and
method of determination
~106 TCID50/ml ELISA based
assay
105.23
-108.2
TCID50\pfu\ffu/ml
B. Serum preparation
Storage of sera following
receipt from NIBSC
various +4oC - -70
oC 0-2 freeze thaw cycles
Pre-assay treatment of sera Heat treatment, 56oC for
30mins
56oC for 30-40mins. No treatment
Initial serum dilution 1:10 (10µl in 90µl diluent) 1:5 to 1:40
Serum diluent Various used PBS or assay diluent
Serial dilution steps 1:2 dilution steps 1:2
Range of serum dilutions Various used 1:5 to 1:1280; 1:10 to 1:10240
C. virus preparation
Virus conc added per well 100 TCID50 100-200 TCID50;
105.3
ffu ; 102.57
- 103.03
pfu
Dilution of stock virus to
achieve assay virus conc
Various X179A 1/10 -1/2000
X181 1/50 - 1/63000
Vol of virus solution added 50µl 50-100µl
Virus diluent Assay diluent PBS or assay diluent
Virus/serum mix
incubation
1hour, room temp 1-2 hour, room temp - 37 oC
Calculated starting serum
dilution
1:10 expressed as start dilution
of serum without addition of
virus or cells
1:10- 1:20 (either include virus volume
or not)
D. Cell preparation
Preparation of cells and
number of cells added
Cell suspension method Cell suspension or preformed
monolayer method
Cell type used MDCK MDCK
Assay diluent DMEM + BSA DMEM or MEM or DCoons or 199 or
Ultra +/- BSA or FCS +/-trypsin
E. Assay set up
Total assay volume per
well
200µl 200µl
Incubation time of assay to
endpoint reading
18-20 hours 16 hours - 6 days
Incubation conditions 37 O
C in 5% CO2 35-37 O
C in 5% CO2
F. Endpoint estimation and
calculation
Endpoint determination
Viral antigen detection by
ELISA using anti-nucleoprotein
antibody
Detection of viral antigen by ELISA/
CPE (light microscopy)/HA/plaque
reduction
Endpoint titer calculation
method
50% neutralization 50% neutralization or highest serum
dilution showing no CPE or 50%/100%
plaque reduction
WHO/BS/2012.2190
Page 19
Table 2. Comparison of variable parameters in HI assay protocols
Parameter or variable Most frequent variables
used
Range
A. Stock virus preparation
Cell substrate for virus
growth
10-11 day old embryonated
eggs
10-11 day old embryonated
eggs, MDCK
Conditions of virus growth 3 days at 34-35oC Eggs 2-3 days @32-
37oC;MDCK 5 days @33
oC
Stock virus
haemagglutination units
titre
various X179A 8->2048
X181 16 - >2048
B. Serum preparation
Storage of sera following
receipt from NIBSC
various +4C to -70C 0-2 freeze thaw
cycles
Treatment of sera 3 RDE to 1 sera, 18hours
37°C, Heat for 30-60 min
56OC
3-4 parts RDE to 1 part sera,
18hrs/overnight 37°C. Heat for
30-60 min 56OC +/- adsorption
with rbcs
Serum diluent PBS PBS; 0.85% saline
Initial serum dilution 1:10 1:4 to 1:10 (1 lab included
virus vol in start dilution)
Serial dilution
steps/volume
1:2 dilutions in 25µl vol 1:2 dilutions in 25-50µl vol
Range of sera dilutions 1:10 to 1:1280 1:8 to 1:16384;
1:10 to 1:1024 or 20480
C. Cell preparation
Cell type Turkey Turkey; chicken; guinea pig;
human O; goose
Preparation of rbcs Within 72 hrs of bleed Within 2 hrs to 2 weeks of
bleed
Red cell diluent PBS PBS +/- 1% BA or NaCl +
0.05%BSA
Red cell suspension
concentration
0.5% v/v 0.4-1% v/v
D. Virus preparation
Virus HA titration 4 HA units 4-8 HA units
Volume of virus added 25µl 25-50µl
Virus/serum mix
incubation conditions
30 min at room temp 15-60 min room temp or 37oC
E. HI Assay set up
Total volume per well various 75-200µl
Incubation conditions to
HI endpoint
various 30-60 min room temp
F. Endpoint estimation and
calculation
Endpoint determination Reciprocal of last well giving
complete inhibition shown by
streaming of RBC button
Reciprocal of last well giving
complete inhibition as shown
by streaming of RBC button;
Reciprocal of last well giving
complete inhibition as shown
by RBC button

WHO/BS/2012.2190
Page 20
Table 3: Within Laboratory Reproducibility of VN and HI Titres
% > 2-fold % > 4-fold
Lab HI VN HI VN
1 0 - 0 -
1A - 0 - 0
1B - 0 - 0
2 17 50 17 8
3 0 0 0 0
4 0 - 0 -
5 0 17 0 0
6 0 0 0 0
7 0 0 0 0
8 0 0 0 0
9 0 - 0 -
10 0 0 0 0
11 0 0 0 0
12 0 0 0 0
13 0 17 0 0
14 0 0 0 0
15 0 0 0 0
16* - - - -
17 8 33 0 0
18 0 - 0 -
18A - 17 - 0
18B - 0 - 0
* - only returned a single result for each sample
WHO/BS/2012.2190
Page 21
Table 4 HI - Laboratory GMTs by Virus: Sample B
Sample B
Lab X179A X181 A/Cal/7/09 A/ChCh/16/10 NIBRG121 GMT
1 80 45 60
2 45 57 51
3 64 64 59 62
4 160 160
5 40 40 40 13 26
6 <10 <10
7 63 63
8 80 80
9 90 71 80
10 127 127 127
11 40 40 40
12 80 80 80
13 40 40
14 202 202
15 <10 11 <10
16 320 320 320
17 32 28 30
18 80 80 80
Overall Excluding 16
52 50 51
Overall Excl 15 & 16
59 58 57
%GCV Excluding 16
170 91 157
%GCV Excl 15 & 16
138 55 136
WHO/BS/2012.2190
Page 22
Table 5 HI - Laboratory GMTs by Virus: Sample C
Sample C
Lab X179A X181 A/Cal/7/09 A/ChCh/16/10 NIBRG121 GMT
1 226 320 269
2 456 512 483
3 256 256 174 225
4 640 640
5 320 1280 320 160 349
6 160 160
7 640 640
8 508 508
9 359 320 339
10 640 640 640
11 320 320 320
12 640 640 640
13 508 508
14 806 806
15 28 45 36
16 320 320 320
17 254 320 285
18 640 640 640
Overall Excluding 16
349 375 367
Overall Excl 15 & 16
413 464 425
%GCV Excluding 16
127 134 112
%GCV Excl 15 & 16
63 65 59
WHO/BS/2012.2190
Page 23
Table 6 HI - Laboratory GMTs by Virus: Sample D
Sample D
Lab X179A X181 A/Cal/7/09 A/ChCh/16/10 NIBRG121 GMT
1 320 180 240
2 256 256 256
3 256 256 256 256
4 640 640
5 320 320 160 101 174
6 80 80
7 320 320
8 403 403
9 320 359 339
10 508 508 508
11 160 254 202
12 640 640 640
13 202 202
14 806 806
15 14 25 19
16 10 <10 <10
17 202 160 180
18 320 320 320
Overall Excluding 16
252 239 253
Overall Excl 15 & 16
306 299 297
%GCV Excluding 16
161 134 141
%GCV Excl 15 & 16
81 53 81
WHO/BS/2012.2190
Page 24
Table 7 HI - Laboratory GMTs by Virus: Sample E
Sample E
Lab X179A X181 A/Cal/7/09 A/ChCh/16/10 NIBRG121 GMT
1 13 <10 <10
2 8 8 8
3 16 9 16 13
4 20 20
5 10 <10 10 13 10
6 <10 <10
7 50 50
8 10 10
9 13 11 12
10 10 10 10
11 <10 <10 <10
12 40 40 40
13 <10 <10
14 20 20
15 <10 <10 <10
16 320 320 320
17 <10 <10 <10
18 <10 <10 <10
Overall Excluding 16
11 <10 10
Overall Excl 15 & 16
11 <10 11
%GCV Excluding 16
114 84 108
%GCV Excl 15 & 16
114 86 108

WHO/BS/2012.2190
Page 25
Table 8 HI - Laboratory GMTs by Virus: Sample F
Sample F
Lab X179A X181 A/Cal/7/09 A/ChCh/16/10 NIBRG121 GMT
1 320 254 285
2 256 256 256
3 256 256 256 256
4 640 640
5 320 320 226 127 207
6 160 160
7 320 320
8 403 403
9 320 285 302
10 508 508 508
11 320 320 320
12 640 640 640
13 254 254
14 640 640
15 14 22 18
16 320 320 320
17 202 190 195
18 320 320 320
Overall Excluding 16
275 248 274
Overall Excl 15 & 16
335 315 326
%GCV Excluding 16
143 137 127
%GCV Excl 15 & 16
52 43 54

WHO/BS/2012.2190
Page 26
Table 9 HI - Laboratory GMTs by Virus: Sample 09/194
Sample 09/194
Lab X179A X181 A/Cal/7/09 A/ChCh/16/10 NIBRG121 GMT
1 160 101 127
2 57 57 57
3 256 219 256 243
4 320 320
5 160 160 160 202 174
6 80 80
7 218 218
8 320 320
9 226 160 190
10 254 160 202
11 160 160 160
12 320 320 320
13 80 80
14 640 640
15 22 22 22
16 160 80 113
17 63 40 49
18 160 127 143
Overall Excluding 16
151 111 149
Overall Excl 15 & 16
171 130 167
%GCV Excluding 16
128 120 129
%GCV Excl 15 & 16
96 65 100
WHO/BS/2012.2190
Page 27
Table 10 VN - Laboratory GMTs by Virus: Sample B
Sample B
Lab X179A X181 A/Cal/7/09 A/ChCh/16/10 NIBRG121 GMT
1A 320 254 285
1B 160 254 213
2 269 320 293
3 119 108 209 139
4
5 12 12
6 40 40
7 180 180
8 80 80
9
10 26 27 27
11 25 25
12 40 40 40
13 304 304
14 423 423
15 13 20 15
16 320 640 453
17 50 52 51
18A 320 254 285
18B 63 80 71
Overall Excluding 16
106 83 87
Overall Excl 15 & 16
125 96 97
%GCV Excluding 16
205 186 219
%GCV Excl 15 & 16
163 170 200
Lab 1A – cpe
Lab 1B – ELISA
WHO/BS/2012.2190
Page 28
Table 11 VN - Laboratory GMTs by Virus: Sample C
Sample C
Lab X179A X181 A/Cal/7/09 A/ChCh/16/10 NIBRG121 GMT
1A 1140 403 678
1B 1016 2560 1612
2 1903 3200 2468
3 795 1175 176 548
4
5 113 113
6 640 640
7 905 905
8 202 202
9
10 152 235 211
11 254 254
12 160 160 160
13 776 776
14 3345 3345
15 22 80 34
16 320 320 320
17 201 359 269
18A 806 1280 1016
18B 320 320 320
Overall Excluding 16
507 495 451
Overall Excl 15 & 16
645 594 529
%GCV Excluding 16
256 223 222
%GCV Excl 15 & 16
155 189 170
Lab 1A – cpe
Lab 1B – ELISA

WHO/BS/2012.2190
Page 29
Table 12 VN - Laboratory GMTs by Virus: Sample D
Sample D
Lab X179A X181 A/Cal/7/09 A/ChCh/16/10 NIBRG121 GMT
1A 285 202 240
1B 3225 4561 3835
2 1345 1345 1345
3 1467 1339 400 923
4
5 190 190
6 640 640
7 1613 1613
8 254 254
9
10 278 254 260
11 320 320
12 80 80 80
13 408 408
14 6457 6457
15 13 40 19
16 <10 <10 <10
17 587 508 552
18A 1016 1280 1140
18B 160 202 180
Overall Excluding 16
528 411 463
Overall Excl 15 & 16
704 519 567
%GCV Excluding 16
392 302 311
%GCV Excl 15 & 16
240 238 226
Lab 1A – cpe
Lab 1B – ELISA

WHO/BS/2012.2190
Page 30
Table 13 VN - Laboratory GMTs by Virus: Sample E
Sample E
Lab X179A X181 A/Cal/7/09 A/ChCh/16/10 NIBRG121 GMT
1A <10 40 14
1B 51 63 57
2 95 80 87
3 36 31 59 40
4
5 12 12
6 20 20
7 57 57
8 16 16
9
10 <10 <10 <10
11 <10 <10
12 10 10 10
13 47 47
14 160 160
15 <10 <10 <10
16 320 320 320
17 13 <10 11
18A 58 80 68
18B <10 <10 <10
Overall Excluding 16
24 18 22
Overall Excl 15 & 16
26 20 23
%GCV Excluding 16
213 211 189
%GCV Excl 15 & 16
210 204 184
Lab 1A – cpe
Lab 1B – ELISA

WHO/BS/2012.2190
Page 31
Table 14 VN - Laboratory GMTs by Virus: Sample F
Sample F
Lab X179A X181 A/Cal/7/09 A/ChCh/16/10 NIBRG121 GMT
1A 226 180 202
1B 2873 4063 3417
2 3200 3200 3200
3 1740 1350 438 1010
4
5 190 190
6 640 640
7 2281 2281
8 320 320
9
10 200 273 252
11 320 320
12 80 80 80
13 650 650
14 7348 7348
15 13 25 16
16 320 320 320
17 570 508 538
18A 1016 1280 1140
18B 202 202 202
Overall Excluding 16
588 420 513
Overall Excl 15 & 16
791 557 638
%GCV Excluding 16
441 372 354
%GCV Excl 15 & 16
277 270 253
Lab 1A – cpe
Lab 1B – ELISA

WHO/BS/2012.2190
Page 32
Table 15 VN - Laboratory GMTs by Virus: Sample 09/194
Sample 09/194
Lab X179A X181 A/Cal/7/09 A/ChCh/16/10 NIBRG121 GMT
1A 285 570 403
1B 1613 1810 1709
2 1600 1600 1600
3 734 507 1049 731
4
5 1280 1280
6 320 320
7 1613 1613
8 320 320
9
10 169 162 164
11 254 254
12 80 80 80
13 795 795
14 4191 4191
15 127 320 173
16 320 640 453
17 279 285 282
18A 806 1280 1016
18B 160 160 160
Overall Excluding 16
498 408 520
Overall Excl 15 & 16
553 418 557
%GCV Excluding 16
222 177 195
%GCV Excl 15 & 16
215 191 194
Lab 1A – cpe
Lab 1B – ELISA
WHO/BS/2012.2190
Page 33
Table 16: HI - Laboratory GMTs by Sample and Virus
Sample B Sample C Sample D Sample E Sample F 09/194
Lab X179A X181 X179A X181 X179A X181 X179A X181 X179A X181 X179A X181
1 80 45 226 320 320 180 13 <10 320 254 160 101
2 45 57 456 512 256 256 8 8 256 256 57 57
3 64 64 256 256 256 256 16 9 256 256 256 219
4 160 640 640 20 640 320
5 40 40 320 1280 320 320 10 <10 320 320 160 160
6 <10 160 80 <10 160 80
7 63 640 320 50 320 218
8
9 90 71 359 320 320 359 13 11 320 285 226 160
10 127 127 640 640 508 508 10 10 508 508 254 160
11 40 40 320 320 160 254 <10 <10 320 320 160 160
12 80 80 640 640 640 640 40 40 640 640 320 320
13 40 508 202 <10 254 80
14 202 806 806 20 640 640
15 <10 11 28 45 14 25 <10 <10 14 22 22 22
16 320 320 320 320 10 <10 320 320 320 320 160 80
17 32 28 254 320 202 160 <10 <10 202 190 63 40
18 80 80 640 640 320 320 <10 <10 320 320 160 127
Overall Excluding
16
52 50 349 375 252 239 11 <10 275 248 151 111
%GCV Excluding
16
170 91 127 134 161 134 114 84 143 137 128 120

WHO/BS/2012.2190
Page 34
Table 17: VN - Laboratory GMTs by Sample and Virus
Sample B Sample C Sample D Sample E Sample F 09/194
Lab X179A X181 X179A X181 X179A X181 X179A X181 X179A X181 X179A X181
1A 320 254 1140 403 285 202 <10 40 226 180 285 570
1B 160 254 1016 2560 3225 4561 51 63 2873 4063 1613 1810
2 269 320 1903 3200 1345 1345 95 80 3200 3200 1600 1600
3 119 108 795 1175 1467 1339 36 31 1740 1350 734 507
4
5
6 40 640 640 20 640 320
7 180 905 1613 57 2281 1613
8
9
10 26 27 152 235 278 254 <10 <10 200 273 169 162
11 25 254 320 <10 320 254
12 40 40 160 160 80 80 10 10 80 80 80 80
13 304 776 408 47 650 795
14 423 3345 6457 160 7348 4191
15 13 20 22 80 13 40 <10 <10 13 25 127 320
16 320 640 320 320 <10 <10 320 320 320 320 320 640
17 50 52 201 359 587 508 13 <10 570 508 279 285
18A 320 254 806 1280 1016 1280 58 80 1016 1280 806 1280
18B 63 80 320 320 160 202 <10 <10 202 202 160 160
Overall Excluding
16
106 83 507 495 528 411 24 18 588 420 498 408
%GCV Excluding
16
205 186 256 223 392 302 213 211 441 372 222 177
WHO/BS/2012.2190
Page 35
Table 18: Between Laboratory %GCV
%GCV
HI VN
09/194 B C D E F 09/194 B C D E F
Absolute
Titres
Excluding
Lab 16 129 157 112 141 108 127 195 219 222 311 189 354
Excluding
Labs 15 &
16 100 136 59 81 108 54 194 200 170 226 184 253
Potency
relative to
09/194
Excluding
Lab 16 168 82 60 97 62 164 127 132 132 143
Excluding
Labs 15 &
16 124 84 57 98 56 168 112 94 125 94
Potency
relative to
Sample F
Excl
Lab 16 62 144 36 24 95 143 178 85 29 143
Excl
Labs 15 &
16 56 101 35 25 96 94 160 80 29 135
WHO/BS/2012.2190
Page 36
Table 19: Fold Range (max/min) Between Laboratories
Fold Range (max/min) between laboratories
HI VN
09/194 B C D E F 09/194 B C D E F
Absolute Titres
Excluding
Lab 16 29 40 23 43 10 36 52 36 98 349 32 463
Excluding
Labs 15 & 16 13 40 5 10 10 4 52 36 30 81 32 92
Potency relative to
09/194
Excluding
Lab 16 33 9 5 8 6 76 23 21 13 22
Excluding
Labs 15 & 16 33 9 4 8 4 76 23 15 13 13
Potency relative to
Sample F
Excl
Lab 16 6 21 2 3 10 22 25 8 3 16
Excl
Labs 15 & 16 4 21 2 3 10 13 25 8 3 16
WHO/BS/2012.2190
Page 37
Table 20 HI – Potency relative to IS 09/194 by Virus (IU): Sample B
Sample B
Lab X179A X181 A/Cal/7/09 A/ChCh/16/10 NIBRG121 GM
1 650 581 614
2 1026 1298 1154
3 325 379 301 334
4 650 650
5 325 325 325 81 193
6 -ve -ve
7 379 379
8 325 325
9 516 581 547
10 650 1032 819
11 325 325 325
12 325 325 325
13 650 650
14 409 409
15 -ve 650 -ve
16 2600 5200 3677
17 650 916 798
18 650 819 729
Overall Excluding 16
283 587 289
Overall Excl 15 & 16
371 581 372
%GCV Excluding 16
402 65 391
%GCV Excl 15 & 16
247 69 245

WHO/BS/2012.2190
Page 38
Table 21 HI - Potency relative to IS 09/194 by Virus (IU): Sample C
Sample C
Lab X179A X181 A/Cal/7/09 A/ChCh/16/10 NIBRG121 GM
1 1838 4127 2754
2 10404 11678 11023
3 1300 1517 884 1204
4 2600 2600
5 2600 10400 2600 1032 2600
6 2600 2600
7 3819 3819
8 2064 2064
9 2067 2600 2318
10 3276 5200 4127
11 2600 2600 2600
12 2600 2600 2600
13 8254 8254
14 1638 1638
15 1638 2600 2064
16 2600 5200 3677
17 5200 10400 7601
18 5200 6552 5837
Overall Excluding 16
3011 4411 3209
Overall Excl 15 & 16
3136 4651 3298
%GCV Excluding 16
80 101 82
%GCV Excl 15 & 16
79 104 84
WHO/BS/2012.2190
Page 39
Table 22 HI - Potency relative to IS 09/194 by Virus (IU): Sample D
Sample D
Lab X179A X181 A/Cal/7/09 A/ChCh/16/10 NIBRG121 GMT
1 2600 2315 2454
2 5839 5839 5839
3 1300 1517 1300 1369
4 2600 2600
5 2600 2600 1300 650 1300
6 1300 1300
7 1909 1909
8 1638 1638
9 1841 2919 2318
10 2600 4127 3276
11 1300 2064 1638
12 2600 2600 2600
13 3276 3276
14 1638 1638
15 819 1459 1093
16 81 -ve -ve
17 4127 5200 4788
18 2600 3276 2918
Overall Excluding 16
2176 2808 2210
Overall Excl 15 & 16
2322 2998 2309
%GCV Excluding 16
63 57 60
%GCV Excl 15 & 16
54 52 57
WHO/BS/2012.2190
Page 40
Table 23 HI - Potency relative to IS 09/194 by Virus (IU): Sample E
Sample E
Lab X179A X181 A/Cal/7/09 A/ChCh/16/10 NIBRG121 GMT
1 102 -ve -ve
2 182 182 182
3 81 56 81 72
4 81 81
5 81 -ve 81 81 75
6 -ve -ve
7 301 301
8 41 41
9 72 91 81
10 51 81 64
11 -ve -ve -ve
12 163 163 163
13 -ve -ve
14 41 41
15 -ve -ve -ve
16 2600 5200 3677
17 -ve -ve -ve
18 -ve -ve -ve
Overall Excluding 16
32 20 27
Overall Excl 15 & 16
36 23 30
%GCV Excluding 16
373 403 368
%GCV Excl 15 & 16
360 412 361

WHO/BS/2012.2190
Page 41
Table 24 HI - Potency relative to IS 09/194 by Virus (IU): Sample F
Sample F
Lab X179A X181 A/Cal/7/09 A/ChCh/16/10 NIBRG121 GMT
1 2600 3273 2917
2 5839 5839 5839
3 1300 1517 1300 1369
4 2600 2600
5 2600 2600 1838 819 1546
6 2600 2600
7 1909 1909
8 1638 1638
9 1841 2315 2064
10 2600 4127 3276
11 2600 2600 2600
12 2600 2600 2600
13 4127 4127
14 1300 1300
15 819 1300 1032
16 2600 5200 3677
17 4127 6180 5198
18 2600 3276 2918
Overall Excluding 16
2373 2913 2401
Overall Excl 15 & 16
2547 3158 2531
%GCV Excluding 16
62 63 62
%GCV Excl 15 & 16
49 53 56

WHO/BS/2012.2190
Page 42
Table 25 VN - Potency relative to IS 09/194 by Virus (IU): Sample B
Sample B
Lab X179A X181 A/Cal/7/09 A/ChCh/16/10 NIBRG121 GMT
1A 1460 579 919
1B 145 182 162
2 219 260 238
3 210 276 259 247
4
5 12 12
6 163 163
7 145 145
8 325 325
9
10 200 218 214
11 129 129
12 650 650 650
13 497 497
14 131 131
15 129 81 111
16 1300 1300 1300
17 235 237 236
18A 516 258 365
18B 516 650 579
Overall Excluding 16
277 265 217
Overall Excl 15 & 16
294 298 226
%GCV Excluding 16
110 93 164
%GCV Excl 15 & 16
109 75 168
Lab 1A – cpe
Lab 1B – ELISA
WHO/BS/2012.2190
Page 43
Table 26 VN - Potency relative to IS 09/194 by Virus (IU): Sample C
Sample C
Lab X179A X181 A/Cal/7/09 A/ChCh/16/10 NIBRG121 GMT
1A 5202 920 2187
1B 819 1839 1227
2 1546 2600 2005
3 1407 3013 219 975
4
5 115 115
6 2600 2600
7 730 730
8 819 819
9
10 1169 1881 1670
11 1300 1300
12 2600 2600 2600
13 1268 1268
14 1038 1038
15 230 325 258
16 1300 650 919
17 940 1635 1239
18A 1300 1300 1300
18B 2600 2600 2600
Overall Excluding 16
1325 1578 1126
Overall Excl 15 & 16
1516 1848 1235
%GCV Excluding 16
110 89 127
%GCV Excl 15 & 16
76 47 112
Lab 1A – cpe
Lab 1B – ELISA
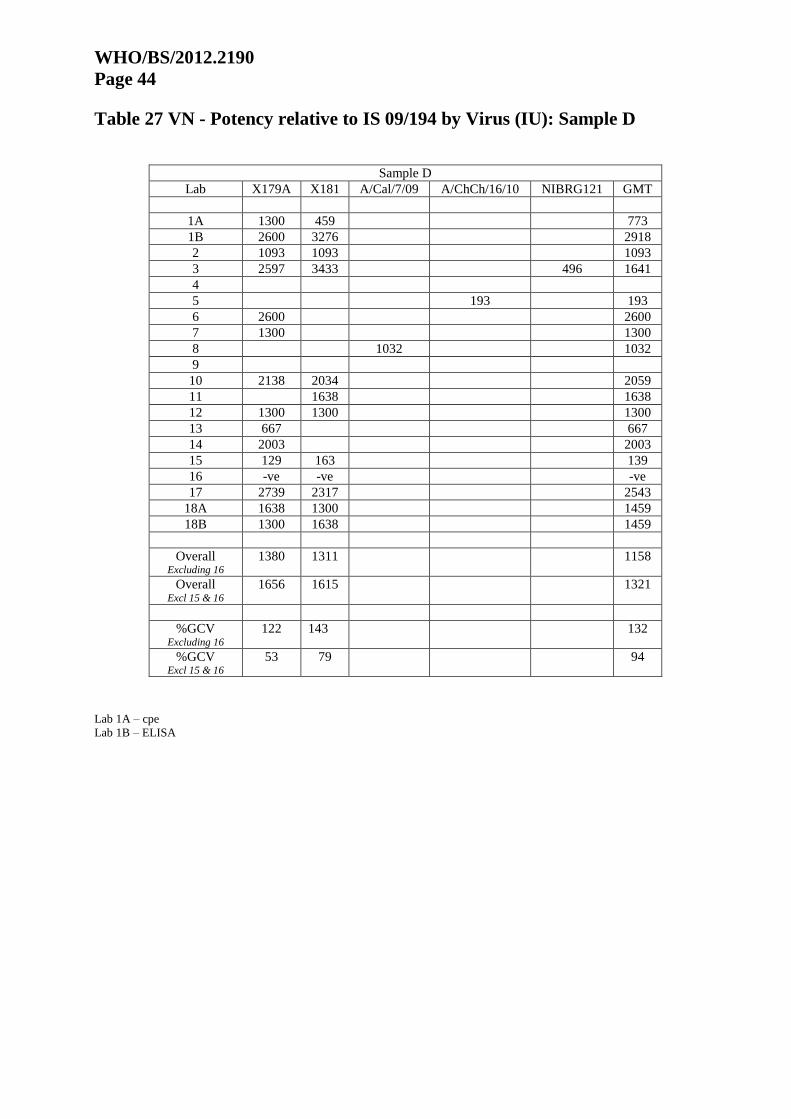
WHO/BS/2012.2190
Page 44
Table 27 VN - Potency relative to IS 09/194 by Virus (IU): Sample D
Sample D
Lab X179A X181 A/Cal/7/09 A/ChCh/16/10 NIBRG121 GMT
1A 1300 459 773
1B 2600 3276 2918
2 1093 1093 1093
3 2597 3433 496 1641
4
5 193 193
6 2600 2600
7 1300 1300
8 1032 1032
9
10 2138 2034 2059
11 1638 1638
12 1300 1300 1300
13 667 667
14 2003 2003
15 129 163 139
16 -ve -ve -ve
17 2739 2317 2543
18A 1638 1300 1459
18B 1300 1638 1459
Overall Excluding 16
1380 1311 1158
Overall Excl 15 & 16
1656 1615 1321
%GCV Excluding 16
122 143 132
%GCV Excl 15 & 16
53 79 94
Lab 1A – cpe
Lab 1B – ELISA

WHO/BS/2012.2190
Page 45
Table 28 VN - Potency relative to IS 09/194 by Virus (IU): Sample E
Sample E
Lab X179A X181 A/Cal/7/09 A/ChCh/16/10 NIBRG121 GMT
1A -ve 91 46
1B 41 46 43
2 77 65 71
3 63 80 73 72
4
5 12 12
6 81 81
7 46 46
8 64 64
9
10 -ve -ve -ve
11 -ve -ve
12 163 163 163
13 77 77
14 50 50
15 -ve -ve -ve
16 1300 650 919
17 62 -ve 50
18A 93 81 87
18B -ve -ve -ve
Overall Excluding 16
33 23 32
Overall Excl 15 & 16
38 27 36
%GCV Excluding 16
259 342 228
%GCV Excl 15 & 16
234 336 206
Lab 1A – cpe
Lab 1B – ELISA

WHO/BS/2012.2190
Page 46
Table 29 VN - Potency relative to IS 09/194 by Virus (IU): Sample F
Sample F
Lab X179A X181 A/Cal/7/09 A/ChCh/16/10 NIBRG121 GMT
1A 1032 409 650
1B 2316 2918 2600
2 2600 2600 2600
3 3080 3462 543 1796
4
5 193 193
6 2600 2600
7 1838 1838
8 1300 1300
9
10 1538 2182 1999
11 1638 1638
12 1300 1300 1300
13 1063 1063
14 2279 2279
15 129 102 119
16 1300 650 919
17 2661 2317 2480
18A 1638 1300 1459
18B 1638 1638 1638
Overall Excluding 16
1536 1341 1283
Overall Excl 15 & 16
1859 1734 1488
%GCV Excluding 16
121 180 143
%GCV Excl 15 & 16
43 83 94
Lab 1A – cpe
Lab 1B – ELISA

WHO/BS/2012.2190
Page 47
Table 30 HI – Potency relative to Sample F by Virus (IU): Sample B
Sample B
Lab X179A X181 A/Cal/7/09 A/ChCh/16/10 NIBRG121 GM
1 600 426 505
2 422 534 474
3 600 600 556 585
4 600 600
5 300 300 424 238 300
6 -ve -ve
7 476 476
8 476 476
9 673 602 636
10 600 600 600
11 300 300 300
12 300 300 300
13 378 378
14 756 756
15 -ve 1200 -ve
16 2400 2400 2400
17 378 356 368
18 600 600 600
Overall Excluding 16
269 484 276
Overall Excl 15 & 16
351 442 354
%GCV Excluding 16
%GCV Excl 15 & 16
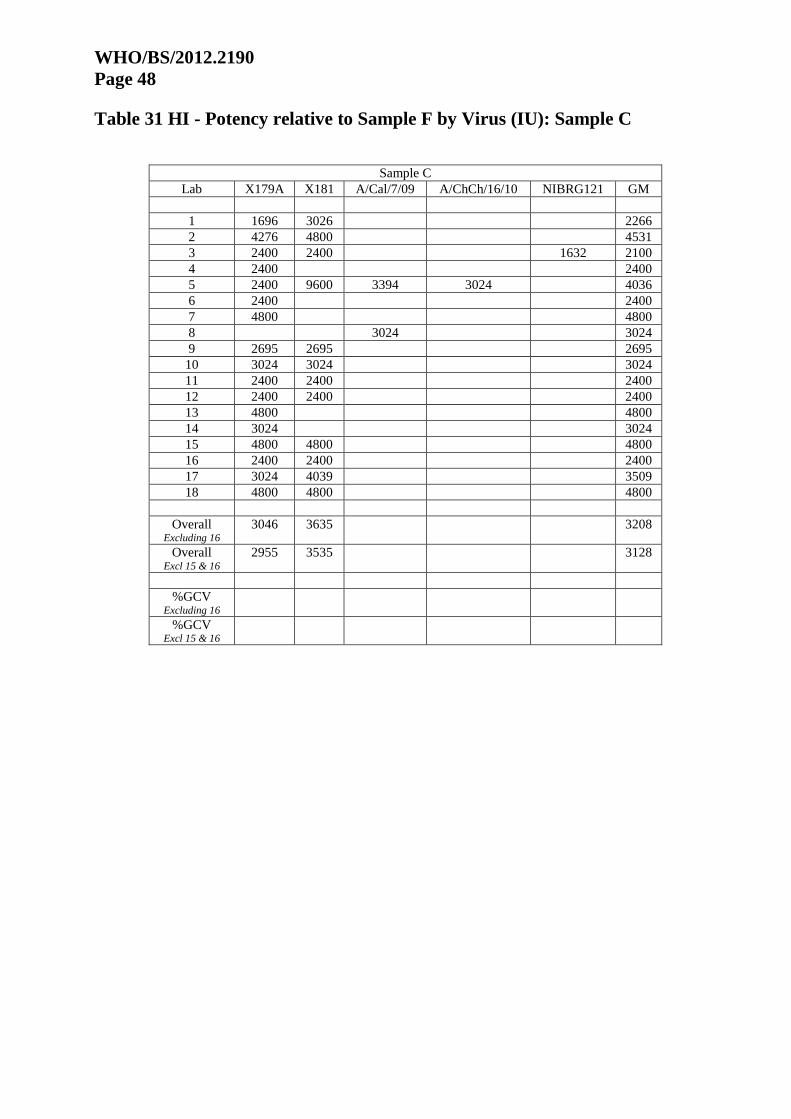
WHO/BS/2012.2190
Page 48
Table 31 HI - Potency relative to Sample F by Virus (IU): Sample C
Sample C
Lab X179A X181 A/Cal/7/09 A/ChCh/16/10 NIBRG121 GM
1 1696 3026 2266
2 4276 4800 4531
3 2400 2400 1632 2100
4 2400 2400
5 2400 9600 3394 3024 4036
6 2400 2400
7 4800 4800
8 3024 3024
9 2695 2695 2695
10 3024 3024 3024
11 2400 2400 2400
12 2400 2400 2400
13 4800 4800
14 3024 3024
15 4800 4800 4800
16 2400 2400 2400
17 3024 4039 3509
18 4800 4800 4800
Overall Excluding 16
3046 3635 3208
Overall Excl 15 & 16
2955 3535 3128
%GCV Excluding 16
%GCV Excl 15 & 16
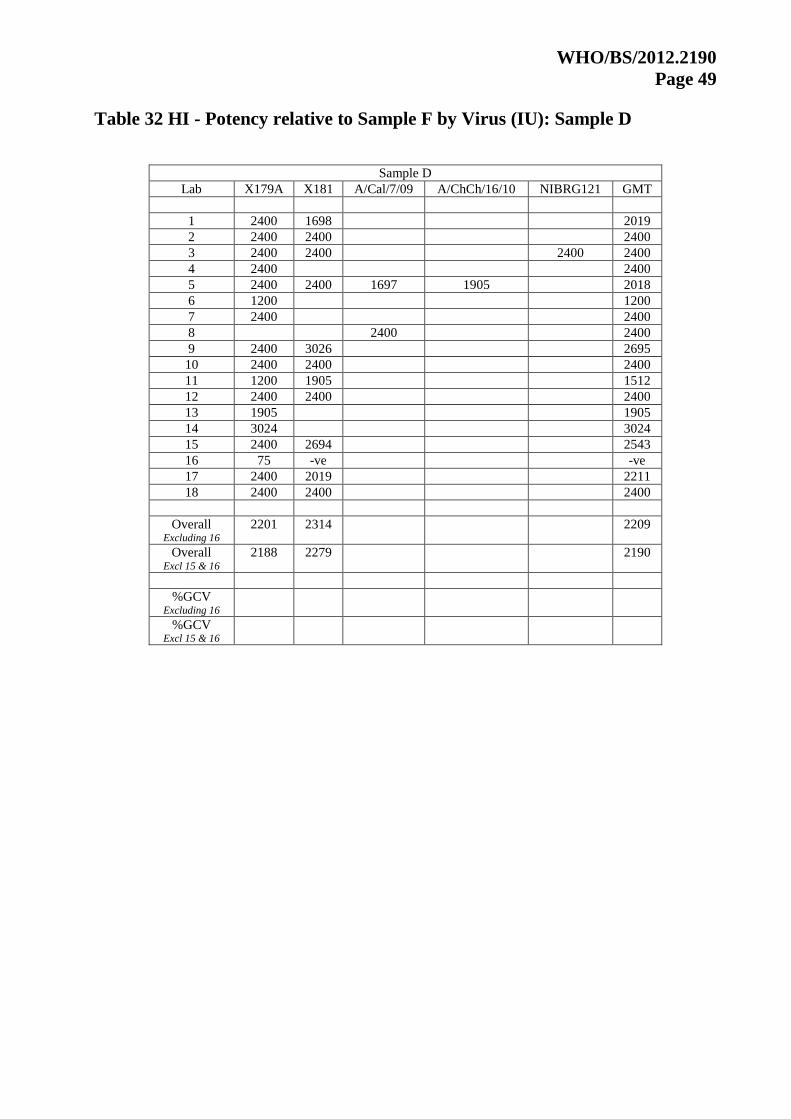
WHO/BS/2012.2190
Page 49
Table 32 HI - Potency relative to Sample F by Virus (IU): Sample D
Sample D
Lab X179A X181 A/Cal/7/09 A/ChCh/16/10 NIBRG121 GMT
1 2400 1698 2019
2 2400 2400 2400
3 2400 2400 2400 2400
4 2400 2400
5 2400 2400 1697 1905 2018
6 1200 1200
7 2400 2400
8 2400 2400
9 2400 3026 2695
10 2400 2400 2400
11 1200 1905 1512
12 2400 2400 2400
13 1905 1905
14 3024 3024
15 2400 2694 2543
16 75 -ve -ve
17 2400 2019 2211
18 2400 2400 2400
Overall Excluding 16
2201 2314 2209
Overall Excl 15 & 16
2188 2279 2190
%GCV Excluding 16
%GCV Excl 15 & 16

WHO/BS/2012.2190
Page 50
Table 33 HI - Potency relative to Sample F by Virus (IU): Sample E
Sample E
Lab X179A X181 A/Cal/7/09 A/ChCh/16/10 NIBRG121 GMT
1 94 -ve -ve
2 75 75 75
3 150 88 150 126
4 75 75
5 75 -ve 106 238 116
6 -ve -ve
7 378 378
8 60 60
9 94 94 94
10 47 47 47
11 -ve -ve -ve
12 150 150 150
13 -ve -ve
14 75 75
15 -ve -ve -ve
16 2400 2400 2400
17 -ve -ve -ve
18 -ve -ve -ve
Overall Excluding 16
33 18 29
Overall Excl 15 & 16
37 21 32
%GCV Excluding 16
%GCV Excl 15 & 16

WHO/BS/2012.2190
Page 51
Table 34 HI - Potency relative to Sample F by Virus (IU): 09/194
09/194
Lab X179A X181 A/Cal/7/09 A/ChCh/16/10 NIBRG121 GMT
1 1200 953 1070
2 534 534 534
3 2400 2056 2400 2279
4 1200 1200
5 1200 1200 1697 3810 2018
6 1200 1200
7 1634 1634
8 1905 1905
9 1695 1347 1511
10 1200 756 952
11 1200 1200 1200
12 1200 1200 1200
13 756 756
14 2400 2400
15 3810 2400 3024
16 1200 600 849
17 756 505 600
18 1200 952 1069
Overall Excluding 16
1315 1071 1300
Overall Excl 15 & 16
1225 988 1233
%GCV Excluding 16
%GCV Excl 15 & 16

WHO/BS/2012.2190
Page 52
Table 35 VN - Potency relative to Sample F by Virus (IU): Sample B
Sample B
Lab X179A X181 A/Cal/7/09 A/ChCh/16/10 NIBRG121 GMT
1A 3395 3395 3395
1B 150 150 150
2 202 240 220
3 163 191 1145 330
4
5 150 150
6 150 150
7 189 189
8 600 600
9
10 312 240 256
11 189 189
12 1200 1200 1200
13 1123 1123
14 138 138
15 2400 1905 2222
16 2400 4800 3394
17 212 246 229
18A 756 476 600
18B 756 952 849
Overall Excluding 16
433 474 406
Overall Excl 15 & 16
379 412 365
%GCV Excluding 16
%GCV Excl 15 & 16
Lab 1A – cpe
Lab 1B – ELISA

WHO/BS/2012.2190
Page 53
Table 36 VN - Potency relative to Sample F by Virus (IU): Sample C
Sample C
Lab X179A X181 A/Cal/7/09 A/ChCh/16/10 NIBRG121 GMT
1A 12100 5394 8078
1B 848 1512 1133
2 1427 2400 1851
3 1096 2088 966 1303
4
5 1427 1427
6 2400 2400
7 952 952
8 1512 1512
9
10 1824 2069 2005
11 1905 1905
12 4800 4800 4800
13 2865 2865
14 1093 1093
15 4276 7620 5184
16 2400 2400 2400
17 848 1694 1198
18A 1905 2400 2138
18B 3810 3810 3810
Overall Excluding 16
2070 2824 2106
Overall Excl 15 & 16
1957 2558 1991
%GCV Excluding 16
%GCV Excl 15 & 16
Lab 1A – cpe
Lab 1B – ELISA

WHO/BS/2012.2190
Page 54
Table 37 VN - Potency relative to Sample F by Virus (IU): Sample D
Sample D
Lab X179A X181 A/Cal/7/09 A/ChCh/16/10 NIBRG121 GMT
1A 3024 2695 2855
1B 2694 2694 2694
2 1009 1009 1009
3 2024 2380 2191 2193
4
5 2400 2400
6 2400 2400
7 1697 1697
8 1905 1905
9
10 3336 2237 2472
11 2400 2400
12 2400 2400 2400
13 1505 1505
14 2109 2109
15 2400 3810 2800
16 -ve -ve -ve
17 2471 2400 2461
18A 2400 2400 2400
18B 1905 2400 2138
Overall Excluding 16
2155 2346 2166
Overall Excl 15 & 16
2138 2235 2131
%GCV Excluding 16
%GCV Excl 15 & 16
Lab 1A – cpe
Lab 1B – ELISA

WHO/BS/2012.2190
Page 55
Table 38 VN - Potency relative to Sample F by Virus (IU): Sample E
Sample E
Lab X179A X181 A/Cal/7/09 A/ChCh/16/10 NIBRG121 GMT
1A -ve 535 168
1B 42 38 40
2 71 60 65
3 49 56 321 96
4
5 150 150
6 75 75
7 60 60
8 119 119
9
10 -ve -ve -ve
11 -ve -ve
12 300 300 300
13 173 173
14 52 52
15 -ve -ve -ve
16 2400 2400 2400
17 56 -ve 49
18A 136 150 143
18B -ve -ve -ve
Overall Excluding 16
37 28 48
Overall Excl 15 & 16
43 34 55
%GCV Excluding 16
%GCV Excl 15 & 16
Lab 1A – cpe
Lab 1B – ELISA

WHO/BS/2012.2190
Page 56
Table 39 VN - Potency relative to Sample F by Virus (IU): 09/194
09/194
Lab X179A X181 A/Cal/7/09 A/ChCh/16/10 NIBRG121 GMT
1A 3024 7625 4802
1B 1347 1069 1200
2 1200 1200 1200
3 1013 901 5744 1737
4
5 16145 16145
6 1200 1200
7 1697 1697
8 2400 2400
9
10 2028 1430 1561
11 1905 1905
12 2400 2400 2400
13 2936 2936
14 1369 1369
15 24190 30478 26127
16 2400 4800 3394
17 1173 1346 1258
18A 1905 2400 2138
18B 1905 1905 1905
Overall Excluding 16
2031 2327 2432
Overall Excl 15 & 16
1678 1799 2096
%GCV Excluding 16
%GCV Excl 15 & 16
Lab 1A – cpe
Lab 1B – ELISA

WHO/BS/2012.2190
Page 57
Table 40 – Stability Studies for 10/202. Titres (HI and VN) after 18 months
storage at elevated temperatures
HI VN
Run 1 2 3 GMT 1 2 3 GMT
Temperature
-150˚C 320 320 320 320 184 267 266 236
-70˚C 320 640 640 508 335 329 177 269
-20˚C 640 640 320 508 200 215 236 217
+4˚C 320 320 320 320 233 187 228 215
+20˚C 320 320 160 254 194 216 231 213
+37˚C 320 320 320 320 145 134 124 134

WHO/BS/2012.2190
Page 58
Figure legends
Figure 1 Histograms showing the distribution of geometric mean titres across laboratories.
Each box represents the GMT for one laboratory, and is labelled with the laboratory code
number. Results for X179A are shown in white, and for X181 in light grey. The results for
A/Chch, NIBRG-121 and the wild type A/California virus are all shown in dark grey. The results
for the HI and VN tests are shown side by side. The respective titres relative to 09/194 are shown
below the absolute titres.
Figure 2 Histograms showing the distribution of geometric mean titres across laboratories.
Each box represents the GMT for one laboratory, and is labelled with the laboratory code
number. Results for X179A are shown in white, and for X181 in light grey. The results for
A/Chch, NIBRG-121 and the wild type A/California virus are all shown in dark grey. The results
for the HI and VN tests are shown side by side. The respective titres relative to sample F (10/202
the candidate replacement for IS 09/194) are shown below the absolute titres.

WHO/BS/2012.2190
Page 59
Figure 1: Sample B
Sample B - Absolute HI titres
0
1
2
3
4
5
6
7
8
9
10
11
12
13
14
15
16
17
18
19
20
21
22
23
24
25
26
27
28
29
30
HI Titre
-ve 10 20 40 80 160 320 640 1280 2560 5120 10240
06
15
05
15
17 05
02
05
11
13
17
01
05
11
08
03
01
03
07
09
12
18
02
03
09
12
18
04
10
14
10
16
16
X 179A X 181 O ther V iruses
Sample B - Absolute VN titres
0
1
2
3
4
5
6
7
8
9
10
11
12
13
14
15
16
17
18
19
20
21
22
23
24
25
26
27
28
29
30
VN Titre
-ve 10 20 40 80 160 320 640 1280 2560 5120 10240
05
15
10
10
11
15
06
12
17
12
17
08
18B
03
18B
03
01B
03
07
01A
02
13
14
16
18A
01A
01B
02
18A
16
X 179A X 181 O ther V iruses
Sample B - HI relative to 09/194 (IU)
0
1
2
3
4
5
6
7
8
9
10
11
12
13
14
15
16
17
18
19
20
21
22
23
24
25
26
27
28
29
30
HI relative to 09/194 in IU
-ve 10 20 40 80 160 320 640 1280 2560 5120 10240
06
15
05 05
08
03
03
05
07
11
12
14
03
05
11
12
01
04
09
10
13
17
18
01
09
15
18
02
02
10
17
16 16
X 179A X 181 O ther V iruses
Sample B - VN relative to 09/194 (IU)
0
1
2
3
4
5
6
7
8
9
10
11
12
13
14
15
16
17
18
19
20
21
22
23
24
25
26
27
28
29
30
VN relative to 09/194 in IU
-ve 10 20 40 80 160 320 640 1280 2560 5120 10240
05 15 01B
02
03
06
07
10
14
15
01B
10
11
08
03
17
02
03
17
18A
12
13
18A
18B
01A
12
18B
01A
16
16
X 179A X 181 O ther V iruses
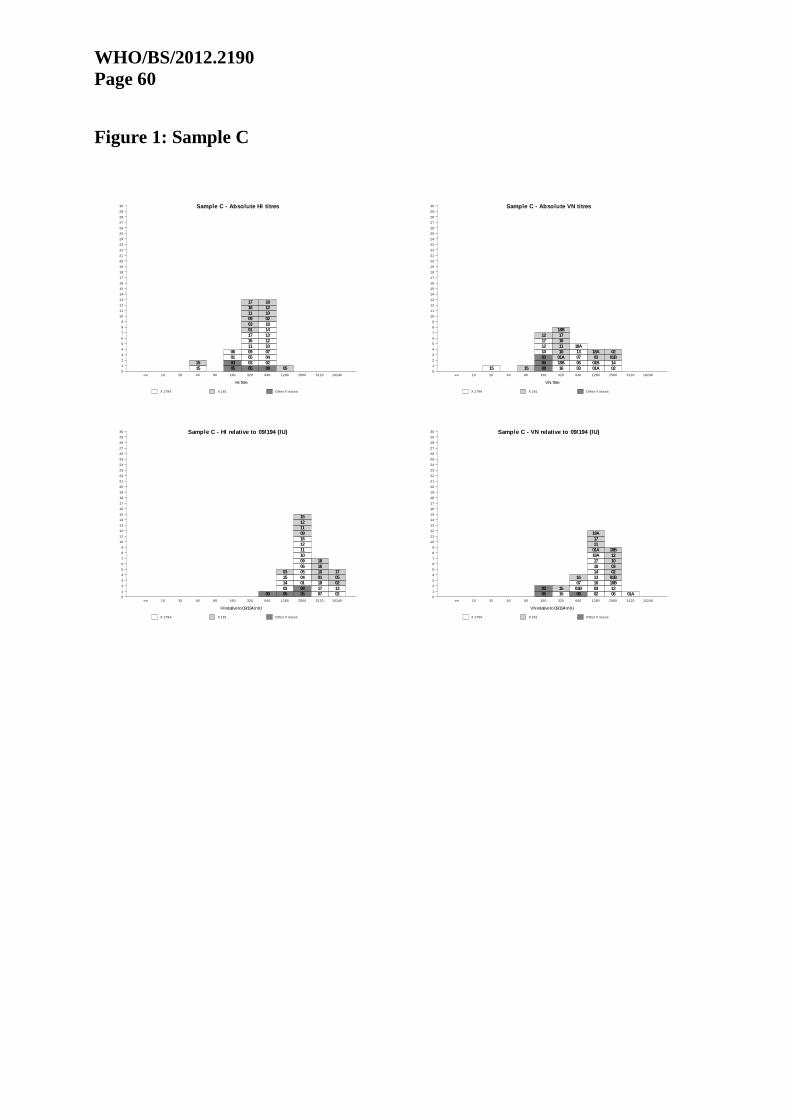
WHO/BS/2012.2190
Page 60
Figure 1: Sample C
Sample C - Absolute HI titres
0
1
2
3
4
5
6
7
8
9
10
11
12
13
14
15
16
17
18
19
20
21
22
23
24
25
26
27
28
29
30
HI Titre
-ve 10 20 40 80 160 320 640 1280 2560 5120 10240
15
15
05
03
01
06
05
03
05
09
11
16
17
01
03
09
11
16
17
08
02
04
07
10
12
13
14
18
02
10
12
18
05
X 179A X 181 O ther V iruses
Sample C - Absolute VN titres
0
1
2
3
4
5
6
7
8
9
10
11
12
13
14
15
16
17
18
19
20
21
22
23
24
25
26
27
28
29
30
VN Titre
-ve 10 20 40 80 160 320 640 1280 2560 5120 10240
15 15 08
05
03
10
12
17
12
16
18B
01A
10
11
16
17
18B
03
06
07
13
18A
01A
01B
03
18A
02
14
01B
02
X 179A X 181 O ther V iruses
Sample C - HI relative to 09/194 (IU)
0
1
2
3
4
5
6
7
8
9
10
11
12
13
14
15
16
17
18
19
20
21
22
23
24
25
26
27
28
29
30
HI relative to 09/194 in IU
-ve 10 20 40 80 160 320 640 1280 2560 5120 10240
03 05
03
14
15
03
05
08
01
04
05
06
09
10
11
12
16
09
11
12
15
07
17
18
01
10
16
18
02
13
02
05
17
X 179A X 181 O ther V iruses
Sample C - VN relative to 09/194 (IU)
0
1
2
3
4
5
6
7
8
9
10
11
12
13
14
15
16
17
18
19
20
21
22
23
24
25
26
27
28
29
30
VN relative to 09/194 in IU
-ve 10 20 40 80 160 320 640 1280 2560 5120 10240
05
03
15
15
08
01B
07
16
02
03
10
13
14
16
17
18A
01A
11
17
18A
06
12
18B
01B
02
03
10
12
18B
01A
X 179A X 181 O ther V iruses
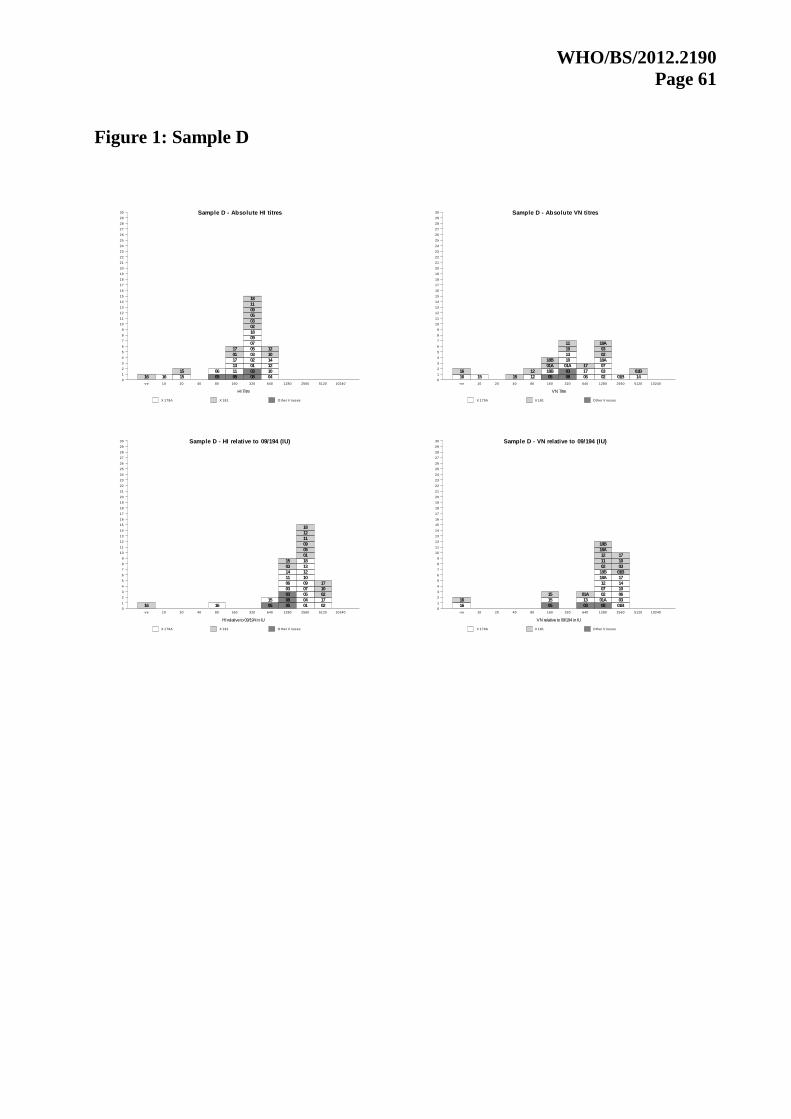
WHO/BS/2012.2190
Page 61
Figure 1: Sample D
Sample D - Absolute HI titres
0
1
2
3
4
5
6
7
8
9
10
11
12
13
14
15
16
17
18
19
20
21
22
23
24
25
26
27
28
29
30
HI Titre
-ve 10 20 40 80 160 320 640 1280 2560 5120 10240
16 16 15
15
05
06
05
11
13
17
01
17
08
03
01
02
03
05
07
09
18
02
03
05
09
11
18
04
10
12
14
10
12
X 179A X 181 O ther V iruses
Sample D - Absolute VN titres
0
1
2
3
4
5
6
7
8
9
10
11
12
13
14
15
16
17
18
19
20
21
22
23
24
25
26
27
28
29
30
VN Titre
-ve 10 20 40 80 160 320 640 1280 2560 5120 10240
16
16
15 15 12
12
05
18B
01A
18B
08
03
01A
10
13
10
11
06
17
17
02
03
07
18A
02
03
18A
01B 14
01B
X 179A X 181 O ther V iruses
Sample D - HI relative to 09/194 (IU)
0
1
2
3
4
5
6
7
8
9
10
11
12
13
14
15
16
17
18
19
20
21
22
23
24
25
26
27
28
29
30
HI relative to 09/194 in IU
-ve 10 20 40 80 160 320 640 1280 2560 5120 10240
16 16 05
15
05
08
03
03
06
11
14
03
15
01
04
05
07
09
10
12
13
18
01
05
09
11
12
18
02
17
02
10
17
X 179A X 181 O ther V iruses
Sample D - VN relative to 09/194 (IU)
0
1
2
3
4
5
6
7
8
9
10
11
12
13
14
15
16
17
18
19
20
21
22
23
24
25
26
27
28
29
30
VN relative to 09/194 in IU
-ve 10 20 40 80 160 320 640 1280 2560 5120 10240
16
16
05
15
15
03
13
01A
08
01A
02
07
12
18A
18B
02
11
12
18A
18B
01B
03
06
10
14
17
01B
03
10
17
X 179A X 181 O ther V iruses

WHO/BS/2012.2190
Page 62
Figure 1: Sample E
Sample E - Absolute HI titres
0
1
2
3
4
5
6
7
8
9
10
11
12
13
14
15
16
17
18
19
20
21
22
23
24
25
26
27
28
29
30
HI Titre
-ve 10 20 40 80 160 320 640 1280 2560 5120 10240
06
11
13
15
17
18
01
05
11
15
17
18
05
08
05
01
02
05
09
10
02
03
09
10
03
03
04
14
07
12
12
16
16
X 179A X 181 O ther V iruses
Sample E - Absolute VN titres
0
1
2
3
4
5
6
7
8
9
10
11
12
13
14
15
16
17
18
19
20
21
22
23
24
25
26
27
28
29
30
VN Titre
-ve 10 20 40 80 160 320 640 1280 2560 5120 10240
01A
10
15
10
11
15
05
12
17
18B
12
17
18B
08
06
01B
03
13
01A
03
03
02
07
18A
01B
02
18A
14 16
16
X 179A X 181 O ther V iruses
Sample E - HI relative to 09/194 (IU)
0
1
2
3
4
5
6
7
8
9
10
11
12
13
14
15
16
17
18
19
20
21
22
23
24
25
26
27
28
29
30
HI relative to 09/194 in IU
-ve 10 20 40 80 160 320 640 1280 2560 5120 10240
06
11
13
15
17
18
01
05
11
15
17
18
08
10
14
03
05
05
03
01
03
04
05
09
09
10
02
12
02
12
07 16 16
X 179A X 181 O ther V iruses
Sample E - VN relative to 09/194 (IU)
0
1
2
3
4
5
6
7
8
9
10
11
12
13
14
15
16
17
18
19
20
21
22
23
24
25
26
27
28
29
30
VN relative to 09/194 in IU
-ve 10 20 40 80 160 320 640 1280 2560 5120 10240
01A
10
15
18B
10
11
15
17
18B
05 01B
07
14
01B
08
03
02
03
06
13
17
18A
01A
02
03
18A
12
12
16 16
X 179A X 181 O ther V iruses
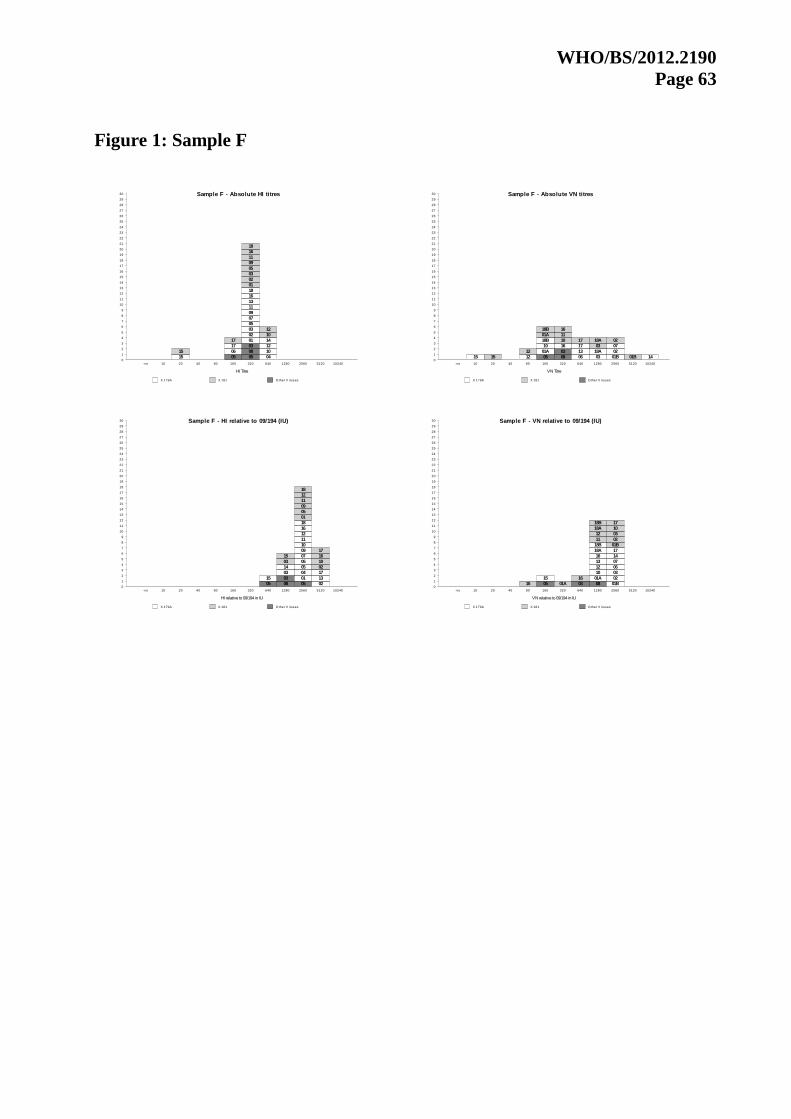
WHO/BS/2012.2190
Page 63
Figure 1: Sample F
Sample F - Absolute HI titres
0
1
2
3
4
5
6
7
8
9
10
11
12
13
14
15
16
17
18
19
20
21
22
23
24
25
26
27
28
29
30
HI Titre
-ve 10 20 40 80 160 320 640 1280 2560 5120 10240
15
15
05
06
17
17
05
08
03
01
02
03
05
07
09
11
13
16
18
01
02
03
05
09
11
16
18
04
10
12
14
10
12
X 179A X 181 O ther V iruses
Sample F - Absolute VN titres
0
1
2
3
4
5
6
7
8
9
10
11
12
13
14
15
16
17
18
19
20
21
22
23
24
25
26
27
28
29
30
VN Titre
-ve 10 20 40 80 160 320 640 1280 2560 5120 10240
15 15 12
12
05
01A
10
18B
01A
18B
08
03
16
10
11
16
06
13
17
17
03
18A
03
18A
01B
02
07
02
01B 14
X 179A X 181 O ther V iruses
Sample F - HI relative to 09/194 (IU)
0
1
2
3
4
5
6
7
8
9
10
11
12
13
14
15
16
17
18
19
20
21
22
23
24
25
26
27
28
29
30
HI relative to 09/194 in IU
-ve 10 20 40 80 160 320 640 1280 2560 5120 10240
05
15
08
03
03
14
03
15
05
01
04
05
06
07
09
10
11
12
16
18
01
05
09
11
12
18
02
13
17
02
10
16
17
X 179A X 181 O ther V iruses
Sample F - VN relative to 09/194 (IU)
0
1
2
3
4
5
6
7
8
9
10
11
12
13
14
15
16
17
18
19
20
21
22
23
24
25
26
27
28
29
30
VN relative to 09/194 in IU
-ve 10 20 40 80 160 320 640 1280 2560 5120 10240
15 05
15
01A 03
16
08
01A
10
12
13
16
18A
18B
11
12
18A
18B
01B
02
03
06
07
14
17
01B
02
03
10
17
X 179A X 181 O ther V iruses

WHO/BS/2012.2190
Page 64
Figure 1: 09/194
09/194 - Absolute HI titres
0
1
2
3
4
5
6
7
8
9
10
11
12
13
14
15
16
17
18
19
20
21
22
23
24
25
26
27
28
29
30
HI Titre
-ve 10 20 40 80 160 320 640 1280 2560 5120 10240
15
15
17 02
06
13
17
01
02
16
05
05
01
05
07
09
11
16
18
03
05
09
10
11
18
08
03
03
04
10
12
12
14
X 179A X 181 O ther V iruses
09/194 - Absolute VN titres
0
1
2
3
4
5
6
7
8
9
10
11
12
13
14
15
16
17
18
19
20
21
22
23
24
25
26
27
28
29
30
VN Titre
-ve 10 20 40 80 160 320 640 1280 2560 5120 10240
12
12
10
15
18B
10
18B
08
01A
06
16
17
11
15
17
03
13
18A
01A
03
16
05
03
01B
02
07
01B
02
18A
14
X 179A X 181 O ther V iruses

WHO/BS/2012.2190
Page 65
Figure 2: Sample B
Sample B - Absolute HI titres
0
1
2
3
4
5
6
7
8
9
10
11
12
13
14
15
16
17
18
19
20
21
22
23
24
25
26
27
28
29
30
HI Titre
-ve 10 20 40 80 160 320 640 1280 2560 5120 10240
06
15
05
15
17 05
02
05
11
13
17
01
05
11
08
03
01
03
07
09
12
18
02
03
09
12
18
04
10
14
10
16
16
X 179A X 181 O ther V iruses
Sample B - Absolute VN titres
0
1
2
3
4
5
6
7
8
9
10
11
12
13
14
15
16
17
18
19
20
21
22
23
24
25
26
27
28
29
30
VN Titre
-ve 10 20 40 80 160 320 640 1280 2560 5120 10240
05
15
10
10
11
15
06
12
17
12
17
08
18B
03
18B
03
01B
03
07
01A
02
13
14
16
18A
01A
01B
02
18A
16
X 179A X 181 O ther V iruses
Sample B - HI relative to sample F (IU)
0
1
2
3
4
5
6
7
8
9
10
11
12
13
14
15
16
17
18
19
20
21
22
23
24
25
26
27
28
29
30
HI relative to sample F in IU
-ve 10 20 40 80 160 320 640 1280 2560 5120 10240
06
15
05
05
02
05
11
12
13
17
01
05
11
12
17
08
03
01
03
04
07
09
10
14
18
02
03
09
10
18
15 16
16
X 179A X 181 O ther V iruses
Sample B - VN relative to sample F (IU)
0
1
2
3
4
5
6
7
8
9
10
11
12
13
14
15
16
17
18
19
20
21
22
23
24
25
26
27
28
29
30
VN relative to sample F in IU
-ve 10 20 40 80 160 320 640 1280 2560 5120 10240
05
01B
02
03
06
07
14
17
01B
03
11
10
02
10
17
08
18A
18B
18A
03
12
13
12
18B
01A
15
16
01A
15
16
X 179A X 181 O ther V iruses
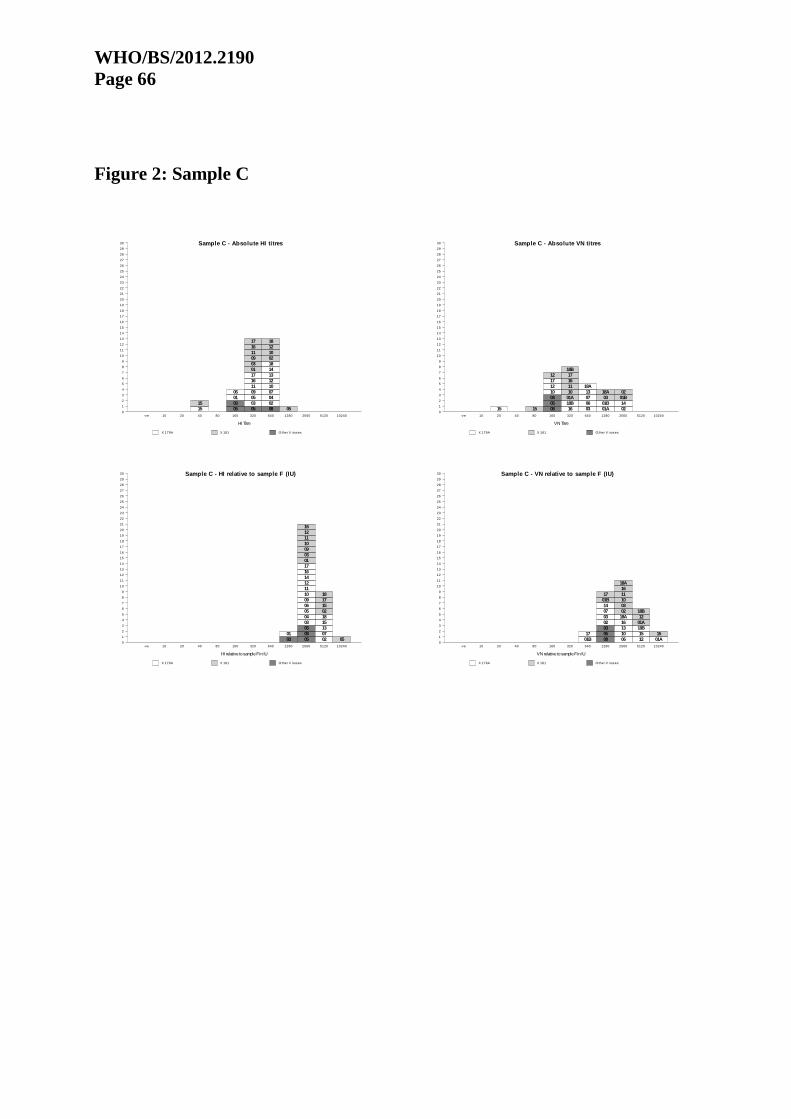
WHO/BS/2012.2190
Page 66
Figure 2: Sample C
Sample C - Absolute HI titres
0
1
2
3
4
5
6
7
8
9
10
11
12
13
14
15
16
17
18
19
20
21
22
23
24
25
26
27
28
29
30
HI Titre
-ve 10 20 40 80 160 320 640 1280 2560 5120 10240
15
15
05
03
01
06
05
03
05
09
11
16
17
01
03
09
11
16
17
08
02
04
07
10
12
13
14
18
02
10
12
18
05
X 179A X 181 O ther V iruses
Sample C - Absolute VN titres
0
1
2
3
4
5
6
7
8
9
10
11
12
13
14
15
16
17
18
19
20
21
22
23
24
25
26
27
28
29
30
VN Titre
-ve 10 20 40 80 160 320 640 1280 2560 5120 10240
15 15 08
05
03
10
12
17
12
16
18B
01A
10
11
16
17
18B
03
06
07
13
18A
01A
01B
03
18A
02
14
01B
02
X 179A X 181 O ther V iruses
Sample C - HI relative to sample F (IU)
0
1
2
3
4
5
6
7
8
9
10
11
12
13
14
15
16
17
18
19
20
21
22
23
24
25
26
27
28
29
30
HI relative to sample F in IU
-ve 10 20 40 80 160 320 640 1280 2560 5120 10240
03
01
05
08
05
03
04
05
06
09
10
11
12
14
16
17
01
03
09
10
11
12
16
02
07
13
15
18
02
15
17
18
05
X 179A X 181 O ther V iruses
Sample C - VN relative to sample F (IU)
0
1
2
3
4
5
6
7
8
9
10
11
12
13
14
15
16
17
18
19
20
21
22
23
24
25
26
27
28
29
30
VN relative to sample F in IU
-ve 10 20 40 80 160 320 640 1280 2560 5120 10240
01B
17
08
05
03
02
03
07
14
01B
17
06
10
13
16
18A
02
03
10
11
16
18A
12
15
18B
01A
12
18B
01A
15
X 179A X 181 O ther V iruses

WHO/BS/2012.2190
Page 67
Figure 2: Sample D
Sample D - Absolute HI titres
0
1
2
3
4
5
6
7
8
9
10
11
12
13
14
15
16
17
18
19
20
21
22
23
24
25
26
27
28
29
30
HI Titre
-ve 10 20 40 80 160 320 640 1280 2560 5120 10240
16 16 15
15
05
06
05
11
13
17
01
17
08
03
01
02
03
05
07
09
18
02
03
05
09
11
18
04
10
12
14
10
12
X 179A X 181 O ther V iruses
Sample D - Absolute VN titres
0
1
2
3
4
5
6
7
8
9
10
11
12
13
14
15
16
17
18
19
20
21
22
23
24
25
26
27
28
29
30
VN Titre
-ve 10 20 40 80 160 320 640 1280 2560 5120 10240
16
16
15 15 12
12
05
18B
01A
18B
08
03
01A
10
13
10
11
06
17
17
02
03
07
18A
02
03
18A
01B 14
01B
X 179A X 181 O ther V iruses
Sample D - HI relative to sample F (IU)
0
1
2
3
4
5
6
7
8
9
10
11
12
13
14
15
16
17
18
19
20
21
22
23
24
25
26
27
28
29
30
HI relative to sample F in IU
-ve 10 20 40 80 160 320 640 1280 2560 5120 10240
16 16 05
06
11
01
08
05
03
01
02
03
04
05
07
09
10
12
13
14
15
17
18
02
03
05
09
10
11
12
15
17
18
X 179A X 181 O ther V iruses
Sample D - VN relative to sample F (IU)
0
1
2
3
4
5
6
7
8
9
10
11
12
13
14
15
16
17
18
19
20
21
22
23
24
25
26
27
28
29
30
VN relative to sample F in IU
-ve 10 20 40 80 160 320 640 1280 2560 5120 10240
16
16
02
07
13
02
08
05
03
01A
01B
03
06
10
12
14
15
17
18A
18B
01A
01B
03
10
11
12
17
18A
18B
15
X 179A X 181 O ther V iruses

WHO/BS/2012.2190
Page 68
Figure 2: Sample E
Sample E - Absolute HI titres
0
1
2
3
4
5
6
7
8
9
10
11
12
13
14
15
16
17
18
19
20
21
22
23
24
25
26
27
28
29
30
HI Titre
-ve 10 20 40 80 160 320 640 1280 2560 5120 10240
06
11
13
15
17
18
01
05
11
15
17
18
05
08
05
01
02
05
09
10
02
03
09
10
03
03
04
14
07
12
12
16
16
X 179A X 181 O ther V iruses
Sample E - Absolute VN titres
0
1
2
3
4
5
6
7
8
9
10
11
12
13
14
15
16
17
18
19
20
21
22
23
24
25
26
27
28
29
30
VN Titre
-ve 10 20 40 80 160 320 640 1280 2560 5120 10240
01A
10
15
10
11
15
05
12
17
18B
12
17
18B
08
06
01B
03
13
01A
03
03
02
07
18A
01B
02
18A
14 16
16
X 179A X 181 O ther V iruses
Sample E - HI relative to sample F (IU)
0
1
2
3
4
5
6
7
8
9
10
11
12
13
14
15
16
17
18
19
20
21
22
23
24
25
26
27
28
29
30
HI relative to sample F in IU
-ve 10 20 40 80 160 320 640 1280 2560 5120 10240
06
11
13
15
17
18
01
05
11
15
17
18
10
10
05
08
01
02
04
05
09
14
02
03
09
03
03
12
12
05
07
16
16
X 179A X 181 O ther V iruses
Sample E - VN relative to sample F (IU)
0
1
2
3
4
5
6
7
8
9
10
11
12
13
14
15
16
17
18
19
20
21
22
23
24
25
26
27
28
29
30
VN relative to sample F in IU
-ve 10 20 40 80 160 320 640 1280 2560 5120 10240
01A
10
15
18B
10
11
15
17
18B
01B
03
14
17
01B
03
02
06
07
02
08
05
13
18A
18A
03
12
12
01A 16
16
X 179A X 181 O ther V iruses

WHO/BS/2012.2190
Page 69
Figure 2: 09/194
09/194 - Absolute HI titres
0
1
2
3
4
5
6
7
8
9
10
11
12
13
14
15
16
17
18
19
20
21
22
23
24
25
26
27
28
29
30
HI Titre
-ve 10 20 40 80 160 320 640 1280 2560 5120 10240
15
15
17 02
06
13
17
01
02
16
05
05
01
05
07
09
11
16
18
03
05
09
10
11
18
08
03
03
04
10
12
12
14
X 179A X 181 O ther V iruses
09/194 - Absolute VN titres
0
1
2
3
4
5
6
7
8
9
10
11
12
13
14
15
16
17
18
19
20
21
22
23
24
25
26
27
28
29
30
VN Titre
-ve 10 20 40 80 160 320 640 1280 2560 5120 10240
12
12
10
15
18B
10
18B
08
01A
06
16
17
11
15
17
03
13
18A
01A
03
16
05
03
01B
02
07
01B
02
18A
14
X 179A X 181 O ther V iruses
09/194 - HI relative to sample F (IU)
0
1
2
3
4
5
6
7
8
9
10
11
12
13
14
15
16
17
18
19
20
21
22
23
24
25
26
27
28
29
30
HI relative to sample F in IU
-ve 10 20 40 80 160 320 640 1280 2560 5120 10240
02
13
17
02
10
16
17
05
01
04
05
06
07
09
10
11
12
16
18
01
05
09
11
12
18
08
03
03
14
03
15
05
15
X 179A X 181 O ther V iruses
09/194 - VN relative to sample F (IU)
0
1
2
3
4
5
6
7
8
9
10
11
12
13
14
15
16
17
18
19
20
21
22
23
24
25
26
27
28
29
30
VN relative to sample F in IU
40 80 160 320 640 1280 2560 5120 10240 20480 40960 81920
03 01B
02
03
06
07
14
17
01B
02
10
17
08
01A
10
12
13
16
18A
18B
11
12
18A
18B
03
16
01A 05
15
15
X 179A X 181 O ther V iruses

WHO/BS/2012.2190
Page 70
Figure 2: Sample F (10/202)
Sample F - Absolute HI titres
0
1
2
3
4
5
6
7
8
9
10
11
12
13
14
15
16
17
18
19
20
21
22
23
24
25
26
27
28
29
30
HI Titre
-ve 10 20 40 80 160 320 640 1280 2560 5120 10240
15
15
05
06
17
17
05
08
03
01
02
03
05
07
09
11
13
16
18
01
02
03
05
09
11
16
18
04
10
12
14
10
12
X 179A X 181 O ther V iruses
Sample F - Absolute VN titres
0
1
2
3
4
5
6
7
8
9
10
11
12
13
14
15
16
17
18
19
20
21
22
23
24
25
26
27
28
29
30
VN Titre
-ve 10 20 40 80 160 320 640 1280 2560 5120 10240
15 15 12
12
05
01A
10
18B
01A
18B
08
03
16
10
11
16
06
13
17
17
03
18A
03
18A
01B
02
07
02
01B 14
X 179A X 181 O ther V iruses
WHO/BS/2012.2190
Page 71
Appendix 1 Participants
Yan Li
Canadian Science Centre
Influenza and Respiratory Viruses
1015 Arlington
Winnipeg
R3E 3R2
Canada
Irma Lopez Martinez
Instituto de Diagnostico y Referencia
Department of Virology
Carpio 470
Col. Santo Tomas
Del. Miguel Hidalgo
Mexico D.F. 11340
Mexico
Kathy Hancock
WHO Collaborating Centre for Influenza,
Centers for Disease Control
Influenza Branch
Mailstop G-16, 1600 Clifton Road
Atlanta,, GA 30333
USA
Monica Malone McNeal
Cincinnati Children’s Hospital Medical Center
Division of Infectious Diseases
619 Oak Street, Room 2803
Cincinnati, OH 45206
USA
Wayne Hogrefe/Keith Gottlieb
Focus Diagnostics, Inc.
5785 Corporate Avenue
Cypress, California 90630
USA
Jerry Weir/Falko Schmeisser
Chief, Division of Viral Products
Center for Biologics Evaluation and Research
US Food and Drug Administration
1401 Rockville Pike
Rockville
Maryland 20852
USA

WHO/BS/2012.2190
Page 72
Stephen W. Hildreth
Senior Director
Global Clinical Immunology
sanofi pasteur
Discovery Drive
Building 53
Swiftwater, PA 18370
USA
Wilina Lim/Janice Lo
Virology Division
9/F Public Health Laboratory Centre
382 Nam Cheong Street, Shek Kip Mei
Kowloon, Hong Kong, SAR
China
Pilaipan Puthavathana
Dept of Microbiology, Faculty of Medicine
Siriraj Hospital
Mahidol University
Bangkok
Thailand
Robert Shaw/Ian Barr
WHO Influenza Centre for Influenza
45 Poplar Road,
Parkville
Melbourne, 3052
Australia.
Sue Huang
Head, WHO National Influenza Centre
Institute of Environmental Science and Research
66 Ward Street,
Wallaceville,
Upper Hutt 5018 PO Box 40158,
Upper Hutt 5140,
New Zealand
Thomas R. Kriel
Senior Director, Viral Vaccines & Global pathogen Safety
Baxter BioScience
Biomedical Research Center
Uferstrasse 15
A-2304 Orth/Donau
Austria

WHO/BS/2012.2190
Page 73
Roger Bernhard
Manager Serology
GlaxoSmithKline Biologicals
Branch of SmithKline
Zirkusstrasse 40
D-01069 Dresden
Germany
Nikolaos Gaitatzis
Novartis Vaccines and Diagnostics
Emil-von-Behring-Str. 76
Clinical Serology
35041 Marburg
Germany
Emanuele Montomoli
Prof. of Public Health
Dept. of Physiopathology Experimental Medicine and Public Health
University of Siena
Via Aldo Moro 3
53100 Siena
Italy
John Macauley/Rod Daniels
WHO Collaborating Centre for Influenza
National Institute for Medical Research,
The Ridgeway
Mill Hill
London NW7
UK
Katja Höschler
Respiratory Virus Unit
Virus Reference Department
Health Protection Agency
Microbiology Services (Colindale)
61 Colindale Avenue
London
NW9 5HT
UK
Diane Major
National Insitute for Biological Standards and Control
Blanche Lane
South Mimms
Potters Bar
Herts EN6 3QG
UK
WHO/BS/2012.2190
Page 74
Appendix 2 Draft Instructions for Use

WHO/BS/2012.2190
Page 75
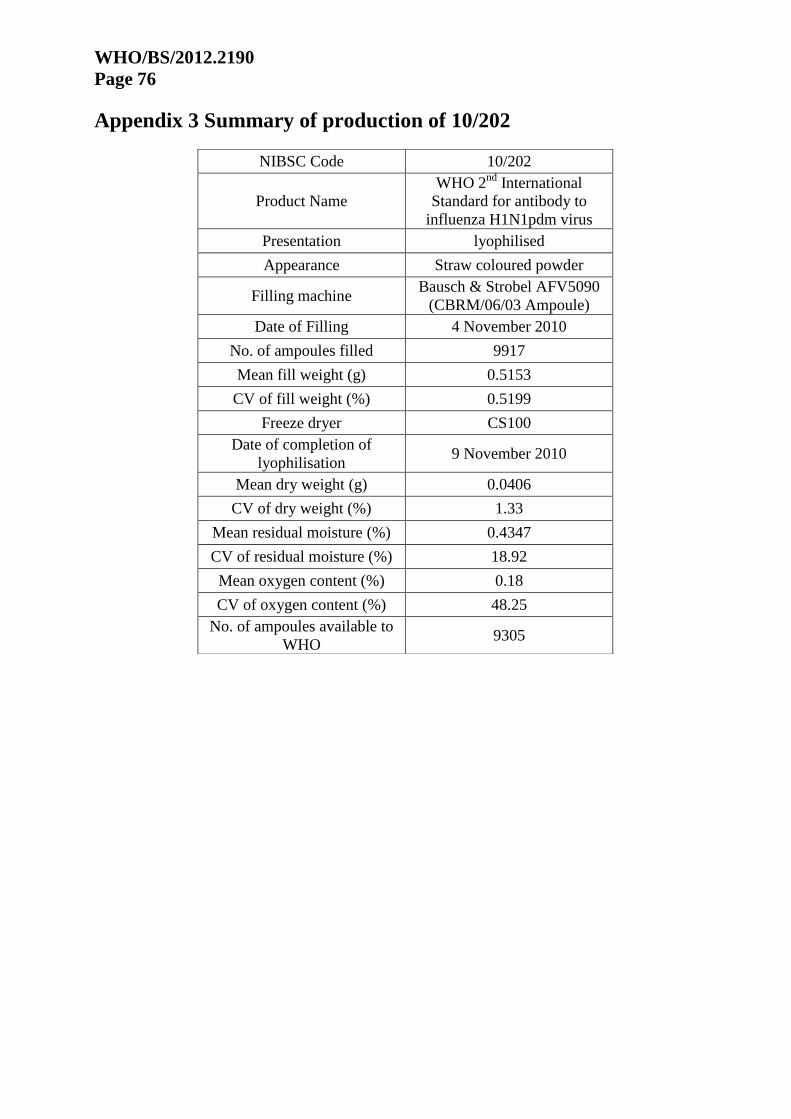
WHO/BS/2012.2190
Page 76
Appendix 3 Summary of production of 10/202
NIBSC Code 10/202
Product Name
WHO 2nd
International
Standard for antibody to
influenza H1N1pdm virus
Presentation lyophilised
Appearance Straw coloured powder
Filling machine Bausch & Strobel AFV5090
(CBRM/06/03 Ampoule)
Date of Filling 4 November 2010
No. of ampoules filled 9917
Mean fill weight (g) 0.5153
CV of fill weight (%) 0.5199
Freeze dryer CS100
Date of completion of
lyophilisation 9 November 2010
Mean dry weight (g) 0.0406
CV of dry weight (%) 1.33
Mean residual moisture (%) 0.4347
CV of residual moisture (%) 18.92
Mean oxygen content (%) 0.18
CV of oxygen content (%) 48.25
No. of ampoules available to
WHO 9305