Embed Size (px)
Citation preview
MPRAMunich Personal RePEc Archive
Who Owns the Largest Firms Aroundthe World?
Paulo Alves and Miguel Ferreira
2008
Online at http://mpra.ub.uni-muenchen.de/52355/MPRA Paper No. 52355, posted 20. December 2013 16:19 UTC
1
Who Owns the Largest Firms Around the World?
Abstract
In this research-paper we evaluate how corporate control around the world is defined and which variables, related
to a firm's characteristics and the countries' infrastructures, influence this. We find that there is a small number of
countries where firms are widely held. The role of financial institutions seems to be different in civil and common
law-based countries. While they seem to act as a monitor of management in common law-based countries, in civil
law countries they act as a monitor of large shareholders. Finally, we find that firm's size is the most important
determinant of ultimate owners.

2
1. Introduction
Corporate ownership around the world is a present-day debate in finance. Concurrently, there is a connection
between corporate control, corporate governance, and agency costs. Whereas there is a conflict of interests
between shareholders and management in widely held firms (see Berle and Means (1932) and Jensen and
Meckling (1976)), there is another type of agency cost, with different players, when the expropriation of wealth
occurs between minority shareholders and a larger block shareholder that simultaneously controls management
and tries to expropriate wealth from minority shareholders. When that is the case, the private benefits of large
shareholders are higher than the costs of monitoring the management, and this is the reason why management and
large shareholders have the same interests. Bebchuk (1999) develops a theory whereby the founders of public
companies maintain a lock on control, because their private benefits are valuable enough to be captured by rivals.
On the other hand, when corporate ownership is diffused, private benefits are not significant enough and the free
rider problem concerning management monitoring will subsist (Shleifer and Vishny (1986).
Recently, the discussion regarding the main forces that influence corporate ownership has been focused
either on law and finance or on political economy. The influence of the legal system on shareholder rights
standards is well documented (La Porta et al (1998) and Stulz and Williamsom (2003), for example). Common
law-based countries, such as the US, offer higher shareholder protection, and consequently a larger blockholder is
less necessary because the smaller ones are well protected. In fact, under those conditions, insiders have fewer
opportunities to expropriate wealth from outsiders (La Porta et al (2000)). Corporate ownership is not only
influenced by law, but also by political economy. Roe (2000), for example, defend this point of view.
Furthermore, ignoring the importance of political economy can sometimes produce biased conclusions. For
example, following the Great Depression and the consequent collapse of Italian investment banks, plus the dawn
of the Fascist regime, the influence of the government on industrial companies increased, and consequently an
undeveloped capital market emerged, with low investor protection. This explains why in the post-war period the
Italian companies were family-owned. A similar event occurred in Portugal. After the Revolution of 1974, banks
and industrial firms were nationalised, the stock exchange closed, and many investors lost their investments. When
the companies were privatised at the end of the 80’s some were returned to the old owners whereas others
remained in the hands of the government, even after they went public. Is it possible not to consider the consulate
of Margaret Thatcher as regards to capital market development - namely through her privatisation decisions,
3
creating the popular capitalism -, and consequently its importance in terms of the changes in corporate ownership
of UK firms?
The perennial work of Berle and Means (1932), “The Modern Corporation and Private Property”,
characterised the corporate ownership of the US firms as widely held by small shareholders, although the
management has the control of the firm. This can be explained not only by the high standards of investor
protection offered by the US legal system, but also by the low intervention of the government in private business.
Nevertheless, according to several theorists, this result can not be extended to the rest of the world. According to
Faccio and Lang (2002), based on a sample of Western European firms, show that ownership is not homogeneous.
Their results reveal a large number of widely held firms in the UK and Ireland, in comparison to continental
Europe. They also show that the smallest firms and the industrial firms are more family-owned than financial
institutions, and in some countries the state plays a decisive role in the biggest firms. Claessens et al (2000), using
a sample of 2,980 East Asian companies from 9 countries, show how firms from that region are largely family-
owned (Japanese firms are an exception), as well as how corporate wealth is in the hands of a few families.
Likewise, Majluf et al (1998) and Valadares and Leal (2000) show, either for Chile or for Brazil respectively, how
representative the largest shareholders in the firms of those countries are. La Porta et al (1999) confirm the idea
that in countries with higher antidirector rights, namely in the US, in which investors are well protected, the
corporate ownership is widely held. On the contrary, they also show that countries with low shareholder
protection, in which the state interferes in private business, the largest firms are more family-owned, the voting
rights are separate from the cash flow rights, namely through multiple classes of stock, cross-shareholdings, and
pyramidal structures, and the ownership is less diffused. More recently, Holderness (2005), based on a sample of
23 countries, refused the idea that corporate ownership in US firms is more diffused than in other countries
because the largest shareholders in US firms act as managers, not as monitors, and consequently the level of
investor protection cannot be the explanation for corporate ownership concentration.
The main objective of our paper is to evaluate if there is a clear relationship between shareholder rights
and corporate ownership and, on the other hand, if other country-level variables such as disclosure level,
corruption standards, or size of local financial industry, produce more powerful results to explain corporate
ownership.
In this research we found a small number of countries like Australia, the UK and the US, where corporate
ownership is widely diffused. The results obtained in this research paper point out that threshold influence the

4
percentage of widely held firms. We found 15.9% and 39.5% of widely held firms, on average by country, for 5%
and 20% threshold respectively. Prior results are dependent of the large number of firms whose ultimate owners
are financial institutions at 5% threshold, but not at 20%. This occurs in common law-based countries and in
countries where the quality of enforcement presents higher standards. It seems that financial institutions act as a
monitor of management. In civil-law based countries, on the contrary, financial institutions act as a monitor of a
larger shareholder that is simultaneously the management. Finally, the particularity of each country makes it
difficult to find macro variables as determinants of ultimate owners. As a matter of fact, and contrarily to block
holdings, we only found in firm’s size statistical significance as determinant of the ultimate owner.
This paper proceeds as follows. Section 2 describes the variables and definitions, the methodology, and
the data. Section 3 characterises the corporate ownership structure for a sample of 32 countries, namely their
owners and the way the control is owned. Section 4 concludes.
2. Data, Definitions of Variables, and Methodology
2.1 Data
This paper is based fundamentally on the information obtained from the Factset/Lionshares database, annual
reports, books, and websites of firms that detail their ownership structures. For securities traded on the major US
exchanges, Factset Lionshares obtained institutional ownership information via 13F filings, as well as by adding
shares held by the mutual funds managed by a particular institution. This method is also used when shares traded
on other stock exchanges are considered. Insider/declarable stakes data are collected through many reports,
namely insider filings, registration forms, public company annual reports and interim financial statements.
Our data concerns the end of 2005, more precisely the period between December 2005 and March 2006,
depending on the information supplied by firms. We selected the 20 largest firms by country, according to the
results obtained from the Worldscope database (Worldscope item, WC08001), for the following countries:
Australia, Austria, Belgium, Canada, Chile, Denmark, Finland, France, Germany, Greece, Hong Kong, India,
Indonesia, Ireland, Italy, Japan, Malaysia, the Netherlands, New Zealand, Norway, Portugal, Singapore, South
Africa, South Korea, Spain, Sweden, Switzerland, Taiwan, Thailand, Turkey, the UK, and the US.

5
2.2. Definitions of Variables
While voting rights determine corporate control, cash flow rights are used to evaluate corporate ownership. It is
important to distinguish both concepts because they usually present different results, particularly when the
shareholdings are based on pyramidal structures, a way of large shareholders to obtain control with the least
amount of capital. For example, if investor A holds 5% of shares of firm X, and simultaneously 20% of shares of
firm Y, which in its turn also owns 10% of firm X, then we may say that A has 7% (5%+20%*10%) of cash flow
rights and controls 15% of voting rights (min(10%,20%)+5%). Moreover, differences between voting rights and
cash flow rights are particularly sensitive to dual class voting shares. For example, Berkshire Hathaway Inc., the
US holding company managed by Warren Buffet, has two classes of common stock, Class A and Class B. A share
of Class B common stock has the rights of 1/30th of a share of Class A common stock except that a Class B share
has 1/200th of the voting rights of a Class A share (rather than 1/30th of the vote). Considering that Berkshire
Hathaway Inc. has issued 1,261 million and 8,407 million Class A and B shares respectively, we conclude that the
0,498 million Class A shares owned by Warren Buffet represent 32% of cash flow rights and 38% of voting rights.
Thus, whenever a firm presents dual class voting shares we use the percentage of voting shares, following
the related literature. In other words, we are assuming a parallel between voting rights and number of shares, when
a company has only issued a single class of shares. This is particularly relevant for Scandinavian countries, where
dual class voting shares are commonly used. The Social Democratic approach of Nordic politics has played an
important role in the cooperation between capital and labour interests and the maintenance of property rights has
been the response to that purpose. Such view has permitted firms the use of different class voting shares and
pyramidal structures in order to maintain property rights and wealth in their countries and simultaneously to
discourage new outsiders, promoting corporate financing through internal resources or banking financing, placing
less emphasis on capital market development (Högfeldt (2004)).
In this research, we do not consider some mechanisms used by firms to impede takeovers such as voting
caps, golden shares, and voting blocks. We have collected only ultimate owners that own more than 5% of voting
rights of a firm. We assume that a ultimate owner has a stake in firm if he owns 5% or 20% of voting rights,
depending on the threshold we are considering. These figures are in line with recent research, for example,
Holderness (2005) and La Porta et al (1999) who chose 5%, 10%, and 20% respectively. The ultimate owner
percentage of voting rights takes into account the American Depositary Receipts (ADRs) stakes. There are few
6
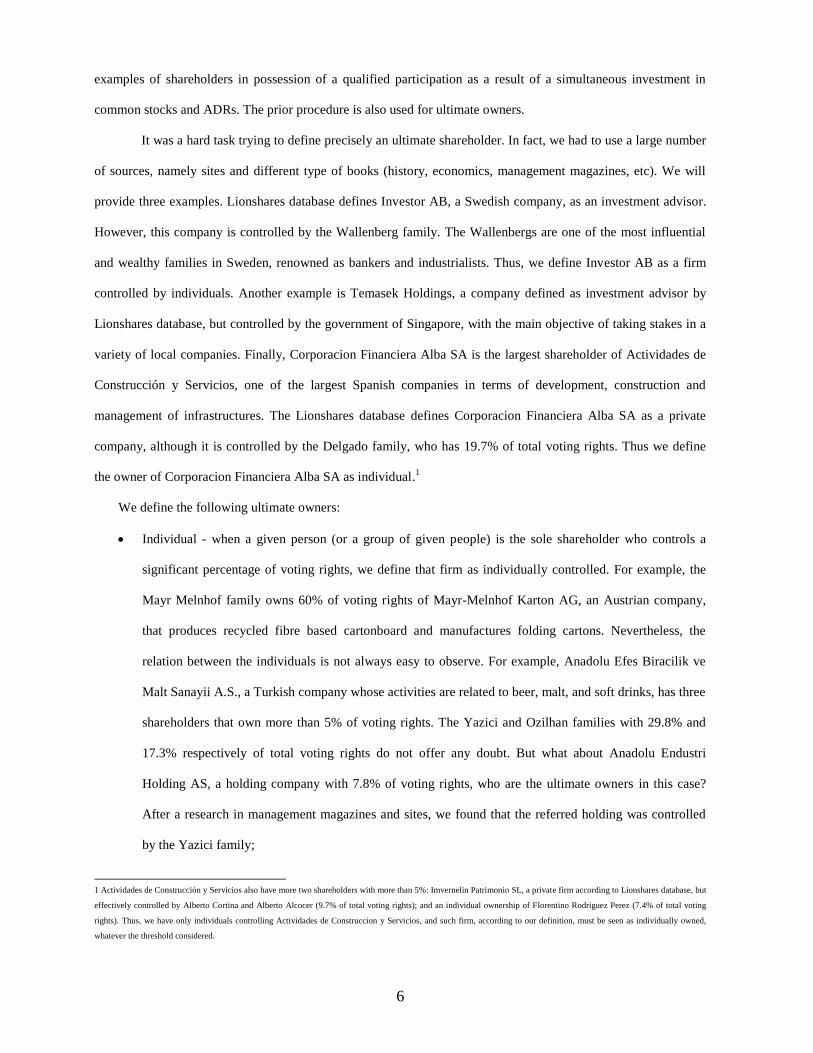
examples of shareholders in possession of a qualified participation as a result of a simultaneous investment in
common stocks and ADRs. The prior procedure is also used for ultimate owners.
It was a hard task trying to define precisely an ultimate shareholder. In fact, we had to use a large number
of sources, namely sites and different type of books (history, economics, management magazines, etc). We will
provide three examples. Lionshares database defines Investor AB, a Swedish company, as an investment advisor.
However, this company is controlled by the Wallenberg family. The Wallenbergs are one of the most influential
and wealthy families in Sweden, renowned as bankers and industrialists. Thus, we define Investor AB as a firm
controlled by individuals. Another example is Temasek Holdings, a company defined as investment advisor by
Lionshares database, but controlled by the government of Singapore, with the main objective of taking stakes in a
variety of local companies. Finally, Corporacion Financiera Alba SA is the largest shareholder of Actividades de
Construcción y Servicios, one of the largest Spanish companies in terms of development, construction and
management of infrastructures. The Lionshares database defines Corporacion Financiera Alba SA as a private
company, although it is controlled by the Delgado family, who has 19.7% of total voting rights. Thus we define
the owner of Corporacion Financiera Alba SA as individual.1
We define the following ultimate owners:
Individual - when a given person (or a group of given people) is the sole shareholder who controls a
significant percentage of voting rights, we define that firm as individually controlled. For example, the
Mayr Melnhof family owns 60% of voting rights of Mayr-Melnhof Karton AG, an Austrian company,
that produces recycled fibre based cartonboard and manufactures folding cartons. Nevertheless, the
relation between the individuals is not always easy to observe. For example, Anadolu Efes Biracilik ve
Malt Sanayii A.S., a Turkish company whose activities are related to beer, malt, and soft drinks, has three
shareholders that own more than 5% of voting rights. The Yazici and Ozilhan families with 29.8% and
17.3% respectively of total voting rights do not offer any doubt. But what about Anadolu Endustri
Holding AS, a holding company with 7.8% of voting rights, who are the ultimate owners in this case?
After a research in management magazines and sites, we found that the referred holding was controlled
by the Yazici family;
1 Actividades de Construcción y Servicios also have more two shareholders with more than 5%: Imvernelin Patrimonio SL, a private firm according to Lionshares database, but
effectively controlled by Alberto Cortina and Alberto Alcocer (9.7% of total voting rights); and an individual ownership of Florentino Rodriguez Perez (7.4% of total voting
rights). Thus, we have only individuals controlling Actividades de Construccion y Servicios, and such firm, according to our definition, must be seen as individually owned,
whatever the threshold considered.
7
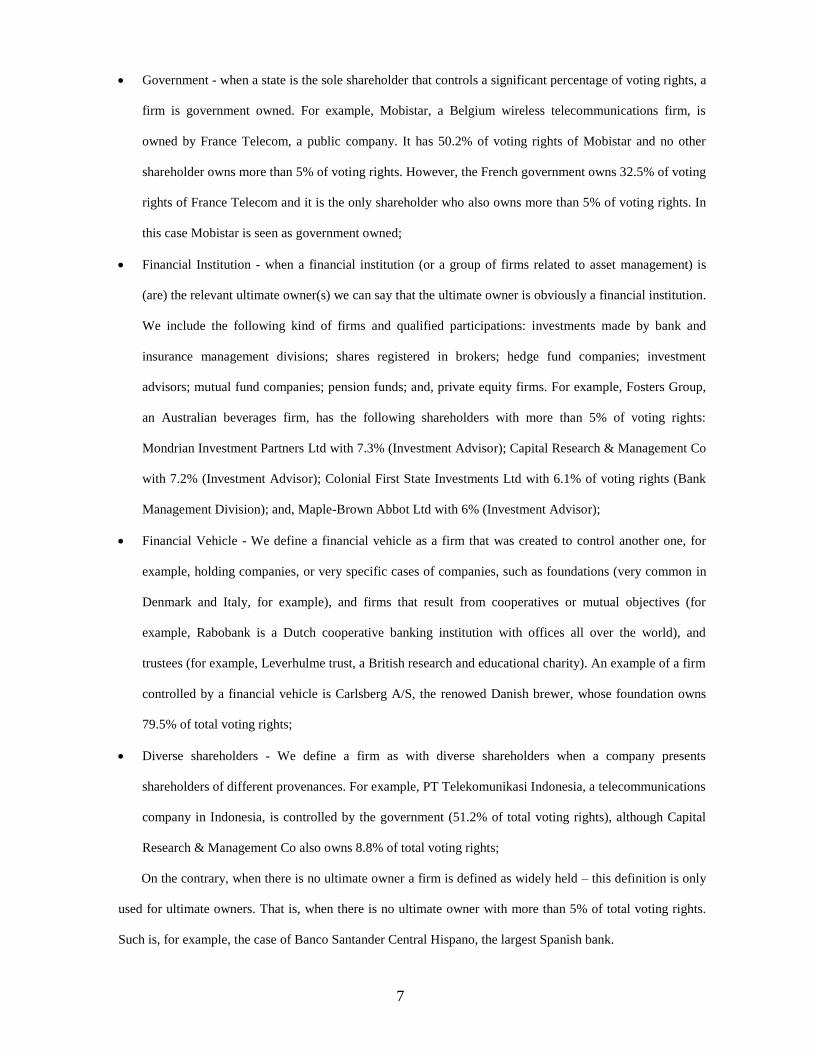
Government - when a state is the sole shareholder that controls a significant percentage of voting rights, a
firm is government owned. For example, Mobistar, a Belgium wireless telecommunications firm, is
owned by France Telecom, a public company. It has 50.2% of voting rights of Mobistar and no other
shareholder owns more than 5% of voting rights. However, the French government owns 32.5% of voting
rights of France Telecom and it is the only shareholder who also owns more than 5% of voting rights. In
this case Mobistar is seen as government owned;
Financial Institution - when a financial institution (or a group of firms related to asset management) is
(are) the relevant ultimate owner(s) we can say that the ultimate owner is obviously a financial institution.
We include the following kind of firms and qualified participations: investments made by bank and
insurance management divisions; shares registered in brokers; hedge fund companies; investment
advisors; mutual fund companies; pension funds; and, private equity firms. For example, Fosters Group,
an Australian beverages firm, has the following shareholders with more than 5% of voting rights:
Mondrian Investment Partners Ltd with 7.3% (Investment Advisor); Capital Research & Management Co
with 7.2% (Investment Advisor); Colonial First State Investments Ltd with 6.1% of voting rights (Bank
Management Division); and, Maple-Brown Abbot Ltd with 6% (Investment Advisor);
Financial Vehicle - We define a financial vehicle as a firm that was created to control another one, for
example, holding companies, or very specific cases of companies, such as foundations (very common in
Denmark and Italy, for example), and firms that result from cooperatives or mutual objectives (for
example, Rabobank is a Dutch cooperative banking institution with offices all over the world), and
trustees (for example, Leverhulme trust, a British research and educational charity). An example of a firm
controlled by a financial vehicle is Carlsberg A/S, the renowed Danish brewer, whose foundation owns
79.5% of total voting rights;
Diverse shareholders - We define a firm as with diverse shareholders when a company presents
shareholders of different provenances. For example, PT Telekomunikasi Indonesia, a telecommunications
company in Indonesia, is controlled by the government (51.2% of total voting rights), although Capital
Research & Management Co also owns 8.8% of total voting rights;
On the contrary, when there is no ultimate owner a firm is defined as widely held – this definition is only
used for ultimate owners. That is, when there is no ultimate owner with more than 5% of total voting rights.
Such is, for example, the case of Banco Santander Central Hispano, the largest Spanish bank.
8
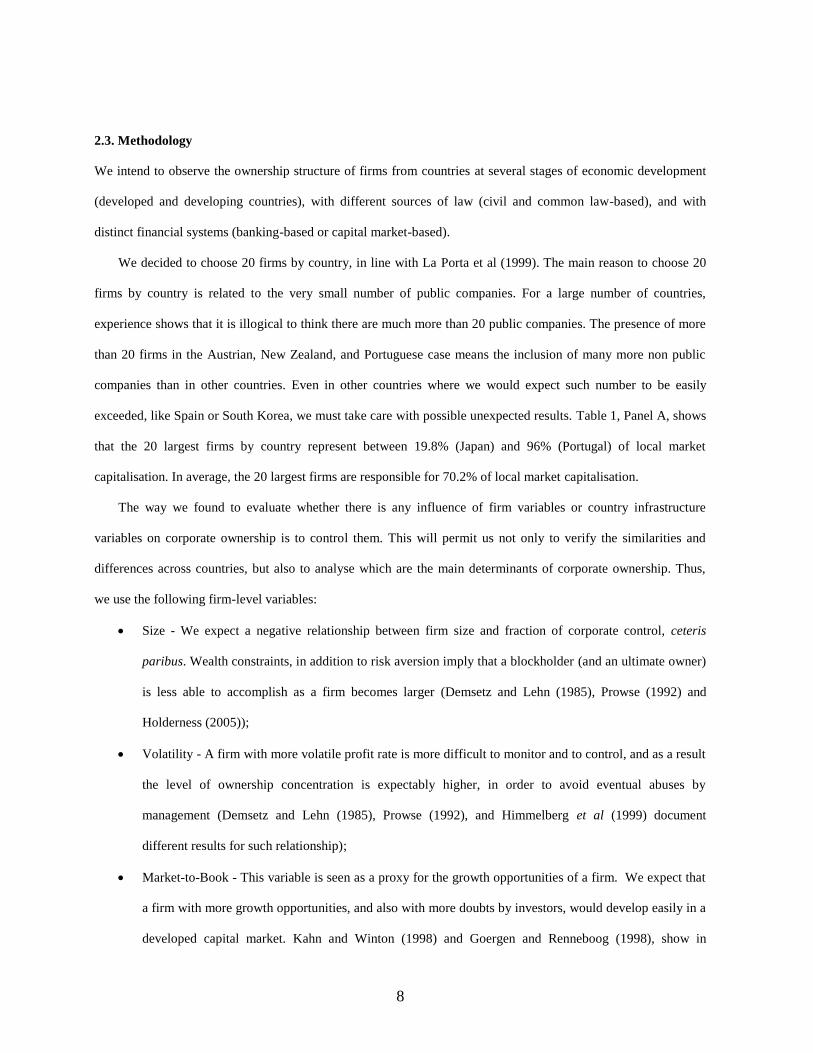
2.3. Methodology
We intend to observe the ownership structure of firms from countries at several stages of economic development
(developed and developing countries), with different sources of law (civil and common law-based), and with
distinct financial systems (banking-based or capital market-based).
We decided to choose 20 firms by country, in line with La Porta et al (1999). The main reason to choose 20
firms by country is related to the very small number of public companies. For a large number of countries,
experience shows that it is illogical to think there are much more than 20 public companies. The presence of more
than 20 firms in the Austrian, New Zealand, and Portuguese case means the inclusion of many more non public
companies than in other countries. Even in other countries where we would expect such number to be easily
exceeded, like Spain or South Korea, we must take care with possible unexpected results. Table 1, Panel A, shows
that the 20 largest firms by country represent between 19.8% (Japan) and 96% (Portugal) of local market
capitalisation. In average, the 20 largest firms are responsible for 70.2% of local market capitalisation.
The way we found to evaluate whether there is any influence of firm variables or country infrastructure
variables on corporate ownership is to control them. This will permit us not only to verify the similarities and
differences across countries, but also to analyse which are the main determinants of corporate ownership. Thus,
we use the following firm-level variables:
Size - We expect a negative relationship between firm size and fraction of corporate control, ceteris
paribus. Wealth constraints, in addition to risk aversion imply that a blockholder (and an ultimate owner)
is less able to accomplish as a firm becomes larger (Demsetz and Lehn (1985), Prowse (1992) and
Holderness (2005));
Volatility - A firm with more volatile profit rate is more difficult to monitor and to control, and as a result
the level of ownership concentration is expectably higher, in order to avoid eventual abuses by
management (Demsetz and Lehn (1985), Prowse (1992), and Himmelberg et al (1999) document
different results for such relationship);
Market-to-Book - This variable is seen as a proxy for the growth opportunities of a firm. We expect that
a firm with more growth opportunities, and also with more doubts by investors, would develop easily in a
developed capital market. Kahn and Winton (1998) and Goergen and Renneboog (1998), show in

9
theoretical and empirical terms respectively, that the ownership retention by the initial shareholders will
be lower, after an IPO, on firms characterised by growth opportunities with need of external finance.
With regard to country-level variables the following are used:
Legal Environment – We use legal country origin and anti-director rights as measures of legal
environment. Country origin is divided in the two main important legal families, common and civil law
origins. Anti-director rights is an index outlined by La Porta et al (1998). We expect a positive
relationship between diffuse corporate ownership structures and common law-based countries,
particularly when the agency problem concerns management-shareholder (see La Porta et al (1999)). In
line with prior assumption, we expect that the higher the investor protection rights are, the lower the
possibility of expropriating wealth is from the smallest ones by management;
Quality of Enforcement - La Porta et al (1998) using some variables of law enforcement, namely
corruption and rule of law, considered in this research, conclude that Scandinavian countries present the
highest standards, contrarily to Fench civil law countries. In this research the level of corruption is an
index produced by Transparency Internacional, named Corruption Perception Index, and Rule of Law is
from La Porta et al (1998). Those authors also conclude, considering the three largest shareholders in the
ten largest non-financial (privately owned) firms by country, that Fench civil law countries present the
highest concentration of ownership. Li et al (2006) using an enforcement index, whose components are
rule of law, regulatory quality, and absence of corruption, show that there is positive impact of such
variable on ownership held by institutional blockholders;
Corporate Disclosure – More diffused ownership structures in countries where accounting and financial
disclosure present higher standards (see La Porta et al (1998)) is expected. In fact, in that case it is easier
to monitor the management (and large shareholders decisions) and consequently to avoid the
expropriation of wealth from minority shareholders. However, that relationship must be taken with
caution, because, for example, Guedhami and Pittman (2006), for a group of privatised firms from 31
countries, find weak evidence between ownership concentration and disclosure standards;
Religion - Local beliefs produce impacts on different areas of economy. Weber (1904) in his notable
book, “The Protestant Ethic and the Spirit of Capitalism”, found that Protestantism, in particular in

10
Calvinism, as a means of explaining capitalism2 and it will be used to test if there is, as we expect, a
positive relationship between non Catholic religion and the existence of ultimate owners;
Economic, Stock Market, Banking, and Financial Institutional Environment - Financial decisions taken
by firms depend on the level of capital market development. In some financial markets, like the US and
the UK, which are clearly market-based, the issue of equity is a natural source of finance for firms.3 The
opportunities in a developed capital market induce firms to issue equity; in this case, we expect a lower
ownership concentration ratio for developed capital markets. In fact, as Dyck and Zingales (2002)
conclude, in countries with less developed capital markets the private benefits of control are higher and
the ownership is more concentrated. We use the liquidity ratio as a proxy for capital market development.
Liquidity ratio is defined as volume traded at a local stock exchange divided by the gross domestic
product (GDP). Private credit is also used to evaluate if a banking system influence corporate ownership.
Financial literature found a positive relationship between the development of banking and capital market,
and thus a positive relationship between private credit and diffused ownership structures is expected.
Demirgüç-Kunt and Levine (1999) show that in higher income countries, the overall financial system
becomes larger, although they tend to be more market-based. Domestic credit provided by banking sector
% of GDP, from World Bank, is the measure of private credit. The level of economic development
measured by GDP per capita will be used to evaluate if different economic conditions influence the
percentage of widely held firms. Finally, because there is a positive relationship between the size of
mutual fund industry, a proxy for financial institutional development, and strong rules and laws (see
Khorana et al (2005)), we test if the same occurs between diffused ownership and the level of
development of financial institutions.
2 In the Renaissance period, contrarily to Catholic religion which defended a fairly luxurious way of life, emerged in the 16th century a group of reformists, namely Martin
Luther and John Calvin, of the Catholic church, who started a religious movement, later designated as the Protestant Reformation. Protestants defended that hard work led to
prosperity and a life without luxury. From their asceticism resulted an accumulation of capital, which inspired the beginning of capitalism. But the impact of religion on
economy, and more particularly on firms’ corporate control, should be extended to the Franciscans, a Roman Catholic Order created in the 13th century. In fact, that Order
played an important role on the economy since the 15th century, particularly through the implementation of "Montes Pietatis", financial institutions with mutual purposes. These
institutions, in order to protect persons from usurers, loaned money with exclusively charitable and solidarity ends.
3 Rajan and Zingales (1998) show the importance of a well-developed financial market for industries with more need of external finance. A firm whose growth depends on
external capital will grow more rapidly in a developed stock market. According to Demirguk and Levine (1999), there is a positive relationship between market-based financial
systems, and strong shareholder rights protection, good accounting regulations, and low levels of corruption.

11
3. Results
First, we identify the ultimate owners of the 20 largest firms by country. More diffused ownership structures in
developed capital markets, where shareholders are well protected, with higher transparency standards, and
disclosure levels is expected. In this research, it will be important to evaluate if the stakes of ultimate owners are
explained by macro variables, as legal environment, quality of enforcement, corporate disclosure, historical
foundations, and the economic environment, or on the other hand, because the largest firms around the world are
being considered, restrictions of wealth are more important to explain either block holdings or ultimate owners.
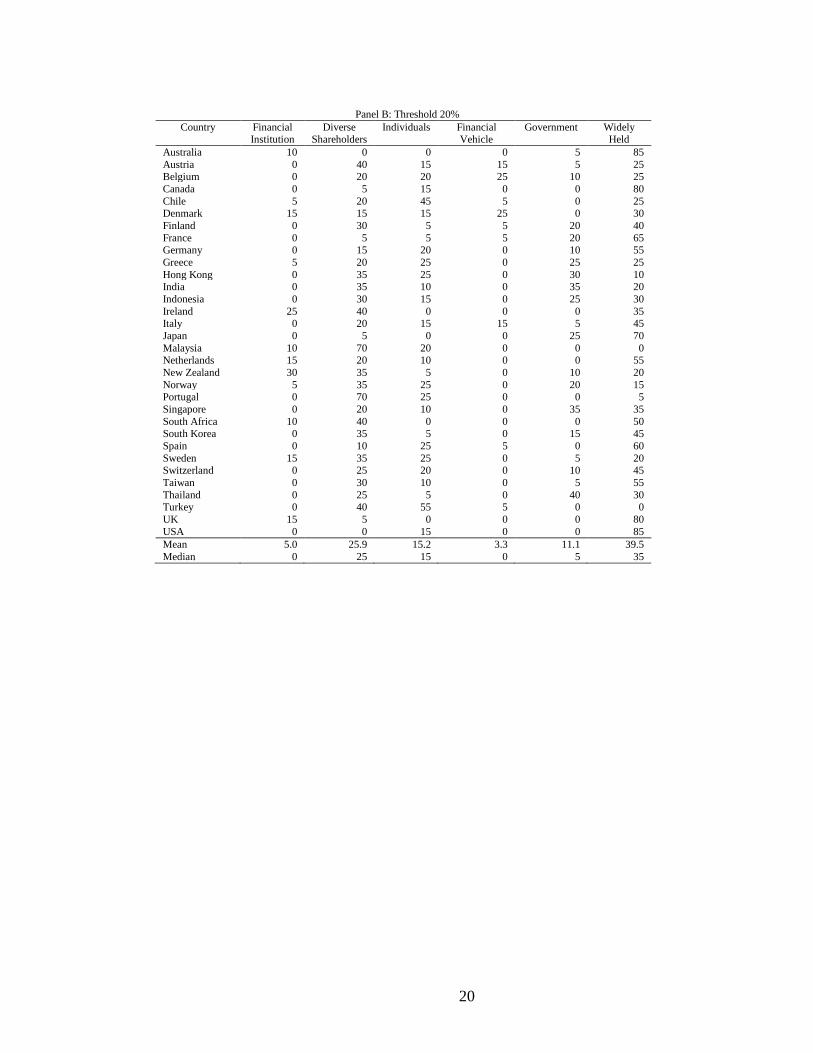
Table 1, Panels A and B, shows the percentage of firms controlled by category of ultimate owner,
considering 5% and 20% threshold. Financial institutions control a significant percentage of largest firms of
Canada, Ireland, New Zealand and South Africa for a 5% threshold. However, when threshold is 20% the
percentage of firms controlled by financial institutions is highly reduced (from 18.1% to 5%, on average by
country). For example, not one Canadian firm is controlled by a financial institution, when 20% threshold is
considered. However, 65% of Canadian firms of our sample are controlled by a financial institution when
threshold is 5%. These results are in line with the idea that financial institutions under financial and risk
constraints prefer to act as a monitor of management. Malaysia and Portugal present a significant percentage of
firms (70%) whose owners have a different origin. Contrarily to financial institutions, when we analyse firms
controlled by diverse shareholders there is no change considering 5% or 20% threshold. In fact, Panels A and B,
show that diverse shareholders own, on average, 28.9% (25.9%) of sample for 5% (20%) threshold. In this case,
we suspect that there are many firms where a minoritary ultimate owner with a stake higher than 5% controls a
large shareholder that is simultaneously the management. Probably, this occurs in countries where ultimate owners
are less protected and the benefits obtained of monitoring a large ultimate owner by a minority one are higher.
Panels A and B, of Table 1, also show that threshold does not produce significant changes on the percentage of
firms controlled by individuals (from 17.3% to 15.2%, on average by country). In this case it is plausible to say
that management and controller are the same entity, since the percentage of voting rights often exceeds 20%. Chile
and Turkey are the most represented countries in terms of control by individuals. On the opposite extreme are
Australia, Ireland, Japan, South Africa, and the UK. Financial vehicles, contrarily to individuals, are influenced
by the threshold chosen. The percentage of firms owned by financial vehicles varies from 7.7% to 3.3%, for 5%
and 20% threshold respectively. However, while in some countries threshold does not seem to not produce
different results (e.g., Belgium and Denmark), there are others where the influence of financial vehicles changes

12
with threshold (e.g., Austria, Italy, and Spain). Those countries had a period of mutualisation as a common
characteristic. That is, a period where the firm’s main objective was not to obtain profits, but to help a cause. It is
possible to observe that trend in Belgium, through Cera Holding, a cooperative Group, with important stakes on
KBC, AGFA, and Almancora, some of the largest Belgian firms, in Denmark where local foundations control
large Danish firms (for example, Carlsberg, Danske Bank, and H. Lundbeck), and in Spain, where the major
Catalan bank, La Caixa, controls Telefonica, Telefonica Mobiles, Banco Sabadel, and Repsol. The history and
culture seems to influence the firm’s control in some countries. On the other hand, firms controlled by the state are
not influenced by threshold. In fact, 11.1% (12.0%) of firms from the sample are owned by states for 20% (5%)
threshold. Table 1 shows how Asian governments influence their economy. India, Singapore, and Thailand are its
main exponents. For example, Temasek Holding, an investor advisor owned by the Singaporean government,
controls some local large firms (e.g., DBS Group, Keppel Corp, Capitaland, Singapore Airlines, Chartered
Semiconductor, Neptune Orient Lines, and Starhub). Table 1 also shows that a widely held firm is dependent from
threshold. In fact, the percentage of firms without controller varies from 15.9% (5% threshold) to 39.5% (20%
threshold). However, it is difficult to conclude that a shareholder with 5% of voting rights controls a firm. In fact,
the difference from 5% to 20% threshold must be attributed to the change observed on firms supposedly controlled
by financial institutions, but that in reality act as a monitor of management. In spite of large ownership
concentration around the world, there are many large firms where the agency cost is focused on the relationship
between manager and a minority shareholder. This evidence is not observed in Malaysia, Portugal, and Turkey. In
these countries the conflict of interest is based on the relationship between large and minority shareholders.
Summing up, there are some signs that ultimate owners are a puzzling issue because is dependent of
country specific infrastructure, political foundations, and economic characteristics. However, because such
countries each had their own development, many times the singularity of each country may not be observed
through macro variables, as corruption index or religion. For example, some large firms from Japan and Thailand
are controlled by the government, although they have different legal origins, shareholders are differently
protected, and the level of corruption is significantly different. While in Japan the state decided to maintain the
control of some firms, as in Japan Tobacco, Resona Holdings, Nippon Telegraph & Telephone, NTT Domo, and
Nissan (controlled by Renault, a firm owned by the French government), in Thailand the local government has
been helped by the Singaporean government in order to maintain the control of local firms in security hands (for
example, ADV Info Service and Shin Corp). Thus, it is a difficult task to find the main determinants of corporate
13
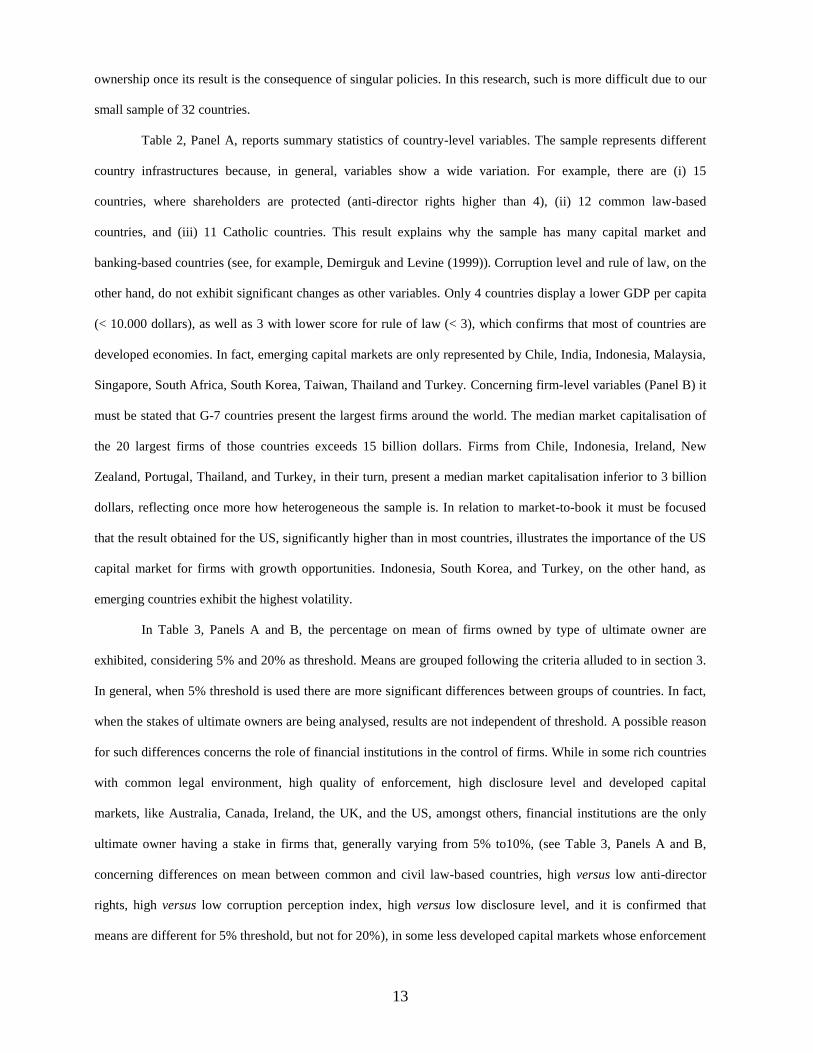
ownership once its result is the consequence of singular policies. In this research, such is more difficult due to our
small sample of 32 countries.
Table 2, Panel A, reports summary statistics of country-level variables. The sample represents different
country infrastructures because, in general, variables show a wide variation. For example, there are (i) 15
countries, where shareholders are protected (anti-director rights higher than 4), (ii) 12 common law-based
countries, and (iii) 11 Catholic countries. This result explains why the sample has many capital market and
banking-based countries (see, for example, Demirguk and Levine (1999)). Corruption level and rule of law, on the
other hand, do not exhibit significant changes as other variables. Only 4 countries display a lower GDP per capita
(< 10.000 dollars), as well as 3 with lower score for rule of law (< 3), which confirms that most of countries are
developed economies. In fact, emerging capital markets are only represented by Chile, India, Indonesia, Malaysia,
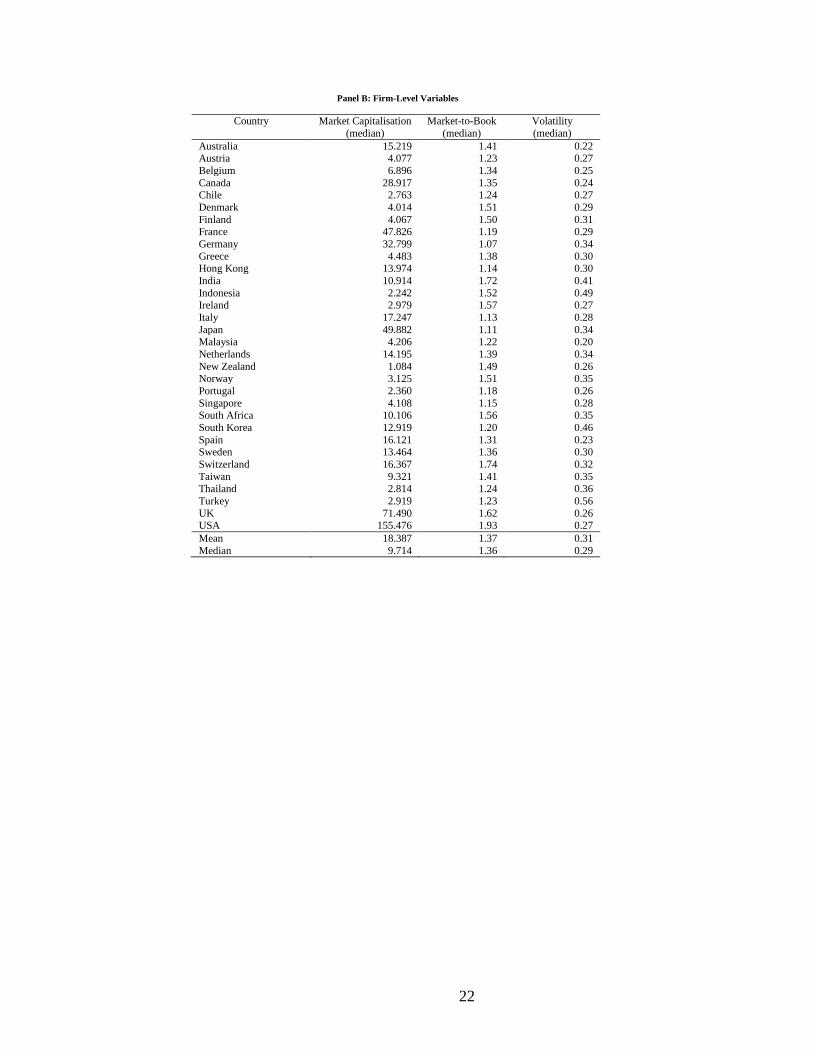
Singapore, South Africa, South Korea, Taiwan, Thailand and Turkey. Concerning firm-level variables (Panel B) it
must be stated that G-7 countries present the largest firms around the world. The median market capitalisation of
the 20 largest firms of those countries exceeds 15 billion dollars. Firms from Chile, Indonesia, Ireland, New
Zealand, Portugal, Thailand, and Turkey, in their turn, present a median market capitalisation inferior to 3 billion
dollars, reflecting once more how heterogeneous the sample is. In relation to market-to-book it must be focused
that the result obtained for the US, significantly higher than in most countries, illustrates the importance of the US
capital market for firms with growth opportunities. Indonesia, South Korea, and Turkey, on the other hand, as
emerging countries exhibit the highest volatility.
In Table 3, Panels A and B, the percentage on mean of firms owned by type of ultimate owner are
exhibited, considering 5% and 20% as threshold. Means are grouped following the criteria alluded to in section 3.
In general, when 5% threshold is used there are more significant differences between groups of countries. In fact,
when the stakes of ultimate owners are being analysed, results are not independent of threshold. A possible reason
for such differences concerns the role of financial institutions in the control of firms. While in some rich countries
with common legal environment, high quality of enforcement, high disclosure level and developed capital
markets, like Australia, Canada, Ireland, the UK, and the US, amongst others, financial institutions are the only
ultimate owner having a stake in firms that, generally varying from 5% to10%, (see Table 3, Panels A and B,
concerning differences on mean between common and civil law-based countries, high versus low anti-director
rights, high versus low corruption perception index, high versus low disclosure level, and it is confirmed that
means are different for 5% threshold, but not for 20%), in some less developed capital markets whose enforcement
14
presents low quality, financial institutions are not the only ultimate owner and usually their stakes also vary from
5% to 10% (see Panels A and B, concerning diverse shareholders and differences on mean between high versus
low corruption perception index, and it is confirmed either for 5% or for 20% threshold that in countries with high
standards of corruption there are more firms with diverse ultimate owners). This occurs usually, for example, in
Greece, India, Indonesia, and Taiwan, amongst others. For example, in Indonesia Capital Research &
Management and local government have important stakes in the same firms (PT Telekomunikasi Indonesia, PT
Perusahaan Gas Negara and PT Bank Mandiri). As in prior results, it seems that while in less developed capital
markets financial institutions act as a monitor of management, in undeveloped capital markets financial
institutions act as monitor of majority shareholder that is simultaneously the management. An important result of
this research concerns the non definitive relationship between widely-held firms and law. Common law-based
countries present more diffused corporate control structures but without statistical significance (see Table 3,
Panels A and B). This result contrasts with La Porta et al (1999) since their results indicate a positive relationship
between anti-director standards (highly related to law) and diffused ownership structures. In fact, the agency
problem between management and shareholders would be avoided in countries where the shareholders were well-
protected and it would reflect itself in a more diffused ownership structure. But not infrequently management and
the majority shareholders are the same entity and the agency problem arises in the relationship between larger and
minority shareholders. Thus, the question that we should ask is: Are agency theory, law and finance reasons
enough to explain the corporate control? It seems not. Or on the other hand, do we have to consider other
perspectives like the privatisation policies taken by the states, the way of thinking of governments, more liberal or
more social democratic, or the quality of enforcement (analysing either corruption standards or rule of law). Who
would like to invest in a country where public institutions do not perform well their role? Or in other words: What
dominates what? Is political economy more important than law and finance or are both equally important?
Probably both are important and it is difficult to conclude which factor is more relevant. In common law-based
countries firms are more controlled by financial institutions firms than in civil ones, as we noted. Capital markets
are more developed in these countries, issuers provide more information, financial industry is highly developed.
However, it must be enhanced that this result can not be extensible to all common law-based countries, as we
observed. For example, in Hong Kong, India and Thailand we do not witness any firm controlled by a financial
institution. On the contrary, in those countries, there are many firms controlled by the government. However, they
are common-law based. Thus, there are some reasons to believe in the importance of political economy on
15
corporate control. Table 3, Panels A and B, shows that individuals exercise higher control over firms in civil-law
based countries (always significant at 1% level of statistical significance). We identify the following plausible
reasons for such result: First, shareholders are less protected in civil-law based countries and consequently it is
necessary that a larger shareholder controls the management; Second, individuals are often the founders of the
firms and do not like to divide the lock of control in order to share the private benefits with minority shareholders;
Third, in civil-law based countries apparently there are some signs that firms are smaller and consequently they
are more easily controlled by individuals. Moreover, there are other reasons for a family business to grow fast in
less developed capital markets with lower disclosure levels and lower quality of enforcement, although differences
on mean for such criteria have not been found: Following a long period in which the state assumed a relevant role,
many firms were privatised and the governments for a number of reasons prefer to sell firms to locals. Moreover,
some privatised firms were located in sectors with many restrictions to develop an activity, if not faced with
monopolies. Thus, it is understandable how such families create wealth so fast. Chile and Turkey, for example,
belong to the group of countries where such process occurred. In Chile the wave of privatisations from 1974 to
1979 and from 1984 to 1989 created the Angelini, Luksic, and Matte groups. In Turkey, the privatisation
movement started in the mid 80’s, with obstacles, many of them related to work/labour force, delaying its end to
recent years. During that period some Turkish families and individuals increased their wealth buying firms owned
by the state, creating conglomerates, namely the Dogan Aydin and Koc and Sabancy families. In fact, corporate
ownership is a puzzle issue, where law and finance and political economy both assume importance to explain it.
There are many common-law based countries whose economy has recently adhered to market economy, and even
though some of them prefer to maintain the lock of control of firms in the hands of the government, particularly in
sectors related to the offer of national interest goods, such as water, telecommunications, and railways, amongst
others. This is the case of Hong Kong where MTR Corporation (railways), Boc Hong Kong (bank), Cnooc Ltd (oil
and gas), China Mobile (wireless telecommunications), China Unicom (major telecommunications), and China
Netcom Group (major telecommunications) are directly owned by the government of the People’s Republic of
China. This example helps to understand why some countries with the same legal origin, present different patterns
in terms of ultimate owners. For example, in Hong Kong, India, Singapore and Thailand there are many firms
controlled by the government, contrarily to Canada, Ireland, Malaysia, South Africa, the UK and the US. In Table
5, Panels A and B, also shows that there are differences on mean in some criteria when financial vehicles are being
analysed. In common law and Catholic-based countries (although this criteria accounts for only 5% threshold)

16
financial vehicles play a more relevant role in the control of firms. This is mainly a consequence of different
political and economic models produced by countries along the years, particularly in some continental European
countries, namely in Austria, Belgium, Denmark, Italy, and Spain. The historical presence of institutions with
mutual and cooperative interests is a plausible explanation for such result and explains why civil-law based
countries present higher means when we analyse firms controlled by this type of shareholders. In Italy, since the
15th century there have been many financial institutions with mutual origins that were inspired by Franciscan
principles, the old "Montes Pietatis". These institutions loaned money in cash with the guarantee of a pledge,
without interest, and with exclusively charitable and solidarity ends, in order to protect individuals from usurers.
From this process resulted many "fondaziones" some of them subsequent to the 18th century, which are nowadays
not only the main important shareholders of some Italian banks, but additionally of some foreign banks. For
example, the largest ultimate shareholder from Unicredito, the major Italian bank, that controls the German bank
Bayerische Hypo und Vereinsbank AG and the Austrian bank Bank Austria Creditanstalt, is Fondazione Cassa
Risparmio Verona Vicenza Belluno Anco. Crédit Agricole, a French institution with a mutual mission, and
Fondazione Cariplo - Cassa di Risparmio delle Provincie are the largest shareholders of Banca Intesa, the second
largest Italian bank. The financial Italian movement was followed in Spain. In fact, the process ended on "cajas de
ahorros", although some of them are currently private companies. The most relevant example of the importance of
these financial institutions is La Caixa, a Catalan bank, the major ultimate shareholder of Banco Sabadell, Repsol,
and Telefonica. In Austria there are also many institutions with mutual aims. For example, Raiffeisen, one of the
largest banking groups in the country is a cooperative bank owned by 9 regional banks, and Wiener Städtische, the
largest Austrian Insurance company, and one of the most important in Central Europe was managed until 1992
with a legal form of a mutual insurance company. Also in Belgium, Almancora, an investment management
company, has Cera Holding as its main important ultimate owner, a cooperative financial group. Another example
is Agfa - Gevaert NV, a Belgium electronic company controlled by KBC Group, which in its turn is controlled by
Almancora (owned by Cera Holding), Boerenbond Group (a farmers association whose main objective is to
protect farmers against unfair commercial practices) and Cera Holding. Denmark, on the other hand, is the land of
foundations. For example, Carlsberg A/S, the famous brewer, is controlled by Carlsberg foundation and H
Lundbeck A/S and Novo Nordisk A/S, the Danish Pharmaceuticals, are governed, respectively by Lundbeck
Fonden and Novo Nordisk Fonden.

17
Summing up, although it seems that ultimate owners have been influenced by the way capitalism was
created in each country. That is, many countries were influenced by mutual environment, the role of the state has
had different interpretations and is highly observed in many Asian countries, in some less developed countries like
Chile and Turkey individuals play an important role in the economy, in other countries like Singapore and South
Africa institutions were created to deal with social insurance that have an important role in the local capital
markets, in some common-law based countries (Australia, Canada, Ireland, New Zealand, the UK and the US)
financial institutions are comparatively an important type of blockholder and ultimate owner, and in Nordic
countries dual class shares is typical and was the way local governments, social democratic oriented, chose to
maintain the control of firms. However, all the countries have common restrictions of wealth, and at least it would
be the most popular determinant of corporate ownership. The remaining determinants, on the contrary, are country
specific.
Table 4 present a multivariate analysis, from which we intended to evaluate the determinants of ultimate
owners, considering the percentage of widely held firms by country as the dependent variable, for a 20% of
threshold. The results confirm that when we are analysing ultimate owners only market capitalisation matters.
Wealth restriction is the explanation for the influence of market capitalisation on the percentage of widely held
firms by country. On the contrary, we do not identify any country variable that influences the percentage of widely
held firms because, as we noted, each capital market has had its own history, that is to say, a specific process of
development, impeding the establishment of international patterns.
4. Conclusion
The main objective of this research paper is to evaluate how corporate control is performed in the largest firms of
32 countries with different country and firm-level characteristics. For that purpose we consider the concept of
ultimate owner.
As expected there is a small number of countries like Australia, the UK, and the US, where corporate
ownership is widely diffused. This research paper shows that threshold influences the percentage of widely held
firms. In fact, there are 15.9% of widely held firms, on mean by country, when 5% threshold is chosen, that
compares with 39.5% for 20% threshold. This result derives from the large number of firms whose ultimate
owners are financial institutions at 5% threshold, but not at 20%. This relationship is very popular in common-law
based countries, as well as in countries where the quality of enforcement presents higher standards. Under those

18
infrastructures, financial institutions seem to act as a monitor of management. On the contrary, when we are in the
presence of countries where shareholders are not well protected, typically in civil-law based countries, financial
institutions act as a monitor of a larger shareholder, that is simultaneously the management. It seems that a
financial institution has benefits of monitoring management in a common-law based country and of monitoring a
larger shareholder in a civil one.
The particularity of each country makes it difficult to find macro variables for determinants of ultimate
owners. In fact, in many countries of continental Europe, namely in Austria, Belgium, Denmark, Italy and Spain,
with different country infrastructures, where there is a significant number of firms whose ultimate owners have
mutual origin; in many Asian countries, independently of enforcement standards, there is a significant number of
firms controlled by the state (Hong Kong, India, Indonesia, Singapore and Thailand); in Ireland and New Zealand
there is a significant number of firms controlled by financial institutions; in Turkey and Chile individuals are the
most observed ultimate owner; in Australia, Canada, France, Germany, Japan, the UK and the US there are many
widely held firms and their infrastructures are also different. In this last case, the firm’s size and wealth restriction
are the explanations for such result. As a matter of fact, and contrarily to block holdings, we only found a degree
of statistical significance in firm’s size as a determinant of ultimate owner. This was expected because a block
holding stake is generally higher than one owned by an ultimate owner.

19
Table 1: Ultimate Owners – Percentage of Firms by Country This table exhibits the percentage of firms owned by type of ultimate owners, using 5% and 20% threshold. Ultimate
owners with more than 5% of votes are included on the sample. A firm whose ultimate owners own less than 20% is
considered widely held at 20% threshold. Ultimate owner classification is defined in section 2.2. % of country market capitalisation is the relationship between the market capitalisation of the largest twenty firms¸ obtained in Worldscope,
and total market capitalisation (Datastream country indexes are used as country market capitalisation).
Panel A: Threshold 5%
Country
% of
Country Financial Diverse Individuals Financial Government Widely
Market Cap Institution Shareholders Vehicle Held
Australia 68.2 35 5 0 0 5 55 Austria 84.9 0 45 10 30 5 10
Belgium 86.4 5 25 20 30 10 10 Canada 46.3 65 5 15 0 0 15
Chile 75.2 5 30 45 15 0 5
Denmark 85.9 40 15 15 30 0 0 Finland 87.4 10 30 10 10 25 15
France 59.8 10 5 10 15 20 40
Germany 61.2 5 15 25 10 10 35 Greece 84.6 10 25 30 0 25 10
Hong Kong 72.1 0 35 25 0 30 10
India 46.3 0 40 15 0 40 5 Indonésia 81.4 15 30 15 0 25 15
Ireland 90.1 50 40 0 5 0 5
Italy 67.2 0 25 15 45 5 10 Japan 19.8 15 5 0 5 25 50
Malaysia 62.9 10 70 20 0 0 0
Netherlands 77.4 40 20 10 10 5 15 New Zealand 78.0 50 35 5 0 10 0
Norway 85.7 15 40 25 0 20 0
Portugal 96.0 0 70 25 5 0 0 Singapore 68.9 5 25 20 0 35 15
South Africa 55.5 55 40 0 0 0 5
South Korea 62.7 20 45 10 0 15 10 Spain 76.6 5 20 25 30 5 15
Sweden 79.9 25 35 25 0 10 5
Switzerland 76.6 5 25 30 0 10 30 Taiwan 66.9 10 40 20 0 10 20
Thailand 78.3 0 40 15 0 40 5
Turkey 73.5 0 40 55 5 0 0
UK 64.5 40 5 0 0 0 55
USA 25.5 35 0 20 0 0 45
Mean 70.2 18.1 28.9 17.3 7.7 12.0 15.9 Median 74.3 10 30 15 0 10 10
20
Panel B: Threshold 20%
Country Financial Diverse Individuals Financial Government Widely Institution Shareholders Vehicle Held
Australia 10 0 0 0 5 85
Austria 0 40 15 15 5 25 Belgium 0 20 20 25 10 25
Canada 0 5 15 0 0 80
Chile 5 20 45 5 0 25 Denmark 15 15 15 25 0 30
Finland 0 30 5 5 20 40
France 0 5 5 5 20 65 Germany 0 15 20 0 10 55
Greece 5 20 25 0 25 25
Hong Kong 0 35 25 0 30 10 India 0 35 10 0 35 20
Indonesia 0 30 15 0 25 30
Ireland 25 40 0 0 0 35 Italy 0 20 15 15 5 45
Japan 0 5 0 0 25 70
Malaysia 10 70 20 0 0 0 Netherlands 15 20 10 0 0 55
New Zealand 30 35 5 0 10 20
Norway 5 35 25 0 20 15 Portugal 0 70 25 0 0 5
Singapore 0 20 10 0 35 35
South Africa 10 40 0 0 0 50 South Korea 0 35 5 0 15 45
Spain 0 10 25 5 0 60
Sweden 15 35 25 0 5 20 Switzerland 0 25 20 0 10 45
Taiwan 0 30 10 0 5 55
Thailand 0 25 5 0 40 30 Turkey 0 40 55 5 0 0
UK 15 5 0 0 0 80
USA 0 0 15 0 0 85
Mean 5.0 25.9 15.2 3.3 11.1 39.5
Median 0 25 15 0 5 35

21
Table 2: Summary of Variables Anti-director rights is from La Porta et al (1998) and ranges from 0 to 6. Corruption perception index is from Transparency International (2005) and ranges from 0 to 10. Rule of law is from La Porta et al (1998) and varies from 0 to 10, with lower values for less
tradition for law and order. Disclosure level is from Bhattacharya et al (2003), with higher value indicating more disclosure. The original source is the Center for International Financial Analysis and Research (CIFAR). Liquidity ratio is from World Development
Indicators and is defined as volume traded at a local stock exchange divided by the gross domestic product (GDP) - average from 1999 to 2003. Size of mutual fund industry is from Investment Company Institute (ICI) and relates the total net assets of mutual funds with
GDP in 2005. Private credit is from World Bank and is defined by domestic credit provided by banking sector % of GDP 2004. GDP per capita in 2005 is from International Monetary Fund (IMF). Law is a dummie variable (1=common; 0=civil). Religion is a dummie
variable (1=Catholic; 0=other). The median market capitalisation of the 20 largest firms by country, million dollar denominated, is from Worldscope (WS Item, WC07211). The median market-to-book of the 20 largest firms by country is also Worldscope. Market-to-
book is defined as total assets (Worldscope Item, WC 02999) minus book equity - defined as total assets minus total liabilities (WC 03351) and preferred stock (WC 03451) plus deferred taxes (WC 03263) and convertible debt (WC 18282) - plus market capitalisation
(WC 08001), local currency denominated, divided by total assets. The median annualised volatility of the 20 largest firms by country is calculated using Datastream data, dollar denominated, considering weekly returns during 2000-2005.
Panel A: Country-Level Variables
Country Anti-Director Corruption Rule of Disclosure Liquidity Size of Mutual Private GDP Law Religion
Rights Perc. Index Law Level Ratio Fund Industry Credit per Cap.
Australia 4 8.8 10.0 80 0.97 1.10 1.00 30.897 Common Other
Austria 2 8.7 10.0 62 0.16 0.37 1.23 33.432 Civil Catholic
Belgium 0 7.4 10.0 68 0.71 0.33 1.12 31.244 Civil Catholic
Canada 5 8.4 10.0 75 1.02 0.50 0.97 34.273 Common Catholic
Chile 5 7.3 7.02 78 0.83 0.15 0.70 11.937 Civil Catholic
Denmark 2 9.5 10.0 75 0.58 0.31 1.66 34.740 Civil Other
Finland 3 9.6 10.0 83 1.78 0.24 0.70 31.208 Civil Other
France 3 7.5 8.98 78 0.88 0.67 1.07 29.187 Civil Catholic
Germany 1 8.2 9.23 67 0.56 0.71 1.43 30.579 Civil Other
Greece 2 4.3 6.18 61 0.80 0.16 1.05 22.392 Civil Other
Hong Kong 5 8.3 8.22 73 3.39 2.83 1.49 33.479 Common Other
India 5 2.9 4.17 61 0.30 0.06 0.60 3.320 Common Other
Indonesia 2 2.2 3.98 NA 0.23 NA 0.71 4.459 Civil Other
Ireland 4 7.4 7.80 81 0.67 3.01 1.18 40.610 Common Catholic
Italy 1 5.0 8.33 66 0.53 0.27 1.05 28.534 Civil Catholic
Japan 4 7.3 8.98 71 0.68 0.10 1.55 30.615 Civil Other
Malaysia 4 5.1 6.78 79 1.41 NA 1.34 11.201 Common Other
Netherlands 2 8.6 10.0 74 1.36 0.16 1.67 30.862 Civil Catholic
New Zealand 4 9.6 10.0 NA 0.40 0.10 1.21 24.797 Common Other
Norway 4 8.9 10.0 75 0.37 0.16 0.11 42.364 Civil Other
Portugal 3 6.5 8.68 NA 0.47 0.17 1.51 19.335 Civil Catholic
Singapore 4 9.4 8.57 79 1.59 NA 0.80 28.368 Common Other
South Africa 5 4.5 4.42 79 1.54 0.31 0.85 12.161 Common Other
South Korea 2 5.0 5.35 68 0.48 0.29 1.01 20.590 Civil Other
Spain 4 7.0 7.80 72 0.76 0.30 1.39 26.320 Civil Catholic
Sweden 3 9.2 10.0 83 1.14 0.34 1.13 29.926 Civil Other
Switzerland 2 9.1 10.0 80 2.52 0.33 1.75 32.571 Civil Catholic
Taiwan 3 5.9 8.52 58 1.02 0.19 1.67 27.721 Civil Other
Thailand 2 3.8 6.25 66 0.38 NA 1.05 8.368 Common Other
Turkey 2 3.5 5.18 58 0.33 0.07 0.60 7.950 Civil Other
UK 5 8.6 8.57 85 1.59 0.26 1.58 30.436 Common Other
USA 5 7.6 10.0 76 1.42 0.76 2.71 41.399 Common Other
Mean 3.2 7.0 8.22 72.8 0.97 0.51 1.18 25.790
Median 3.0 7.5 8.63 75 0.78 0.30 1.13 29.557
22
Panel B: Firm-Level Variables
Country Market Capitalisation Market-to-Book Volatility
(median) (median) (median)
Australia 15.219 1.41 0.22 Austria 4.077 1.23 0.27
Belgium 6.896 1.34 0.25
Canada 28.917 1.35 0.24 Chile 2.763 1.24 0.27
Denmark 4.014 1.51 0.29
Finland 4.067 1.50 0.31 France 47.826 1.19 0.29
Germany 32.799 1.07 0.34
Greece 4.483 1.38 0.30 Hong Kong 13.974 1.14 0.30
India 10.914 1.72 0.41
Indonesia 2.242 1.52 0.49 Ireland 2.979 1.57 0.27
Italy 17.247 1.13 0.28
Japan 49.882 1.11 0.34
Malaysia 4.206 1.22 0.20
Netherlands 14.195 1.39 0.34
New Zealand 1.084 1.49 0.26 Norway 3.125 1.51 0.35
Portugal 2.360 1.18 0.26
Singapore 4.108 1.15 0.28 South Africa 10.106 1.56 0.35
South Korea 12.919 1.20 0.46
Spain 16.121 1.31 0.23 Sweden 13.464 1.36 0.30
Switzerland 16.367 1.74 0.32
Taiwan 9.321 1.41 0.35 Thailand 2.814 1.24 0.36
Turkey 2.919 1.23 0.56
UK 71.490 1.62 0.26 USA 155.476 1.93 0.27
Mean 18.387 1.37 0.31
Median 9.714 1.36 0.29

23
Table 3: Univariate Analysis by Category of Ultimate Owner
The table compares means of firms (in percentage) by category of ultimate owners and t-statistics based on the 20% percent and the
5% threshold, for a sample of the largest firms by country. All ultimate owners representing more than 5% of voting rights are
included in the sample. However, if the analysis imposes a 20% threshold (Panel B), and the sum of voting rights is lower than 20%, a firm is widely held. Means for countries are grouped according to the following criteria: Legal environment; Anti-director rights;
Corruption perception index; Rule of law; Disclosure level; Religion; Liquidity ratio; Private credit; GDP per capita; Size of mutual fund industry; Market capitalisation by firm (country median); Market-to-book (country median); Volatility by firm (country median).
*, **, and ***, indicate statistical significance at 10%, 5% and 1%. N is the number of countries.
Panel A: 5% threshold
N Financial Diverse Individuals Financial Government Widely Institution Shareholders Vehicle Held
Means
Common 12 28.8 28.3 11.3 0.4 13.3 17.9 Civil 20 11.8 29.3 21.0 12.0 11.3 14.8
t – statistic (2.27)** (-0.13) (-2.45)** (-3.74)*** (0.38) (0.46)
High Anti-director rights 15 25.7 26.3 14.3 3.7 11.3 18.7 Low Anti-director rights 17 11.5 31.2 20.0 11.2 12.6 13.5
t – statistic (2.15)** (-0.78) (-1.28) (-1.86) (-0.28) (0.83)
High Corruption Perc. Index 16 23.8 21.3 15.3 6.6 11.6 21.6 Low Corruption Perc. Index 16 12.5 36.6 19.4 8.8 12.5 10.3
t – statistic (1.72)* (-2.77)*** (-0.92) (-0.50) (-0.21) (1.99)*
High Rule of Law 16 22.2 23.4 15.3 9.1 9.7 20.3 Low Rule of Law 16 14.1 34.4 19.4 6.3 14.4 11.6
t – statistic (1.21) (-1.87)* (-0.92) (0.65) (-1.05) (1.51)
High Disclosure Level 15 27.0 24.7 15.7 5.0 8.3 19.3 Low Disclosure Level 14 7.9 30.0 19.6 11.8 16.1 14.6
t – statistic (3.19)*** (-0.89) (-0.83) (-1.45) (-1.66) (0.75)
Catholic 11 16.8 28.2 18.6 16.8 5.5 14.1 Others 21 18.8 29.3 16.7 2.9 15.5 16.9
t – statistic (-0.25) (-0.17) (0.42) (2.95)*** (-2.83)*** (-0.52)
High Liquidity Ratio 16 23.7 23.7 15.3 10 8 19.3 Low Liquidity Ratio 16 15.0 31.2 19.6 7.3 12.7 14.2
t – statistic (1.18) (-1.21) (-0.81) (0.56) (-1.11) (0.76)
High Size of Mutual Fund Ind. 14 19.4 22.1 15.7 10.7 7.5 20.0 Low Size of Mutual Fund Ind. 14 6.8 32.1 18.9 6.8 12.9 13.9
t – statistic (2.51)** (-1.66) (-0.63) -0.82 (-1.31) (0.92)
High Private Credit 16 20.6 29.7 15.9 7.8 7.5 18.4 Low Private Credit 16 15.6 28.1 18.8 7.5 16.6 13.4
t – statistic (0.73) (0.25) (-0.63) -0.07 (-2.14)** (0.84)
Large GDP per Capita 16 24.1 21.6 14.4 8.1 9.7 22.2 Small GDP per Capita 16 12.2 36.3 20.3 7.2 14.4 9.7
t – statistic (1.82)* (-2.63)** (-1.36) -0.21 (-1.05) (2.25)**
High Market Capitalisation 16 22.2 20.3 14.1 7.2 11.3 25.0 Low Market Capitalisation 16 14.1 37.5 20.6 8.1 12.8 6.9
t – statistic (1.21) (-3.22)*** (-1.51) (-0.21) (-0.34) (3.61)***
High Market-to-Book 16 27.2 26.6 13.8 3.4 11.6 17.5 Low Market-to-Book 16 9.1 31.3 20.9 11.9 12.5 14.4
t – statistic (3.01)*** (-0.77) (-1.67) (-2.06)** (-0.21) (0.52)
High Volatility 16 14.1 31.6 19.4 2.5 18.1 14.4
Low Volatility 16 22.2 26.3 15.3 12.8 5.9 17.5
t – statistic (-1.21) (0.87) (0.92) (-2.61)** (3.08)*** (-0.52)

24
Panel B: 20% threshold
N Financial Diverse Individuals Financial Government Widely Institution Shareholders Vehicle Held
Means
Common 12 8.3 25.8 8.8 0.0 12.9 44.2 Civil 20 3.0 26.0 19.0 5.3 10.0 36.8
t – statistic (1.63) (-0.02) (-2.66)** (-2.87)*** (0.55) (0.74)
High Anti-director rights 15 7.3 23.7 13.0 0.7 10.7 44.7 Low Anti-director rights 17 2.9 27.9 17.1 5.6 11.5 35.0
t – statistic (1.53) (-0.69) (-0.90) (-2.25)** (-0.18) (1.09)
High Corruption Perc. Index 16 6.6 20.0 13.1 3.1 10.6 46.6
Low Corruption Perc. Index 16 3.4 31.9 17.2 3.4 11.6 32.5
t – statistic (1.10) (-2.07)** (-0.91) (-0.13) (-0.21) (1.68)
High Rule of Law 16 5.6 22.2 13.8 4.7 8.8 45 Low Rule of Law 16 4.4 29.7 16.6 1.9 13.4 34.1
t – statistic (0.43) (-1.25) (-0.62) (1.16) (-1.06) (1.28)
High Disclosure Level 15 7.3 23.0 13.3 2.7 7.7 46.0 Low Disclosure Level 14 1.4 25.0 17.1 4.6 14.6 37.1
t – statistic (2.58)** (-0.34) (-0.78) (-0.73) (-1.50) (0.99)
Catholic 11 4.1 25.0 17.7 6.4 4.5 42.3 Others 21 5.5 26.4 13.8 1.7 14.5 38.1
t – statistic (-0.45) (-0.21) (0.86) (1.67) (-2.81)*** (0.48)
High Liquidity Ratio 16 5.3 22.5 14.4 0.9 9.7 47.2 Low Liquidity Ratio 16 4.7 29.4 15.9 5.6 12.5 31.9
t – statistic (0.22) (-1.15) (-0.35) (-2.01)** (-0.63) (1.84)*
High Size of Mutual Fund Ind. 14 5.4 20.4 14.3 5.4 6.8 47.9 Low Size of Mutual Fund Ind. 14 5.4 28.6 16.8 2.1 11.4 35.7
t – statistic (0.00) (-1.38) (-0.49) (1.18) (-1.17) (1.32)
High Private Credit 16 7.8 28.1 14.4 2.8 6.3 40.6 Low Private Credit 16 2.2 23.8 15.9 3.8 15.9 38.4
t – statistic (2.08)** (0.72) (-0.35) (-0.38) (-2.35)*** (0.25) Large GDP per Capita 16 6.3 20.3 13.1 4.4 8.8 47.2
Small GDP per Capita 16 3.8 31.6 17.2 2.2 13.4 31.9
t – statistic (0.88) (-1.95)* (-0.91) (0.89) (-1.06) (1.84)* High Market Capitalisation 16 4.1 18.1 11.9 1.6 10.0 54.4
Low Market Capitalisation 16 5.9 33.8 18.4 5.0 12.2 24.7
t – statistic (-0.65) (-2.88)** (-1.50) (-1.43) (-0.49) (4.31)*** High Market-to-Book 16 9.1 24.7 11.3 1.9 10.0 43.1
Low Market-to-Book 16 0.9 27.2 19.1 4.7 12.2 35.9
t – statistic (3.28)*** (-0.41) (-1.82)* (-1.16) (-0.49) (0.83) High Volatility 16 3.1 28.4 15.9 0.6 16.6 35.3
Low Volatility 16 6.9 23.4 14.4 5.9 5.6 43.8
t – statistic (-1.34) (0.82) (0.35) (-2.32)** (2.72)*** (-0.98)

25
Table 4: Multivariate Analysis of Cross-Country Variations on Widely Held Firms The table reports the results of OLS regressions for a sample of 32 countries, considering 20% threshold. The dependent variable is mean
percentage of widely held firms by country. Independent variables are defined in Table 3. Heteroskedasticity-consistent standard errors are
reported in parentheses.
Law 4.432 4.014 3.778 4.434
(0.54) (0.51) (0.50) (0.59)
Corruption Perc. Index 0.152 0.855 1.262 1.398
(0.06) (0.30) (0.85)
(1.02)
Rule of Law -0.442 0.522 1.412 1.491
(-0.12) (0.16) (0.83)
(0.98)
Religion 3.572 3.807 4.017 3.578
(0.64) (0.69) (0.78) (0.67)
GDP per Capita 6.471 5.931
(0.78) (1.21)
Market Capitalisation 14.549 15.229 15.323 15.118 14.684 15.441 15.250
(7.70) *** (8.58) *** (9.83) *** (9.26) *** (8.49) *** (9.76) *** (9.04) ***
Market-to-Book 14.960 13.595 13.674 13.537 16.657 14.801 15.298
(0.93) (0.83) (0.85) (0.84) (1.46) (1.21) (1.26)
Adj. R2 0.54 0.55 0.57 0.56 0.59 0.59 0.59
N 32 32 32 32 32 32 32

26
References
Bebchuk, L., 1999, A rent-protection theory of corporate ownership and control, Working Paper, Harvard
Law and Economics.
Berle, A., and G. Means, 1932, The modern corporation and private property (Macmillan, New York).
Bhattacharya, U., H. Daouk, and M. Welker, 2003, The world price of earnings opacity, Accounting Review
78, 641-678.
Claessens, S., S. Djankov, and L. Lang, 2000, The separation of ownership and control in East Asian
corporations, Journal of Financial Economics 58, 81-112.
Demirgüç-Kunt, A., and R. Levine, 1999, Bank-based and market-based financial systems: Cross country
comparisons, Working Paper, World Bank Policy Research.
Demsetz, H., and K. Lehn, 1985, The structure of corporate ownership: Causes and consequences, Journal of
Political Economy 93, 1155-1177.
Dyck, A., and L. Zingales, 2002, Private benefits of control: An international comparison, Working Paper,
Center for Economic and Policy Research.
Faccio, M., and L. Lang, 2002, The ultimate ownership of Western European countries, Journal of Financial
Economics 65, 365-395.
Goergen, M., and L. Renneboog, 1998, Insider retention and long-run performance in German and UK IPO’s,
Working Paper, University of Manchester institute of Science and Technology.
Guedhami, O., and J. Pittman, 2006, Ownership concentration in privatized firms: The role of disclosure
standards, auditor choice, and auditing infrastructure, Journal of Accounting Research 44, 889-929.
Himmelberg, C., G. Hubbard, and D. Palia, 1999, Understanding the determinants of managerial ownership
and the link between ownership and performance, Journal of Financial Economics 53, 353-384.
Högfeld, P., 2004, The history and politics of corporate ownership in Sweden, Working Paper, European
Corporate Governance Institute.
Holderness, C., 2005, A contrarian view of ownership concentration in the United States and around the
world, AFA 2006 Boston Meetings.
Jensen, M., and W. Meckling, 1976, Theory of the firm: Managerial behavior, agency costs and ownership
structure, Journal of Financial Economics 3, 305-360.
Kahn, C., and A. Winton, 1998, Ownership structure, speculation and shareholder intervention, Journal of
Finance 53, 99-130.
Khorana, A., H. Servaes, and L. Wedge, 2005, Explaining the size of the mutual fund industry around the
world, Journal of Financial Economics 78, 145-185.
27
La Porta, R., F. de Silanes, A. Shleifer, and R. Vishny, 1998, Law and finance, Journal of Political Economy
106, 1113-1155.
La Porta, R., F. de Silanes, A. Shleifer, and R. Vishny, 1999, Corporate ownership around the world, Journal
of Finance 54, 471-517.
La Porta, R., F. de Silanes, A. Shleifer, and R. Vishny, 2000, Investor protection and corporate governance,
SSRN: http://ssrn.com/abstract=183908.
Li, D., F. Moshirian, P. Pham, and J. Zein, 2006, When financial institutions are large shareholders: The role
of macro corporate governance environments, Journal of Finance 61, 2975-3007.
Majluf, N., N. Abarca, D. Rodriguez, and L. Fuentes, 1998, Governance and ownership structure in Chilean
economic groups, Revista Abante 1, 111-139.
Prowse, S., 1992, The structure of corporate ownership in Japan, Journal of Finance 47, 1121-1140.
Rajan, R., and L. Zingales, 1998, Financial dependence and growth, American Economic Review 88, 559-
586.
Roe, M., 2000, Political foundations for separing ownership from corporate control, Stanford Law Review 53,
539-606.
Shleifer, A., and R. Vishny, 1986, Large shareholders and corporate control, Journal of Political Economy 94,
539-488.
Stulz, R., and R. Williamson, 2003, Culture, openness, and finance, Journal of Financial Economics 70, 313-
349.
Valadares, S., and R. Leal, 2000, Ownership and control structure of Brazilian companies, Revista Abante 3,
29-56.
Weber, M., 1905, The Protestant Ethic and the spirit of capitalism (Unwin Wyman, Boston).