Embed Size (px)
Citation preview

Who is Placed in Special Education? Assessing the Longitudinal Profiles, Academic Achievement,
and Behavioral Adjustment of Students At-Risk for Special Education Identification
by
Adrienne D. Woods
A dissertation submitted in partial fulfillment
of the requirements for the degree of
Doctor of Philosophy
(Education and Psychology)
in the University of Michigan
2018
Doctoral Committee:
Professor Frederick J. Morrison, Chair
Associate Professor Kai Cortina
Professor Pamela Davis-Kean
Assistant Professor Christina Weiland

ii
DEDICATION
This dissertation is dedicated to my brother. Al, you are constantly inspiring me,
challenging me, and pushing me to be better. Your struggles, but more importantly, your
successes both within and outside of school drive me to improve education for all students,
everywhere. I hope this work and the work to come makes you as proud of me as I am of you. I
love you.

iii
ACKNOWLEDGEMENTS
First and foremost, thank you to Fred, for believing in my big ("wacky") ideas and giving
me the opportunity to attend the University of Michigan. Thank you for always pulling me back
out to the "big picture," for making me laugh at myself, for your unending support, and for
keeping my belly and heart full. I have learned so much more from you than just science, and I
will forever be grateful to you for taking a chance on me. I've got the next round!
To Pam, for taking me under your wing and shaping me into a stronger scientist. Your
mentorship has provided the most helpful guidance at every stage of the research process. I
greatly appreciate your investment in the future and your willingness to mold young graduate
students into confident methodologists. I will miss our multi-hour meetings, breakfasts at
Afternoon Delight, and mussels at the Earle! Thank you, thank you!
To CPEP, for being such an amazing and supportive community. To Janie and Katie, for
all of your knowledge and support. To Rackham and AERA, for believing in my big ideas and
funding my dissertation. To the members of the Pathways to Literacy lab: being your friend and
colleague has made me a stronger and better person in so many ways, and I am glad to have had
the opportunity to work with you all (and, to have had windows in my office!). To the Human
Development and Quantitative Methods lab, for keeping a smile on my face through all the paper
editing, Twitter talk, and methods debates. I would be so much lesser without you
#youngscientists. To the Fragile Families team, for letting my do my thing and collect some cool
data (and especially to Colter, for your enthusiasm about the School Records project and your
willingness to fund my last year). Finally, to the Biodemography group, for teaching me so many

iv
new things (and introducing me to March Mammal Madness). GO BLUE!
To my family, my rock, for everything. I would not be here without your support, love,
and understanding while I pursued a dream six years in the making. Thank you for letting me
escape to you and for understanding when I couldn't. For all the home-cooked meals, house
cleaning, pet sitting, plant watering, and unwavering love when I was stressed, or traveling, or
writing feverishly, or a mess… I love you!
To all my friends who have kept me sane throughout the past six years (Alexa S., Sean,
Inah + Andrew + Emily + Elena, Valerie + Olive, Brie + Shae + Harper, Zach, Tom, Louis,
Christian + Rachel, Sarah M., Alexa E., Shar, Sammy, Amira, Jeffrey + Richard, and so many
others…). Especially to Sarah, my best friend, my colleague, my sister. I love you. Thank you all
for acknowledging my voice, for knowing when to build me up and when to reorient me, for
guiding me through the toughest of times and celebrating alongside me during the best of times.
Trivia nights, volleyball, orchestra, Null, Beer Grotto, work dates, #sports, babies, music, dogs,
and game nights forever!
To my team. Thank you for allowing me to reconnect with my community, and to keep
my link to swimming alive. I am beyond lucky to have had the opportunity to coach you, to
know you, to learn from you, and to watch you all grow into amazing young women. I am so
blessed, and I am so proud of you all. Let's Go, Dreads! To Cory, for welcoming me back with
open arms and believing in my crazy ideas. For giving me autonomy and free reign over
drylands (muahaha), for spending hours debating Game of Thrones theories and dissecting
Marvel shows, for bringing me into your home and making me a member of your family,
especially after my family moved away. You are more than a coach, more than a teacher, more
than a friend. Love ya, Berg.

v
Lastly, thank you to every child who is a bit "different." To every family who shared their
story with me. To every principal working to unite general and special education. To every
teacher who tirelessly works to connect with all of their students, regardless of (dis)ability. This
is for you.

vi
PREFACE
This research was supported by a grant from the American Educational Research Association
which receives funds for its "AERA Grants Program" from the National Science Foundation,
under Grant #DRL-1749275. Opinions reflect those of the author and do not necessarily reflect
those of the granting agencies.

vii
TABLE OF CONTENTS
DEDICATION ii
ACKNOWLEDGEMENTS iii
PREFACE vi
LIST OF TABLES xii
LIST OF FIGURES xv
LIST OF APPENDICES xvi
ABSTRACT xvii
CHAPTER
I. Introduction: Revisiting the Problem of Unequal Access to and Opportunities Within
Special Education 1
Unequal Access to Special Education 1
Interdisciplinary Focus on Special Education 3
Study 1: Examining Longitudinal Patterns of K-8 Special Education Service Receipt 5
Study 2: Contextualizing Patterns of Special Education Placement and Service Receipt 6
Study 3: What Happens to Students in Special Education? Academic Achievement and
Behavioral Adjustment Following Identification 7
References 8
II. Examining Longitudinal Patterns of K-8 Special Education Service Receipt 13

viii
Abstract 13
Introduction 14
Research Questions 16
Method 17
Data 17
Variable Information 17
Missing Data 21
Normality and Weighting 22
Analytical Strategy 23
Results 23
Do Students Follow Different K-8 Paths of Special Education Service Receipt? 23
Which Students Follow these K-8 Special Education Trajectories? 25
What Individual- and School-Level Sociodemographic, Academic, and Behavioral
Characteristics Uniquely Predict Special Education Trajectories? 27
Discussion 29
Limitations 34
Conclusion 34
References 36
III. Contextualizing Patterns of Special Education Placement and Service Receipt 56
Abstract 56
Introduction 58
Importance of Analyzing Multiple Levels of Influence 60
Importance of Analyzing Change Over Time 61

ix
Who is Placed in Special Education? The "Frog Pond Effect" 62
Research Questions and Hypotheses 64
Method 66
Data Source and Sample 66
Variable Information 67
Missing Data 72
Analytical Plan and Methodology 73
Results 75
Analysis 1: Who is Placed in Special Education at the Transition to School and Over
Time? 75
Analysis 2: Among Special Education Students, What Predicts Earlier or Later Service
Receipt? 79
Discussion 82
Conclusion 89
References 91
IV. What Happens to Students in Special Education? Academic Achievement and
Behavioral Adjustment Following Identification 108
Abstract 108
Introduction 110
Background 111
For Whom are Special Education Services Effective? 111
When Are Special Education Services Effective? 112
Quasi-Experimental Designs in Special Education 113

x
The Present Study 115
Method 116
Sample 116
Propensity-Matching Procedure 118
Missing Data and Weighting 119
Variables of Interest 120
Results 123
Propensity-Matching Results 123
RQ1: Distal/Proximal Outcomes 124
RQ2: Timing of Service Receipt 125
RQ3: Who Receives Earlier vs. Later Services? 126
Extensions 127
Discussion 132
Conclusion 138
References 140
V. Conclusion: What Does Examining Developmental Trajectories Tell Us About Special
Education? 155
Implications Within and Across Studies 155
Theoretical Implications 158
Future Directions 161
Conclusion 162
References 164

xi
APPENDICES 168
Appendix A 169
Appendix B 175
Appendix C 181
Appendix D 188
Appendix E 194

xii
LIST OF TABLES
II.1 Variable Descriptions 43
II.2 Fit Statistics for 2-, 3-, 4-, and 5-Solution Latent Class Analysis 45
II.3 4-Solution Latent Class Analysis Classification Patterns of Special Education
Service Receipt 46
II.4 Individual-Level Weighted Kindergarten Descriptive Statistics by Special
Education Trajectory 47
II.5. School-Level Weighted Kindergarten Descriptive Statistics by Special
Education Trajectory 49
II.6. Relative Risk of Placement in LCGA Trajectories by Kindergarten Predictors 51
III.1 Descriptive Information for Weighted Analytical Samples 101
III.2 Percent of Missing Data at Each Wave for Individual and School-Level
Predictors (Unweighted) 103
III.3 Full Results of Multilevel Logistic Regression Assessing Likelihood of
Placement Over Time (m = 40 Imputed Datasets) 104
III.4 Full Results of HGLM Among Students Who Receive At Least One
Wave of Special Education Services (m = 40 Imputed Datasets) 106
IV.1 Balance of the Propensity Scores for Spring 1st Grade Placement (n = 640) 146
IV.2 Balance of the Propensity Scores for Spring 3rd Grade Placement (n = 250) 147
IV.3 Estimated Effects of Spring 1st Grade Special Education Services on
3rd And 5th Grade Academic Outcomes 148
IV.4 Estimated Effects of Spring 1st Grade Special Education Services on
3rd And 5th Grade Behavioral Adjustment 149
IV.5 Estimated Effects of Spring 3rd Grade Special Education Services on

xiii
5th Grade Academic Outcomes 150
IV.6 Estimated Effects of Spring 3rd Grade Special Education Services on
5th Grade Behavioral Adjustment 151
IV.7 Descriptive Statistics for Subsample of First-Graders (n = 180) and Third-
Graders (n = 310) with Linked Special Education Teacher Survey Data 152
A.1 Home Environment and Cognitive Stimulation Variable Creation Items 173
A.2 Parenting Quality and Behaviors Variable Creation Items 174
B.1 Partial and Zero-Order Correlations for Individual-Level Variables 176
B.2 Partial and Zero-Order Correlations for School-Level Variables 179
C.1 Table C.1 Descriptions of Variables Used in Propensity Score Creation 181
C.2 Weighted Descriptive Statistics [M (SD) or %] by Spring 1st Grade Strata 184
C.3 Weighted Descriptive Statistics [M (SD) or %] by Spring 3rd Grade Strata 186
D.1 Balance of Propensity Scores for Spring 1st Grade Placement, Matched on
Special Education Teacher Survey Variables (n = 310) 188
D.2 Balance of Propensity Scores for Spring 3rd Grade Placement, Matched on
Special Education Teacher Survey Variables (n = 210) 189
D.3 Estimated Effects of Spring 1st Grade Special Education Services on 3rd and 5th
Grade Academic Outcomes, Matched on Special Education Teacher Survey
Variables 190
D.4 Estimated Effects of Spring 1st Grade Special Education Services on 3rd and 5th
Grade Behavioral Adjustment, Matched on Special Education Teacher Survey
Items 191
D.5 Estimated Effects of Spring 3rd Grade Special Education Services on 5th Grade
Academic Outcomes, Matched on Special Education Teacher Survey Items 192
D.6 Estimated Effects of Spring 3rd Grade Special Education Services on 5th Grade
Behavioral Adjustment, Matched on Special Education Teacher Survey Items 193

xiv
E.1 Estimated Effects of 1st Grade Special Education Services on 3rd and 5th Grade
Reading and Mathematics Theta Scores and Highest Proficiency Level Achieved 194
E.2 Estimated Effects of Spring 3rd Grade Special Education Services on 5th Grade
Reading and Mathematics Theta Scores and Highest Proficiency Level Achieved 195

xv
LIST OF FIGURES
II.1 4- and 5-Solution Latent Class Growth Analyses of Special Education Trajectories 53
II.2 Weighted Proportion of Students in Each Trajectory by Primary Special
Education Disability Category 54
II.3 Longitudinal Academic Achievement by Special Education Trajectory 55
IV.1 Publicly-Available Data Provided by The National Center for Education
Statistics (2011) Contrasting the Proportion of U.S. Students Aged 6-11 with
Speech/Language Impairments versus Learning Disabilities 154
V.1 Percent of Black and White Students with an IEP who Score in the Bottom
10th Percentile for Reading at Each Wave of Data Collection 167
D.1 T-Scores in Reading and Mathematics by IEP Status in 1st or 3rd Grade 196

xvi
LIST OF APPENDICES
A. Information and Justification for Home Environment and Parenting
Variable Creation 169
B. Partial and Zero-Order Correlations 175
C. Covariate Descriptions Used in 1st and 3rd Grade Propensity Score Generation 181
D. Treatment Effects for Students Propensity-Matched on Special Education
Teacher Survey Variables 188
E. Alternative Specifications for Measuring Academic Gain Over Time 194

xvii
ABSTRACT
This dissertation is comprised of three studies using restricted data from the ECLS-
K:1998 to address the questions who is placed in special education? and what happens after they
are placed? Though these questions have been extensively studied, existing research has largely
ignored the intersection of longitudinal developmental pathways and service delivery. In Study 1
("Examining Longitudinal Patterns of K-8 Special Education Service Receipt") special
educational trajectories from Kindergarten through grade 8 were analyzed using latent class
growth modeling. Relative to students who never receive services, students with disabilities fell
into three trajectories: Persistent (students received uninterrupted services from Kindergarten
through 8th grade), Terminal (students received services for the first few years of schooling, then
exited out of special education), and Delayed (students were not placed in special education until
partway through schooling). Multinomial logistic regression revealed that different combinations
of child, home, and schooling factors predicted the odds of following these trajectories of special
education, which bears consideration in cross-sectional identification research.
Study 2 ("Contextualizing Patterns of Special Education Placement and Service Receipt")
explored how individual likelihoods of receiving special education services were impacted by 1)
the contributions of individual and aggregated data, 2) modeling longitudinal trajectories from
Kindergarten through eighth grade, and 3) analyzing how the schooling context differentially
influences students from varying backgrounds and with different levels of achievement or
behavior. Results revealed that individual-level data was most predictive of service receipt,
though between a quarter and a third of the variability in special education status occurred

xviii
between schools; different factors predicted the likelihood of receiving services early in
schooling relative to later in schooling; and that the schooling context did not appear to
differentially affect the longitudinal likelihood of service receipt by race/ethnicity, achievement,
or behavior. This study is important for researchers and policymakers focused on the early
identification of disability and early identification disparities.
Lastly, Study 3 ("What Happens to Students in Special Education? Academic
Achievement and Behavioral Adjustment Following Identification") assessed the development of
reading, math, problem behaviors, and positive learning habits among students receiving earlier
or later services. Though advocates argue that early intervention is the best solution to alleviate
academic or behavioral issues, evidence toward the effectiveness of special education as an
intervention is meager and mixed. In this study, the propensity to receive services in either 1st
grade or 3rd grade was modeled by matching students who received services at least once during
grades 1-8 on a host of Kindergarten covariates. Results indicated that students who received
initial services in 1st grade made larger reading gains and scored higher tests of reading than
students who received services later in schooling. In contrast, students who received initial
services in 3rd grade did not significantly differ from their peers on any academic outcomes.
Overall, this dissertation weaves together a coherent story regarding who receives special
education services, at what developmental timepoints, and where, as well as what are the
consequences of receiving services at different timepoints during K-8 schooling. Addressing
developmental trajectories of service receipt also extended and validated existing research by
clarifying previous inconsistencies and oversimplifications. Educators and policymakers should
continue advocating for early services, and researchers should strive to understand why delayed
service receipt occurs, particularly among urban students with less-educated mothers.

1
CHAPTER I
Introduction:
Revisiting the Problem of Unequal Access to and Opportunity Within Special Education
U.S. special education students and their families have long struggled for equal access
and appropriate services. Although which children receive special education services has been
extensively studied, few studies have incorporated longitudinal designs with an explicit focus on
the developmental timing of service receipt. Moreover, how children fare after receiving services
has also been inconsistently studied, despite enormous policy consequences. The goal of this
dissertation was to coherently investigate precursors to special education placement, trajectories
of service receipt from Kindergarten through 8th grade, and the consequences of service receipt.
Beyond a commitment to safeguard the wellbeing of students with disabilities, these questions
are especially pressing for districts serving populations with high likelihoods of disability
identification, since special education costs roughly double that of general education (US
Department of Education, 2010).
Unequal Access to Special Education
Though the Education for All Children Act mandating de-segregation for students with
disabilities passed in 1974, special and general education largely remain two separate systems
(Reedy, 2004) and concern abounds over unequal access to services among various groups. For
instance, evidence suggests that about twice as many males are identified for special education as

2
females (e.g., Hibel, Farkas, & Morgan, 2010; Katusic, Colligan, Barbaresi, Schaid, & Jacobsen,
2001; Marder, 2009; Sullivan & Bal, 2013) likely because males also experience more cognitive
delays, behavior problems, and lowered academic achievement at the transition to school
(Hillemeier, Farkas, Morgan, Martin, & Maczuga, 2009; Matthews, Cameron, & Morrison,
2009). Racial/ethnic disparities have also been extensively studied, with most recent best-
evidence research suggesting that Black students are both disproportionately under-identified for
special education (Morgan et al., 2015, 2017a, 2017b) and receive fewer disability evaluations
prior to extreme punitive disciplinary actions, resulting in more out-of-school punishment and
lost educational opportunities (Collins et al., 2016; McWilliams & Fancher, 2010; Skiba et al.,
2011). Once Black students are identified for special education, they also spend less time in
general education classrooms relative to White special education students (Fierros & Conroy,
2002; Skiba, Poloni-Staudinger, Gallini, Simmons, & Feggins-Azziz, 2005). These inequalities
in service provision and opportunity are especially problematic given the wealth of research
demonstrating numerous benefits from increased access to and time physically spent in the
general education environment (e.g., Cosier et al, 2013; IDEA, 1997; Kavale & Forness, 2000).
Students' environments also greatly influence risk for disability identification. Rates of
disproportionality for emotional disturbances are higher in low-poverty districts (Oswald et al.,
1999; Skiba et al., 2005), indicating that whether and when a student is identified may be at least
partly dependent on district-wide characteristics. Poorer students are more often exposed to
environmental teratogens and toxins that may produce disability (e.g., high lead rates are linked
to cognitive delays; see Brooks-Gunn & Duncan, 1997). At the same time, these students
disproportionately lack access to trained professionals that could diagnose disabilities (Donovan
& Cross, 2002; Glascoe, 2000; Morgan et al., 2014; Peterson et al., 2011), increasingly leading

3
to delayed identification. This may be especially detrimental since remediation of learning may
be best accomplished through early identification and referral (e.g. Sigman, Peña, Goldin, &
Ribiero, 2014; Wolery & Bailey, 2002) given the developmental malleability of young children
(Glascoe, 2000).
The sum total of research investigating group differences in special education clearly
indicates that there is systemic inequality in identification and service delivery across students
and districts. This inequality damages the primary aim of special education: to provide
individualized education to students with disabilities according to their special educational needs.
The problem of unequal access to services prompts renewed focus on the questions of who is
placed into special education, and what happens to them following identification. Yet, despite
decades of research, consensus is lacking.
Interdisciplinary Focus on Special Education
There is evidence that addressing developmental timing and trajectory differences in
special education may clarify the problems we see with policy implementation and service
delivery. However, with few exceptions, special education researchers have largely ignored how
the developmental timing at which services are delivered influences who is placed in special
education and their subsequent schooling outcomes. Special education may therefore benefit
from an interdisciplinary focus at pathways through which disorder and disability manifest in
schools, as well as which students then receive special education services. The present studies
were approached with this interdisciplinary attitude in mind, drawing from three disciplines in
particular: developmental psychology, educational psychology, and special education.
Developmental psychology broadly aims to investigate how children and adults change
over time by focusing on the biological and social processes generating both stability and change

4
(Harris & Butterworth, 2002). Similarly, educational psychology brings this focus on
development into schools and classrooms, focusing on how children learn, think, and grow as
they progress through school (Ormrod, Saklofske, Schwean, Andrews, & Shore, 2005). As a
discipline, special education has been more focused on the legal requirements of schools to
educate all students with disabilities than on the process by which disability manifests in
educational settings over time. In this way, inferences about special education could be
strengthened through interdisciplinary research, particularly that which bridges with educational
and/or developmental psychology.
This dissertation is situated at the intersection of all three disciplines. Because IDEA has
mandated that all schools educate students with disabilities in a free, appropriate, and least-
restrictive environment, any research investigating the processes by which students are identified
for special education and the consequences of service receipt has readymade policy implications.
Yet, research that ignores or glosses over the importance of developmental timing and
trajectories, particularly with respect to the manifestation of disability within educational
contexts, may result in muddied or misinformed policy. Just as developmental psychology
emerged early in the 20th century to dispel the notion that children were just small versions of
adults, so too should special education researchers turn to uncovering why and how its youngest
students differ from its oldest in both educational need and consequences of service receipt.
The three studies within this dissertation investigate how risk factors for special
education placement and the consequences of receiving special education services change over
time and with development. Study 1 asks, Who is placed in special education? with regard to
educational trajectories from Kindergarten through grade 8. Study 2 builds upon this question by
contextualizing it within schools, where likelihood of placement depends on hierarchical

5
interactions between individual characteristics and school-level factors (e.g., individual
race/ethnicity interacting with schoolwide proportions of free lunch service). Finally, Study 3
assesses academic and behavioral outcomes for special education students based on the timing of
initial service receipt, initial diagnosis, and IEP goals.
Below, I briefly provide the justification for each study, though a fuller review of
literature is reserved for each chapter. All analyses were conducted using restricted data from the
Early Childhood Longitudinal Study, Kindergarten Class of 1998-1999 (ECLS-K). This study
followed a nationally-representative cohort of approximately 21,400 children for eight years,
collecting information about schooling experiences in Kindergarten, first, third, fifth, and eighth
grade. The longitudinal and comprehensive nature of this dataset lends itself to studying a wide
range of factors associated with schooling outcomes.
Study 1: Examining Longitudinal Patterns of K-8 Special Education Service Receipt
Most studies investigating special education identification disaggregate results by
disability type. However, pinpointing when certain populations are first identified for special
education in one disability category cannot account for the nuances accompanying long-term
trajectories throughout schooling. For instance, many students are identified early for speech and
language impairment but switch to receiving learning disability services partway through
elementary school (Marder, 2009; Snowling, Bishop, & Stothard, 2000). Studies that assess only
the timing of diagnosis by disability category and do not account for this category switching may
produce erroneous conclusions about the likelihood of identification and consequences of service
delivery. The first study of my dissertation therefore makes use of a novel approach in explaining
what makes these profiles of students qualitatively different from each other. Specifically, I ask
who is placed in special education? according to Kindergarten demographic factors that

6
differentially impact trajectories of service receipt throughout schooling.
Study 2: Contextualizing Patterns of Special Education Placement and Service Receipt
Capturing a clear snapshot of individual characteristics informing special education
placement is only part of the story, as analytical concerns abound in research examining who is
placed into special education. Urie Bronfenbrenner championed the idea that human
development takes place through processes of progressively more complex reciprocal interaction
nested within the contexts (both immediate and remote) of the developing person. These contexts
involve microsystems, such as the family, school, peer group, and workplace; mesosystems, such
as the links between the home and school; exosystems, such as the relationship between the
home and the parent's workplace or the neighborhood-community context; macrosystems of
overarching culture/society; and finally, chronosystems encompassing the change or consistency
over time in the person and their environment. He argued that to understand a person, one must
understand the context in which that person develops (see Bronfenbrenner, 1993). Thus, in
investigating why certain children might receive special education services over others, it is
important to deconstruct how individual-level characteristics (e.g., race/ethnicity, gender,
socioeconomic status) function alongside and within school-level factors (e.g., available school
resources and funding streams, student body characteristics). Yet, much existing research has
failed to account for both the dynamic nature of service receipt over time and the hierarchical
structure of educational data. Therefore, the goal of the second study in this dissertation was to
contextualize special education trajectories within schools, therefore addressing the
multiplicative, nested effects of individuals operating within larger educational structures. This
in turn allows for a more holistic explanation of why some students follow different trajectories
of service receipt throughout primary schooling.

7
Study 3: What Happens to Students in Special Education? Academic Achievement and
Behavioral Adjustment Following Identification
Finally, ascertaining who is placed into special education is only the beginning. The goal
of special education is to provide individualized services to students with disabilities in the hope
that they may be given the greatest opportunity to succeed in school. Advocates argue that early
intervention is the best solution to alleviate academic or behavioral issues in the long run (e.g.
Sigman, Peña, Goldin, & Ribiero, 2014; Wolery & Bailey, 2002), making it vital to ensure that
“at-risk” children have access to these services. Yet, evidence to the effectiveness of special
education as an intervention is meager, with some research suggesting that placing a child into
special education may set them on a path of reduced academic performance compared to their
non-special education peers (Cooc, 2014; Reynolds & Wolfe, 1999; Sullivan & Field, 2013).
Still more researchers argue that special education is accompanied by increased stigma, reduced
educational expectations by teachers and parents, and greater peer rejection and bullying (e.g.,
Ashby, 2010; Riddick, 2000; Rose, Monda-Amaya, & Espelage, 2011; Shifrer, 2013). To
paraphrase Donovan and Cross (2002), this is the paradox of special education: if placement may
lead to poorer outcomes, why advocate for early identification and referral? In elucidating this
paradox, the third and final study asks: what happens to students once they are placed in special
education?

8
References
Ashby, C. (2010). The trouble with normal: The struggle for meaningful access for middle
school students with developmental disability labels. Disability & Society, 25(3), 345–358.
http://doi.org/10.1080/09687591003701249
Bronfenbrenner, U. (1993). Ecological models of human development. Readings on the
Development of Children, 37-43. London: MacMillan.
Brooks-Gunn, J., & Duncan, G. J. (1997). The effects of poverty on children. The Future of
Children, 7(2), 55-71. https://dx.doi.org/10.2307/1602387
Collins, K. M., Connor, D., Ferri, B., Gallagher, D., & Samson, J. F. (2016). Dangerous
assumptions and unspoken limitations: A disability studies in education response to
Morgan, Farkas, Hillemeier, Mattison, Maczuga, Li, and Cook (2015). Multiple Voices
for Ethnically Diverse Exceptional Learners, 16(1), 4-16. Retrieved from
http://multiplevoicesjournal.org/doi/abs/10.5555/2158-396X.16.1.4?code=ddel-site
Cooc, N. (2014). The academic trajectories of students receiving special education services in
elementary school. Paper session at the American Education Research Association
Annual Meeting, Philadelphia, PN.
Cosier, M., Causton-Theoharis, J., & Theoharis, G. (2013). Does access matter? Time in general
education and achievement for students with disabilities. Remedial and Special
Education, 34(6), 323-332. http://dx.doi.org/10.1177/0741932513485448
Donovan, M. S., & Cross, C. T. (Eds.). (2002). Minority Students in Gifted and Special
Education. Washington, DC: National Academy Press.
Fierros, E. G., & Conroy, J. W. (2002). Double jeopardy: An exploration of restrictiveness and

9
race in special education. In D. J. Losen & G. Orfield (Eds.), Racial Inequity in Special
Education (pp. 39-70). Cambridge, MA: Harvard Education Press.
Glascoe, F. P. (2000). Early detection of developmental and behavioral problems. Pediatrics in
Review, 21(8), 272-280. http://dx.doi.org/10.1542/pir.21-8-272
Harris, M., & Butterworth, G. (Eds.) (2002). Developmental Psychology: A Student's Handbook.
London: Psychology Press.
Hillemeier, M. M., Farkas, G., Morgan, P. L., Martin, M. A., & Maczuga, S. A. (2009).
Disparities in the prevalence of cognitive delay: How early do they appear? Paediatric
and Perinatal Epidemiology, 23(3), 186-198. http://dx.doi.org/10.1111/j.1365-
3016.2008.01006.x
Hibel, J., Farkas, G., & Morgan, P. L. (2010). Who is placed into special education? Sociology
of Education, 83(4), 312-332. https://dx.doi.org/10.1177/0038040710383518
Individuals with Disabilities Education Act, 20 U.S.C. § 1400 (1997).
Katusic, S. K., Colligan, R. C., Barbaresi, W. J., Schaid, D. J., & Jacobsen, S. J. (2001,
November). Incidence of reading disability in a population-based birth cohort, 1976–
1982, Rochester, Minn. In Mayo Clinic Proceedings (Vol. 76, No. 11, pp. 1081-1092).
Elsevier. https://dx.doi.org/10.4065/76.11.1081
Kavale, K. A., & Forness, S. R. (2000). History, rhetoric, and reality: Analysis of the inclusion
debate. Remedial and Special Education, 21(5), 279-296.
http://dx.doi.org/10.1177/074193250002100505
Marder, C. (2009). Facts from SEELS: Perspectives on students’ primary disability
classifications. Washington, D.C.: U.S. Department of Education, Office of Special
Education Programs. Retrieved from

10
https://www.seels.net/info_reports/DisabilityClassif1.9.09.pdf
Matthews, J. S., Ponitz, C. C., & Morrison, F. J. (2009). Early gender differences in self-
regulation and academic achievement. Journal of Educational Psychology, 101, 689-704.
https://dx.doi.org/10.1037/a0014240
McWilliams, M., & Fancher, M. P. (2010). Undiagnosed Students with Disabilities Trapped in
the School-to-Prison Pipeline. Michigan Bar Journal, 89, 28-30. Retrieved from
https://www.michbar.org/file/barjournal/article/documents/pdf4article1721.pdf
Morgan, P. L., Hillemeier, M. M., Farkas, G., & Maczuga, S. (2014). Racial/ethnic disparities in
ADHD diagnosis by kindergarten entry. Journal of Child Psychology and
Psychiatry, 55(8), 905-913. http://dx.doi.org/10.1111/jcpp.12204
Morgan, P. L., Farkas, G., Hillemeier, M. M., Mattison, R., Maczuga, S., Li, H., & Cook, M.
(2015). Minorities are disproportionately underrepresented in special education:
Longitudinal evidence across five disability conditions. Educational Researcher, 44(5),
278-292. https://dx.doi.org/10.3102/0013189X15591157
Morgan, P. L., Farkas, G., Cook, M., Strassfeld, N. M., Hillemeier, M. M., Pun, W. H., &
Schussler, D. L. (2017a). Are Black children disproportionately overrepresented in
special education? A best-evidence synthesis. Exceptional Children, 83(2), 181-198.
http://dx.doi.org/10.1177/0014402916664042
Morgan, P. L., Farkas, G., Hillemeier, M. M., & Maczuga, S. (2017b). Replicated evidence of
racial and ethnic disparities in disability identification in US schools. Educational
Researcher, 46(6), 305-322. https://doi.org/10.3102%2F0013189X17726282
Ormrod, J. E., Saklofske, D. H., Schwean, V. L., Andrews, J. J. W. & Shore, B. M. (2005).
Principles of Educational Psychology, Canadian Edition. North York, Ontario: Pearson.

11
Oswald, D. P., Coutinho, M. J., Best, A. M., & Singh, N. N. (1999). Ethnic representation in
special education the influence of school-related economic and demographic
variables. The Journal of Special Education, 32(4), 194-206.
https://dx.doi.org/10.1177/002246699903200401
Peterson, C. A., Wall, S., Jeon, H. J., Swanson, M. E., Carta, J. J., Luze, G. J., & Eshbaugh, E.
(2011). Identification of disabilities and service receipt among preschool children living
in poverty. The Journal of Special Education, 47(1), 28-40.
https://dx.doi.org/10.1177/0022466911407073
Reedy, K. (2004). Response to intervention: A promising alternative to identifying students with
learning disabilities. In R&D Alert: When Special Education and General Education
Unite, Everyone Benefits. WestEd.
Reynolds, A. J., & Wolfe, B. (1999). Special education and school achievement: An exploratory
analysis with a central-city sample. Educational Evaluation and Policy Analysis, 21(3),
249-269. https://doi.org/10.3102%2F01623737021003249
Riddick, B. (2000). An examination of the relationship between labelling and stigmatisation with
special reference to dyslexia. Disability & Society, 15(4), 653–667.
http://dx.doi.org/10.1080/09687590050058233
Rose, C. A., Monda-Amaya, L. E., & Espelage, D. L. (2011). Bullying Perpetration and
Victimization in Special Education: A Review of the Literature. Remedial and Special
Education, 32(2), 114–130. http://doi.org/10.1177/0741932510361247
Shifrer, D. (2013). Stigma of a Label. Journal of Health and Social Behavior, 54(4), 462–480.
http://doi.org/10.1177/0022146513503346
Sigman, M., Peña, M., Goldin, A. P., & Ribeiro, S. (2014). Neuroscience and education: prime

12
time to build the bridge. Nature Neuroscience, 17(4), 497.
http://dx.doi.org/10.1038/nn.3672
Skiba, R. J., Poloni-Staudinger, L., Simmons, A. B., Renae Feggins-Azziz, L., & Chung, C. G.
(2005). Unproven links: Can poverty explain ethnic disproportionality in special
education? The Journal of Special Education, 39(3), 130-144.
https://dx.doi.org/10.1177/00224669050390030101
Skiba, R. J., Horner, R. H., Chung, C. G., Rausch, M. K., May, S. L., & Tobin, T. (2011). Race
is not neutral: A national investigation of African American and Latino disproportionality
in school discipline. School Psychology Review, 40(1), 85. Retrieved from
https://search.proquest.com/openview/a7389dd1667724ca0e8dd8102f1a107c/1?pq-
origsite=gscholar&cbl=48217
Snowling, M., Bishop, D. V. M., & Stothard, S. E. (2000). Is preschool language impairment a
risk factor for dyslexia in adolescence? The Journal of Child Psychology and Psychiatry
and Allied Disciplines, 41(5), 587-600. http://dx.doi.org/10.1111/1469-7610.00651
Sullivan, A. L., & Bal, A. (2013). Disproportionality in special education: Effects of individual
and school variables on disability risk. Exceptional Children, 79(4), 475-494.
https://dx.doi.org/10.1177/001440291307900406
Sullivan, A. L., & Field, S. (2013). Do preschool special education services make a difference in
kindergarten reading and mathematics skills? A propensity score weighting
analysis. Journal of School Psychology, 51(2), 243-260.
http://dx.doi.org/10.1016/j.jsp.2012.12.004
Wolery, M., & Bailey Jr, D. B. (2002). Early childhood special education research. Journal of
Early Intervention, 25(2), 88-99. http://dx.doi.org/10.1177/105381510202500204

13
CHAPTER II
Examining Longitudinal Patterns of K-8 Special Education Service Receipt
Abstract
Understanding the difference between longitudinal prevalence and current incidence of disability
is an important, yet untapped, dimension of special education service receipt. The present study
used latent class growth curve analysis (LCGA) and multinomial logistic regression to classify
longitudinal trajectories of K-8 special education service receipt and assess which Kindergarten
individual- and school-level characteristics predict the likelihood of following these different
trajectories. Results demonstrated that nearly 22% of students participating in the ECLS-K
(1998) received special education services prior to high school. LCGA identified 4 trajectories of
special education service receipt: Never, Persistent, Delayed, and Terminal. Results from
descriptive analyses and multinomial logistic regression revealed important differences between
these trajectories that both align with prior work and offer a fresh perspective into which students
experience chronic special education service receipt. For instance, students in the Persistent and
Delayed groups experienced more socioeconomic, academic, and behavioral disadvantage than
students in both the Terminal and Never groups. When coupled with research assessing initial
placement into special education, this study informs future research as to how special education
placement changes across schooling and development, and for whom.
Keywords: special education; developmental trajectories; longitudinal methodology;
secondary data analysis

14
Introduction
Understanding how to help low-performing students is one of the most chronic issues
facing education. Especially challenging is the often-blurred line between low-performers and
atypical learners, such as students with disabilities. For instance, under the Individuals with
Disabilities Education Act (IDEA, 2004), students are precluded from receiving services for a
learning disability if their learning problems arise from "environmental, cultural, or economic
disadvantage" (34 CFR 300.309). Yet, children from disadvantaged backgrounds experience
environmental and social risk factors (e.g., lead exposure, low birthweight, poverty) that
heighten problem behaviors and risk for disability identification (Brooks-Gunn & Duncan, 1997;
Donovan & Cross, 2002; Mann, McCartney, & Park, 2007).
For decades, researchers have attempted to pinpoint which environmental, biological, and
educational risk factors lead to identification for special education (e.g., Donovan & Cross, 2002;
Hibel, Farkas, & Morgan, 2010; Lloyd, Kauffman, Landrum, & Roe, 1991; Mann, McCartney, &
Park, 2007). However, most studies rely on a cross-sectional metric of initial referral (e.g., 13%
of US students aged 3-21 received special education services in 2013-2014; NCES, 2016), and
typically in only one disability category. This metric likely does not fully capture nuances in
service delivery and greatly underestimates the burden of disability over time (Jaffee,
Harrington, Cohen, & Moffitt, 2005; Forness, Freeman, Paparella, Kauffman, & Walker, 2012).
For instance, Chesmore, Ou, and Reynolds (2016) demonstrated that both the number of years
receiving special education services and the timing of service receipt (i.e., before or after 3rd
grade) may differentially influence young adult outcomes. Forness et al. (2012) noted that the
point prevalence (i.e., at a given time) of students with an emotional or behavioral disability has
hovered around 12 percent for the past two decades, even though the cumulative (or "lifetime")

15
prevalence of emotional and behavioral disorders has been 37-39 percent across diverse samples
and historical timeframes. Kessler et al. (2005) also estimate that between 20% to 30% of
Americans experience a mood or anxiety disorder at some point during their lifespan, though the
reported point prevalence of depression or anxiety disorders in any given year is 7% to 18%
(Anxiety and Depression Association of America, 2016).
These studies all used longitudinal methods to answer questions about who receives
services over time and how longitudinal outcomes may differ as a function of service receipt,
instead of the more commonly-assessed cross-sectional estimates. Yet, gaps in the literature still
exist. Forness did not broadly explore longitudinal service receipt beyond emotional and
behavioral disorders; Chesmore's analyses were conducted on a non-representative sample that
did not assess trajectories of special education beyond the amount and timing of services
received; and Kessler's results do not speak to special education service receipt among
schoolchildren. Thus, it remains empirically unclear how nationally-representative samples of
individuals move through the special education system, and what factors influence trajectories of
special education service receipt. The present study therefore makes use of a primarily
descriptive approach to investigating trajectories of K-8 special education service, including the
assessment of group differences between trajectories, and the demographic, achievement, and
behavioral risk factors that predict longitudinal service receipt.
A recent report from the Institute of Education Sciences (Loeb et al., 2017) described the
importance of quantitative descriptive analysis as a partner to causal research methods. Though
descriptive research is often overlooked, this method can "distill [large] datasets into meaningful
dimensions to uncover patterns and inform and improve decision-making" (p. 3), which further
helps researchers understand the types of causal interventions that might be most effective, and

16
for whom. Moreover, other analytical methods can sometimes mask the clarity of real-world
phenomena, particularly when communicating findings to readers. In the same vein, analyzing
cross-sectional incidences of special education placement (i.e., the number of students receiving
services for learning disabilities in 2015-2016), even within longitudinal data, can mask
information about how often and for how long a student may receive services. Thus,
understanding the difference between longitudinal prevalence and current incidence of special
education service receipt is an important, yet untapped, goal.
Research Questions
The primary aim of this paper is to assess trajectories of special education service receipt
and group differences among these trajectories. Following these descriptive estimates, which
serve as important precursors to future causal inference models (Loeb et al., 2017), the unique
predictive ability of "best-evidence" variables measured at Kindergarten are used to identify
which students are most likely to follow certain longitudinal trajectories of special education
service receipt. The research questions addressed in this study were:
1) Do students follow different trajectories of special education service receipt from
Kindergarten through eighth grade?
2) Which students follow these K-8 special education trajectories?
3) What individual- and school-level sociodemographic, academic, and behavioral
characteristics uniquely predict special education trajectories?
The present research is novel in its broad exploration of longitudinal patterns of special
education, rather than relying on cross-sectional incidences of first identification alone. Results
are presented with hopes that other researchers will be inspired to utilize similar metrics when
assessing who receives special education services.

17
Method
Data
Analyses were conducted using restricted data from the Early Childhood Longitudinal
Study, Kindergarten Class of 1998-1999 (ECLS-K). This study followed a nationally-
representative cohort of approximately 21,400 children for eight years, collecting information
about schooling experiences in Kindergarten, first, third, fifth, and eighth grade. The longitudinal
and comprehensive nature of this dataset lends itself to studying a wide range of factors
associated with schooling outcomes, including special education. Per stipulations required by the
Institute of Education Sciences when using restricted data, all reported sample and group sizes
are rounded to the nearest 10. This study was exempted from institutional review by an ethics
committee at the University of Michigan since the data were de-identified prior to author receipt
and analyses.
Variable Information
Including appropriate controls in analyses aids in accurately identifying individuals who
may be at risk for special education placement and reduces the impact of selection bias (Morgan
et al., 2017). Yet, many covariates have been linked only to initial risk for disability
identification, rather than longitudinal duration of service receipt. As it is unclear how or whether
previously-identified risk factors influence the retention or termination of special education
services over time, this study also assessed group differences between trajectories using
previously-identified "best-evidence" predictors of special education placement, at both the
individual- and school-levels; variables included in analyses are described below, and in Table
II.1.
Child characteristics. During each wave of data collection, school office staff were

18
asked to indicate whether each student had an IEP on file. This resulted in binary indicators
corresponding to general or special education status at Kindergarten, first, third, fifth, and eighth
grade, which were then used to assess latent trajectories of special education receipt. Other child
characteristics measured at Kindergarten were also used to describe group differences across
trajectories, and to predict which students follow these trajectories over time. At the individual
level, identification for special education, disability diagnosis, and/or at-risk status has been
extensively studied, and seems to be especially heightened by male sex, parent-reported
disability, and non-White race/ethnicity (e.g., Blackburn, Spencer, & Read, 2013; Morgan,
Farkas, Hillemeier, & Maczuga, 2012; Morgan, Farkas, & Hillemeier, 2015; Sullivan & Bal,
2013). Older Kindergarteners are also less likely to receive special education services (Dhuey &
Lipscomb, 2010). Artiles, Rueda, Salazar, and Higareda (2002) found that English language
learners were "overrepresented" in later (but not earlier) grades. Finally, children with a birth
weight less than 6 lbs. are more likely to experience cognitive difficulties (Grunau, Whitfield, &
Davis, 2002) and be placed in early intervention or special education programs (Morgan, Farkas,
Hillemeier, & Maczuga, 2012).
Home characteristics. Sullivan and Bal (2013) describe how nonacademic factors like
"social traumas" may influence likelihood of special education placement more than individual
learning proclivities. In the home environment, these social traumas may include whether the
child lacks access to healthcare services or a regular childcare program prior to Kindergarten; is
not exposed to high levels of cognitive stimulation or high levels of parental engagement in the
home; has many siblings; grows up in a low-income or impoverished environment; and/or has a
young, single, or less educated parent (Donovan & Cross, 2002; Costello et al., 1996; Altarac &
Saroha, 2007; Emerson, Einfeld, & Stancliffe, 2011; Sullivan & Bal, 2013).

19
To capture cognitive stimulation, home resources, and family rules, structure, and
routines, 18 variables available at the Kindergarten wave were recoded and combined into a
single composite measure. First, 11 binary indicators of whether the child took dance, music, or
art lessons; participated in athletic events, organized performances, or organized clubs; read a
book outside of school; and visited the library, a museum, a zoo, or an aquarium were summed
into one composite variable and z-scored to have a mean of 0 and standard deviation of 1. Next,
2 variables assessing whether the child had a home computer to use and how safe it was to play
outside were summed and z-scored. Lastly, a dichotomous variable asking whether the child
went to bed at the same time each night was added to 4 variables assessing the number of days
per week breakfast and/or dinner was consumed as a family, and how many days per week these
meals occurred at regular times. This new variable was then z-scored. Finally, these three
composite variables were added together and z-scored again to represent a single predictor of
cognitive stimulation and the home environment.
Academic achievement and behavioral ratings. Poor academic achievement, including
in both reading and math, is one of the strongest predictors of special education placement
(Briesch et al., 2012; Donovan & Cross, 2002; Hosp & Reschly, 2004; Moll, Kunze, Neuhoff,
Bruder, & Schulte-Korne, 2014; Morgan et al., 2017). Academic assessments created specifically
for the ECLS-K used Item Response Theory (IRT), which algorithmically places each child on a
continuous ability scale based on the number of correct, incorrect, and omitted answers in
relation to item difficulty. This method also allows scores obtained at each timepoint to be
directly comparable, thus permitting longitudinal analyses. IRT-adjusted scores assessing
reading and mathematics ability in the spring of Kindergarten were included in these models.
Moreover, behavioral problems, such as self-regulatory, internalizing and/or

20
externalizing disorders, also have a demonstrable effect on special education referrals and
placements (Forness, Freeman, Paparella, Kauffman, & Walker, 2012; Briesch, Ferguson, Volpe,
& Briesch, 2012). Five Kindergarten teacher-reported ratings of behavioral capabilities from the
Teacher Social Rating Scale (SRS, adapted from the Social Skills Rating Scale; Gresham and
Elliott, 1990) were included in analyses. The Approaches to Learning scale measures how
children engage with the learning environment, by rating their attentiveness, task persistence,
eagerness to learn, independence, flexibility, and organization. The Interpersonal Skills scale
rates the child's ability to form and maintain relationships, get along with others, comfort or help
others, positively express feelings, ideas, and opinions, and show sensitivity to others' feelings.
The Self-Control scale measures the child's ability to control their behavior by responding
appropriately to peer pressure, respecting others' property, controlling their temper, and
accepting peers' ideas. The Internalizing Problem Behaviors scale rated apparent anxiety,
loneliness, low self-esteem, and sadness, while the Externalizing Problem Behaviors scale
measured how often the child argues, fights, gets angry, acts impulsively, and disturbs ongoing
activities.
School demographic information. School-level resources and policies greatly influence
who is placed in special education (Dhuey & Lipscomb, 2013; Oswald, Coutinho, Best, & Singh,
1999). These resources and policies have been captured both directly and indirectly using
variables commonly available in large-scale secondary datasets. Studies analyzing school- or
district-level predictors of special education placement often include covariates assessing
schoolwide socioeconomic status and/or at-risk children's enrollment (including whether the
school serves a high-minority, non-English proficient, or disabled population); whether the
school received Title I funds (statewide funding reserved for schools serving high percentages of

21
low-income students; Elementary and Secondary Education Act, 1965); average academic ability
and/or behavioral ratings; private or religious school status; urbanicity, census region, or size of
the district; teacher demographic information; and school climate (e.g., Artiles, Rueda, Salazar,
& Higareda, 2002; Blanchett, Mumford, & Beachum, 2005; Bruns, Walrath, Glass-Siegel, &
Weist, 2004; Billingsley, 2004; Hibel, Farkas, & Morgan, 2010; Hosp & Reschly, 2004; Morgan,
Farkas, Tufis, & Sperling, 2008; Oswald, Coutinho, & Best, 2002; Oswald, Coutinho, Best, &
Singh, 1999; Parrish, Hikido, & Fowler, 1998; Skiba et al., 2005; Sullivan, 2011; Sullivan & Bal,
2013; Wiley & Siperstein, 2011).
Of these predictors, several variables in the ECLS-K may be used to capture specific
information about school neighborhood and school climate. For instance, school neighborhood
quality was evaluated by summing 5 administrator-reported items: whether there were
neighborhood problems with substance abuse, gangs, tension from differences, vacant buildings,
and crime in the area (for each item, 1 = no problem, 2 = somewhat of a problem, 3 = big
problem; resulting composite scores ranged from 5-15, which were then standardized to have a
sample mean of 0 and standard deviation of 1). School climate was assessed by averaging 9
items (with 1 = strongly disagree, 5 = strongly agree): active participation in school programs by
parents, problems with teachers absent (reversed), problems with teacher turnover (reversed),
problems with student absences (reversed), strong community support, parent and school
consensus on expectations, order and discipline maintained, problems with school overcrowding
(reversed), and parents being welcome to observe classes; this measure was also standardized to
M=0, SD=1.
Missing Data
Though 6 predictor variables were missing no data (male sex, region, urban area, private

22
school, school size, and average schoolwide mathematics score), most variables did have some
missingness, ranging from 0.1 percent (number of disabilities per classroom; average schoolwide
reading score) to 25.2 percent (percent of school receiving free lunch; mean amount of missing
data was 3.7 percent). Modeling predictors of missingness alongside variables used in analytical
models leads to a likely estimation of data missing at random (Allison, 2012). Given the rich
nature of the ECLS-K, variables associated with missing patterns were used to multiply impute
data in Stata/SE v. 15.0. Multiple imputation fills in missing values multiple times for each
variable to create several complete datasets for analysis (Rubin, 1978; Schenker & Taylor, 1996;
Van Buuren & Groothuis-Oudshoorn, 2011), which yields reliable estimates of data missing at
random. Though imputations in the social sciences have historically been conducted with m = 3
to 5 imputed datasets (Spratt et al., 2010), decreasing m tends to reduce power and increase
errors (Graham et al., 2007). As there is no negative impact of increasing m (White, Royston, &
Wood, 2011), analyses were performed on 40 imputed datasets. All continuous variables were
imputed using predictive mean matching, which matches missing values to observed values that
have the closest predicted mean using the k-nearest neighbors (knn) approach (Little, 1988); in
this model, k = 10. Binary variables were imputed using logistic regression, and categorical
variables were imputed using multinomial logistic regression. Proportions of missing
observations for each variable are represented in Tables 3 and 4.
Normality and Weighting
There were no issues with multivariate outliers, multicollinearity, singularity, or linearity.
Analyses were weighted to account for the complex, cluster-sample study design by normalizing
the Kindergarten weight C2CW0 and adjusting it by its spring Kindergarten design effect (Kish,
1965). This procedure ensures that reported results are representative of students who began

23
Kindergarten in the 1998-1999 school year and continued through eighth grade (for a discussion
of weighting in longitudinal samples, see Davis-Kean, Jager, & Maslowsky, 2015).
Analytical Strategy
Trajectories of special education service receipt were captured using latent class growth
analysis (LCGA), which uses a categorical or binary outcome variable measured at multiple time
points to group latent classes of participants according to their growth curves. Like latent class
analysis, LCGA describes unobserved ("latent") groups of individuals, such that participants
within subpopulations are grouped with those who are maximally similar to each other. This
approach guards against Simpson's paradox (Simpson, 1951), in which statistical inferences
obtained from procedures that assume homogenous populations can be misleading (Yang,
Shaftel, Glasnapp, & Poggio, 2005). LCGA adds classes stepwise until the smallest number of
latent classes that fit the data well are identified, and produces individual probabilities of
membership within each growth trajectory (Muthén & Muthén, 2000; Yang, Shaftel, Glasnapp,
& Poggio, 2005). Following LCGA, data were multiply imputed using the approach described
above. Finally, the relative probabilities of membership in each longitudinal trajectory were
assessed using multinomial logistic regression, which is a technique that compares the odds of
multiple categorical outcomes with a base referent outcome (Hosmer & Lemeshow, 1989).
Results
Do Students Follow Different K-8 Paths of Special Education Service Receipt?
The first research question asked whether students followed various trajectories of special
education service receipt throughout primary schooling. Table II.2 presents fit statistics from 2-,
3-, 4-, and 5-solution LCGAs. Model fit was evaluated by comparing relative goodness-of-fit
likelihood ratio test statistics (e.g., VLMR and LMR), entropy, and information criteria (e.g.,

24
AIC, BIC, sample-adjusted BIC) among each solution. The model with the minimum values of
information criteria and high entropy values (≥.90) is considered the best-fitting model. The 3-
and 4-class solutions fit the data better than the 2- and 3-class solutions, respectively, as
indicated by significant VLMR and LMR likelihood ratio tests (LRTs), and reduced information
criteria. However, the 5-class solution did not fit the data better than a 4-class solution (VLMR-
LRT p = .203, LMR-LRT p = .210), and the fit statistics did not improve (AIC = 9214.66, BIC =
9400.37, Sample-adjusted BIC = 9308.22, entropy = .891). Given these considerations, the 4-
class solution was retained. 79.4% of the sample never received K-8 special education services,
meaning that 21.6% did receive special education at some point prior to high school – nearly
double that of cross-sectional estimates (i.e., 13% of U.S. students received services in 2013).
Figure II.1 displays growth curve trajectories for the 4-class and 5-class solutions. Both
models classified distinct trajectories of students who are most likely to be in general education
at all timepoints (labeled Never), students who are most likely to be in special education at all
timepoints (labeled Persistent), students who most likely to receive special education in 5th grade
(labeled Delayed), and students are most likely to receive services in 1st grade and then may stop
receiving special education services thereafter (labeled Terminal). In addition to these four
classes, the 5-class LCGA classified a group of students who experience a delayed entry into
special education but are likely to stop receiving services by 8th grade (labeled Delay/Terminal).
However, given that this 5-class solution did not appear to fit the data better than the 4-class
solution (Table II.2), the 4-class model was retained. The longitudinal patterns within each of
these four classes are presented in Table II.3. In contrast to these models, the 2-class solution
classified students as general education (i.e., Never) or special education (all other students who
received services at some point through 8th grade), while the 3-class solution classified students

25
into the Never, Persistent, and Delayed groups.
Which Students Follow these K-8 Special Education Trajectories?
Special education teachers' report of the student's primary disability at each wave was
also useful in determining the proportion of disability categorizations for each trajectory (Figure
II.2). The five most common U.S. disability categories at the time of ECLS-K data collection are
reported: Learning Disability (LD), Speech and Language Impairment (SLI), Mental Retardation
(MR – currently reclassified as Intellectual Disability), Other Health Impairment (OHI), and
Serious Emotional Disturbance (SED), as well as an "Other" category encompassing other IEP
primary classifications (e.g., Blind/Visual Impairment, Deaf/Hard of Hearing, Autism,
Developmental Delay, Orthopedic Impairment, etc.). The Persistent category shifted from being
mostly comprised of students with SLIs to LDs around first grade, which aligns with prior work
demonstrating that as many as 50% of students initially served under the SLI and OHI
determination change categories during schooling (Marder, 2009). Given the higher and stable
rates of disability status reported for students in the Persistent category over time, these students
may experience more severe impairments that require constant special education services. The
Delayed category was almost solely composed of students with LDs. The Terminal category, in
contrast, appears to be primarily capturing placement for students with SLI. Students with MR,
OHI, SED, or other disabilities are mostly represented in the Persistent category, albeit at much
lower levels than either SLI or LD. This indicates that most students with MR, OHI, SED, and/or
other disabilities are identified early and remain on special education services throughout
schooling, as opposed to trajectories in which service receipt is terminated or delayed.
Tables 3 and 4 present weighted Kindergarten sample descriptive statistics for each
trajectory identified in the 4-class LCGA. Significant differences between groups are denoted by
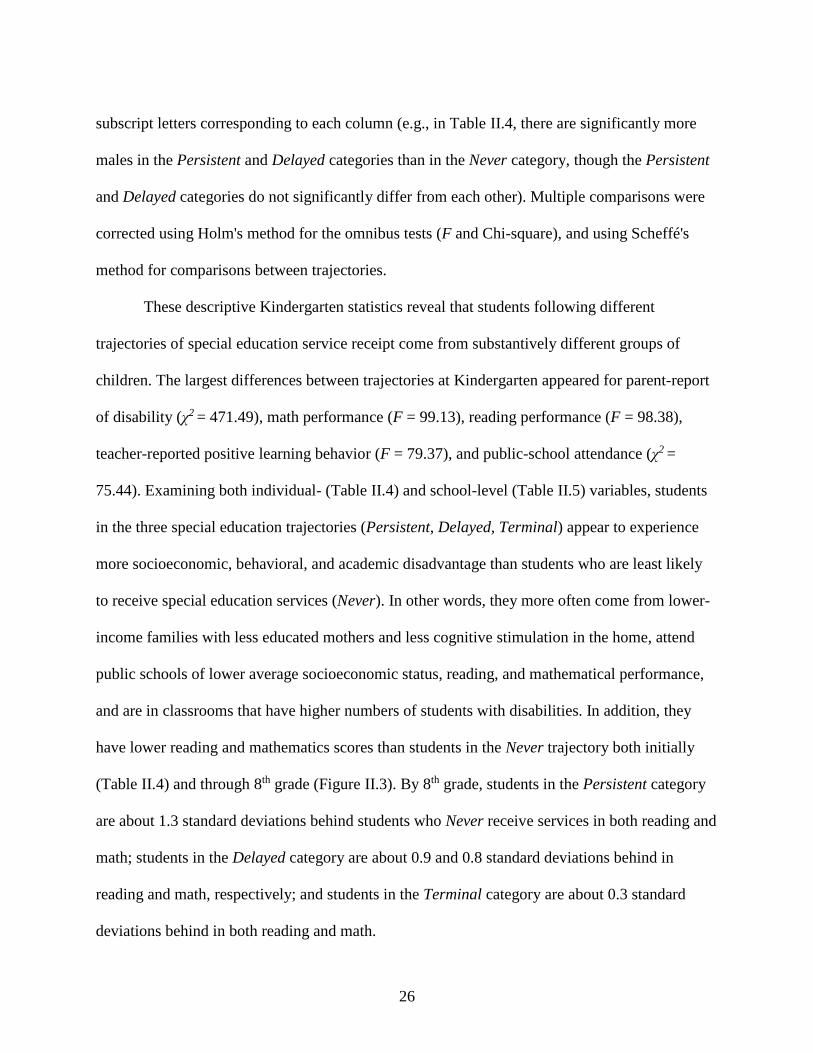
26
subscript letters corresponding to each column (e.g., in Table II.4, there are significantly more
males in the Persistent and Delayed categories than in the Never category, though the Persistent
and Delayed categories do not significantly differ from each other). Multiple comparisons were
corrected using Holm's method for the omnibus tests (F and Chi-square), and using Scheffé's
method for comparisons between trajectories.
These descriptive Kindergarten statistics reveal that students following different
trajectories of special education service receipt come from substantively different groups of
children. The largest differences between trajectories at Kindergarten appeared for parent-report
of disability (χ2 = 471.49), math performance (F = 99.13), reading performance (F = 98.38),
teacher-reported positive learning behavior (F = 79.37), and public-school attendance (χ2 =
75.44). Examining both individual- (Table II.4) and school-level (Table II.5) variables, students
in the three special education trajectories (Persistent, Delayed, Terminal) appear to experience
more socioeconomic, behavioral, and academic disadvantage than students who are least likely
to receive special education services (Never). In other words, they more often come from lower-
income families with less educated mothers and less cognitive stimulation in the home, attend
public schools of lower average socioeconomic status, reading, and mathematical performance,
and are in classrooms that have higher numbers of students with disabilities. In addition, they
have lower reading and mathematics scores than students in the Never trajectory both initially
(Table II.4) and through 8th grade (Figure II.3). By 8th grade, students in the Persistent category
are about 1.3 standard deviations behind students who Never receive services in both reading and
math; students in the Delayed category are about 0.9 and 0.8 standard deviations behind in
reading and math, respectively; and students in the Terminal category are about 0.3 standard
deviations behind in both reading and math.

27
Second, it also appears as though students in the Persistent and Delayed groups
experienced more socioeconomic, academic, and behavioral disadvantage than students in the
Terminal group. The Persistent and Delayed groups more often come from impoverished
families, have a single parent, attend schools with more average behavioral problems, and are
rated more poorly for self-regulation, interpersonal relationship skills, externalizing problems,
and internalizing problems than students in the Never and Terminal trajectories (and, there were
no differences between Never and Terminal on any of these variables). Moreover, students in the
Persistent and Delayed trajectories displayed lower reading and mathematical performance than
students in the Terminal trajectory, both initially and over time (see Figure II.3). Interestingly,
students in the Terminal trajectory attended schools with more Title I funding than students in
the Never trajectory, though there were no differences in Title I funding among the Never,
Persistent, or Delayed trajectories.
Finally, there were few significant differences between the Persistent and Delayed
groups. Students in the Delayed trajectory had fewer parent-reports of disability, better reading
and mathematics performance, and fewer internalizing problem behaviors. On the other hand,
students in the Persistent group attended Kindergarten classes with higher numbers of students
with disabilities, and schools with poorer average reading, mathematics, self-regulation,
interpersonal skills, and externalizing problem behaviors than students in the Delayed group.
What Individual- and School-Level Sociodemographic, Academic, and Behavioral
Characteristics Uniquely Predict Special Education Trajectories?
Results thus far have established that different profiles of students follow various
trajectories of K-8 special education service receipt. However, these descriptive statistics do not
control for the confounding influence of other variables that could influence special education

28
placement, nor are they able to predict who follows these trajectories longitudinally. Thus, given
these group differences, the second research question assessed which factors uniquely predicted
each trajectory. That is, statistically controlling for existing group differences, what Kindergarten
variables predict the likelihood of following each trajectory over time?
Multinomial logistic regression was used to analyze which variables predicted trajectory
membership while simultaneously controlling for sociodemographic, achievement, and
behavioral confounds at both the individual and school levels (n = 7,140). The metric of
comparison in multinomial logistic regression is a relative risk ratio, which assesses the risk of
membership in a certain trajectory relative to a base category (in this case, the Never trajectory).
Numbers greater than 1.00 correspond to increased risk relative to the referent group, numbers
less than 1.00 correspond to decreased risk, and numbers equaling 1.00 indicate equal
likelihoods. All predictors were measured during the Kindergarten year, and results are displayed
in Table II.6.
Results from the multinomial logistic regression tell a similar story to the sampling
demographics displayed for each group, though this method allows us to pinpoint which
predictors most influence the likelihood of following different special education trajectories.
Relative to students who Never receive services, students who follow each special education
trajectory (Persistent, Delayed, and Terminal) are more likely to be male and to have a parent-
reported disability. Students in the Persistent group are most likely to display these qualities
relative to the Never trajectory, followed by the Terminal and then Delayed groups. Beyond this,
different factors predict the likelihood that students will follow each trajectory. First, it appears
that student demographics and home characteristics most influence students following the
Persistent trajectory. Students in this group are more likely to primarily speak a non-English

29
language in the home (RRR = .27), and less likely to come from homes with more cognitive
stimulation and structure (RRR = .71). They are older at Kindergarten entry (RRR = 1.10), tend to
have lower math scores in Kindergarten (RRR = .88; but, interestingly, no differences in reading
performance), and display poorer learning-related behaviors (RRR = .44). Finally, they are the
least likely to attend private school (RRR = .12), and most likely to attend a school where more
students with disabilities are served (RRR = 1.13).
In contrast, the relative risk of following the Terminal trajectory seems to be more
strongly predicted by school-level factors. For instance, students in this trajectory are less likely
to attend school in safe neighborhoods (RRR = .80) and less likely to attend private school (RRR
= 32). Beyond male sex and parent-reported disability, there were no significant child-level
predictors of following this trajectory – though, increased likelihood of having health insurance
(RRR = .42) and displaying poorer self-regulation (RRR = .47) were marginally significant.
Finally, students in the Delayed category are likely to display lower academic
achievement (RRRread = .96, RRRmath = .92) and poorer learning-related behaviors (RRR = .58)
during Kindergarten, though they also attend schools with her average mathematics scores (RRR
= 1.11). This pattern is reversed for externalizing problem behaviors, such that Delayed students
display fewer of these behaviors in Kindergarten (RRR = .67) but seem to attend schools with
higher average levels of externalizing problems (RRR = 3.31; though, these predictors were
marginally significant at p < .10). Lastly, they are also much less likely to live in the Western
U.S. census region (RRR = .35).
Discussion
The purpose of this study was, first and foremost, to provide a new way to evaluate data
on special education placement. There is overwhelmingly more evidence available on point

30
prevalence than on cumulative (or "lifetime") prevalence, and cumulative prevalence has not
traditionally been emphasized in discussions of special education services (Forness et al., 2012;
Kauffman & Landrum, 2009; Walker, Ramsey, & Gresham, 2004). First, this study assessed
whether students follow different K-8 paths of special education service receipt. Results suggest
that there are multiple paths that students may follow throughout schooling, which allows novel
assessment of who is placed into special education. Using LCGA, these trajectories were also
classified into 4 categories for further analysis of the demographic, achievement, and behavioral
factors that might inform special education placement: Never, Persistent, Delayed, and Terminal.
Second, descriptive statistics revealed that students following each K-8 special education
trajectory appear to be from fundamentally different groups of children. For instance, students in
the Persistent category (and, to a lesser extent, the Delayed category) have more markers of
disadvantage than the Terminal and Never categories. However, while informative, descriptive
group differences are not suitable for predicting future trajectory membership. Thus, and third,
multinomial logistic regression was employed to assess which Kindergarten sociodemographic,
achievement, and behavioral variables most strongly predicted the odds of following each
trajectory, while statistically removing shared variance among predictors from the model.
Results confirmed that different profiles of students follow these paths and identified the
Kindergarten factors that most strongly predict the likelihood of following each trajectory. For
instance, researchers have long speculated that disadvantaged families may be more likely to be
exposed to environmental toxins that increase risk for disability identification (e.g., Brooks-Gunn
& Duncan, 1997; Losen & Orfield, 2002; Skiba et al., 2005). While results align with the
hypothesis that disadvantage begets risk for special education placement, they also demonstrate
that this relation is especially true for students experiencing persistent or delayed entry into

31
special education through eighth grade. Students who exit special education did not display these
same risk profiles, which offers the field a fresh perspective into how to study placement. In turn,
this socioeconomic disadvantage experienced by those in the Persistent category could lead to
more medically-diagnosed or severe disabilities requiring services throughout schooling. Indeed,
this hypothesis is supported by Figure II.2, in which the largest proportions of students primarily
receiving services for MR, OHI, SED, and other diagnoses were found in the Persistent
trajectory. Moreover, because students in the Persistent trajectory come from homes with less
cognitive stimulation and structure, and/or where English is not the primary language spoken,
there may be cultural differences among these students that produce increased and prolonged
likelihood of service receipt. In fact, it is quite interesting that students persistently receiving
services do not have poorer reading skills at Kindergarten than students never receiving services
- only poorer math skills. Future research should explore and attend to the characteristics of math
deficits that may produce or accompany disability, particularly for students from culturally
diverse backgrounds, as these students seem most likely to receive special education services
throughout their schooling careers.
The evidence also demonstrates that students experiencing K-8 special education are
predominantly educated in public schools. In the descriptive statistics, most students attending
private school fell into the Never category of service delivery, while in the multinomial logistic
regression model, attending private school at Kindergarten greatly lowered the likelihoods of
following either the Persistent or Terminal patterns of special education, and to a lesser extent
the Delayed trajectory (although this was not statistically significant). Students attending private
schools are not legally entitled to the same rights under IDEA as students attending public
schools, because private institutions do not receive funds for special education from state or

32
federal governments. Since private schools are not mandated by law to provide special education
services or programs (though some do), students with disabilities or special educational needs
may have few options but to attend public school, where districts receive funding from state and
federal governments to cover the costs of specialized programs.
The Delayed trajectory's decreased likelihood of living in the West potentially indicates
that identification policies that prevent delayed referral in these states may be more effective.
Additionally, students in the Delayed group attend schools with higher average mathematics
achievement, yet individually display poorer academic achievement and fewer positive learning
behaviors. Though marginally significant, results revealed evidence trending toward students in
this trajectory displaying fewer externalizing behaviors at Kindergarten but attending schools
with higher rates of externalizing problem behaviors. This provides some evidence for the frog
pond effect described by Hibel, Farkas, and Morgan (2010), in which students with better-rated
behaviors attending schools with poorer overall behaviors may initially be less likely to be
noticed and referred for special education. It could be that this group encompasses students who,
at the transition to school, display weak academic skills in schools with better academic
performance, and who begin acting out over time (perhaps mirroring poorly-behaved peers) and
so eventually procure a referral to special education. Though this hypothesis warrants further
study with predictors beyond the Kindergarten year, it is directly aligned with prior work by
Morgan, Farkas, and colleagues, who have documented a strong relationship between early
academic difficulties and later problem behaviors (Forness et al., 2012; Morgan, Fuchs,
Compton, Cordray, & Fuchs, 2008; Morgan, Farkas, & Wu, 2009; Morgan, Farkas, & Wu, 2012;
Morgan, Farkas, Tufis, & Sperling, 2008).
It was also noteworthy that academic achievement was not as strong a predictor of

33
following trajectories of special education placement as prior research might suggest (e.g.,
Briesch et al., 2012; Donovan & Cross, 2002; Hosp & Reschly, 2004; Moll, Kunze, Neuhoff,
Bruder, & Schulte-Korne, 2014; Morgan et al., 2017). It is possible that academic achievement
factors into longitudinal trajectories of special education service receipt less than for initial
identification. In addition, the lack of statistically significant trajectory differences along the
lines of race/ethnicity was also surprising. Though there appear to be more Black and Hispanic
students in the Persistent and Delayed categories than in the Never or Terminal categories when
examining unadjusted descriptive statistics (Table II.4), the risk ratios yielded by the multinomial
logistic regression for the Persistent, Terminal, and Delayed trajectories were lower relative to
the Never trajectory when controlling for individual and schoolwide socioeconomic, academic,
and behavioral characteristics. Yet, neither of these analyses was statistically significant, with the
sole exception among students reporting a race/ethnicity other than White, Black, Hispanic, or
Asian/Pacific Islander being less likely to be classified as Persistently needing special education
services. This aligns with findings by Morgan, Farkas, and colleagues, who point out that failing
to control for individual predictors like academic achievement and socioeconomic status yield
special education probability estimates that are biased upwards for students of color (e.g.,
Morgan et al., 2015; Morgan et al., 2017; Morgan, Farkas, Hillemeier, & Maczuga, 2017).
Though the results presented here are mostly non-significant, a longitudinal approach to
categorizing who receives special education services may still have implications for the debate
on racial disproportionality. Given the apparent pattern of unadjusted socioeconomic, academic,
and behavioral disadvantage present among students receiving special education services, future
research investigating longitudinal trajectories of service receipt should appropriately control for
these confounds to obtain unbiased estimates (e.g., see Morgan et al., 2017).

34
Limitations
This study has several limitations. First, it is important to note that the ECLS-K 1998 data
is nearly twenty years old. Post-2000 legislative changes, such as the No Child Left Behind Act
and revisions to IDEA, necessitate newer data to answer questions about trajectories of special
education services. These findings also provoke important questions about directionality (e.g.,
between low academic performance and special education placement) that the nature of this
study does not allow for further exploration. It is also possible that there is more variability
within and between schools than was captured using these methods. Perhaps by examining these
predictors in a hierarchically-nested structure (e.g., through multilevel modeling, where estimates
for individuals are nested within schools, for instance), we may see different estimates of relative
risk among special education trajectories as a function of which schools children attend. Future
research should explore this possibility.
Conclusion
This study captures important dimensionality to service receipt that prior studies fail to
yield. Results generally suggest that it is insufficient to assess which students are receiving
services only at a given timepoint, but to ensure that their longitudinal trajectories are accounted
for when analyzing risk factors for and consequences of special education placement. Although
IDEA stipulates no environmental precursors to special education placement, the students who
receive special education services for the longest amount of time and/or later in schooling
seemingly experience the most environmental disadvantage, the lowest academic performance,
and the poorest behavioral ratings. These findings align with previous assertions that
disadvantage begets special education placement, largely for students persistently receiving
services or who experience delayed entry into special education. In contrast, students who did

35
not receive services later in their schooling career seemed to display the fewest socioeconomic
risks, best academic performance, and best behavioral ratings second to students never receiving
special education services. This not only aligns with prior work finding fewer adverse outcomes
for students receiving services earlier in K-12 education (e.g., Chesmore, Ou, & Reynolds, 2016;
Ehrhardt, Huntington, Molino, & Barbaresi, 2013; Reynolds & Wolfe, 1999), but also reinforces
the need for earlier intervention, alongside renewed consideration of how early environments
interact with disability status to necessitate longitudinal special education services. Given that
the results presented here are mostly descriptive rather than causal, future research should
casually evaluate how socioeconomic disadvantage and special education trajectories relate.
In sum, these results indicate that it is important to account for different longitudinal
paths through special education to avoid inappropriate generalizations about all students with
special needs, particularly when assessing initial disability identification and subsequent
developmental trajectories. Future research should causally investigate to what extent earlier
timing and shorter duration of service receipt positively impact academic and behavioral
outcomes, and/or to what extent students with better academic and behavioral scores require
fewer special education services.

36
References
Allison, P. D. (2012). Missing data. Thousand Oaks, CA: Sage.
Altarac, M., & Saroha, E. (2007). Lifetime prevalence of learning disability among US
children. Pediatrics, 119(Supplement 1), S77-S83. Retrieved from
https://pdfs.semanticscholar.org/19de/849b1bfc1a038a264742df7c0dd55fbb756d.pdf
Artiles, A. J., Rueda, R., Salazar, J. J., & Higareda, I. (2002). English-language learner
representation in special education in California urban school districts. In D. J. Losen &
G. Orfield (Eds.), Racial Inequity in Special Education (pp. 117–136). Cambridge, MA:
Harvard Education Press.
Blanchett, W. J., Mumford, V., & Beachum, F. (2005). Urban school failure and
disproportionality in a post-Brown era: Benign neglect of the constitutional rights of
students of color. Remedial and Special Education, 26(2), 70-81.
https://dx.doi.org/10.1177/07419325050260020201
Billingsley, B. S. (2004). Special education teacher retention and attrition: A critical analysis of
the research literature. The Journal of Special Education, 38(1), 39-55.
https://dx.doi.org/10.1177/00224669040380010401
Boyle, C. A., Boulet, S., Schieve, L. A., Cohen, R. A., Blumberg, S. J., Yeargin-Allsopp, M., ...
& Kogan, M. D. (2011). Trends in the prevalence of developmental disabilities in US
children, 1997–2008. Pediatrics, 127(6), 1034-1042. Retrieved from
https://pediatrics.aappublications.org/content/127/6/1034.short
Brooks-Gunn, J., & Duncan, G. J. (1997). The effects of poverty on children. The Future of
Children, 7(2), 55-71. https://dx.doi.org/10.2307/1602387
Bruns, E. J., Walrath, C., Glass-Siegel, M., & Weist, M. D. (2004). School-based mental health

37
services in Baltimore: Association with school climate and special education
referrals. Behavior Modification, 28(4), 491-512.
https://dx.doi.org/10.1177/0145445503259524
Davis-Kean, P. E. (2005). The influence of parent education and family income on child
achievement: the indirect role of parental expectations and the home
environment. Journal of Family Psychology, 19(2), 294-304.
https://dx.doi.org/10.1037/0893-3200.19.2.294
Davis‐ Kean, P. E., Jager, J., & Maslowsky, J. (2015). Answering Developmental Questions
Using Secondary Data. Child Development Perspectives, 9(4), 256-261.
https://dx.doi.org/10.1111/cdep.12151
Donovan, M. S., & Cross, C. T. (Eds.). (2002). Minority Students in Gifted and Special
Education. Washington, DC: National Academy Press.
Emerson, E., Einfeld, S., & Stancliffe, R. J. (2011). Predictors of the persistence of conduct
difficulties in children with cognitive delay. Journal of Child Psychology and
Psychiatry, 52(11), 1184-1194. https://dx.doi.org/10.1111/j.1469-7610.2011.02413.x
Gresham, F. M., & Elliott, S. N. (1990). Social skills rating system (SSRS). Circle Pines, MN:
American Guidance Service.
Haskins, A. R. (2014). Unintended consequences: Effects of paternal incarceration on child
school readiness and later special education placement. Sociological Science, 1, 141.
https://dx.doi.org/10.15195/v1.a11
Herbers, J. E., Reynolds, A. J., & Chen, C. C. (2013). School mobility and developmental
outcomes in young adulthood. Development and Psychopathology, 25(02), 501-515.
https://dx.doi.org/10.1017/S0954579412001204

38
Hosp, J. L., & Reschly, D. J. (2004). Disproportionate representation of minority students in
special education: Academic, demographic, and economic predictors. Exceptional
Children, 70(2), 185-199. https://dx.doi.org/10.1177/001440290407000204
Hibel, J., Farkas, G., & Morgan, P. L. (2010). Who is placed into special education?. Sociology
of Education, 83(4), 312-332. https://dx.doi.org/10.1177/0038040710383518
Individuals with Disabilities Education Act, 20 U.S.C. § 1400 (2004).
Jaffee, S. R., Harrington, H., Cohen, P., & Moffitt, T. E. (2005). Editorial: Cumulative
prevalence of psychiatric disorders in youths. Journal of the American Academy of Child
and Adolescent Psychiatry, 44, 406–407.
Katusic, S. K., Colligan, R. C., Barbaresi, W. J., Schaid, D. J., & Jacobsen, S. J. (2001,
November). Incidence of reading disability in a population-based birth cohort, 1976–
1982, Rochester, Minn. In Mayo Clinic Proceedings (Vol. 76, No. 11, pp. 1081-1092).
Elsevier. https://dx.doi.org/10.4065/76.11.1081
Kessler, R. C., Berglund, P., Demler, O., Jin, R., Merikangas, K. R., & Walters, E. E. (2005).
Lifetime prevalence and age-of-onset distributions of DSM-IV disorders in the National
Comorbidity Survey Replication. Archives of general psychiatry, 62(6), 593-602.
https://dx.doi.org/10.1001/archpsyc.62.6.593
Kish, L. (1965). Survey Sampling. Wiley: New York.
Lloyd, J. W., Kauffman, J. M., Landrum, T. J., & Roe, D. L. (1991). Why do teachers refer
pupils for special education? An analysis of referral records. Exceptionality: A Special
Education Journal, 2(3), 115-126. https://dx.doi.org/10.1080/09362839109524774
Loeb, S., Dynarski, S., McFarland, D., Morris, P., Reardon, S., & Reber, S. (2017). Descriptive
analysis is education: A guide for researchers. (NCEE 2017-4023). Washington, DC:

39
U.S. Department of Education, Institute of Education Sciences, National Center for
Education Evaluation and Regional Assistance. Retrieved from
https://ies.ed.gov/ncee/pubs/20174023/pdf/20174023.pdf
Losen, D. J., & Orfield, G. (2002). Racial Inequity in Special Education. Harvard Education
Publishing Group: Cambridge.
MacMillan, D. L., & Reschly, D. J. (1998). Overrepresentation of minority students: The case for
greater specificity or reconsideration of the variables examined. The Journal of Special
Education, 32(1), 15-24. https://dx.doi.org/10.1177/002246699803200103
Mann, E. A., McCartney, K., & Park, J. M. (2007). Preschool predictors of the need for early
remedial and special education services. The Elementary School Journal, 107(3), 273-
285. https://dx.doi.org/10.1086/511707
Marder, C. (2009). Facts from SEELS: Perspectives on students’ primary disability
classifications. Washington, D.C.: U.S. Department of Education, Office of Special
Education Programs. Retrieved from
https://www.seels.net/info_reports/DisabilityClassif1.9.09.pdf
Matthews, J. S., Ponitz, C. C., & Morrison, F. J. (2009). Early gender differences in self-
regulation and academic achievement. Journal of Educational Psychology, 101, 689-704.
https://dx.doi.org/10.1037/a0014240
Michelmore, K., & Dynarski, S. (2016). The gap within the gap: Using longitudinal data to
understand income differences in student achievement. AERA Open, 3(1).
https://dx.doi.org/10.1177/2332858417692958
Morgan, P. L., Farkas, G., Cook, M., Strassfeld, N. M., Hillemeier, M. M., Pun, W. H., &
Schussler, D. L. (2017). Are Black children disproportionately overrepresented in special

40
education? A best-evidence synthesis. Exceptional Children, 83(2), 181-198.
http://dx.doi.org/10.1177/0014402916664042
Morgan, P. L., Farkas, G., Hillemeier, M. M., Mattison, R., Maczuga, S., Li, H., & Cook, M.
(2015). Minorities are disproportionately underrepresented in special education:
Longitudinal evidence across five disability conditions. Educational Researcher, 44(5),
278-292. https://dx.doi.org/10.3102/0013189X15591157
Morgan, P. L., Farkas, G., Hillemeier, M. M., & Maczuga, S. (2012). Are minority children
disproportionately represented in early intervention and early childhood special
education?. Educational Researcher, 41(9), 339-351.
https://dx.doi.org/10.3102/0013189X12459678
Morgan, P. L., Farkas, G., Tufis, P. A., & Sperling, R. A. (2008). Are reading and behavior
problems risk factors for each other?. Journal of Learning Disabilities, 41(5), 417-436.
https://dx.doi.org/10.1177/0022219408321123
National Center for Education Statistics (2016). Children and youth with disabilities. The
Condition of Education. Washington, D.C.: Institute for Education Sciences. Retrieved
from https://nces.ed.gov/programs/coe/pdf/coe_cgg.pdf
Oswald, D. P., Coutinho, M. J., & Best, A. M. (2002). Community and school predictors of
overrepresentation of minority children in special education. In D. J. Losen & G. Orfield
(Eds.), Racial Inequity in Special Education (pp. 1-13). Cambridge, MA: Harvard
Education Press
Oswald, D. P., Coutinho, M. J., Best, A. M., & Singh, N. N. (1999). Ethnic representation in
special education the influence of school-related economic and demographic
variables. The Journal of Special Education, 32(4), 194-206.

41
https://dx.doi.org/10.1177/002246699903200401
Parrish, T. B., Hikido, C. S., & Fowler, W. J., Jr. (1998). Inequalities in Public School District
Revenues. Washington, DC: National Center for Education Statistics, U.S. Department of
Education. Retrieved from https://files.eric.ed.gov/fulltext/ED423261.pdf
Peterson, C. A., Wall, S., Jeon, H. J., Swanson, M. E., Carta, J. J., Luze, G. J., & Eshbaugh, E.
(2011). Identification of disabilities and service receipt among preschool children living
in poverty. The Journal of Special Education, 47(1), 28-40.
https://dx.doi.org/10.1177/0022466911407073
Shifrer, D., Muller, C., & Callahan, R. (2011). Disproportionality and learning disabilities:
Parsing apart race, socioeconomic status, and language. Journal of Learning Disabilities,
44, 246–257. https://dx.doi.org/10.1177 /0022219410374236
Skiba, R. J., Poloni-Staudinger, L., Simmons, A. B., Renae Feggins-Azziz, L., & Chung, C. G.
(2005). Unproven links: Can poverty explain ethnic disproportionality in special
education? The Journal of Special Education, 39(3), 130-144.
https://dx.doi.org/10.1177/00224669050390030101
Sullivan, A. L. (2011). Disproportionality in special education identification and placement of
English language learners. Exceptional Children, 77(3), 317-334.
https://dx.doi.org/10.1177/001440291107700304
Sullivan, A. L., & Bal, A. (2013). Disproportionality in special education: Effects of individual
and school variables on disability risk. Exceptional Children, 79(4), 475-494.
https://dx.doi.org/10.1177/001440291307900406
Turney, K., & McLanahan, S. (2015). The academic consequences of early childhood problem
behaviors. Social Science Research, 54, 131-145.

42
https://dx.doi.org/10.1016/j.ssresearch.2015.06.022
Wiley, A., & Siperstein, G. N. (2011). Seeing red, feeling blue: The impact of state political
leaning on state identification rates for emotional disturbance. Behavioral Disorders,
36(3), 195-207. Retrieved from https://www.jstor.org/stable/43153537

43
Table II.1 Variable Descriptions
Variable Description
Individual
Male 1=Male Sex
Non-English Lang 1=Non-English primarily spoken in the home
Race/Ethnicity 1=Non-Hispanic White, 2=Non-Hispanic Black, 3=Hispanic,
4=Asian, 5=Other
Low Birthweight 1=Born weighing less than 6 lbs.
Disability 1=Parent reports a disability
Age at K Entry Age at Kindergarten entry, ranging from 38 to 83 months
No Insurance 1=Child does not have health insurance coverage
No Regular Childcare 1=Child did not attend regular childcare (including daycare and
Head Start) before Kindergarten
Income Parent-reported household income, ranging from 1 (less than
$5,000) to 13 (greater than $100,000)
Poverty 1=Family is at or below federal poverty line
Single Parent 1=Mother is single, separated, divorced, or widowed
Maternal Education Level of mother’s education, ranging from 1 (8th grade education
or less) to 9 (doctoral or professional degree)
Home Cog. Stimulation Standardized measure of cognitive stimulation in the home
environment, ranging from -3.3 to 3.0
No. Siblings Number of siblings, ranging from 0-10
Reading IRT-adjusted spring reading score, ranging from 11.6 to 70.8
Mathematics IRT-adjusted spring mathematics score, ranging from 7.7 to 59.2
App. To Learning Teacher-reported positive learning behaviors, average scale
ranging from 1-4
Self-Control Teacher-reported self-regulation skills, average scale ranging from
1-4
Interpersonal Teacher-reported interpersonal relationships, average scale
ranging from 1-4
Externalizing Teacher-reported externalizing problem behaviors, average scale
ranging from 1-4
Internalizing Teacher-reported internalizing problem behaviors, average scale
ranging from 1-4
School
Region 1=Northeast, 2=Midwest, 3=South, 4=West
Urban Area 1=Urban Area (Census Reported Population >250,000)
Neighborhood Safety+ Standardized principal-reported measure of neighborhood quality
and safety, ranging from -0.9 to 1.9
Private School 1=Principal reports school is private or religious
School Size+ Principal-reported number of children enrolled in school, ranging
from 1 (149 or less) to 5 (750 or more)
School Climate+ Standardized measure of school climate reported by principal,
ranging from -3.0 to 2.7

44
Title I Funding 1=Principal reports that school receives schoolwide Title I
Funding
% Free Lunch Principal-reported proportion of student body receiving free lunch,
ranging from 0 to 100
Avg. SES+ Student-level measure of SES (created by ECLS-K), aggregated
across schools, ranging from -1.5 to 1.7
% Non-White Principal-reported proportion of student body that reports a non-
White race/ethnicity, ranging from 1 (less than 10%) to 5 (75% or
more)
% Limited English Principal-reported proportion of student body that are English
Language Learners, ranging from 0 to 99
No. Disabilities/Class Teacher-reported number of students with disabilities in their
classroom, aggregated across the school, ranging from 0 to 28
Avg. Reading Student-level IRT-adjusted reading scores, aggregated across
schools, ranging from 12.3 to 63.7
Avg. Math Student-level IRT-adjusted mathematics scores, aggregated across
schools, ranging from 7.7 to 49.4
Avg. App. To Learn Student-level IRT-adjusted positive learning behaviors, as rated by
teachers and aggregated across schools, ranging from 1.8 to 4
Avg. Self-Control Student-level IRT-adjusted self-regulation skills, as rated by
teachers and aggregated across schools, ranging from 2 to 4
Avg. Interpersonal Student-level IRT-adjusted interpersonal skills, as rated by
teachers and aggregated across schools, ranging from 2.2 to 4
Avg. Externalizing Student-level IRT-adjusted externalizing problems, as rated by
teachers and aggregated across schools, ranging from 1 to 2.5
Avg. Internalizing Student-level IRT-adjusted internalizing problems, as rated by
teachers and aggregated across schools, ranging from 1 to 2.3 +Standardized to M=0, SD=1

45
Table II.2 Fit Statistics for 2-, 3-, 4-, and 5-Solution Latent Class Analysis
2-class 3-class 4-class 5-class
AIC 9675.16 9376.26 9207.31 9214.66
BIC 9745.60 9485.13 9354.60 9400.37
Sample-Size Adjusted BIC 9710.65 9431.11 9281.52 9308.22
Entropy .933 .950 .939 .891
VLMR LRT p-value .000 .000 .000 .203
LMR Adjusted LRT p-value .000 .000 .000 .210
Note: AIC = Akaike Information Criterion; BIC = Bayesian Information Criterion; VLMR = Vuong-Lo-Mendell-
Rubin; LRT = Likelihood Ratio Test; LMR = Lo-Mendell-Rubin.

46
Table II.3 4-Solution Latent Class Analysis Classification Patterns of Special Education Service
Receipt
Class 1 Class 2 Class 3 Class 4
Never (n = 3,790) Persistent (n = 210) Terminal (n = 160) Delayed (n = 310)
Pattern % Pattern % Pattern % Pattern %
22222 95.9 11111 40.8 11222 26.9 22111 28.5
22122 1.6 21111 19.0 21222 25.0 22211 23.0
22221 1.4 11112 18.5 11122 18.1 22212 22.6
12222 1.2 21112 10.0 21122 13.8 22112 18.7
12111 4.3 12122 4.4 22121 3.3
11121 3.3 21212 3.1 12212 2.0
12112 3.3 11212 2.5 21211 1.6
11211 1.0 21221 2.5 12211 0.3
11221 1.9
12121 0.6
12221 0.6
21121 0.6

47
Table II.4 Individual-Level Weighted Kindergarten Descriptive Statistics by Special Education Trajectory
Never
M (SD) or %
(a)
Persistent
M (SD) or %
(b)
Terminal
M (SD) or %
(c)
Delayed
M (SD) or %
(d)
Sample
Total F or χ2 %
Missing
Demographics
Male 47.4bd 64.3a 59 64.1a 50 59.98*** 0
Non-English Lang 5.9 0.4 0.3 0.8 7.3 4.74 1.7
Race/Ethnicity 19.41 0.2
White 71.9 66.9 68.4 65.4 71
Black 10.2 14.6 13.1 15 10.9
Hispanic 12 13.6 13.3 14.9 12.4
Asian 4 4.6 4 3.2 4
Multiracial 1.9 0.4 1.2 1.5 1.8
Low Birthweight 8.7 12 11.8 8 8.9 4.48 6.9
Disability 10.1bcd 58.5ad 43.8ad 19.4acd 14.5 471.49*** 4.1
Age at K Entry 65.95 (.08) 66.04 (.38) 66.39 (.42) 66.10 (.28) 65.98 (.08) 0.44 4.1
Home/Parenting
No Insurance 6.9 8.6 8.1 12.2 7.4 12.54 3.7
No Reg. Childcare 24.9 19.4 25.5 25.5 24.7 0.28 21.4
Income 8.08 (.06)bcd 6.72 (.24)a 7.21 (.28)a 6.79 (.22)a 7.88 (.05) 21.75*** 1.7
Poverty 12.4bd 24.4a 18.4 25.9a 14.2 66.08*** 1.7
Single Parent 20.5bd 31.2a 27.1 30.5a 22 30.29*** 5.1
Maternal Ed 4.62 (.03)bcd 3.94 (.14)a 3.95 (.14)a 4.15 (.11)a 4.52 (.03) 17.77*** 3.0
Home Cog. Stim+ .01 (.02)bcd -.41 (.08)a -.33 (.08)a -.21 (.07)a -.04 (.02) 15.9*** 4.3
No. Siblings 1.38 (.02) 1.65 (.11) 1.45 (.09) 1.58 (.08) 1.41 (.02) 3.66 4.0
Academics/Behavior
Reading 34.63 (.18)bcd 25.53 (.78)acd 29.22 (.78)ab 27.50 (.62)ab 33.37 (.17) 98.38*** 3.4
Mathematics 30.24 (.15)bcd 21.03 (.66)acd 26.88 (.67)abd 24.05 (.56)abc 29.17 (.15) 99.13*** 0.9
App. To Learning 3.28 (.01)bcd 2.58 (.06)acd 3.06 (.06)abd 2.81 (.05)abc 3.20 (.01) 79.37*** 1.9

48
Self-Control 3.30 (.01)bd 2.91 (.05)ac 3.19 (.05)b 3.05 (.05)a 3.26 (.01) 27.09*** 2.3
Interpersonal 3.24 (.01)bd 2.82 (.06)ac 3.11 (.05)b 2.95 (.04)a 3.20 (.01) 32.28*** 2.7
Externalizing 1.57 (.01)bd 1.92 (.06)ac 1.61 (.05)b 1.78 (.05)a 1.60 (.01) 18.39*** 2.1
Internalizing 1.49 (.01)bd 1.79 (.04)acd 1.61 (.04)b 1.64 (.03)abd 1.52 (.01) 25.65*** 2.6 +Standardized measure (M=0, SD=1).
***p < .001, **p < .01, *p < .05 (Holm-corrected significance values) a,b,c,d Letters indicate which columns differ significantly from one another. Multiple comparisons corrected using Scheffé's method.

49
Table II.5 School-Level Weighted Kindergarten Descriptive Statistics by Special Education Trajectory
Never
M (SD) or %
(a)
Persistent
M (SD) or %
(b)
Terminal
M (SD) or %
(c)
Delayed
M (SD) or %
(d)
Sample
Total F or χ2 %
Missing
School Demographics
Region 29.26 0.0
Northeast 17.4 17.1 14.9 19.2 17.4
Midwest 29.5 27.8 26 30.7 29.3
South 37.5 46.9 47.5 41.4 38.7
West 15.6d 8.3 11.6 8.8a 14.6
Urban Area 81.1 78.6 73.7 78 80.4 8.06 0.0
Neighbrhd. Safety+ -.02 (.02) .11 (.09) -.14 (.09) .02 (.08) -.02 (.02) 1.35 21.0
Private School 15.5bcd 2.2a 2.7a 5.1a 13.5 75.44*** 0.0
School Size+ .11 (.02) .12 (.07) .12 (.09) .18 (.07) .11 (.02) 0.36 0.0
School Climate+ -.04 (.02)b -.31 (.08)a -.10 (.09) -.13 (.07) -.06 (.02) 4.15 14.8
Title I Funding 61.4c 71.4 73.6a 62.3 62.6 18.36** 0.3
Student Demographics
% Free Lunch 47.25 (.71) 53.02 (2.77) 49.02 (3.01) 49.77 (2.35) 47.81 (.64) 1.67 25.2
Avg. SES+ .08 (.01)bcd -.11 (.03)a -.09 (.03)a -.02 (.03)a .05 (.01) 20.82*** 0.2
% Non-White 24.84 (.57) 27.23 (2.44) 25.77 (2.62) 28.79 (2.05) 25.29 (.52) 1.4 1.1
% Lim. English 4.06 (.22) 5.53 (1.11) 4.39 (1.22) 3.47 (.63) 4.11 (.20) 0.91 5.4
No. Disab/Class 1.97 (.05)bc 3.63 (.31)ad 2.98 (.25)ad 1.93 (.17)bc 2.10 (.05) 14.37*** 0.1
Student Achievement/Behavior
Avg. Reading 32.62 (.09)bcd 30.40 (.35)a 30.98 (.39)a 31.40 (.31)a 32.35 (.09) 20.33*** 0.1
Avg. Math 28.48 (.08)bcd 26.42 (.28)ad 27.19 (.33)a 27.48 (.25)ab 28.24 (.07) 23.07*** 0.0
Avg. App. To Learn 3.13 (.00)b 3.04 (.02)a 3.10 (.02) 3.11 (.02) 3.13 (.04) 10.49*** 0.5
Avg. Self-Control 3.21 (.00)b 3.14 (.02)ad 3.19 (.02) 3.21 (.02)b 3.20 (.00) 6.35*** 0.5
Avg. Interpersonal 3.14 (.00)b 3.06 (.02)ad 3.12 (.02) 3.13 (.02)b 3.13 (.00) 6.55*** 0.5
Avg. Externalizing 1.65 (.00)b 1.72 (.02)ad 1.65 (.02) 1.65 (.02)b 1.65 (.00) 5.35** 0.5

50
Avg. Internalizing 1.55 (.00)b 1.62 (.01)a 1.57 (.01) 1.57 (.01) 1.56 (.00) 7.23*** 0.5
Avg. No. Disabilities 1.91 (.04)b 2.89 (.22)ad 2.34 (.22) 2.05 (.16)b 1.97 (.03) 7.43*** 1.8 +Standardized measure (M=0, SD=1).
***p < .001, **p < .01, *p < .05 (Holm-corrected significance values) a,b,c,d Letters indicate which columns differ significantly from one another. Multiple comparisons corrected using Scheffé's method.

51
Table II.6 Relative Risk of Placement in LCGA Trajectories by Kindergarten Predictors
Persistent Terminal Delayed
Demographics
Male 1.77* 1.69* 1.66**
Non-English Lang. 0.27* 1.13 0.92
Race/Ethnicity
Black 0.53 0.56 0.62
Hispanic 0.73 1.13 0.86
Asian/Pacific Islander 0.29 0.76 0.67
Other 0.22* 0.72 0.88
Low Birthweight 0.60 1.17 0.53
Disability 9.06*** 5.35*** 2.10**
Age at K Entry 1.10** 1.01 1.02
Home Characteristics
No Health Insurance 0.53 0.42+ 0.94
No Reg. Childcare 0.95 1.21 0.99
Income 1.00 0.98 0.96
Poverty 1.66 1.04 1.02
Single Parent 0.77 0.77 0.95
Maternal Ed. 1.05 0.94 1.02
Home Cog. Stim. 0.71* 0.90 0.90
No. Siblings 0.97 1.06 0.94
Achievement/Behavior
Reading 0.98 0.97 0.96*
Mathematics 0.88*** 0.97 0.92***
App. To Learn 0.44* 0.71 0.58*
Self-Control 0.58 0.47+ 0.90
Interpersonal 1.78 1.41 1.13
Externalizing 0.96 0.64 0.67+
Internalizing 1.35 0.95 1.01
School Demographics
Region of Country
Midwest 1.12 1.03 0.79
South 0.72 1.44 0.76
West 0.52 0.61 0.35**
Urban 0.50 0.74 1.00
School Neighborhood 0.92 0.80* 1.02
Private School 0.12** 0.32* 0.59
School Size 1.09 0.95 1.06
School Climate 1.00 1.02 1.00
Title I Funding 1.25 1.15 0.80

52
Student Demographics
% Free Lunch 0.99 0.99 1.00
% Nonwhite 1.05 1.14 1.08
% Limited English 1.01 1.00 1.00
Avg. SES 1.04 0.69 1.71
Student Achievement/Behavior
Avg. Reading 1.11 0.95 0.98
Avg. Mathematics 0.93 1.09 1.11*
Avg. App. To Learn 2.12 0.45 0.51
Avg. Self-Control 5.80 2.26 3.85
Avg. Interpersonal 0.33 1.49 0.95
Avg. Externalizing 1.76 0.77 3.31+
Avg. Internalizing 1.81 1.99 0.67
Avg. No. Disabilities 1.13* 1.02 1.00
Constant^ 0.00*** 0.10 0.03 ***p < .001, **p < .01, *p < .05, +p < .10
^Constant displays overall likelihood of placement.

53
Figure II.1 4- and 5-Solution Latent Class Growth Analyses of Special Education Trajectories
0
0.1
0.2
0.3
0.4
0.5
0.6
0.7
0.8
0.9
1
Kind First Third Fifth Eighth
Pro
bab
ilit
y o
f S
pec
ial
Ed
uca
tio
n
5-Class LCGA
Delayed
Persistent
Delay/Terminal
Terminal
Never
0
0.1
0.2
0.3
0.4
0.5
0.6
0.7
0.8
0.9
1
Kind First Third Fifth Eighth
Pro
bab
ilit
y o
f S
pec
ial
Ed
uca
tio
n
4-Class LCGA

54
Figure II.2 Weighted Proportion of Students in Each Trajectory by Primary Special Education Disability Category
0
10
20
30
40
50
60
70
80
Kind First Third Fifth Eighth
Per
cent
of
Tra
ject
ory
Delayed
Learning Disability
Speech & Language Impairment
Serious Emotional Disturbance
Mental Retardation
Other Health Impairment
Other Diagnosis
Kind First Third Fifth Eighth
Terminal
0
10
20
30
40
50
60
70
80
Kind First Third Fifth Eighth
Per
cent
of
Tra
ject
ory
Persistent

55
Figure II.3 Longitudinal Academic Achievement by Special Education Trajectory
0
20
40
60
80
100
120
140
160
180
Kind First Third Fifth Eighth
IRT
-Sca
led
Sco
re
Mathematics Achievement
Never
Persistent
Terminal
Delayed
0
20
40
60
80
100
120
140
160
180
Kind First Third Fifth Eighth
IRT
-Ad
just
ed S
core
Reading Achievement

56
CHAPTER III
Contextualizing Patterns of Special Education Placement and Service Receipt
Abstract
Though researchers have long been interested in identifying which U.S. students receive special
education services, several important gaps in our knowledge remain. In particular, this study
addressed how the likelihood of receiving special education services were impacted by 1) the
contributions of individual and aggregated data, 2) modeling longitudinal trajectories from
Kindergarten through eighth grade, and 3) analyzing how the schooling context differentially
influences students from varying backgrounds and with different levels of achievement or
behavior. Using the ECLS-K:1998, four multilevel growth analyses were modeled in two
samples: the first assessed the likelihood of service receipt in a traditional sample of both general
and special education students, while the second investigated which predictors influenced earlier
or later service receipt in a sample of students who received services at least once between
Kindergarten and eighth grade. Results revealed that individual-level data was most predictive of
service receipt, though between a quarter and a third of the variability in special education status
occurred between schools; different factors predicted the likelihood of receiving services early in
schooling relative to later in schooling; and that the schooling context did not appear to
differentially affect certain students' likelihood of service receipt over others, whether that
pertain to race/ethnicity, achievement, or behavior. Moreover, implications for researchers and

57
policymakers were discussed, particularly regarding the importance of early identification of
disability and early identification disparities in urban areas and among students with less-
educated mothers.
Keywords: multilevel modeling; special education identification; students with
disabilities; longitudinal growth modeling

58
Introduction
From both a financial and civil rights perspective, researchers have long been interested
in understanding what influences student likelihoods of receiving special education services.
Students with disabilities have had the right to be freely educated in the least restrictive
environment since the Education for All Handicapped Children Act was passed in 1975. But
problematic and widespread patterns in the demographics of special education students have led
to concern that there may be systemic bias in referral policies and procedures. For example,
apprehension about the disproportionate identification of non-White students in special education
has been likened to a modern-day Jim Crow method of segregation or racism (Blanchett,
Mumford, & Beachum, 2005; Skiba et al., 2008), and has led to large-scale policy and funding
implementations designed to reduce this disproportionality. In recent years, however, these
policies have come under question, as more rigorous methodological research has challenged the
idea that non-White students are over-referred for special education (e.g., see Morgan et al.,
2015b, 2016, 2017). In this way, the increasing use of more complex methodologies combined
with the availability of large-scale datasets is improving researchers' abilities to ascertain who is
placed in special education.
Yet, existing studies are incomplete for three reasons. First, most studies fail to consider
the impact of multiple levels of influence on special education placement (e.g. child-level
factors, such as race/ethnicity, in combination with family-, school-, district-, and state-level
factors), choosing instead to model predictors at one level alone (Morgan et al., 2012; Shifrer,
Muller, & Callahan, 2011). Though it is imperative to model individual-level predictors that are
linked to special education placement, (such as academic achievement, behavior, sex,
socioeconomic status, and race/ethnicity), it is also important to account for differences at the

59
school level, where overarching state and school policies, funding allocations, demographics,
teacher characteristics, and available resources may impact who is placed in special education
(Aron & Loprest, 2012; Dhuey & Lipscomb, 2013; Oswald, Coutinho, Best, & Singh, 1999;
Gordon, 2004). Second, research has also overwhelmingly concentrated on cross-sectional
estimates of special education placement instead of accounting for longitudinal trajectories of
special education service receipt, which are influenced by factors varying across developmental
stages and timepoints. Though some studies utilize longitudinal data to assess how factors
measured in early schooling influence later special education placement (e.g., Hibel, Farkas, &
Morgan, 2010; Sullivan & Bal, 2013), there appear to be no studies investigating how and for
whom likelihood of placement changes over time while also accounting for both individual- and
school-level data. Third and finally, though several studies have hypothesized the existence of a
contextual schooling effect that differentially influences certain students over others (the "frog
pond effect"), few studies have modeled this phenomenon using both individual and aggregate
data and cross-level interactions.
The goal of this study was to assess the relative contributions of individual- and school-
level predictors to special education service receipt, and ascertain how these predictors might
interact to differentially influence student likelihoods of service receipt both initially and over
time. Given that probabilities of placement likely depend on hierarchical interactions between
individual characteristics and school-level factors (e.g. individual race/ethnicity interacting with
schoolwide disadvantage), this study builds upon the question who is placed in special
education? by using multilevel growth modeling to contextualize individuals' longitudinal
likelihood of service receipt within schools.

60
Importance of Analyzing Multiple Levels of Influence
The first problem that has plagued existing research on who receives special education
services involves the importance of analyzing both individual-level data (e.g., student's sex,
race/ethnicity, family income) and data aggregated across the school, district, or state (e.g.,
proportions of students receiving free lunch, statewide funding allocations for special education).
Whether the researcher examines individual or aggregated data seems to significantly influence
their conclusions regarding the factors most related to special education placement.
To illustrate, studies that include only individual-level predictors often assess either risk
for disability identification (irrespective of in-school service receipt), which is most strongly
predicted by sociodemographic, socioeconomic, and/or social disadvantage (e.g., Altarac &
Saroha, 2007; Blackburn, Spencer, & Read, 2013; Costello et al., 1996; Morgan, Hillemeier,
Farkas, & Maczuga, 2014), or special education placement, which seems most strongly predicted
by poor academic achievement and behavior (e.g., Morgan, Farkas, & Hillemeier, 2015; Morgan,
Farkas, Hillemeier, & Maczuga, 2012; Samson & Lesaux, 2009). However, and conversely,
studies that use only data aggregated across the school, district, or state typically find that this
trend is reversed, such that schoolwide achievement and behavior relate to special education
identification only modestly or inconsistently (e.g., Hosp & Reschly, 2004; Skiba et al., 2005)
while neighborhood disadvantage and schoolwide demographics have stronger predictive power
(e.g., McLaughlin & Owings, 1993; Oswald, Coutinho, Best, & Singh, 1998; Skiba et al., 2005;
Parrish & Hikido, 1998). Importantly, school, district, and state-level predictors significantly
explain variability in identification rates (e.g., Oswald, Coutinho, Best, & Singh, 1998; Skiba et
al., 2005; Wiley & Siperstein, 2011), which necessitates the use of both individual- and
aggregate-level data when assessing who is placed in special education.

61
Yet, gaps remain in our extent knowledge of who receives special education services,
given several key methodological decisions among the few studies utilizing both individual- and
school-level data cited here. First, many of these studies did not include student-level measures
of academic achievement when assessing risk for special education placement (Artiles, Rueda,
Salazar, & Higareda, 2002; McLaughlin & Owings, 1993; Oswald, Coutinho, & Best, 2002;
Oswald, Coutinho, Best, & Singh, 1998; Parrish & Hikido, 1998; Skiba et al., 2005; Sullivan &
Bal, 2013; Wiley, Brigham, Kauffman, & Bogan, 2013; Wiley & Siperstein, 2011), which has
been cited as a major methodological error given the strong predictive effect of achievement in
individual-level studies (Donovan & Cross, 2002; Hosp & Reschly, 2004; Morgan et al., 2017).
Even fewer use analyses that account for the hierarchically-nested nature of children within
schools (but, see Hibel, Farkas, & Morgan, 2010; Shifrer, Muller, & Callahan, 2011; Sullivan &
Bal, 2013). Failing to account for clustered data has been shown to inflate error estimates and
underestimates the contribution of individual- versus school-level effects (Raudenbush & Bryk,
2002). Some researchers even suggest that all analyses should be modeled hierarchically,
particularly when using samples in which nesting occurs naturally (such as children within
schools) (McElreath, 2017). To combat this issue, the current study utilized multi-level modeling
to nest individual predictors within the schooling context.
Importance of Analyzing Change Over Time
The second gap in our understanding of who receives special education services regards
the importance of analyzing how probabilities of service receipt change over time, and for
whom. Whether and when a child receives special education services depends on many factors,
not least of which includes the developmental stage of the child and their concurrent educational
needs. Thus, predictors modeled during early schooling may confer a different likelihood of

62
special education placement than those same predictors modeled later in schooling. For instance,
there is evidence that English Language Learners (ELL's) are overrepresented in special
education at later grades but underrepresented earlier in schooling, regardless of whether
individual- (Samson & Lesaux, 2009) or school-level (Artiles et al., 2002) predictors were
modeled. Accounting for longitudinal trajectories of service receipt may therefore change the
impact that individual- or school-level predictors have on likelihoods of placement.
Though some research has demonstrated differences in outcomes associated with the
timing of service receipt (e.g., Chesmore, Ou, & Reynolds, 2016; Ehrhardt, Huntington, Molino,
& Barbaresi, 2013), it is unclear whether these differences are a function of the services rendered
or the types of students who receive earlier versus later services. If students who receive earlier
services do not differ, outcome variation is more plausibly due to the services received after
controlling for the appropriate individual- and school-level covariates. But, if individual and
school predictors differentiate those who are placed at earlier or later points in schooling,
outcome variation could instead be due to population differences between students who receive
services at different times. Thus, we need to better understand how likelihoods change over time
for various students, so that we can improve the precision of estimates measuring special
education's influence.
Who is Placed in Special Education? The "Frog Pond Effect"
Lastly, the third gap in research assessing who is placed in special education comes from
inconsistent methodological choices, specifically the failure to model interactions between
individual- and school-level characteristics. To this end, the present study may be best likened to
a replication and extension of Hibel, Farkas, and Morgan (2010), who used multilevel logistic
regression to assess which first graders receive services by the spring of third grade. Their main

63
interest was to test the "frog pond effect," a phenomenon in which similar students may seem
“worse” when compared with higher- rather than lower-performing peers (Farkas, Sheehan, and
Grobe, 1990; Davis, 1966), even after accounting for a wide range of other individual-, family-,
and school-level characteristics. Indeed, they found that attending elementary schools with
higher levels of academic achievement, better overall behavior, and fewer non-White students
increased a student's likelihood of special education placement.
Though the frog pond effect applies to the school as a whole, it is possible that the
schoolwide context may also differentially affect certain students. School environments could
either compound the impact of other risk factors or serve a protective role for children who
experience socioeconomically disadvantaged backgrounds or family discord (Morrison &
Cosden, 1997; Rutter, 1979). Large populations of low-performing students at the school- or
district-level could lead educators to overlook the low-performing students for whom
underperformance is due to undiagnosed disabilities (i.e., the big frog stands out in the small
pond). Lower-performing students might thus be more likely to receive special education in
higher- rather than lower-achieving schools, especially given that teachers' referral decisions
often hinge on comparisons to peers (Peterson et al., 2011).
Non-White students in certain schools may also have different experiences with special
education than White students. Black and Hispanic families experience more biological and
social traumas that increase the likelihood of disability identification (e.g. living in poverty,
having a single/teenage parent, etc.) (Hibel et al., 2010). This would not only elevate their risk
for special education placement but also for attending high-risk schools, where the frog pond
effect could reduce likelihood of service receipt. Numerous researchers have found evidence for
this effect, such that Black students are more likely to be placed in special education in higher-

64
resourced districts (Oswald et al., 1999; Skiba et al., 2005), better-performing schools (Hibel et
al., 2010), and in districts with fewer numbers of minority students (Hibel et al., 2010; Oswald,
Coutinho, & Best, 2002).
However, the current study differs from Hibel's in several key ways. First, although Hibel
and colleagues nested individual- and family-level variables within school-level variables, they
did not investigate how these variables influence change in special education placement over
time. They also did not include any school-level variables directly assessing the resources used
to offset special education services and/or costs (e.g., Title I funds). Lastly and most importantly,
they modeled only the main effect of the schooling context and did not consider cross-level
interactions between school-level characteristics and individual traits. Hibel and colleague's
results therefore indicate that in schools with a higher proportion of minority students, all
students have a reduced chance of special education placement. At the same time, they tended to
illustrate the frog pond effect using language more suited to cross-level interactions ("Consider
the counterfactual comparison involved in a low-performing student simultaneously attending
two very different schools… The student should be more likely to be placed in special education
when attending the high-performing school" pp. 315, emphasis added). Thus, although there are
many similarities between the present study and Hibel et al. (2010), the present study may be
viewed as an extension of their work in which change over time and cross-level interactions
(individual*school) are modeled in a hierarchical framework.
Research Questions and Hypotheses
The present study conducted two series of multilevel analyses. The first set of analyses
compared students in general education with students who received special education services
between Kindergarten and 8th grade. This analysis aimed to understand whether contextualizing

65
individual predictors within school predictors influenced the likelihood of special education
placement both at Kindergarten and over time. The second set of analyses sampled only students
who received special education during at least one timepoint between Kindergarten and 8th
grade, which might allow researchers to better understand what influences both a student's initial
and longitudinal propensity to receive services without statistical contamination from students
who never receive services. Because students who are placed in special education at some point
K-8 are fundamentally different from students who never receive services by way of a disability
that adversely impacts academic performance (Hanuschek, Kain, & Rivkin, 2002), this second
set of analyses not only provides a sensitivity check but allows for pinpointing the differences
between special education students who receive services earlier versus later in schooling.
There were three research goals for each set of analyses. First, the relative influence of
individual- versus school-level predictors were decomposed through successive iterations of
model building in which schoolwide data was added to individual data. This improves
understanding of how these levels interact to influence placement both initially and over time.
Second, each model assessed not only the factors predicting which students had an
Individualized Education Plan (IEP) in the spring of Kindergarten, but how their likelihoods of
placement changed between Kindergarten and eighth grade. This analysis of change over time
represents an important yet previously unknown element in identification research. Third and
finally, the last model for each analysis tested whether individual likelihoods of special education
placement were differentially impacted by school demographic compositions (i.e., whether
school-level characteristics interact across levels with individual-level predictors). Cross-level
interactions would reveal an important extension to the frog pond effect. These analyses tested
four types of frog pond interactions: individual achievement by schoolwide achievement;

66
individual positive learning behaviors by schoolwide aggregates of positive learning behaviors;
individual externalizing problem behaviors by schoolwide aggregates of problem behaviors; and
individual race/ethnicity by schoolwide proportions of non-White students.
In keeping with prior research, individual factors were hypothesized to more strongly
influence a student's likelihood of service receipt than school factors (though these would also
have some influence). Alternatively, if modeling school-level factors decreased the impact of
individual-level effects, a student’s trajectory through special education was not insignificantly
impacted by risk factors occurring at the school-level. This distinction is vital to make, given the
prior diversity in methodological decisions when measuring risk for special education placement.
Moreover, it was expected that these analyses would replicate evidence for frog pond effects
based on academic performance, behavioral ratings, and race/ethnicity differences, such that
struggling students (particularly non-White students) would be more likely to receive services
both initially and over time in better-performing and behaving schools, or in schools with lower
proportions of poorer or non-White students. This study may also clarify policy regarding
disproportionate representation, as policies that ignore the contextual contributions of school-
wide characteristics will subsequently produce unbalanced enforcement across schools with
different student and school characteristics.
Method
Data Source and Sample
Data were drawn from the Early Childhood Longitudinal Study – Kindergarten cohort of
1998-1999 (ECLS-K). Funded through the Institute of Education Sciences, this study collected a
wide array of data on home and schooling experiences for one cohort of students followed from
Kindergarten through 8th grade. The rich, longitudinal nature of the dataset is ideal for studying

67
educational outcomes, such as the timing and duration of special education service receipt.
Students in the ECLS-K were sampled from participating schools, rendering possible the use of
multilevel modeling to answer questions about the complexity of educational systems. Moreover,
because both U.S. schools and students were sampled in successive stages, applying initial
school-level weights and longitudinal child-level weights allows analyses to be representative of
students who began Kindergarten in U.S. schools during the 1998 school year, and who
participated in the study through 8th grade. This element of national representation is particularly
important to consider given the disparities in findings produced by sampling differences among
prior research. For example, studies utilizing a primarily white, middle-class sample find that
socioeconomic disadvantage increases risk for disability identification (e.g., Grunau, Whitfield,
& Davis, 2002; Blackburn, Spencer, & Read, 2013; Costello et al., 1996; Emerson, Einfeld, &
Stancliffe, 2011), while those using more diverse samples find that disadvantage decreases risk
for disability identification, especially among non-white youth (e.g., Morgan, Hillemeier, Farkas,
& Maczuga, 2014; Morgan, Staff, Hillemeier, Farkas, & Maczuga 2013; Bussing, Zima, Gary, &
Garvan, 2003). Students were excluded from analyses if they attended a private school or a
school serving only special education students. Per stipulations required by the Institute of
Education Sciences when using restricted data, all reported sample and group sizes are rounded
to the nearest 10.
Variable Information
Outcome variable. The outcome measure assessed in these analyses was a binary
indicator of whether the student was receiving special education services. School office staff
were asked to indicate whether each student had an IEP on file in the spring of Kindergarten, 1st,
3rd, 5th, and 8th grade. If students did not have an IEP on file, they were considered to be in

68
general education.
Individual-Level Predictors. Child demographics. There are several child-level
predictors commonly utilized in studies assessing likelihood of special education placement.
First, boys are 2 to 3 times more likely to be in special education as girls (Hibel, Farkas, &
Morgan, 2010; Katusic, Colligan, Barbaresi, Schaid, & Jacobsen, 2001; Morgan, Farkas,
Hillemeier, & Maczuga, 2012). Parent-reported disability status is also a strong indicator of
whether a student needs special education services throughout K-8 schooling, though, Marder
(2009) notes that parents are likely to over-report medical diagnoses and under-report the
educationally-relevant disabilities necessitating special education services, such as learning
disabilities. Much research also demonstrates differential likelihoods of special education service
receipt as a function of race/ethnicity, with more recent best-evidence research indicating that
non-white race/ethnicity conveys decreased likelihood of special education service receipt (e.g.,
Morgan et al., 2015b, 2016, 2017). Lastly, low birthweight status has been linked to cognitive
development deficits, which could in turn produce learning difficulties once a child reaches
Kindergarten (Morgan et al., 2015a; Grunau, Whitfield, & Davis, 2002).
Parenting and the home environment. It is important to model indicators of
socioeconomic and sociodemographic risk factors given the rich body of literature demonstrating
strong links between these risks and likelihood of disability identification (Blackburn et al.,
2013; Bussing, Zima, Gary, & Garvan, 2003; Costello et al., 1996; Emerson et al., 2011; Morgan
et al., 2014). Studies incorporating indicators of family risk typically include covariates such as
maternal education, single parent status, and household income or poverty status (e.g. Herbers,
Reynolds, & Chen 2013; Morgan, Farkas, Hillemeier, & Maczuga, 2012). In addition, ELL
students are less likely to receive special education services initially but more likely to receive

69
services later in schooling (Artiles et al., 2002; Samson & Lesaux, 2009).
In addition to these variables, educational expectations, cognitive stimulation in the home
environment, and parent-child interactions likely also influence special education placement. For
instance, Davis-Kean (2005) demonstrated that socioeconomic status (parents' education and
family income) influences academic achievement indirectly by operating through parental
expectations and behaviors and the structure of the home environment. Yet, socioeconomic
status is often used in research assessing the likelihood of special education placement at the
expense of measures more directly influencing educational attainment. Given the argument that
it is poorer practice to use proximal predictors when more direct measures are available (e.g.,
because proxies may produce differing effects on association than direct measures; Schisterman,
Cole, & Platt, 2009), three variables capturing parenting quality and behaviors, educational
expectations, and cognitive stimulation in the home environment were created from the rich
array of information available in the ECLS-K. Moreover, as variations on these constructs were
available at each wave of data collection, several questions developmentally appropriate to each
wave of data collection were summed or averaged together and standardized in successive stages
to produce time-varying predictors. Information about the specific variables used at each wave of
data collection to create these constructs is available in Appendix A.
Achievement and behavior. Measures of academic achievement are the greatest
predictors of special education placement, such that young children with greater early reading
and/or mathematics skills are less likely to receive early intervention services (Hibel, Farkas, &
Morgan, 2010; Hosp & Reschly, 2004; Morgan et al., 2012; Sullivan & Bal, 2013). Inappropriate
behaviors are considered especially problematic in a school setting, and often go hand-in-hand
with academic ability (Briesch, Ferguson, Volpe, & Briesch, 2012; Morgan, Farkas, & Wu,

70
2009; Lin, Morgan, Farkas, Hillemeier, & Cook, 2013; Morgan, Farkas, Tufis, & Sperling,
2008). Moreover, teachers often refer students who stand apart from peers academically and/or
behaviorally (Peterson et al., 2011).
Academic achievement variables assessing reading and mathematical prowess were
measured in the spring of each wave using Item Response Theory (IRT), in which patterns of
correct and incorrect responses were used to algorithmically tailor testing to the child's ability at
each grade level. To reduce multicollinearity in the model, IRT-adjusted reading and math scores
at each wave were averaged together to create one general academic achievement score. In
addition, teacher-reported behavioral ratings assessing positive learning-related behaviors
("Approaches to Learning"), internalizing problem behaviors, and externalizing problem
behaviors were available at K, 1, 3, and 5. Because these variables were not available at the 8th
grade wave, they were imputed at 8th grade from the 5th grade variables in order to model the
longitudinal influence of behavior.
School-level predictors. School environment and resources. To capture students'
schooling environments and available resources, several principal-reported variables were
included in analyses based on prior research and theory. First, urban schools face a host of
challenges, including the stigmatization of city students (who are often students of color),
funding shortfalls, city bureaucracies, and general lack of support (Alston, 2002; Ayers, 1994),
which has led some to argue that students with disabilities in these schools are disproportionately
negatively affected (Blanchett, Mumford, & Beachum, 2005). Moreover, certain characteristics
of low-income neighborhoods (i.e., concentrated disadvantage) have been proposed to increase
risk for disability identification (Forness et al., 2012; Jenson, 2007; Xue, Leventhal, Brooks-
Gunn, and Earls, 2005). The size of a school (as measured by the number of students enrolled)

71
may also influence special education services. For example, compared to larger districts, the
special education budget in small districts can be drained by students with high cost/low
incidence disabilities (Dhuey & Lipscomb, 2013), which could lead to downgraded services due
to financial instability.
Several variables were included or created to model school environments and
demographics. First, school neighborhood safety was computed by summing 5 principal-reported
items about the neighborhood in which the school was located: whether there were problems
with substance abuse, gangs, tension from differences, vacant buildings, and crime in the area
(for each item, 1 = no problem, 2 = somewhat of a problem, 3 = big problem; resulting
composite scores ranged from 5-15, which were then standardized to have a sample mean of 0
and standard deviation of 1). To ascertain the general financial climate and resources of the
school, a Kindergarten variable capturing starting teacher salary (ranging from less than $25,000
to more than $60,000) and a time-varying indicator of whether the school received schoolwide
funding from Title I were included in analyses. Title I funds are distributed by the state to
schools serving high percentages of low-income students to improve the academic performance
of educationally needy children, particularly those at risk of school failure (Gordon, 2004).
Schoolwide demographics, behavior, and achievement. Finally, student-body
characteristics were included in analyses to test cross-level interactions between individual
characteristics and school characteristics. These school characteristics included a principal report
of the schoolwide percent of students receiving free lunch (a proxy for economically
disadvantaged students), the proportion of the student body reporting a non-White race/ethnicity,
the proportion of ELL students attending the school, and the average number of students with
disabilities per classroom (aggregated within the school from teacher reports).

72
In line with the frog pond effect, students with academic or behavioral issues may not
stand out in schools with higher proportions of academic and behavioral issues across the student
body. To assess this theory, variables assessing the average proportion of students performing at
or above statewide proficiency levels (as reported by the school principal) were modeled at the
school level. The percent of students proficient in reading and mathematics were again averaged
together to reduce multicollinearity in the models. In addition, variables measuring average
behavior were computed by aggregating individual reports of positive learning behaviors,
internalizing problem behaviors, and externalizing problem behaviors within each school.
Variable descriptions for all individual- and school-level predictors, along with descriptive
statistics for the analytical samples, may be found in Table III.7. Partial and zero-order
correlations are available in Appendix B.
Missing Data
Percentages of missing data for each variable at each wave are available in Table III.8.
Two variables were missing no data (male and urban), while the variable missing the highest
proportion of data was the eighth-grade principal-reported proportion of students at or above
academic proficiency (51.27 percent missing). The average percent of missing data was 5.96 in
Kindergarten, 9.50 in first grade, 10.56 in third grade, 6.90 in fifth grade, and 11.92 in eighth
grade. Variables with the most missing data tended to come from items drawn from the
administrator survey, and/or from the eighth-grade year.
Including predictors in the imputation model that may be related to the missingness
mechanism may lead to a reasonable assumption of data that are missing at random (MAR;
Allison, 2012). Given the rich nature of the ECLS-K, this MAR assumption was considered
satisfied by including in the imputation model all demographic, achievement, and behavioral

73
variables used in the main analyses (see White, Royston, & Wood, 2011). Data were imputed
using Stata's mi impute chained command. Though historically m = 3 to 5 datasets have been
considered sufficient in the social sciences, more recent estimates indicate that setting m too low
may increase standard errors and decrease precision (Spratt et al., 2010; Graham et al., 2007).
Thus, m = 40 datasets were imputed. All continuous variables were imputed using predictive
mean matching to the 10 nearest neighbors (Little, 1988); binary variables imputed using logistic
regression; and categorical variables imputed using multinomial logistic regression. The author
may be contacted for more detailed information about the imputation models.
Analytical Plan and Methodology
Logistic regression estimates the extent to which dichotomous outcome variables relate to
categorical and continuous predictor variables (Peng, Lee, & Ingersoll, 2002). Multilevel logistic
regression accounts for the clustering of children within schools, which in turn provides more
accurate estimates of within- and between-school effects (Raudenbush & Bryk, 2002). This study
utilized a three-level logistic regression, modeling within-student random effects (or, how effects
change for each person over time), student-level fixed effects within schools, and between-
school fixed effects. Allowing the effect of time to vary between students lets analyses account
for students who follow different trajectories of special education. Given the longitudinal nature
of these data along with their hierarchical, nested structure, this analytical approach allows for
examination of how the likelihood of special education placement changes from Kindergarten
through eighth grade. Moreover, this method enables testing of cross-level effects to understand
the relative contributions of school-level data to specific individual data.
Data were analyzed in four separate models, each of which were three-level fixed-effects
hierarchical generalized linear growth models (with the random effect of grade included at the

74
individual level). Level 1 measured time, corresponding to each wave of data collection; level 2
measured individual-level characteristics contributing to special education placement; and level 3
measured school-level characteristics that could impact placement. Model equations at each level
are as follows:
Level 1: Pr(𝑆𝑃𝐸𝐷𝑖𝑗𝑘 = 1|𝛽𝑗𝑘) = 𝜙𝑖𝑗𝑘
log[𝜙𝑖𝑗𝑘
1−𝜙𝑖𝑗𝑘] = 𝜂𝑖𝑗𝑘
𝜂𝑖𝑗𝑘 = 𝜋0𝑗𝑘 + 𝜋1𝑗𝑘(𝐺𝑅𝐴𝐷𝐸𝑖𝑗𝑘),
where SPED corresponds to one of three outcome variables (described below),
and GRADE corresponds to each of the five timepoints;
Level 2: 𝜋0𝑗𝑘 = 𝛽00𝑘 + 𝛽01𝑘(𝐷𝐸𝑀𝑂𝑖𝑗𝑘) + 𝛽02𝑘(𝐻𝑂𝑀𝐸𝑖𝑗𝑘) +𝛽03𝑘(𝐴𝐶𝐻𝑖𝑗𝑘)
𝜋1𝑗𝑘 = 𝛽10𝑘 + 𝛽11𝑘(𝐷𝐸𝑀𝑂𝑖𝑗𝑘) + 𝛽12𝑘(𝐻𝑂𝑀𝐸𝑖𝑗𝑘) +𝛽13𝑘(𝐴𝐶𝐻𝑖𝑗𝑘)
where DEMO is a vector capturing demographic characteristics about the child
and home environment; HOME is a vector capturing information about parenting
and the home environment, and ACH is a vector capturing academic performance
and teacher-reported behaviors;
Level 3: 𝛽00𝑘 = 𝛾000 + 𝛾001 (𝑆𝐷𝐸𝑀𝑖𝑗𝑘) + 𝛾002 (𝑆𝑅𝐸𝑆𝑖𝑗𝑘) + 𝛾003 (𝑆𝐴𝐶𝐻𝑖𝑗𝑘) + 𝑢00𝑘
…
𝛽13𝑘 =𝛾130 + 𝛾131 (𝑆𝐷𝐸𝑀𝑖𝑗𝑘) + 𝛾132 (𝑆𝑅𝐸𝑆𝑖𝑗𝑘) + 𝛾133 (𝑆𝐴𝐶𝐻𝑖𝑗𝑘) + 𝑢13𝑘
where SDEM corresponds to school-level demographic and environmental
characteristics, SRES corresponds to school-level resources and staff, and SACH
represents schoolwide achievement and behavioral characteristics that impact
likelihood of special education service receipt.

75
The final model was constructed in a forward stepwise fashion. Model 1 tested only
individual-level effects, both initially and over time. Model 2 tested only school-level effects,
both initially and over time. Model 3 tested both individual and school effects initially and over
time, but no cross-level interactions with individual*school. Model 4 tested the full model with
both individual and school effects (initial status, time*individual, individual*school), and
included cross-level interactions between individual- and school-level predictors to test the frog
pond effect.
Results
Results are reported as a progression of nested models to illustrate how predictors at the
individual and school levels interact to influence special education placement. Reported
alongside results are indicators of model fit (Akaike Information Criterion [AIC] and Bayesian
Information Criterion [BIC]) and the intraclass correlation (ICC). The ICC is a measure of the
fraction of total variation in the data that is accounted for by between-school and between-person
variation. It can be interpreted as an indication of how similar students in each school are to one
another, and how much they systematically differ from students in another school. The ICC
ranges from 0 (meaning that all variability lies within groups) to 1 (meaning that all variability
lies between groups and students within groups are essentially the same); an exceptionally large
ICC is considered to be around .5 (Musca et al., 2011). Two ICC's are reported: between-school
(School ICC) and between-person within schools (Child>School ICC). Results are reported as
odds ratios (OR), where an OR of 1.00 indicates that students are no more or less likely to have
an IEP than their peers.
Analysis 1: Who is Placed in Special Education at the Transition to School and Over Time?
The first set of analyses compared special and general education students to ascertain

76
who was most likely to receive special education services both during Kindergarten and through
8th grade (Table III.3). Analyses included a large number of individual and school predictors
known to be associated with special education placement or disability identification. The
contributions of each level were assessed through four successive models, with individual
predictors hypothesized to be more impactful than school predictors. In Model 4, the contextual
effect of schooling interacted with individual characteristics was tested as an extension to the
frog pond effect. It was expected that individual academic performance, behavior, and
race/ethnicity would be differentially influenced by schooling compositions.
Model 1: Individual-level predictors only. The first model utilized only individual-
level predictors (modeled at level 2) to assess the probability of receiving services during the
first year of school and over time. The intercept corresponds to spring of Kindergarten, the first
time point at which special education status was recorded. Results indicate that male
Kindergartners were 4 times more likely to have an IEP in Kindergarten than females;
Kindergartners whose parents reported a disability were 5 times more likely to have an IEP; and
Kindergartners who performed better academically were slightly less likely (2%) to have an IEP
(OR = .98). Next, the intercept for time was modeled at level 1, and indicates that students were
9.67 times more likely to be placed with each passing grade. Students whose mothers were more
educated were more likely to have an IEP over time (OR = 1.09), and students with better
academic achievement were 1% less likely to have an IEP over time (OR = .99). Model fit
information indicates that 34% of the variance in IEP status occurred between schools and 77%
occurred between individuals within each school.
Model 2: School-level predictors only. Next, the influence of school-level predictors
(modeled at level 3) was included in analyses without modeling individual-level predictors. This

77
step was important to model given that much previous research investigating special education
service receipt used only school-level variables, as well as to evaluate how including both
individual and school predictors in Model 3 would change estimates obtained from only school
predictors in Model 2. Students who attended a school with more students with disabilities per
classroom were 23% more likely to have an IEP in Kindergarten. At the slope, the overall effect
of time did not attain statistical significance in this model and most predictors did not influence
change in likelihood of experiencing special education over time. However, attending a larger
school decreased the odds of having an IEP over time by 12%. Model fit information indicates
that with only school-level predictors included, this model fit the data significantly worse than
when only individual-level predictors were modeled (∆AIC=2,139 and ∆BIC=2,075). 36% of the
variability in IEP status occurred between schools, while 85% of the variability in IEP status was
due to between-person differences within schools.
Model 3: Individual and school predictors. In the third model, both individual and
school predictors were analyzed together (though no interactions were included). Results were
similar to those obtained from Model 1 and Model 2 in that males, students with a disability, and
lower-achieving students were most likely to have an IEP in Kindergarten. In addition, this
model revealed evidence for a frog pond effect in urban schools and in schools with more
students with disabilities, as students attending non-urban schools and schools with a higher
number of students with disabilities in each classroom were again more likely to have an IEP in
Kindergarten.
The factors predicting change in likelihood of having an IEP over time were also similar
to Model 1, but the inclusion of both individual- and school-level variables revealed that students
whose teachers reported more positive learning-related behaviors were also significantly less

78
likely to receive an IEP over time (OR = .85). Though students attending a larger school were
less likely to have an IEP over time in Model 2, including individual-level predictors rendered all
school-level predictors non-significant at the slope. Model fit information indicated that this
model fit the data better than either Model 1 (∆AIC = -423 and ∆BIC = -223) or Model 2 (∆AIC
= -2,563 and ∆BIC = -2,298). Though the variance coefficients were largely similar to Model 1,
this model explained 34% of the variance in the school-level intercept and 35% of the variance in
the individual-level intercept over Model 2. The ICC's were most similar to Model 1, with 33%
and 78% of the variability in IEP status occurring between and within schools, respectively.
Model 4: Full model with cross-level interactions. In the fourth and final model, an
extension to frog pond effect was assessed by interacting individual-level achievement,
race/ethnicity, and behavior with their corresponding school-level counterparts. To improve
model parsimony and reduce degrees of freedom, several non-significant terms in Model 3 were
dropped in Model 4 (e.g., the Level 1 by Level 3 interactions, or change in school-level variables
over time). Further analyses not reported here indicated that the exclusion of these terms did not
influence the estimates of other variables.
Including cross-level interaction terms did not change the significant individual-level
estimates reported at either the intercept or slope in Model 3. However, at the school level,
attending an urban school ceased to be a statistically significant predictor of special education
status, while attending a school with a higher proportion of students performing above academic
proficiency on statewide testing did attain statistical significance at the p < .05 level (OR = .98).
Attending schools with a higher classroom numbers of students with disabilities continued to be
a strong predictor of individual special education status (OR = 1.30). However, there was no
significant evidence for a differential effect of schooling context on certain individuals, whether

79
that be student race/ethnicities interacting with schoolwide proportions of non-White students or
students receiving free lunch; individual academic performance interacting with schoolwide
proportions of proficient students; or individual behaviors interacting with schoolwide
aggregates of student behaviors. Moreover, this model appeared to fit similarly to Model 3
(though, slightly worse: ∆AIC = -64 and ∆BIC = -40), again indicating little evidence for
differential individual likelihoods of placement as a function of schoolwide characteristics.
Analysis 2: Among Special Education Students, What Predicts Earlier or Later Service
Receipt?
The second set of analyses was conducted on a sample of students who received special
education services at some time K-8, as indicated by the presence of an IEP on file during at
least one wave of data collection (Table III.4). By utilizing this sample, significant predictors at
the intercept correspond to students who received special education services early in schooling
(i.e., Kindergarten), while significant predictors at the slope correspond to the factors influencing
change over time in IEP status (or, which students were more likely to receive services later). By
analyzing this sample, we remove the endogeneity problem of comparing two incomparable
groups: one having a disability requiring special education intervention, and the other students
who remain in general education throughout schooling. Thus, we are better able to understand
which factors predict initial service receipt and which predict later special education placement
among a sample of students who require at least some special education intervention.
Model 1: Individual-level predictors only. Similar to Analysis 1, the first model in
Analysis 2 included predictors at only the individual level. Male sex, parent-reported disability,
and poorer academic performance again increased likelihood of having an IEP in Kindergarten,
as was the case in Analysis 1. However, in this sample, students with a single parent were also

80
1.5 times more likely than students from two-parent households to receive special education
services at Kindergarten. The ICC’s were lower in these analyses compared to Analysis 1,
indicating that less of the variability in IEP status was explained by differences between schools
(30%) and differences between individuals within schools (61%) when modeling the same
predictors in a sample of only special education students. Thus, there may be other important
predictors of earlier vs. later special education service receipt that are not included here.
Model 2: School-level predictors only. The second model again analyzed predictors at
only the school level in order to understand their contributions to individual probabilities of
special education service receipt prior to combining both individual and school factors in Model
3. Like in Analysis 1, students attending urban schools were 80% less likely (OR = .20) to have
an IEP during Kindergarten, while students attending schools with higher numbers of children
with disabilities per classroom were 1.2 times more likely to have an IEP during Kindergarten.
Students who attended larger schools (as indicated by the number of enrolled students) were also
11% less likely (OR = .89) to receive an IEP over time. The ICC's were similar to Model 1, with
32% of the variability in IEP status occurring between schools and 63% occurring between
individuals within schools.
Model 3: Individual and school predictors. Modeling individual and school level
predictors together resulted in similar outcomes as modeling each level separately, though some
terms ceased to be significantly predictive of special education status. Among students who
experienced some special education between grades K-8, students who received services in
Kindergarten were again 4 times more likely to have a parent-reported disability. However, after
modeling school predictors alongside individual predictors, male sex and single parent status
ceased to be significantly related to special education service receipt during Kindergarten.

81
Attending an urban school decreased a student’s likelihood of service receipt by 82% in
Kindergarten and attending a school with a higher number of students with disabilities per
classroom increased likelihood of Kindergarten placement by 24%. Over time, students with
better academic achievement were again less likely to have an IEP (OR = .99) and students with
more educated mothers were more likely to have an IEP (OR = 1.06). In addition, although
school size ceased to significantly predict longitudinal change in IEP status, students attending
an urban school were 17% more likely to have an IEP through 8th grade. Coupled with the
significant urban term at the intercept, this last result indicates that students attending an urban
school are less likely to be identified during Kindergarten but increasingly likely to be identified
as time progresses.
Model fit information again indicated that modeling individual and school level
predictors together fit the data better than modeling each level separately (∆AIC = -1279, ∆BIC
= -1119). Relative to Models 1 and 2, respectively, this model explained 28% and 36% of the
variance in the school-level intercepts, 2% and 14% of the variance in the child-level intercepts,
and 14% and 22% of the variance in the child-level slopes.
Model 4: Full model with cross-level interactions. Like in analysis 1, the same non-
significant terms in Model 3 were dropped from Model 4. Results are largely identical to those
obtained in Model 3. At the intercept, Kindergarteners with a disability were 4 times more likely
to have an IEP, higher-achieving Kindergartners were 2% less likely to have an IEP, and
Kindergartners attending a school with more children with disabilities were 1.2 times more likely
to have an IEP. Including cross-level interactions reduced the urban term to non-significance,
indicating that the lowered likelihoods of service receipt among urban students may be more
related to schoolwide proportions of non-White students, students receiving free lunch, and

82
compositions of behavior and/or achievement. The only significant predictors of change in IEP
status over time were again higher maternal education (OR = 1.07) and lower academic
achievement (OR = .99). Though slightly worse, model fit does not appear significantly different
than for Model 3 (∆AIC = 90, ∆BIC = 69), and the ICC's mirror those obtained in both Models 1
and 3.
Discussion
Although scientists have long debated who is placed in special education, there have been
three major issues with existing research that limits our ability to answer this question. First,
failing to model special education placement in a multilevel format controlling for both the
individual- and school-level predictors that influence identification has led to tenuous
assumptions. Second, it is important to model how a student's likelihood of receiving special
education services changes over time given developmental considerations that impact children's
academic and behavioral needs at various timepoints. Not only can this potentially clarify
educational policy tied to special education service provisions, but it may aid researchers in
model building and covariate selection depending on the age and developmental timeframe of
their samples. Third and finally, researchers who have cited evidence for a "frog pond effect" of
special education placement, in which an individual's likelihood of receiving services is
dependent on extant school characteristics, have not modeled cross-level interactions within
clustered data. The present study is an attempt to rectify these issues and to replicate previous
work assessing which students receive special education services over time.
The first aim of this study was to decompose the contributions of individual data to
school-level data in predicting IEP status. Consistent with hypotheses, sets of individual-level
variables were more predictive than sets of school-level variables in all analyses, though the best

83
fitting models included both levels. This aligns with prior studies finding that certain individual
predictors had the strongest relation to special education identification even while also modeling
school-level data (e.g., Hibel, Farkas, & Morgan, 2010; Oswald, Coutinho, & Best, 2002;
Sullivan & Bal, 2013). Therefore, researchers or policymakers trying to predict which students
receive special education services should not analyze aggregated data alone. Additionally,
though most of the variability in who had an IEP was explained at the individual level
(particularly in Analysis 1), roughly 30% was also explained by one's school. These same
estimates for Analysis 2 were lower, such that about a quarter of variability in IEP status was
explained by differences between schools and just over half explained by differences between
individuals within schools. Thus, the variables modeled here may do more to differentiate
general education students from special education students but do less to explain why certain
students receive services earlier or later in schooling. Lastly, school-level variables in Analysis 1
(general vs. special education) did not decrease or change the significance of individual
predictors, though they did improve model fit. However, in Analysis 2 (early vs. later special
education), the inclusion of school-level variables reduced the male sex and single parent terms
to non-significance. This implies that research assessing the timing of service receipt among
special education students may overstate the predictive power of being male or having a single
parent if the schooling context is unaccounted for. Relatedly, the effect of attending a larger
school in both Analysis 1 and 2 was reduced to non-significance once both individual and school
predictors were modeled. Studies using only aggregate data may thus overstate the predictive
power of school size for early special education identification.
The second focus of this study was to explore what factors predicted initial IEP status as
opposed to change in IEP status over time, given developmental differences in educational needs

84
throughout schooling. Throughout all models and both analyses, parent report of disability status
was consistently the strongest predictor of Kindergarten special education service receipt,
highlighting the importance of ensuring that children are screened for disability early. Though
being diagnosed with a disability prior to school entry dramatically increases the likelihood of
receiving Kindergarten special education services (e.g., Weiland, 2016; Peterson et al., 2011),
having a parent-reported disability did not differentially influence the probability of receiving
services after Kindergarten. This speaks to an important distinction between disability and
special education. If a student's disability does not adversely affect educational performance, the
student is ineligible for special education even though they are protected from disability
discrimination through section 504 of the Americans with Disabilities Act. In her analysis of the
SEELS dataset, Marder (2009) noted that parents may be more likely to follow the medical
model of disability and report conditions that do not necessarily affect the child's education,
while teachers appear to focus predominantly on disabilities influencing schooling and may even
be unaware of medical impairments. In the present study, there were more students with parent-
reported disabilities in both analytical samples than students who receive special education
services (averaged across waves, 18% and 48% report a disability, while 10% and 36% receive
services in Analyses 1 and 2, respectively). Results indicate that students who enter Kindergarten
with parents reporting a disability are most likely to receive services during this transition to
school, perhaps because the disability was severe enough to be noticed early and/or to impair
academic performance. Thereafter, parent report of disability does not impact change in IEP
status over time.
The factors influencing change over time also reveal important information about who is
likely to receive services longitudinally. Over time, students were more likely to have an IEP if

85
they had more educated mothers and attended schools with higher numbers of students with
disabilities. Importantly, this may indicate that parents who are able to more effectively
communicate with schools and advocate for their child's needs are also more likely to have
services delivered to their children. In addition, more students with an IEP attended schools with
higher proportions of students with teacher-reported disabilities. Though some have
hypothesized that resources may become scarce in schools with large special education
populations, crowding out new referrals (Dhuey & Lipscomb, 2013), the present results suggest
otherwise. Alternatively, however, parents may be more proactively seeking out these schools
for their children in the hopes that services will be provided (c.f. Woods, Morrison, & Palincsar,
2017). This dynamic certainly warrants further study.
Lastly, though sex disparities in special education are commonly noted, there were no sex
differences in the change over time in the likelihood of service receipt, even though males were
consistently more likely to receive services in Kindergarten. Thus, one could hypothesize that the
relatively larger number of male students receiving special education services in the United
States may primarily occur during the first few years of schooling. There may be biological
differences in the manifestation of disability between males and females, particularly for
disabilities emerging early in development, a theory that is consistent with research
demonstrating sex differences in behavioral self-regulation early in elementary school (e.g.,
Matthews, Ponitz, & Morrison, 2009). However, this hypothesis failed to hold in the second set
of analyses assessing how early students with special educational needs receive services. Once
school-level variables were included in the model, males were not significantly more likely to
receive earlier services than females with special educational needs. In other words, although
males appear to be referred earlier within representative samples of both general and special

86
education students, being male does not uniquely predict receiving earlier services among
samples of special education students alone.
Third and finally, the last focus of this study was to expand upon the frog pond effect by
modeling cross-level interactions between individual characteristics and the schooling
environment. The school context did influence individual likelihoods of placement, such that
students attending urban schools had a lower probability of receiving early services, and students
attending schools with more students with disabilities per classroom had a higher probability of
receiving early services. However, contrary to hypotheses, this study did not replicate results
from Hibel and colleagues (2010). Students were not more likely to receive services if they
attended schools with better overall behavior, higher academic performance, and lower
proportions of non-White students. In eight models across two samples, there were no significant
cross-level interactions. Moreover, modeling interactions between individual and school level
predictors did not appear to substantively change fit from Model 3 in either analysis, though it
reduced the urban term to non-significance in Analysis 2. Thus, although the school context
explains between a quarter and a third of the variability in overall rates of identification, this
study suggests that schools do not appear to differentially influence placement according to
individual racial/ethnic background, achievement, or behavior. This is an important clarification
to the literature on the frog pond effect, which is often described in terms that are consistent with
these types of cross-level interactions (i.e., low-performing students do not appear to have a
higher likelihood of placement in high-performing schools; rather, more students may simply
receive services in higher-performing schools).
In addition to these three research aims, two separate analyses were conducted on
different samples to provide both a sensitivity analysis and to remove the problem of contrasting

87
students with and without disabilities. In Analysis 1, special education students were compared
to general education students (as is the norm in most research identifying who receives services).
In Analysis 2, only special education students were sampled, meaning that the intercept
corresponded to students receiving the earliest possible services while the slope corresponded to
students who were more likely to receive services later in schooling. The effect of parent-
reported disability, maternal education, number of students with disabilities per classroom, and
urban areas were consistently predictive across these two analyses. However, Analysis 2
revealed that the factors predicting how early students with special educational needs get
services are more strongly tied to the schooling context than to individual differences. Male sex,
single parent status, and to some degree, individual academic achievement ceased to have
predictive power once schooling variables were included. Instead, students in urban schools
appeared more likely to experience delayed service receipt, given the lower odds of placement at
the intercept (OR = .18) and the higher odds at the slope (OR = 1.17). This result in particular is
important for those concerned with educational inequities in urban schools and warrants closer
scrutiny. There may also be factors capturing schools' ability to put services in place during the
transition to school that were unmodeled here, but that contribute to the differences between
earlier and later service receipt (particularly given the relatively lower ICC's in Analysis 2).
There were several interesting departures from previous literature that emerged within
this study. One such example was the surprisingly weak effect of academic achievement. Male
sex, parent-reported disability, maternal education, and the number of students with disabilities
per classroom all had larger effect sizes than individual academic achievement. It is logical that
the effect of schoolwide academic performance would have a quite small or negligible impact on
students' likelihood of placement, but the effect of individual academic achievement was not

88
often much different from schoolwide achievement. In addition, lower-performing students were
no more or less likely to receive earlier services in Analysis 2 than higher-performing students.
Given prior assertions that academic achievement is one of the most important predictors to
model when identifying students for special education (Donovan & Cross, 2002; Hosp &
Reschly, 2004; Morgan et al., 2017), this result is somewhat puzzling.
Another departure from previous literature was the lack of significant differences in
placement by race/ethnicity. Though many studies have reported differential likelihoods of
placement among non-White students, here, non-White students were no more or less likely to
receive services at the transition to school, nor was race/ethnicity a significant predictor of
receiving services over time. Moreover, there was no evidence that the schooling context
differentially influenced students of varying racial/ethnic backgrounds. Perhaps this occurred
because these analyses accounted for longitudinal trajectories of special education rather than
only first identification, with "initial" service receipt occurring in Kindergarten. It is possible that
if the current study had specifically modeled an intercept occurring later, like third or fifth grade,
differences in placement by race/ethnicity may have been observed. However, this seems
unlikely, given the concurrent lack of significant differences in growth trajectories for students of
various race/ethnicities (i.e., non-White students were no more or less likely to receive services
over time than White students). The present study's results also somewhat align with Shifrer and
colleagues (2011), who noted that including sociodemographic information in a multilevel
framework entirely accounted for Black and Hispanic disproportionality. This ultimately led
them to recommend that researchers investigate disproportionality specifically through
multilevel modeling. Otherwise, the current results could differ from prior research finding
significant disproportionality among non-White students because studies either collapsed data

89
across ages and thus likely washed out longitudinal trends (Sullivan & Bal, 2013), failed to
include both individual and school level predictors (Parrish & Hikido, 1998; Oswald et al., 1998;
Skiba et al., 2005; Wiley et al., 2013), or analyzed data among older children (Hibel et al., 2010;
Shifrer et al., 2011).
Conclusion
Though early services are often presumed to improve outcomes (Bailey, Aytch, Odom,
Symons, & Wolery, 1999; Wolery & Bailey, 2002), more research has been called for to
investigate the relationship between early identification of risk, continued or later identification
of risk, and participation in special education services – particularly for those interested in
redesigning special education policy (Peterson et al., 2011). By modeling predictors of early
service receipt alongside predictors of change over time in a multilevel framework, the current
study is an important addition to the literature investigating who receives services, and when.
Specifically decomposing the effects of predictors at the individual and school levels allowed for
clarification regarding how the schooling context influences students at-risk for special education
identification and confirmed that researchers should account for clustering and/or analyze data
across multiple levels of influence. Moreover, analyzing data across two samples of students
further clarified how students who received earlier services differed from those who received
later services, which is important for both researchers and policymakers alike. For instance,
researchers addressing variation in outcomes as a function of when students received services
should be careful to account for early disability status, urbanicity, and the schoolwide proportion
of students with disabilities at the very least. Lastly, researchers and policymakers need not be
too concerned with schoolwide characteristics differentially influencing certain students over
others, even though schools account for about a third of the variability in who receives special

90
education services. Future research should more closely investigate how disability identification
influences special education service receipt during the transition to schooling. In particular,
policymakers should focus on how to improve early identification procedures in urban areas, and
on improving identification for children from families with less educated mothers who may
experience barriers to communicating with schools around service receipt.

91
References
Allison, P. D. (2012). Missing data. Thousand Oaks, CA: Sage.
Alston, J. A. (2002). Multi-leadership in urban schools: Shifting paradigms for administration
and supervision in the new millennium. University Press of America.
Altarac, M., & Saroha, E. (2007). Lifetime prevalence of learning disability among US
children. Pediatrics, 119(Supplement 1), S77-S83. Retrieved from
https://pdfs.semanticscholar.org/19de/849b1bfc1a038a264742df7c0dd55fbb756d.pdf
Aron, L., & Loprest, P. (2012). Disability and the education system. The Future of
Children, 22(1), 97-122. http://dx.doi.org/10.1353/foc.2012.0007
Artiles, A. J., Rueda, R., Salazar, J. J., & Higareda, I. (2002). English-language learner
representation in special education in California urban school districts. In D. J. Losen &
G. Orfield (Eds.), Racial Inequity in Special Education (pp. 117–136). Cambridge, MA:
Harvard Education Press.
Ayers, W. (1994). Can City Schools Be Saved? Educational Leadership, 51(8), 60-63. Retrieved
from https://eric.ed.gov/?id=EJ508270
Bailey, D. B., Aytch, L. S., Odom, S. L., Symons, F., & Wolery, M. (1999). Early intervention as
we know it. Developmental Disabilities Research Reviews, 5(1), 11-20.
http://dx.doi.org/10.1002/(SICI)1098-2779(1999)5:1%3C11::AID-
MRDD2%3E3.0.CO;2-U
Blackburn, C. M., Spencer, N. J., & Read, J. M. (2013). Is the onset of disabling chronic
conditions in later childhood associated with exposure to social disadvantage in earlier
childhood? A prospective cohort study using the ONS Longitudinal Study for England
and Wales. BMC pediatrics, 13(1), 101. http://dx.doi.org/10.1186/1471-2431-13-101

92
Blanchett, W. J., Mumford, V., & Beachum, F. (2005). Urban school failure and
disproportionality in a post-Brown era: Benign neglect of the constitutional rights of
students of color. Remedial and Special Education, 26(2), 70-81.
https://dx.doi.org/10.1177/07419325050260020201
Briesch, A. M., Ferguson, T. D., Volpe, R. J., & Briesch, J. M. (2013). Examining teachers’
perceptions of social-emotional and behavioral referral concerns. Remedial and Special
Education, 34(4), 249-256. https://dx.doi.org/10.1177/0741932512464579
Bussing, R., Zima, B. T., Gary, F. A., & Garvan, C. W. (2003). Barriers to detection, help-
seeking, and service use for children with ADHD symptoms. The Journal of Behavioral
Health Services & Research, 30(2), 176-189. http://dx.doi.org/10.1007/BF02289806
Chesmore, A. A., Ou, S. R., & Reynolds, A. J. (2016). Childhood placement in special education
and adult well-being. The Journal of Special Education, 50(2), 109-120.
http://dx.doi.org/10.1177/0022466915624413
Costello, E. J., Angold, A., Burns, B. J., Stangl, D. K., Tweed, D. L., Erkanli, A., & Worthman,
C. M. (1996). The Great Smoky Mountains Study of Youth: Goals, design, methods, and
the prevalence of DSM-III-R disorders. Archives of General Psychiatry, 53(12), 1129-
1136. https://dx.doi.org/10.1001/archpsyc.1996.01830120067012
Davis, J. A. (1966). The campus as a frog pond: An application of the theory of relative
deprivation to career decisions of college men. American Journal of Sociology, 72(1), 17-
31. http://dx.doi.org/10.1086/224257
Davis-Kean, P. E. (2005). The influence of parent education and family income on child
achievement: the indirect role of parental expectations and the home
environment. Journal of Family Psychology, 19(2), 294-304.

93
https://dx.doi.org/10.1037/0893-3200.19.2.294
Dhuey, E., & Lipscomb, S. (2013). Funding special education by total district enrollment:
Advantages, disadvantages, and policy considerations. Education Finance and
Policy, 8(3), 316-331. http://dx.doi.org/10.1162/EDFP_a_00098
Donovan, M. S., & Cross, C. T. (Eds.). (2002). Minority Students in Gifted and Special
Education. Washington, DC: National Academy Press.
Emerson, E., Einfeld, S., & Stancliffe, R. J. (2011). Predictors of the persistence of conduct
difficulties in children with cognitive delay. Journal of Child Psychology and
Psychiatry, 52(11), 1184-1194. https://dx.doi.org/10.1111/j.1469-7610.2011.02413.x
Ehrhardt, J., Huntington, N., Molino, J., & Barbaresi, W. (2013). Special education and later
academic achievement. Journal of Developmental & Behavioral Pediatrics, 34(2), 111-
119. http://dx.doi.org/10.1097/DBP.0b013e31827df53f
Farkas, G., Sheehan, D., & Grobe, R. P. (1990). Coursework mastery and school success:
Gender, ethnicity, and poverty groups within an urban school district. American
Educational Research Journal, 27(4), 807-827.
http://dx.doi.org/10.3102/00028312027004807
Forness, S. R., Freeman, S. F., Paparella, T., Kauffman, J. M., & Walker, H. M. (2012). Special
education implications of point and cumulative prevalence for children with emotional or
behavioral disorders. Journal of Emotional and Behavioral Disorders, 20(1), 4-18.
http://dx.doi.org/10.1177/1063426611401624
Gordon, N. (2004). Do federal grants boost school spending? Evidence from Title I. Journal of
Public Economics, 88(9-10), 1771-1792. http://dx.doi.org/10.1016/j.jpubeco.2003.09.002
Graham, J. W., Olchowski, A. E., & Gilreath, T. D. (2007). How many imputations are really

94
needed? Some practical clarifications of multiple imputation theory. Prevention
science, 8(3), 206-213. https://doi.org/10.1007/s11121-007-0070-9
Grunau, R. E., Whitfield, M. F., & Davis, C. (2002). Pattern of learning disabilities in children
with extremely low birth weight and broadly average intelligence. Archives of Pediatrics &
Adolescent Medicine, 156(6), 615-620. http://dx.doi.org/10.1001/archpedi.156.6.615
Hanushek, E. A., Kain, J. F., & Rivkin, S. G. (2002). Inferring Program Effects for Special
Populations: Does Special Education Raise Achievement for Students with Disabilities? The
Review of Economics and Statistics, 84(4), 584–599.
http://doi.org/10.1162/003465302760556431
Herbers, J. E., Reynolds, A. J., & Chen, C. C. (2013). School mobility and developmental
outcomes in young adulthood. Development and Psychopathology, 25(02), 501-515.
https://dx.doi.org/10.1017/S0954579412001204
Hibel, J., Farkas, G., & Morgan, P. L. (2010). Who is placed into special education? Sociology
of Education, 83(4), 312-332. https://dx.doi.org/10.1177/0038040710383518
Hosp, J. L., & Reschly, D. J. (2004). Disproportionate representation of minority students in
special education: Academic, demographic, and economic predictors. Exceptional
Children, 70(2), 185-199. https://dx.doi.org/10.1177/001440290407000204
Jenson, J. M. (2007). Neighborhood and community effects on individual behavior and social
functioning. Social Work Research, 31(4), 195-197.
http://dx.doi.org/10.1093/swr/31.4.195
Katusic, S. K., Colligan, R. C., Barbaresi, W. J., Schaid, D. J., & Jacobsen, S. J. (2001,
November). Incidence of reading disability in a population-based birth cohort, 1976–
1982, Rochester, Minn. In Mayo Clinic Proceedings (Vol. 76, No. 11, pp. 1081-1092).

95
Elsevier. https://dx.doi.org/10.4065/76.11.1081
Lin, Y., Morgan, P. L., Farkas, G., Hillemeier, M. M., & Cook, M. (2013). Reading,
Mathematics, and Behavioral Difficulties Interrelate: Evidence from a Cross-lagged
Panel Design and Population-based Sample. Behavioral Disorders, 38(4), 212–227.
http://doi.org/10.1002/nbm.3369.Three
Little, R. J. (1988). A test of missing completely at random for multivariate data with missing
values. Journal of the American Statistical Association, 83(404), 1198-1202.
http://dx.doi.org/10.1080/01621459.1988.10478722
Marder, C. (2009). Facts from SEELS: Perspectives on students’ primary disability
classifications. Washington, D.C.: U.S. Department of Education, Office of Special
Education Programs. Retrieved from
https://www.seels.net/info_reports/DisabilityClassif1.9.09.pdf
Matthews, J. S., Ponitz, C. C., & Morrison, F. J. (2009). Early gender differences in self-
regulation and academic achievement. Journal of Educational Psychology, 101, 689-704.
https://dx.doi.org/10.1037/a0014240
McElreath, R. (2017, August 24). Multilevel regression as default [Blog post]. Retrieved from
http://elevanth.org/blog/2017/08/24/multilevel-regression-as-default/
McLaughlin, M. J., & Owings, M. F. (1992). Relationships among states' fiscal and demographic
data and the implementation of P.L. 94-142. Exceptional Children, 59(3), 247-261.
http://dx.doi.org/10.1177/001440299305900308
Morgan, P. L., Farkas, G., Cook, M., Strassfeld, N. M., Hillemeier, M. M., Pun, W. H., &
Schussler, D. L. (2017). Are Black children disproportionately overrepresented in special
education? A best-evidence synthesis. Exceptional Children, 83(2), 181-198.

96
http://dx.doi.org/10.1177/0014402916664042
Morgan, P. L., Farkas, G., Hillemeier, M. M., Hammer, C. S., & Maczuga, S. (2015b). 24‐
month‐ old children with larger oral vocabularies display greater academic and
behavioral functioning at kindergarten entry. Child Development, 86(5), 1351-1370.
http://dx.doi.org/10.1111/cdev.12398
Morgan, P. L., Farkas, G., Hillemeier, M. M., & Maczuga, S. (2012). Are minority children
disproportionately represented in early intervention and early childhood special
education?. Educational Researcher, 41(9), 339-351.
https://dx.doi.org/10.3102/0013189X12459678
Morgan, P. L., Farkas, G., Hillemeier, M. M., Mattison, R., Maczuga, S., Li, H., & Cook, M.
(2015a). Minorities are disproportionately underrepresented in special education:
Longitudinal evidence across five disability conditions. Educational Researcher, 44(5),
278-292. https://dx.doi.org/10.3102/0013189X15591157
Morgan, P. L., Farkas, G., Tufis, P. A., & Sperling, R. A. (2008). Are reading and behavior
problems risk factors for each other? Journal of Learning Disabilities, 41(5), 417-436.
https://dx.doi.org/10.1177/0022219408321123
Morgan, P. L., Farkas, G., & Wu, Q. (2009). Five-year growth trajectories of kindergarten
children with learning difficulties in mathematics. Journal of Learning Disabilities, 42(4),
306–321. http://doi.org/10.1177/0022219408331037
Morgan, P. L., Hillemeier, M. M., Farkas, G., & Maczuga, S. (2014). Racial/ethnic disparities in
ADHD diagnosis by kindergarten entry. Journal of Child Psychology and
Psychiatry, 55(8), 905-913. http://dx.doi.org/10.1111/jcpp.12204
Morgan, P. L., Staff, J., Hillemeier, M. M., Farkas, G., & Maczuga, S. (2013). Racial and ethnic

97
disparities in ADHD diagnosis from kindergarten to eighth grade. Pediatrics, 132(1), 85-
93. http://dx.doi.org/10.1542/peds.2012-2390
Morrison, G. M., & Cosden, M. A. (1997). Risk, resilience, and adjustment of individuals with
learning disabilities. Learning Disability Quarterly, 20(1), 43-60.
http://dx.doi.org/10.2307/1511092
Musca, S. C., Kamiejski, R., Nugier, A., Méot, A., Er-Rafiy, A., & Brauer, M. (2011). Data with
hierarchical structure: Impact of intraclass correlation and sample size on type-I error.
Frontiers in Psychology, 2(74). https://dx.doi.org/10.3389/fpsyg.2011.00074
Oswald, D. P., Coutinho, M. J., & Best, A. M. (2002). Community and school predictors of
overrepresentation of minority children in special education. In D. J. Losen & G. Orfield
(Eds.), Racial Inequity in Special Education (pp. 1-13). Cambridge, MA: Harvard
Education Press
Oswald, D. P., Coutinho, M. J., Best, A. M., & Singh, N. N. (1999). Ethnic representation in
special education the influence of school-related economic and demographic
variables. The Journal of Special Education, 32(4), 194-206.
https://dx.doi.org/10.1177/002246699903200401
Parrish, T. B., Hikido, C. S., & Fowler, W. J., Jr. (1998). Inequalities in Public School District
Revenues. Washington, DC: National Center for Education Statistics, U.S. Department of
Education. Retrieved from https://files.eric.ed.gov/fulltext/ED423261.pdf
Peng, C. Y. J., Lee, K. L., & Ingersoll, G. M. (2002). An introduction to logistic regression
analysis and reporting. The Journal of Educational Research, 96(1), 3-14.
http://dx.doi.org/10.1080/00220670209598786
Peterson, C. A., Wall, S., Jeon, H. J., Swanson, M. E., Carta, J. J., Luze, G. J., & Eshbaugh, E.

98
(2011). Identification of disabilities and service receipt among preschool children living
in poverty. The Journal of Special Education, 47(1), 28-40.
https://dx.doi.org/10.1177/0022466911407073
Raudenbush, S. W., & Bryk, A. S. (2002). Hierarchical Linear Models: Applications and Data
Analysis Methods (Vol. 1). Thousand Oaks, CA: Sage.
Rutter, M. (Ed.). (1979). Protective Factors in Children's Responses to Stress and Disadvantage.
Hanover, NH: University Press of New England.
Samson, J. F., & Lesaux, N. K. (2009). Language-minority learners in special education: Rates
and predictors of identification for services. Journal of Learning Disabilities, 42(2), 148-
162. http://dx.doi.org/10.1177/0022219408326221
Schisterman, E. F., Cole, S. R., & Platt, R. W. (2009). Overadjustment bias and unnecessary
adjustment in epidemiologic studies. Epidemiology, 20(4), 488.
http://dx.doi.org/10.1097/EDE.0b013e3181a819a1
Shifrer, D., Muller, C., & Callahan, R. (2011). Disproportionality and learning disabilities:
Parsing apart race, socioeconomic status, and language. Journal of Learning Disabilities,
44, 246–257. https://dx.doi.org/10.1177 /0022219410374236
Skiba, R. J., Poloni-Staudinger, L., Simmons, A. B., Renae Feggins-Azziz, L., & Chung, C. G.
(2005). Unproven links: Can poverty explain ethnic disproportionality in special
education? The Journal of Special Education, 39(3), 130-144.
https://dx.doi.org/10.1177/00224669050390030101
Skiba, R. J., Simmons, A. B., Ritter, S., Gibb, A. C., Rausch, M. K., Cuadrado, J., & Chung, C.
G. (2008). Achieving equity in special education: History, status, and current
challenges. Exceptional Children, 74(3), 264-288.

99
http://dx.doi.org/10.1177/001440290807400301
Spratt, M., Carpenter, J., Sterne, J. A., Carlin, J. B., Heron, J., Henderson, J., & Tilling, K.
(2010). Strategies for multiple imputation in longitudinal studies. American Journal of
Epidemiology, 172(4), 478-487. http://dx.doi.org/10.1093/aje/kwq137
Sullivan, A. L., & Bal, A. (2013). Disproportionality in special education: Effects of individual
and school variables on disability risk. Exceptional Children, 79(4), 475-494.
https://dx.doi.org/10.1177/001440291307900406
Weiland, C. (2016). Impacts of the Boston prekindergarten program on the school readiness of
young children with special needs. Developmental Psychology, 52(11), 1763.
http://dx.doi.org/10.1037/dev0000168
White, I. R., Royston, P., & Wood, A. M. (2011). Multiple imputation using chained equations:
Issues and guidance for practice. Statistics in Medicine, 30(4), 377–399.
http://doi.org/10.1002/sim.4067
Wiley, A. L., Brigham, F. J., Kauffman, J. M., & Bogan, J. E. (2013). Disproportionate poverty,
conservatism, and the disproportionate identification of minority students with emotional
and behavioral disorders. Education and Treatment of Children, 36(4), 29-50.
http://dx.doi.org/10.1353/etc.2013.0033
Wiley, A., & Siperstein, G. N. (2011). Seeing red, feeling blue: The impact of state political
leaning on state identification rates for emotional disturbance. Behavioral Disorders,
36(3), 195-207. Retrieved from https://www.jstor.org/stable/43153537
Wolery, M., & Bailey Jr, D. B. (2002). Early childhood special education research. Journal of
Early Intervention, 25(2), 88-99. http://dx.doi.org/10.1177/105381510202500204
Woods, A. D., Morrison, F. J., & Palincsar, A. S. (2017). Perceptions of Communication

100
Practices Among Stakeholders in Special Education. Journal of Emotional and
Behavioral Disorders, 1063426617733716. http://dx.doi.org/10.1177/1063426617733716
Xue, Y., Leventhal, T., Brooks-Gunn, J., & Earls, F. J. (2005). Neighborhood residence and
mental health problems of 5-to 11-year-olds. Archives of General Psychiatry, 62(5), 554-
563. http://dx.doi.org/10.1001/archpsyc.62.5.554

101
Table III.1 Descriptive Information for Weighted Analytical Samples
Analysis 1
M (SD) or
%
Analysis 2
M (SD) or
%
Variable Description
Individual-Level
IEP 10.4 35.8 1=Individualized Education Plan on file (indicating special education status)
Grade 3.91 (2.86) 4.01 (2.84) 0.5=Spring K, 1.5=Spring 1st, 3.5=Spring 3rd, 5.5=Spring 5th, 8.5=Spring 8th
Male 50.0 61.1 1=Male Sex
Race/Ethnicity Student’s race/ethnicity:
Black 11.7 13.0 1=Non-Hispanic White, 2=Non-Hispanic Black, 3=Hispanic, 4=Asian
Hispanic 12.1 13.1
Asian 4.5 2.8
Low Birthweight 6.6 6.7 1=Born weighing less than 6 lbs.
Single Parent 24.7 27.7 1=Mother is single, separated, divorced, or widowed
No Regular
Childcare
25.9 26.7 1=Child did not attend regular childcare (including daycare and/or Head Start)
before Kindergarten
Non-English
Lang.
7.0 7.2 1=Non-English primarily spoken in the home
Disability 18.3 47.5 1=Parent reports a disability
Maternal Ed. 4.47 (1.73) 4.24 (1.75) Level of mother's education, ranging from 1 (8th grade education or less) to 9
(doctoral or professional degree)
Income 8.44 (3.04) 8.00 (3.18) Parent-reported household income, ranging from 1 (less than $5,000) to 13
(greater than $200,000)
Home Cognitive
Stimulation
.06 (.97) -.04 (.98) Standardized measure of cognitive stimulation in the home environment, ranging
from -3.3 to 3.0
Parenting
Quality
.01 (.97) .08 (.98) Standardized measure of high quality parent-child interactions, ranging from –
4.4 to 2.7
Educational
Expectations
3.98 (1.04) 3.79 (1.11) 1=Receive less than a high school diploma, 2=Graduate from high school,
3=Attend 2+ years of college, 4=Finish a 4- or 5-year college degree, 5=Earn a
master's degree or equivalent, 6=Finish a PhD, MD, or other advanced degree
App. to Learn 3.12 (.67) 2.89 (.70) Teacher-reported positive learning behaviors, scale ranging from 1-4

102
Externalizing 1.62 (.59) 1.73 (.65) Teacher-reported externalizing problems, scale ranging from 1-4
Internalizing 1.59 (.52) 1.72 (.57) Teacher-reported internalizing problems, scale ranging from 1-4
Achievement 96.25 (48.29) 90.25 (47.31) Average of IRT-adjusted spring reading score and spring math score, ranging
from 8.68 to 190.32
School-Level
Urban 10.2 28.9 1=Urban Area (Census Reported Population >250,000)
Neighborhood 1.15 (1.57) 1.15 (1.58) Standardized principal-reported measure of neighborhood quality and safety,
ranging from -0.9 to 1.9
% Free Lunch 29.83 (25.07) 31.48 (25.47) Principal-reported proportion of student body receiving free lunch, ranging from
0 to 100
Title I Funding 39.2 43.6 1=Principal reports that school receives schoolwide Title I Funding
% Non-White 2.40 (1.39) 2.38 (1.38) Principal-reported proportion of student body that reports a non-White
race/ethnicity, ranging from 1 (less than 10%) to 5 (75% or more)
% Limited
English
5.40 (11.96) 5.01 (11.80) Principal-reported proportion of student body that are English Language
Learners, ranging from 0 to 99
School Size 3.54 (1.04) 3.54 (1.03) Principal-reported number of children enrolled in school, ranging from 1 (149 or
less) to 5 (750 or more)
K Teacher Salary 3.65 (.91) 3.62 (.90) 1=Less than $25,000, 2=$25,000-$35,000, 3=$35,001-$45,000, 4=$45,001-
$60,000, 5=More than $60,000
% Academically
Proficient
65.13 (22.03) 64.26 (21.82) Averaged principal-reported proportion of school that scores at or above
proficiency in reading and math on statewide testing, ranging from X to Y
Avg. Approaches
to Learning
3.07 (.30) 3.03 (.31) Student-level positive learning behaviors, as rated by teachers and aggregated
across schools, ranging from 1.8 to 4
Avg.
Externalizing
1.65 (.27) 1.64 (.26) Student-level externalizing problems, as rated by teachers and aggregated across
schools, ranging from 1 to 2.5
Avg.
Internalizing
1.61 (.24) 1.64 (.26) Student-level IRT-adjusted internalizing problems, as rated by teachers and
aggregated across schools, ranging from 1 to 2.3
No. Disabilities/
Class
2.11 (1.64) 2.31 (1.83) Teacher-reported number of students with disabilities in their classroom,
aggregated across the school, ranging from 0 to 28 Note: descriptive statistics reported are averaged across waves.
Analysis 1: n = 5,037 students in 700 schools, avg. 32.8 students per school, average 4.6 waves per student
Analysis 2: n = 2,048 students in 563 schools, avg. 11.8 students per school, average 3.2 waves per student

103
Table III.2 Percent of Missing Data at Each Wave for Individual and
School-Level Predictors (Unweighted)
Kindergarten
1st
Grade
3rd
Grade
5th
Grade
8th
Grade
Individual-Level Predictors
IEP on file 19.32 17.52 13.84 16.72 0.00
Disability Status 4.08 4.54 6.15 3.39 10.39
Family Income 1.68 3.46 5.77 3.10 9.07
Single Parent 5.14 6.22 5.80 3.16 9.26
Home Cog. Stim. 4.30 5.23 8.94 5.82 12.10
Parent-Child Interactions 4.40 4.59 10.10 7.50 17.88
Educational Expectations 4.44 3.26 6.11 3.21 9.19
Approach to Learning 1.86 5.77 12.41 4.31 --
Externalizing Behavior 2.09 6.31 12.67 4.92 --
Internalizing Behavior 2.56 6.75 13.28 5.90 --
Avg. Achievement Score 3.43 1.33 1.10 0.64 1.10
Male Sex 0.00 -- -- -- --
Race/Ethnicity 0.15 -- -- -- --
Maternal Education 2.95 -- -- -- --
Low birthweight 6.85 -- -- -- --
No regular pre-K childcare 21.42 -- -- -- --
Non-English Home
Language
1.74 -- -- -- --
School-Level Predictors
Schoolwide Title I Funding 0.34 13.08 14.09 6.05 --
Neighborhood Quality 21.00 28.87 31.14 21.01 --
Free/Reduced Lunch 25.23 33.62 15.01 20.30 18.45
Minority Enrollment 1.11 1.49 1.33 0.82 1.24
Limited English Proficient 5.39 14.20 15.96 6.17 8.97
Total Enrollment 0.01 1.11 1.04 0.54 6.02
Avg. # Proficient Students 31.05 36.40 35.20 25.86 51.27
Avg. Approaches to
Learning
0.45 3.61 5.55 2.94 --
Avg. Externalizing
Behavior
0.45 3.62 5.58 3.04 --
Avg. Internalizing
Behavior
0.45 3.62 5.60 3.02 --
Avg. # Disabilities/Class 1.81 4.49 5.65 3.32 --
Urban Area 0.00 -- -- -- --
Average K Teacher Salary 5.04 -- -- -- --
Average % Missing 5.96 9.50 10.56 6.90 11.92

104
Table III.3 Full Results of Multilevel Logistic Regression Assessing Likelihood of Placement
Over Time (m = 40 Imputed Datasets).
Model 1 nchild = 5,108
nschool = 702
Model 2 nchild = 5,182
nschool = 701
Model 3 nchild = 5,037
nschool = 700
Model 4 nchild = 5,037
nschool = 700
OR OR OR OR
Intercepts
Level 1: Time
Grade 9.67*** 2.42 9.51** 10.53***
Level 2: Individual
Male 4.44*** 4.56*** 4.67***
Black .81 .68 .46
Hispanic .71 .80 .73
Asian .23 .19 .32
Disability 5.36*** 5.62*** 5.66***
Income .98 1.00 .98
Maternal Ed. .78 .81 .78
Cognitive Stimulation .89 .89 .87
Parenting Interactions .88 .87 .88
Educational Expectations .98 .99 1.01
Approaches to Learning 1.15 1.14 9.31
Externalizing Behaviors 1.31 1.15 .55
Internalizing Behaviors 1.47 1.60 1.42
Achievement .98*** .98*** .96***
Non-English Home Lang. 1.60 2.29 2.27
No Regular Childcare 1.00 .98 .97
Low Birthweight .88 .83 .82
Single Parent 1.15 1.06 1.08
Level 3: School
Urban .25 .18* .57
Neighborhood Safety .93 .92 1.01
% Free Lunch 1.00 1.00 1.00
Title I Funding .92 1.96 1.16
% Nonwhite 1.19 1.04 .91
% Limited English 1.01 1.01 1.00
School Size 1.28 1.20 .91
Kindergarten Teacher Salary 1.03 1.06 1.05
% Above Proficiency 1.00 .98 .98*
Avg. Learning .96 1.04 11.39
Avg. Externalizing .99 1.30 .33
Avg. Internalizing 2.16 .71 1.31
Avg. # Disabilities/Class 1.27** 1.26** 1.30***
Level 2 x Level 3
Black*Non-White % 1.05
Hispanic*Non-White % 1.22
Asian*Non-White % 1.07
App. Learn*Avg. Learn .48
Externalizing*Avg. Extern. 1.59

105
Achievement*Proficient % 1.00
Black*Free Lunch % 1.01
Hisp*Free Lunch % .99
Asian*Free Lunch % .97
Slopes
Level 1 x Level 2
Male*Grade 1.04 1.04 1.04
Black*Grade .87 .95 .89
Hisp*Grade .96 .97 .96
Asian*Grade 1.02 1.11 1.11
Disab*Grade 1.04 1.04 1.04
Income*Grade 1.00 1.00 1.00
Maternal Ed.*Grade 1.09** 1.07* 1.08**
Cog. Stim*Grade 1.05 1.05 1.05
Parenting*Grade .99 .99 .99
Expectations*Grade .98 .99 .98
Learning*Grade .89 .85* .87
Externalizing*Grade .90 .94 .91
Internalizing*Grade 1.02 .98 1.02
Achievement*Grade .99*** .99*** .99***
Language*Grade .95 .92 .92
Level 1 x Level 3
Urban*Grade 1.08 1.16
Neighborhood*Grade 1.01 1.03
Title I*Grade 1.01 .92
% Non-White*Grade .97 .97
% Free Lunch*Grade .99 1.00
% Limited Eng.*Grade 1.00 1.00
Size*Grade .88*** .93
% Proficient*Grade 1.00 1.00
Avg. Learn*Grade .89 1.13
Avg. Extern*Grade .98 .91
Avg. Intern*Grade .97 1.14
Avg. Disabilities*Grade 1.01 1.00
Random Effects
School
Var(Intercept) (SE) 4.78 (.92) 7.29 (1.53) 4.80 (.91) 4.81 (.92)
Child>School
Var(Slope) (SE) .32 (.09) .25 (.09) .30 (.09) .32 (.09)
Var(Intercept) (SE) 5.77 (1.81) 9.09 (3.63) 5.91 (1.84) 5.92 (1.81)
Covar(Slope, Intercept) -.62 (.25)* -.10 (.28) -.61 (.25)* -.64 (.25)**
Model Fit
School ICC .34 .36 .33 .33
Child>School ICC .77 .85 .78 .77
AIC 13961.18 16100.49 13537.77 13601.68
BIC 14275.30 16350.37 14052.45 14092.24 ***p < .001, **p < .01, *p < .05

106
Table III.4 Full Results of HGLM Among Students Who Receive At Least One Wave of Special
Education Services (m = 40 Imputed Datasets)
Model 1 nchild = 2,396
nschool = 598
Model 2 nchild = 2,535
nschool = 594
Model 3 nchild = 2,059
nschool = 566
Model 4 nchild = 2,059
nschool = 566
OR OR OR OR
Intercepts
Level 1: Time
Grade 5.59*** 1.90 4.06 4.32***
Level 2: Individual
Male 2.13* 1.69 1.70
Black .83 .79 .42
Hispanic .97 1.16 1.36
Asian .58 .75 .63
Disability 4.19*** 4.18*** 3.86***
Income .99 1.01 1.01
Maternal Ed. .83 .89 .85
Cognitive Stimulation .88 .88 .87
Parenting Interactions .88 .90 .88
Educational Expectations 1.03 1.10 1.08
Approaches to Learning 1.32 1.45 8.40
Externalizing Behaviors 1.34 1.15 .97
Internalizing Behaviors 1.45 1.49 1.14
Achievement .99 .99 .98*
Non-English Home Lang. 1.01 1.40 1.28
No Regular Childcare .95 1.00 .98
Low Birthweight .87 .94 .94
Single Parent 1.51* 1.22 1.20
Level 3: School
Urban .20* .18** .74
Neighborhood Safety .91 .95 1.08
% Free Lunch 1.00 .99 .99
Title I Funding 1.09 1.80 1.10
% Nonwhite 1.12 1.00 .89
% Limited English 1.03 1.02 1.00
School Size 1.28 1.20 .92
Kinder. Teacher Salary .86 .92 .92
% Above Proficiency .99 .99 .98
Avg. Learning .87 .68 5.56
Avg. Externalizing .76 1.09 .63
Avg. Internalizing 1.63 .62 1.11
Avg. # Disabilities/Class 1.23* 1.24** 1.19***
Level 2 x Level 3
Black*Non-White % 1.08
Hispanic*Non-White % 1.13
Asian*Non-White % 1.45
App. Learn*Avg. Learn .54
Extern.*Avg. Extern. 1.14

107
Achievement*Proficient % 1.00
Black*Free Lunch % 1.01
Hisp*Free Lunch % .99
Asian*Free Lunch % .97
Slopes
Level 1 x Level 2
Male*Grade 1.03 1.02 1.02
Black*Grade .92 .97 .92
Hisp*Grade .93 .92 .89
Asian*Grade .97 .98 1.0
Disab*Grade 1.03 1.01 1.01
Income*Grade 1.00 .99 .99
Maternal Ed.*Grade 1.07** 1.06* 1.07*
Cog. Stim*Grade 1.05 1.04 1.05
Parenting*Grade 1.00 1.00 1.00
Expectations*Grade .98 .98 .99
Learning*Grade .92 .92 .93
Externalizing*Grade .92 .99 .96
Internalizing*Grade 1.03 1.01 1.08
Achievement*Grade .99*** .99*** .99***
Language*Grade .95 .92 .91
Level 1 x Level 3
Urban*Grade 1.11 1.17*
Neighborhood*Grade 1.03 1.03
Title I*Grade .99 .93
% Non-White*Grade .97 .98
% Free Lunch*Grade 1.00 1.00
% Limited Eng.*Grade .99 1.00
Size*Grade .89** .94
% Proficient*Grade 1.00 1.00
Avg. Learn*Grade .96 1.13
Avg. Extern*Grade 1.07 .91
Avg. Intern*Grade .97 1.14
Avg. Disabilities*Grade 1.00 .99
Random Effects
School
Var(Intercept) (SE) 2.75 (.53) 3.08 (.57) 1.97 (.34) 1.97 (.36)
Child>School
Var(Slope) (SE) .21 (.06) .23 (.07) .18 (.04) .22 (.05)
Var(Intercept) (SE) 2.44 (.91) 2.80 (.94) 2.40 (.70) 2.29 (.75)
Covar(Slope, Intercept) -.63 (.19)*** -.64 (.19)*** -.66 (.14)*** -.65 (.17)**
Model Fit
School ICC .30 .32 .26 .26
Child>School ICC .61 .63 .55 .57
AIC 10833.38 11879.11 9554.43 9644.31
BIC 11109.35 12094.70 9990.50 10059.94 ***p < .001, **p < .01, *p < .05

108
CHAPTER IV
What Happens to Students in Special Education? Academic Achievement and Behavioral
Adjustment Following Identification
Abstract
It is vital to understand how effective special education services are. Yet, results of empirical
studies on effectiveness are largely mixed and often ignore the implications of receiving services
at various developmental timepoints. The current study assessed growth of academic
achievement, problem behaviors, and positive learning habits among special education students
participating in the ECLS-K:1998. The propensity to receive services in either 1st grade or 3rd
grade was modeled by matching students who received services at least once during grades 1-8
on a host of Kindergarten covariates. Results indicated that students who received initial special
education services in 1st grade made larger gains through both 3rd and 5th grade and scored higher
on 3rd and 5th grade tests of reading than students who received services later in schooling. In
contrast, students who received initial services in 3rd grade did not significantly differ from their
peers on any academic outcomes. Moreover, there were no significant behavioral differences
between students who received earlier (1st or 3rd grade) versus later services (5th or 8th grade).
These results were robust to the method of propensity score analysis used, covariates used in
propensity matching, and specifications of improvement over time. This study finds that
receiving special education earlier in schooling is associated with better reading performance and

109
greater reading improvement over time than receiving services later in schooling.
Keywords: special education; propensity matching; quasi-experimental design;
developmental timing; longitudinal analyses.

110
Introduction
It is important to ensure that services are effective at remediating academic and
behavioral problems related to disability, given both the increased costs associated with special
education and a responsibility to student wellbeing. Advocates argue that the best approach is
through early intervention (e.g., Wolery & Bailey, 2002), making it vital to ensure that at-risk
children have access to services as soon as possible. Yet, concern also exists regarding the
perceived stigma and ineffectiveness of special education, particularly for non-white students
(e.g., Burns & Ysseldyke, 2009; Collins et al., 2016; Shifrer, 2013; Sullivan & Proctor, 2016).
Correlational evidence is often used to support the idea that special education services might not
be effective (Morgan, Frisco, Farkas, & Hibel, 2010); for instance, 83% and 88% of U.S.
students with disabilities performed at or below basic proficiency in mathematics and reading,
respectively, relative to 56% and 60% of students without disabilities (National Assessment of
Education Progress, 2015). Moreover, developmental trajectories are often ignored in studies
assessing the consequences of receiving special education services, though students receiving
earlier services likely have different educational needs than students receiving later services
(e.g., Marder, 2009). These differences necessitate caution when making claims about the
effectiveness of special education without accounting for who receives services, and when.
The current study assessed the development of academics, problem behaviors, and
positive learning habits among special education students participating in the Early Childhood
Longitudinal Study, Kindergarten Cohort of 1998-1999 (ECLS-K:1998). The propensity to
receive services in 1st grade or 3rd grade was modeled by matching students who received
services at least once during grades 1-8 on a host of Kindergarten covariates, ensuring that they
began schooling with similar levels of achievement and behavior, came from similar

111
backgrounds, attended similar schools, and experienced similar diagnoses, educational goals,
services, and "amounts" (or "dosage") of special education through 8th grade. Because much
research evaluating the effectiveness of special education does not account for the timing of
service receipt, this important yet often unmeasured confound could have strong implications for
conclusions about the effectiveness of special education. Thus, the present study represents an
attempt to more precisely understand how the consequences of receiving special education
services depend on when they were delivered, and to whom.
Background
For Whom are Special Education Services Effective?
Differences in the diagnoses or needs of the population under study could drive the
perceived effectiveness of special education as delivered at various timepoints. To illustrate,
services for speech and language impairments (SLI) are predominantly delivered earlier in
schooling. Figure IV.1 displays estimates from the most recent publicly-available data on the
proportion of U.S. schoolchildren receiving special education services for each diagnosis
(National Center for Education Statistics [hereafter NCES], 2011). In particular, note the
inverting shift between the proportion of students served either for SLI or for learning disabilities
(LD) between ages 6-11. Thus, studies investigating the influence of early special education
services relative to later special education may in some part be investigating the influence of
services for SLI relative to LD.
Even when studies disaggregate effects by disability type (e.g., Chesmore, Ou, &
Reynolds, 2016; Hanuschek, Kain, & Rivkin, 2002; Reynolds & Wolfe, 1999), results not
accounting for the longitudinal trajectories of students who receive such services may still be
biased. Marder (2009) notes that among students who receive several consecutive years of

112
special education services, as many as 50% switch categories away from a SLI determination as
they progress through school, with 20% switching to a primary diagnosis of LD. Conclusions are
thus rendered suspect from research finding, for example, students with speech disorders are not
influenced by special education services received after 4th grade (e.g., Hanuschek et al., 2002) or
that 1st grade students with LD increasingly lag behind non-disabled peers over time (e.g.,
Morgan, Farkas, & Wu, 2011). These results may be confounded by the fact that it may be
atypical for students to receive these services during these timeframes.
When Are Special Education Services Effective?
It is possible that the developmental timing of service receipt may explain some of the
discrepant outcomes, though such implications are not often discussed. For example, most
studies evaluating the effectiveness of preschool and/or Head Start programs find that high-
quality programs targeting 3 to 5-year-olds significantly boost academic achievement for
children with special needs (Bloom & Weiland, 2015; Lee & Rispoli, 2016; Phillips & Meloy,
2012; Weiland, 2016) and/or substantially reduce later special education placement (McCoy et
al., 2017). Studies examining the effects of K-12 special education placement also generally find
that earlier services produce better academic outcomes (Ehrhardt, Huntington, Molino, &
Barbaresi, 2013), or at least mitigate the negative or poorer outcomes observed among students
receiving later services (e.g., after about 3rd grade; Chesmore, Ou, & Reynolds, 2016; Morgan et
al., 2010; Reynolds & Wolfe, 1999). As those receiving earlier intervention may also be
exhibiting the poorest initial academic or behavioral skills (Ehrhardt et al., 2013), services may
be producing greater gains among students who receive them relatively earlier.
Yet it is commonly acknowledged that it is impossible to know how outcomes would
differ if the same students did not receive services (e.g., Reynolds et al., 1999; 2016). It may be

113
that services received later are still "effective" insofar as they halt or slow academic entropy. To
address this hypothesis, studies should have an appropriate comparison group (i.e., students
receiving services at different time points instead of a comparison group comprised of non-
disabled students), and ideally utilize a nationally-representative sample to make wider claims
about the effectiveness of special education. The lack of descriptive information about why
earlier services might more strongly influence outcomes is also concerning. Are there differences
in the types or amounts of services received earlier that could explain why these services are
more effective than later service receipt? Moreover, for how long are services effective – that is,
do their effects persist across development, or do they fade out after a few years? Though
important, these questions have not been explicitly examined in a quasi-experimental manner.
Quasi-Experimental Designs in Special Education
Randomized control trials (RCT) would be the most statistically rigorous way to contrast
causal outcomes of special education service receipt. However, this would necessitate randomly
assigning equivalent students to general or special education and is thus not an ethical or legal
solution (Morgan, Frisco, Farkas, & Hibel, 2010; Sullivan & Field, 2013). Therefore, researchers
interested in making causal inferences about the effectiveness of special education should
conduct studies that use quasi-experimental designs to isolate intervention effects (Schneider,
Carnoy, Kilpatrick, Schmidt, & Shavelson, 2007; Sullivan & Field, 2013). Such methods include
regression discontinuity (e.g., Phillips & Meloy, 2012; Weiland, 2016), propensity-score
matching (e.g., Morgan, Frisco, Farkas, & Hibel, 2010; Sullivan & Field, 2013), and value-added
or fixed effects modeling (e.g., Hanuschek, Kain, & Rivkin, 2002; Reynolds & Wolfe, 1999).
A handful of studies across the past two decades have used these methodologies to make
claims about the effectiveness of special education, to mixed results. Research has found

114
negative (Chesmore, Ou, & Reynolds, 2016; Reynolds & Wolfe, 1999; Sullivan & Field, 2013),
statistically negligible (Chesmore et al., 2016; Morgan et al., 2010), and/or positive effects of
special education service receipt (Ehrhardt et al., 2013; Hanuschek, Kain, & Rivkin, 2002; Lee &
Rispoli, 2016; Morgan et al., 2010; Phillips & Meloy, 2012; Weiland, 2016). Results have also
been mixed across and within methods, which could be due to either methodological limitations
(even when methods are designed to infer causality) or to the sampling design. For example,
propensity score matching has been touted as closely approximating RCT given its ability to
contrast naturally occurring "treatment" and "control" groups with similar odds of receiving the
treatment (Morgan et al., 2010). Yet, it is difficult to disentangle the fact that having a disability
inherently creates differences between students in special and general education. Thus, even
propensity-matched controls are not entirely "equal" when the comparison group is comprised of
general education students (Hanuschek, Kain, & Rivkin, 2002).
Fixed effects or value-added models remove the problem of having a poor comparison
group by comparing each child to him/herself over time to estimate the effects of service receipt.
However, like all regression-based designs, specification errors may produce bias in results (such
as an unmodeled non-linear relationship between predictor and outcome; Sullivan & Field,
2013). A within-child approach also largely removes our ability to assess the consequences of
the timepoint at which services are received (earlier or later in schooling). Moreover, the two
studies utilizing this method to investigate special education effectiveness utilized samples that
were non-representative of the U.S. population, and produced opposite conclusions (Hanuschek,
Kain, & Rivkin, 2002; Reynolds & Wolfe, 1999). Hanuschek's group found positive effects of
service receipt among Texan children between grades 4-7, while Reynolds and Wolfe found
negative effects of service receipt among low-income Chicagoan children, especially between

115
grades 4-6. Thus, more precise methods and sampling procedures are needed to isolate the
effects of special education service receipt.
The Present Study
Because it is difficult to disentangle the confounds endogenous to having a disability
when evaluating later academic achievement and behavioral adjustment, the current analyses
included only students who were placed in special education at some point during grades 1-8.
This provides a better comparison group than what is typically used in matched analyses, as all
students sampled have a special educational need or disability that eventually requires
intervention (though some receive earlier services than others). Students were matched on a host
of Kindergarten covariates, ensuring that students started out at roughly the same levels of
achievement and behavior, came from similar backgrounds, attended similar schools, and
experienced similar "amounts" of special education through 8th grade. Importantly, during the
wave(s) prior to treatment, no students were reported to have an Individualized Education Plan
(IEP; the federally-mandated document outlining service provisions and goals required for all
special education students). This means that the effects of special education are estimated among
children who receive services for the first time. Effects of services were evaluated using three
propensity-analyzing techniques: estimation of treatment effects by stratification, kernel-
matching, and nearest-neighbor with random draw (c.f. Morgan et al., 2010).
In general, this use of propensity score matching allows for comparison of students
receiving services to others who theoretically could have received services at that same time but
did not until later in schooling. This study design also allowed for evaluation of the following
specific research questions: first, did services have a stronger impact more proximally (i.e., from
1st to 3rd grade) or did their effects persist over time (i.e., from 1st to 5th grade)? Although

116
services received earlier may influence outcomes at both timepoints, given fadeout effects
following most child or adolescent interventions (see Bailey, Duncan, Odgers, & Yu, 2017), one
hypothesis was that effects would be stronger when measured more proximally to initial service
receipt. Alternatively, if treatment effects remained stable or increased through 5th grade, one
could hypothesize that receiving services in 1st grade allowed children to "catch up" to their peers
(also referred to as a "compensatory growth model;" see Morgan, Farkas, & Wu, 2011).
Second, is there a threshold or developmental timepoint during which early services are
most effective? In other words, would the effects of services received in 3rd grade differ from
those received in 1st grade? Given the relatively larger body of research demonstrating positive
effects of early service receipt (or, at least, an absence of negative effects relative to services
received later), it was hypothesized that services received in 1st grade would have larger effects
on academic and behavioral outcomes than services received in 3rd grade.
However, given the apparent differences between students who receive special education
services at various developmental timepoints (e.g., Marder, 2009; NCES, 2011), it may also be
possible that students receiving early services are not drawn from the same population of
children with special needs as those receiving later services. The third and final research question
addressed how students who received initial services in 1st grade differ from those who received
initial services in 3rd grade, in terms of disability identification, services received, and IEP goals.
In keeping with Figure IV.1, it was hypothesized that there would be more students with SLI
than LD served in 1st grade, which would accompany differences in IEP goals and services.
Method
Sample
Data were drawn from the ECLS-K:1998. Though there are newer ECLS data available

117
(the 2011 cohort), these data are not yet available through 8th grade, rendering the ECLS-K:1998
the best available dataset to answer these research questions. The ECLS-K:1998 followed
approximately 21,400 students who began Kindergarten in 1998 through 1st, 3rd, 5th, and 8th
grade, and provides a rich collection of information on home and schooling experiences. During
each wave of data collection, school office staff indicated whether the target child had an IEP on
file. If staff responded "yes" at any wave, the child was included in the analytical sample
regardless of whether data were missing at other waves. Though this sampling method likely
underestimates the duration of time students received services given the presence of missing
data, it also maximized the potential sample from which propensity scores were created, which
improves the scores' precision (Frisco, Muller, & Frank, 2007; Morgan et al., 2010).
Additionally, if students were reported to have an IEP during the spring Kindergarten wave of
data collection, they were excluded from the analytical sample. This ensured that the sample was
comprised of students in general education during Kindergarten, and thus allowed for the
possibility of a comparison group comprised of students who had not yet received services but
would at least once by 8th grade.
The first set of propensity-matched analyses (N = 640) included students who received
initial services in 1st grade (n = 230) relative to students who received them later in schooling (n
= 410). The second set of propensity-matched analyses (N = 250) included students who received
initial services in 3rd grade (n = 160) relative to students who received initial services in 5th or 8th
grade (n = 90); no students in this latter analysis had an IEP on file during either Kindergarten or
1st grade. All reported sample and group sizes are rounded to the nearest 10, as is required by the
Institute of Education Sciences when publishing results obtained from the restricted-data files.

118
Propensity-Matching Procedure
Propensity matching was conducted in Stata/SE v. 15.1 using the pscore program (Becker
& Ichino, 2002). A wide range of covariates measured during the Kindergarten year that were
theoretically related to either special education service receipt or academic or behavioral
outcomes (including individual characteristics, the home environment and parenting, initial
levels of academic achievement and behavior, and schoolwide characteristics) were used to
create propensity scores. Covariates that could not be balanced across strata were dropped,
leaving 41 covariates that were used to construct the 1st grade propensity scores, and 47
covariates that were used to construct the 3rd grade propensity scores. Information about
covariates used in propensity score creation is available in Appendix C (Table C.1). Descriptive
statistics by propensity stratum and across the full samples are represented in Table C.2 for 1st
grade analyses, and in Table C.3 for 3rd grade analyses. In both analyses, the logit option was
used instead of the default probit (though similar results were obtained with both options).
Results are reported as average treatment effects on the treated (ATT). Outcomes were adjusted
for multiple comparisons using the Benjamini-Hochberg correction.
Sensitivity analyses revealed similar results when the common support was used in
generating propensity scores (e.g., removing those with the highest and lowest propensity for
receiving services to more conservatively estimate treatment effects; see Sullivan & Field, 2013).
However, as this decreases the sample size and thus reduces the power to detect effects, results
reported here are based on propensity scores that did not utilize the common support. As a
robustness check for effect sizes, and like other research investigating the effectiveness of special
education using propensity matching analyses (specifically, Morgan et al., 2010), three types of
estimators were used to evaluate the treatment effect among propensity-matched students:

119
stratification matching (Stata's atts command), nearest-neighbors with random draw (attnd), and
kernel-matching (attk). In stratification matching, the full range of propensity scores are divided
into blocks of equivalent propensity scores between students receiving or not receiving the
treatment, balanced to differences that were non-significant at p < .01. Average treatment effects
are then produced within each stratum and averaged together to produce the total ATT. Nearest-
neighbor matching pairs treated cases with maximally similar control cases based on their
propensity scores, while unmatched control cases are excluded. The attnd program also allows
for matching with replacement, in which control cases that are the best match for more than one
treatment case may be reused in analyses to minimize bias in the calculation of the ATT (Frisco
et al., 2007). Finally, kernel-matching compares treatment cases to a weighted mean of control
cases based on the distance between their respective propensity scores. To minimize bias given
the use of multiple control observations contributing to multiple matches, standard errors for the
ATT's were bootstrapped 1,000 times (Morgan et al., 2010). A simple meta-analysis of effect
sizes weighted across each propensity-matching technique is also presented alongside these
estimates.
Missing Data and Weighting
Only cases with complete data on all covariates used for matching analyses may be used
to construct propensity scores using the pscore program. Among students who did not have an
IEP in Kindergarten, 1,020 students had IEP information reported in 1st grade. Of these, 60
percent had complete data to be matched on all covariates used in the construction of propensity
scores. This led to a total sample of 640 students for the 1st grade propensity-matched analyses.
In 3rd grade, 590 students who were not reported to have an IEP in Kindergarten or 1st grade had
information reported about their special education status (approximately 42 percent of the total

120
number of students with IEP information reported in 3rd grade). Of these, 44 percent had
complete information on all covariates used in the construction of propensity scores, leading to a
sample of 250 students for the 3rd grade propensity-matched analyses.
A normalized Kindergarten weight (C2CW0) adjusted for the cluster-sample design of
the study (Kish, 1965) was applied during the creation of the propensity scores and the
estimation of treatment effects. The spring Kindergarten weight was chosen given that most
covariates used to estimate propensity scores were obtained from this wave of data collection.
Moreover, since only complete cases may be used with the pscore program to create the
propensity scores, weighting the analyses helps to further minimize selection bias introduced by
dropping incomplete cases, and allows results to be described as nationally representative of U.S.
Kindergarteners who began school in the fall of 1998.
Variables of Interest
Academic Achievement. Academic assessments created specifically for the ECLS-
K:1998 used Item Response Theory (IRT), which algorithmically uses the number of correct,
incorrect, and omitted answers in relation to item difficulty to estimate each child's point on a
continuous ability scale. This method also allows scores obtained at each timepoint to be directly
comparable, thus permitting longitudinal analyses. The 3rd grade reading assessments evaluated
mastery of phonemic awareness, word decoding, vocabulary, and passage comprehension. The
5th grade reading assessment was largely the same, with the addition of items capturing students'
ability to comprehend biographical and expository text. The 3rd grade mathematics assessments
evaluated number sense, properties, and operations; measurement; geometry and spatial sense;
data analysis, statistics, and probability; and pattern, algebra, and functions. These same
properties were assessed in 5th grade, with the addition of problem solving using fractions and

121
problem solving using the concepts of area and volume.
Behavioral Adjustment. In the spring of Kindergarten, 1st grade, 3rd grade, and 5th
grade, students' behaviors were described by their primary teachers using five subscales from the
Teacher Social Rating Scale (SRS, adapted from the Social Skills Rating Scale; Gresham &
Elliott, 1990). These measures were not collected in 8th grade, so data were only analyzed
through 5th grade. The Approaches to Learning scale captured positive learning behaviors,
including attentiveness, task persistence, eagerness to learn, independence, flexibility, and
organization (K-5th grade α = .89-.91). The Interpersonal Skills scale rates the child's ability to
form and maintain relationships, get along with others, comfort or help others, positively express
feelings, ideas, and opinions, and show sensitivity to others' feelings (α =.89-.88). The Self-
Control scale measures the child's ability to control their behavior by responding appropriately to
peer pressure, respecting others' property, controlling their temper, and accepting peers' ideas (α
= .80-.79). Lastly, the final two scales captured Externalizing Problem Behaviors and
Internalizing Problem Behaviors, respectively (αextern = .90-.89 αintern = .78-.77). The
Internalizing Problem Behaviors scale rated apparent anxiety, loneliness, low self-esteem, and
sadness, while the Externalizing Problem Behaviors scale measured how often the child argues,
fights, gets angry, acts impulsively, and disturbs ongoing activities.
Gain scores. In studies investigating intervention effects, it is common to utilize a
measure of growth such as gain scores to ensure that observed differences in outcomes are not a
statistical artifact of initial learning or behavior differences (e.g., Morgan et al., 2010). Because
students were propensity-matched on baseline academics and behavior, gains measured over
time are less likely to be biased by measurement error (i.e., students starting out at higher or
lower levels). Moreover, when tests are matched to student ability in IRT methods, all students

122
have an equal chance to gain on the vertical scale (i.e., that spans several time points) even
though the scale units are non-equivalent (Ballou, 2002). However, gain scores may produce
biased estimates of growth trajectories when they are not computed from adaptive testing
procedures (Rock, 2007). Because only the academic assessments utilized IRT methodology, the
academic gain scores should be less biased than the behavioral gain scores. The validity of the
behavioral gain scores is weakened due to potential floor or ceiling effects in teacher ratings.
Yet, gain scores were still utilized given the absence of other longitudinal behavioral measures in
the ECLS-K:1998, so they should be interpreted with reservation.
To compare gains made in the treatment group relative to the control group, a measure
was computed capturing simple difference scores between the outcome and the timepoint
immediately prior to the indication of special education status. For instance, 3rd grade gain scores
were computed by taking the difference between spring 3rd grade and spring Kindergarten
assessments (the last wave of data collection prior to indication of a 1st grade IEP). Similarly, 5th
grade gain scores were computed by taking the difference between spring 5th grade and spring
Kindergarten assessments (for students receiving initial services in 1st grade) or spring 1st grade
assessments (for students receiving initial services in 3rd grade; as there was no data collection
during 2nd grade, this was the most recent timepoint prior to treatment estimation).
Covariates. Covariates used to match students are drawn from the Kindergarten wave of
data collection and capture five elements: student demographics (e.g., race/ethnicity, disability,
age at Kindergarten entry), baseline achievement and behavior, family and home environment
(e.g., maternal education, income, single or teenage parent, cognitive stimulation in the home),
and school demographics (e.g., region of country, average socioeconomic status, proportion of
non-White students, whether school receives Title I funding). Children are less likely to receive

123
early intervention services if they display greater early reading and/or mathematics skills (Hibel,
Farkas, & Morgan, 2010; Hosp & Reschly, 2004; Morgan, Farkas, Hillemeier, & Maczuga,
2012; Sullivan & Bal, 2013) and better behavior (Briesch, Ferguson, Volpe, & Briesch, 2012;
Morgan, Farkas, & Wu, 2009; Peterson et al., 2011). However, to reduce endogeneity given that
academic achievement may be used to refer students for special education, fall achievement
scores were used in propensity matching instead of the more recent spring Kindergarten
assessment. This ensured that students were matched on academic ability occurring as closely as
possible to the transition to school, and as far away as possible from the spring 1st grade
indication of special education status.
Results
Propensity-Matching Results
Matching 1st graders on their propensity to have an IEP resulted in 6 strata (Table IV.1).
Students with the lowest propensity of having an IEP in 1st grade were in stratum 1, whereas
students with the highest propensity were in stratum 6. Students with the highest propensity
scores spent the most time in special education from 1st through 8th grade ("dosage," as indicated
by the number of waves in which they were reported to have an IEP), had a parent-reported
disability in Kindergarten; had a low birthweight; were older at Kindergarten entry; had lower
fall Kindergarten mathematics scores; were not Black or Hispanic; had less-educated mothers
and a lower family income; had lower educational attainment expectations but more involved
parents (i.e., based on how often they did activities with the child, such as reading together or
playing games); and attended public, rural schools located mostly in the Midwest. Descriptive
statistics by 1st grade strata and for the full sample are presented in Table C.2.
Students were also matched on their propensity to have an IEP in 3rd grade, which

124
resulted in 5 strata (Table IV.2). Like those matched in 1st grade, students with the highest
propensity of having an IEP in 3rd grade also had the highest "dosage" of special education
between 1st and 8th grade and had the lowest Kindergarten mathematics scores. However, unlike
those matched in 1st grade, students with the highest 3rd grade propensities also displayed more
teacher-reported externalizing problem behaviors in Kindergarten; came from single- or teenage-
parent households with an absent biological father; spoke a non-English language at home;
received some type of center-based care prior to Kindergarten; attended large, urban, Western
schools receiving schoolwide Title I funding; and attended schools with higher proportions of
English language learners, non-White students, and students with a disability. Descriptive
statistics by 3rd grade strata and for the full sample are presented in Table C.3.
RQ1: Distal/Proximal Outcomes
The first research question addressed how early services (1st grade) impacted more
proximal services (3rd grade) relative to more distal services (5th grade) among otherwise-similar
students who also received comparable "amounts" of services through 8th grade. Academic
results are displayed in Table IV.3. 1st grade students with an initial IEP tested higher in both 3rd
(average ES = .28) and 5th grade reading (ES = .31), and in 5th grade mathematics (ES = .31)
relative to students who received later services. Moreover, 1st graders with an initial IEP made
larger reading gains from Kindergarten through both 3rd grade (ES = .31) and 5th grade (ES =
.31) and made larger mathematics gains from Kindergarten through 5th grade (ES = .27; though,
the stratification-matching estimate was not statistically significant). Fifth grade effect sizes were
comparable to 3rd grade for reading achievement, suggesting little evidence of a fadeout effect
through at least the next four grades following initial service receipt. However, estimates for
mathematics appeared larger in 5th grade than in 3rd grade, suggesting that special education

125
services received in 1st grade allow for some longitudinal remediation relative to peers who
receive later services.
Table IV.4 displays the estimated treatment effect of receiving 1st grade services on 3rd
and 5th grade teacher-reported behavioral outcomes. Results are largely non-significant, with
most average effect sizes less than .10. This indicates that students who had their first IEP in 1st
grade did not have significantly different behavior as perceived by teachers than their peers who
received later services, nor do they appear to make larger or smaller behavioral gains over time.
RQ2: Timing of Service Receipt
The second research question evaluated the relative timing of service receipt.
Specifically, research supports the idea that earlier service receipt is more beneficial than later
service receipt. But, what does "early" mean? Relative to students who receive later services, are
the effects of special education similar when initially received in 3rd grade as in 1st grade? To
answer this question, students' propensity to receive services was modeled in 3rd grade relative to
a sample of peers receiving initial services in 5th or 8th grade. Importantly, these estimates do not
directly compare students receiving services in 1st grade to students in 3rd grade. Rather, each
analytical sample is comprised of otherwise-similar students who receive services earlier (i.e., in
1st or in 3rd grade) relative to later (5th or 8th grade). Indirectly evaluating the differences between
the two analyses permits inferences on the question, how early is early enough?
Results confirm the hypothesis that there are larger academic effects among students
receiving 1st grade services than 3rd grade services. Relative to peers who experienced later
services, 3rd graders with an IEP appeared to score lower on 5th grade tests of reading and
especially mathematics given the negative directionality of estimates (though these estimates did
not reach statistical significance) (Table IV.5). There were no significant associations between

126
3rd grade service receipt and 5th grade teacher-reported behaviors (Table IV.6).
RQ3: Who Receives Earlier vs. Later Services?
The third research question built upon the results of the second. Because earlier services
(1st grade) were associated with larger, positive effects in both 3rd and 5th grade relative to later
services, and because services received in 3rd grade were not associated with these same effect
sizes in 5th grade, could results be impacted by inherent differences between students who
receive services for the first time at these different timepoints? If so, this research question
arguably represents one of the most important caveats to researchers assessing the impact of
special education services.
To assess the differences between students who receive services in 1st grade and 3rd
grade, information about the IEP and services received was drawn from the Special Education
Teacher Survey B at each wave. Simple mean differences between 1st and 3rd graders with IEP's
are presented in Table IV.7. Of the students in this sample who were receiving services in either
1st grade or 3rd grade, 66 and 59 percent were missing data on the teacher survey, respectively.
Thus, the information reported in Table IV.7 represents a subsample of students with a reported
IEP in 1st or 3rd grade with linked special education teacher survey data.
In this subsample, there were several significant differences between students who
received initial special education services in 1st (n = 180) or 3rd grade (n = 310). More 1st graders
had a primary diagnosis of SLI (18% more) or developmental disability (5%), while about 25%
more 3rd graders were served for LD. 1st graders were also more likely to have IEP goals for
auditory processing (11%), listening comprehension (12%), oral expression (33%), gross motor
skills (5%), and orientation/mobility (6%), and received more language therapy services (18%).
3rd graders more often had IEP goals for reading (16%) and language arts (20%) than 1st graders.

127
Additionally, more 1st graders reportedly met their IEP goals than 3rd graders (M1st = 2.50, SD =
1.19; M3rd = 2.08, SD = 1.05; scale range 1-5). More 3rd graders received small group instruction
(4%), large group instruction (33%), cooperative learning (13%), and peer tutoring (13%).
Lastly, more 1st graders received a general education curriculum without modification (18%),
while more 3rd graders had some curricular modifications (16%). There were no significant
differences in the number of hours per week receiving services, the percent of students whose
primary placement was general education, or time spent outside a general education classroom.
Extensions
IEP Characteristics. The propensity-matching program used in this study requires
complete cases for statistical analysis. Given the large amount of missing data on the special
education teacher survey items, including items from this survey in the construction of
propensity scores would result in fewer complete cases, and thus, lowered analytical power.
However, given the significant differences between students who receive 1st grade services
relative to 3rd grade services, conclusions about the effectiveness of earlier service receipt are
confounded and weakened when students are not initially matched using these variables. Though
there were fewer students who had linked special education teacher survey data, a follow-up set
of analyses were carried out to ascertain whether the effects of special education services initially
delivered in 1st or 3rd grade differed when students were matched on initial diagnosis, services
received, and initial IEP goals (in addition to the rich sets of covariates modeled in the main
analyses). All results are available in Appendix D.
Variables created and used for these analyses captured information about the IEP during
the first wave the student was reported by a special education teacher to be receiving services,
regardless of whether data were missing at other waves. Primary diagnosis (1=LD, 2=SLI,

128
3=Other), IEP goals (reading, mathematics, language arts, auditory processing, oral expression,
gross motor skills, and orientation/mobility, where 1=yes), and average amount of special
education services received per week were included in the propensity score estimation alongside
the set of covariates used in initial analyses. This resulted in 310 students matched in 1st grade
(37 percent receiving treatment), and 210 students matched in 3rd grade (65 percent receiving
treatment; see Tables D.1 and D.2 for the balance of propensity scores and sample sizes).
Results were similar to initial analyses. Students who received 1st grade special education
services but who also experienced similar diagnoses, IEP goals, and amounts of services per
week again displayed significantly higher reading achievement test scores and made larger
reading gains through 3rd and 5th grade (Table D.3) relative to those who received services later
in schooling. No estimates from the nearest-neighbor propensity analyzing technique were
statistically significant, though estimates appear similar to those obtained in the other two
methods. Reading effect sizes were slightly higher than those presented in the main analyses,
though the 95% confidence intervals presented alongside the simple meta-analysis of effect sizes
across the three propensity-analyzing techniques all include zero. The higher effect sizes could
therefore be a function of the non-significant nearest neighbor results, or reduced sample size
and lowered precision (e.g., see Ioannidis, 2008). However, results reported for reading are in the
same direction as those presented in the main analyses. Effects for mathematics achievement
ceased to be statistically significant and, in some propensity-analyzing techniques, reversed in
directionality. Effect sizes ranged from .01-.10 for mathematics, indicating relatively little effect
of 1st grade special education services on later mathematics achievement once initial diagnosis,
IEP characteristics, and amount of services per week were accounted for.
There were again no significant differences between students receiving initial services in

129
3rd grade relative to those receiving services later in schooling (Table D.5), and no significant
effects of having an IEP in 1st or 3rd grade on later behavior (Tables D.4 and D.6, respectively).
The 3rd grade academic estimates also changed in directionality relative to initial analyses. After
accounting for IEP characteristics, 3rd graders with an IEP showed marginally significant gains in
reading through 5th grade and appeared to have higher reading and mathematics test scores than
non-treated peers. Though these estimates remained non-significant likely because of the small
sample size in this subgroup, the large magnitude of effects suggests that matching students on
particular IEP diagnoses, goals, and services may reduce some noise associated with different
special educational needs.
Gain Scores. Measuring gains can be noisy because they are typically computed as the
difference between two test scores, each of which is subject to measurement error. Some have
argued that difference scores subtract out a good deal of true ability, leaving a disproportionate
amount of this measurement error (Ballou, 2002). It may also be difficult to compare gain scores
between students at different years given the non-equivalence of scale units. For instance, a
student gaining 10 points on the lower end of the scale is mastering different skills (e.g., letter
recognition) than a student gaining 10 points on the higher end of the scale (e.g., evaluation of
text). Thus, gain scores from 3rd to 5th grade may be inherently smaller than gain scores from 1st
to 3rd grade, given the relative difficulty of mastering more advanced skills. This could explain
why there were few significant gains among 3rd grade students receiving services.
Though gain scores have typically been used to measure improvement over time and thus
capture an important dimension of longitudinal change, the issues with this type of measure may
cloud reported conclusions. To test this theory, a second set of follow-up analyses were
conducted on the achievement data using theta scores (T-scores) and proficiency levels. ECLS-

130
K:1998 T-scores used the same testing procedure as the IRT-scores but were norm-referenced to
a mean of 50 and a standard deviation of 10 in order to directly compare students to their peers.
T-score means may be used in the ECLS-K:1998 to measure longitudinal improvement or
deterioration of subgroups relative to peers. In both 3rd and 5th grade, variables were also
available indicating the highest level of proficiency achieved in the subject (ranging from
1=letter recognition to 9=evaluating non-fiction for reading; and ranging from 1=number and
shape to 9=area and volume for mathematics). Both the T-scores and highest proficiency levels
were modeled to ascertain what students know and how they compare to their peers both
preceding and following service receipt in 1st or 3rd grade. Unfortunately, similar items were not
available for behavioral data. Results are presented in Appendix E, Tables E.1 and E.2.
Figure E.1 presents a graphical representation of the reading and mathematics T-scores
among students receiving or not receiving initial services in 1st or 3rd grade. In Kindergarten,
students who receive an IEP in 1st grade display the largest gap between both their general
education peers (normed at a T-score of 50) and the control group of students who receive
services sometime after 1st grade. However, students with an IEP appear to close this gap for
both reading and mathematics through 5th grade. In contrast, 3rd graders with an initial IEP have
mathematics and reading scores that begin closer to those of their normed general education
peers but generally appear to decline or remain stagnant over time. This representation of T-
scores also indicates that students who receive an initial IEP after 3rd grade (the control group for
the second set of analyses) may be unlikely to receive special education services for
mathematics, as their mathematics achievement closely approximates the normed general
education students through 5th grade.
Turning to Tables E.1 and E.2, the same pattern is evident for the T-scores and highest

131
proficiency level indicator as we observed for the gain scores. Receiving initial services in 1st
grade is associated with both a higher reading T-score in 3rd and 5th grade, and with a higher
mathematics T-score in 5th grade. 1st graders with an IEP also had achieved a slightly higher
reading proficiency level in 3rd (Mtreat = 5.88, Mcontrol = 5.71; where level 5 = comprehending
words in context) and 5th grade (Mtreat = 6.80, Mcontrol = 6.46; where level 6 = literal inference).
There were again no statistically significant 5th grade outcomes among students receiving 3rd
grade special education services. However, reading and mathematics T-scores and mathematics
proficiency levels were negative in directionality, indicating that 3rd graders with an initial IEP
may fall even further behind their peers during this timeframe.
Timing of Assignment. Measures of special needs that include the presence of an IEP
document on file are likely to underrepresent the true population of students with disabilities, as
it can take up to several months to refer and evaluate the child and draft the initial IEP. If
students were still undergoing this process at the time of ECLS-K:1998 data collection in spring
of 1st or 3rd grade, their special needs status would be unreported. For example, students could
have been undergoing evaluation during data collection in 1st grade, which would place them in
the control group during 1st grade analyses. One would expect that this scenario would result in
depressed treatment effects, which means that outcomes for 1st graders receiving special
education may be somewhat underestimated.
More importantly, given the timing of ECLS-K:1998 data collection (fall and spring of
Kindergarten, followed by spring of 1st, 3rd, 5th, and 8th grades), it is possible that assignment to
special education occurred prior to data collection in the sample of propensity-matched 3rd
graders. For example, students might have been assigned an IEP as early as the end of 1st grade
(following data collection for the year) or the beginning of 2nd grade, which was a timepoint not

132
collected in the ECLS-K:1998 study. This uncertainty in timing clearly threatens the internal
validity of this 3rd grade subgroup and could provide an explanation for the lack of significant
outcomes among 3rd graders with an IEP. There was a 3rd grade special education teacher survey
variable asking when students first had an IEP (with 1 = before Kindergarten, 2 = during
Kindergarten, 3 = during 1st grade, 4 = during 2nd grade, and 5 = during 3rd grade). Though
75% of this variable was missing data in the propensity-matched sample, 20 students were
indeed initially diagnosed prior to 3rd grade (12% of the 3rd grade treatment group). Removing
those cases from analyses did not significantly change results. But, the possibility remains that
students missing teacher survey data were also diagnosed earlier than 3rd grade given the degree
of missing data, so to what extent these estimates are biased continues to be unclear. Results for
3rd grade should therefore be interpreted cautiously given the lack of confirmed internal validity
on this measure.
Discussion
The purpose of this study was to more precisely estimate the effects of special education
as delivered at various timepoints during schooling. Analyses utilized a propensity-matched
sample of students who had ever received special education in grades 1-8 to investigate how the
timing of initial service receipt (in 1st or 3rd grade) influenced later academic and behavioral
adjustment (in 3rd and 5th grade). Because the students included in these samples were indicated
to have an IEP at least once between 1st and 8th grade, the effects of service receipt reported here
are not in reference to students who never receive special education services (a poor comparison
group), but to students who receive those services at different developmental timepoints. This
method allows for closely approximating causal estimates of special education's effectiveness,
allowing us to more confidently say that students who receive earlier initial services experience

133
larger academic gains and achieve higher test scores than students who receive initial services
later in schooling.
Initially, results indicated that students who received special education in 1st grade made
larger reading gains through both 3rd and 5th grade, scored a third of a standard deviation higher
on 3rd and 5th grade tests of reading, and scored a third of a standard deviation higher on 5th grade
tests of mathematics than students who received initial services later in schooling. In contrast,
students who received initial services in 3rd grade did not significantly differ from their peers
receiving later services on any academic or behavioral outcomes. Further analyses in a
subsample of students with linked special education teacher survey data revealed significant
differences in the types of students receiving initial services, the goals for special education, and
the types of services received in 1st grade relative to 3rd grade. This finding made tenuous
previous assumptions about the effectiveness of early services, as effects for 1st grade special
education could be confounded by the services received commensurate with the student's
primary diagnosis.
Given these differences, follow-up analyses in this subsample used initial diagnosis,
special education goals, and the average amount of special education received per week to again
match otherwise-similar students on their propensity to receive special education services in 1st
or 3rd grade. Effect sizes increased and significant effects for mathematics achievement dropped
out entirely after accounting for specific IEP-related information available for a subset of
propensity-matched students (though, the graphical representation of T-scores in Figure E.1
indicates that, given the upward trajectory of students with a 1st grade IEP, these students may
have significantly higher mathematics achievement in 8th grade). Reading results for 1st graders
largely remained the same, but newly-matched 3rd graders experienced some marginally

134
significant reading growth through 5th grade. These results were also robust to the types of scores
used to measure improvement over time (e.g., gain scores, T-scores, and proficiency levels).
It is important to note that these latter analyses were underpowered given the large
amount of missing survey data provided by special education teachers. But, matching students on
these variables means that estimates more closely reflect the "true" impact of receiving or not
receiving special education among otherwise-similar students, which allows clearer inferences
about the relative impact of receiving initial services in 1st grade or 3rd grade. (Indeed, it is
possible that the lack of power explains why the 3rd grade estimates did not reach statistical
significance, though they appeared to follow the trend of the 1st grade estimates.) Unfortunately,
looking at outcomes for students receiving earlier or later services by disability type was also
unfeasible given sample size constraints. Yet, by at least matching students on initial diagnosis,
effects should be generally independent of specific disability. Overall, results imply that – among
students who come from similar backgrounds, display similar Kindergarten levels of
achievement and behavior, and who have similar diagnoses, services, and IEP goals – receiving
special education earlier in schooling (at 1st grade) is robustly associated with better reading
performance and greater reading improvement over time than receiving later services.
These results are important for educational policymakers concerned with identifying at-
risk students and providing the necessary special education services as early in schooling as
possible. The first research question specifically tested whether services would have a stronger
proximal or distal impact on academic and behavioral outcomes. Services could either fadeout
after 3rd grade or allow students to "catch up" to peers through at least 5th grade. Relevant to
policymakers, this latter hypothesis was largely supported by the data. Moreover, a set of follow-
up analyses using T-scores revealed that 1st and 3rd grade students in the treatment groups began

135
formal schooling at relatively lower levels of both reading and mathematics than both general
education peers and peers who received later services. However, only 1st graders receiving
services made larger gains over time, eventually surpassing or catching up to the control group in
reading and mathematics, respectively. This same pattern was not evident for students who
received initial services in 3rd grade, whose T-scores remained lower than both the control group
and general education students even though they entered school with roughly similar relative
levels of academic performance.
Given the similarities in Kindergarten T-scores around the transition to school for both 1st
and 3rd grade treatment groups, it is unclear why certain students did not receive services earlier
than 3rd grade. Perhaps these students were a more heterogeneous population than students who
receive initial services earlier, which could explain the fewer statistically significant effects.
Alternatively, many educators hesitate to refer students to special education too early in the
hopes that their academic problems may remediate with minimal intervention, a model that has
been criticized as waiting for the student to fail (e.g., see National Council on Disability, 2002;
Reedy, 2004; Woods, Morrison, & Palincsar, 2017). Coupled with the evidence suggesting that
preschool special education services are largely effective (e.g., Lee & Rispoli, 2016; Phillips &
Meloy, 2012; Weiland, 2016), these results again imply that services received earlier in K-12
may be most efficient at remediating academic problems related to disability. Policymakers and
educators should continue to direct at-risk populations toward the earliest available services.
These results also provide some evidence for the existence of a developmental timeframe
during which receiving special education services is associated with the largest academic
improvements. The second research question tested the relativity of "early" special education
service receipt by indirectly comparing outcomes for students receiving initial services in either

136
1st grade or 3rd grade. In contrast to the results for 1st graders receiving initial services, 3rd graders
did not exhibit significantly different effects of service receipt relative to students who received
services after 3rd grade. Receiving initial services in 3rd grade may therefore be too late to allow
for academic remediation. On the other hand, estimates for 3rd grade may be less stable than for
1st grade given the uncertainty around timing of initial service receipt, so further research is
sorely needed to confirm this hypothesis.
It is also impossible to entirely rule out the counterfactual that a diagnosis of LD is harder
to remediate than a diagnosis of SLI. The third research question assessed who receives services
at 1st or 3rd grade using a subsample of students with linked special education teacher survey
data. Consistent with hypotheses and NCES data (e.g., Figure IV.1), more 3rd graders had
primary LD diagnoses and subsequently academically-oriented goals (i.e., reading and language
arts), while more 1st graders had primary SLI diagnoses and goals related to speech therapy (i.e.,
auditory processing, listening comprehension, oral expression). 1st graders also reportedly met
more of their goals than 3rd graders. In conjunction, 1st graders received fewer modifications to
curriculum than 3rd graders, and had comparatively fewer special services rendered (i.e., large
group instruction, cooperative learning, peer tutoring). These differences could imply that LD's
are more resistant to academic remediation than SLI's, given the higher prevalence of academic
services delivered. The additional services delivered later in schooling (i.e., large group
instruction, cooperative learning, peer tutoring) may have increased in frequency because 3rd
graders with disabilities were more resistant to remediation. Alternatively, services delivered
more often later in schooling may have been less effective than services delivered earlier.
Researchers interested in approximating causal inferences are encouraged to investigate these
hypotheses as potential mechanisms through which special education services affect students.

137
Interestingly, special education received in 1st or 3rd grade did not appear to be
significantly associated with teacher perceptions of behavior. Perhaps because teachers' ratings
of student behaviors are subjectively measured, these ratings are more stable over time. Yet,
given the largely academic focus of special education, behavior may not be as affected by earlier
service receipt relative to later services. This stands in contrast to Morgan and colleagues (2010),
whose comparison of special education students to "similar" general education peers revealed
small positive impacts of 3rd grade service receipt on 5th grade behavior. In addition, a more
objective measure of behavior that would reflect longitudinal development (such as IRT-adjusted
scores, or T-scores) was unavailable in the ECLS-K:1998. It is possible that the gain scores used
to capture change over time in teacher-reported behaviors are inadequate for this purpose, since
they are not IRT-adjusted to student ability and thus may not accurately reflect longitudinal
development. There may be other behavioral improvements associated with the receipt of special
education services that were not captured by these methods. Future research should take care to
more accurately assess the influence of special education on behavioral outcomes.
Limitations. There were several limitations of this study in addition to the few named
above. First, it is possible that 3rd grade service receipt may have stronger effects more distally,
in the same way that 1st grade effects were similar or stronger in 5th grade than in 3rd grade.
However, data were not collected between 5th and 8th grade in the ECLS-K:1998, and behavioral
data were unavailable at the 8th grade wave, so this was impossible to ascertain and should be
explored in future research. Second, though it is the most commonly-used method for assessing
special education status, utilizing the IEP indicator may not be as accurate as would be ideal for
causal research since it relies on school office staff to indicating the presence of an IEP on file or
not. However, it was also the best option given the sheer amount of missing data on teacher

138
surveys (which is also a limitation in itself). Third, analyses excluded students who had an IEP in
Kindergarten. Likely, this excluded students with more severe disabilities who had services put
in place during the transition to school, but it could have also excluded some early-serviced
students who had completed their evaluations and referral prior to first grade. It is impossible to
disentangle these two groups given the timing of data collection on special education status,
which is why this study included only students who did not have an IEP at the first timepoint
(spring Kindergarten) for internal validity. Fourth, differences in special educational policy
implementation between schools and districts have been noted and may contribute to different
rates of identification in these areas (e.g., Alston, 2002; Dhuey & Lipscomb, 2013). However,
including school variables in propensity matching served to at least reduce these between-group
differences and lessen this threat to external validity.
Fifth and finally, the ECLS-K:1998 did not collect data in 2nd, 4th, 6th, or 7th grades,
which would have provided stronger and more sensitive estimates of effectiveness through
elementary school. The ELCS-K:1998 is also older data collected before the implementation of
the No Child Left Behind Act (2001) and the Individuals with Disabilities Education
Improvement Act (2004), both of which had important consequences for K-12 special education.
Therefore, this study warrants replication with newer data (such as the ECLS-K:2011). At the
time of data analysis, the ECLS-K:2011 did not have enough available waves of data to
investigate the longitudinal influence of special education beyond the first few years of
schooling. Thus, the ECLS-K:1998 was the best available dataset to answer these questions
pertaining to special education effectiveness.
Conclusion
This study presents a more statistically rigorous take on the effectiveness of special

139
education services. By matching students who receive earlier or later services in a sample of only
special education students, these analyses not only removed the problem of a poor comparison
group, but also helped to clarify when services are most effective. The possible existence of a
developmental timeframe during which special education services are most effective should be
of interest to a diverse body of scientists, parents, and practitioners. Results speak to the long-
held assumption that earlier services produce better outcomes, and support both educators and
parents who advocate for special educational assistance among young children. Moreover, by
demonstrating the differences between students receiving services at different timepoints, this
study suggests caution for researchers interested in further approximating the causal estimates of
special education service receipt when matching "otherwise-similar" students who receive
services at different timepoints. Policymakers should situate these results among other studies
demonstrating the positive impacts of early special education services and should orient
researchers to understanding why some students fail to receive services until later in schooling.
Overall, results indicate that early services are associated with better reading performance, and
that these effects may persist throughout most of elementary school.

140
References
Alston, J. A. (2002). Multi-leadership in urban schools: Shifting paradigms for administration
and supervision in the new millennium. University Press of America.
Bailey, D., Duncan, G. J., Odgers, C. L., & Yu, W. (2017). Persistence and fadeout in the
impacts of child and adolescent interventions. Journal of Research on Educational
Effectiveness, 10(1), 7–39. http://dx.doi.org/10.1080/19345747.2016.1232459
Ballou, D. (2002). Sizing up test scores. Education Next. Retrieved from
http://educationnext.org/files/ednext20022_10.pdf
Becker, S. O., & Ichino, A. (2002). Estimation of average treatment effects based on propensity
scores. The Stata Journal, 2(4), 358-377. Retrieved from
https://pdfs.semanticscholar.org/05c8/3d53caeac8ba286f3fdbe0c71a2d254f3e39.pdf
Bloom, H. S., & Weiland, C. (2015). Quantifying variation in Head Start effects on young
children's cognitive and socio-emotional skills using data from the National Head Start
Impact Study. Retrieved from https://files.eric.ed.gov/fulltext/ED558509.pdf
Briesch, A. M., Ferguson, T. D., Volpe, R. J., & Briesch, J. M. (2013). Examining teachers’
perceptions of social-emotional and behavioral referral concerns. Remedial and Special
Education, 34(4), 249-256. https://dx.doi.org/10.1177/0741932512464579
Burns, M. K., & Ysseldyke, J. E. (2009). Reported prevalence of evidence-based instructional
practices in special education. The Journal of Special Education, 43(1), 3-11.
http://dx.doi.org/10.1177/0022466908315563
Chesmore, A. A., Ou, S. R., & Reynolds, A. J. (2016). Childhood placement in special education
and adult well-being. The Journal of Special Education, 50(2), 109-120.
http://dx.doi.org/10.1177/0022466915624413

141
Collins, K. M., Connor, D., Ferri, B., Gallagher, D., & Samson, J. F. (2016). Dangerous
assumptions and unspoken limitations: A disability studies in education response to
Morgan, Farkas, Hillemeier, Mattison, Maczuga, Li, and Cook (2015). Multiple Voices
for Ethnically Diverse Exceptional Learners, 16(1), 4-16. Retrieved from
http://multiplevoicesjournal.org/doi/abs/10.5555/2158-396X.16.1.4?code=ddel-site
Dhuey, E., & Lipscomb, S. (2013). Funding special education by total district enrollment:
Advantages, disadvantages, and policy considerations. Education Finance and
Policy, 8(3), 316-331. http://dx.doi.org/10.1162/EDFP_a_00098
Ehrhardt, J., Huntington, N., Molino, J., & Barbaresi, W. (2013). Special education and later
academic achievement. Journal of Developmental & Behavioral Pediatrics, 34(2), 111-
119. http://dx.doi.org/10.1097/DBP.0b013e31827df53f
Frisco, M. L., Muller, C., & Frank, K. (2007). Parents’ union dissolution and adolescents’ school
performance: Comparing methodological approaches. Journal of Marriage and
Family, 69(3), 721-741. http://dx.doi.org/10.1111/j.1741-3737.2007.00402.x
Gresham, F. M., & Elliott, S. N. (1990). Social skills rating system (SSRS). Circle Pines, MN:
American Guidance Service.
Hanushek, E. A., Kain, J. F., & Rivkin, S. G. (2002). Inferring Program Effects for Special
Populations: Does Special Education Raise Achievement for Students with Disabilities? The
Review of Economics and Statistics, 84(4), 584–599.
http://doi.org/10.1162/003465302760556431
Hosp, J. L., & Reschly, D. J. (2004). Disproportionate representation of minority students in
special education: Academic, demographic, and economic predictors. Exceptional
Children, 70(2), 185-199. https://dx.doi.org/10.1177/001440290407000204

142
Individuals with Disabilities Education Act, 20 U.S.C. § 1400 (2004).
Ioannidis, J. P. A. (2008). Why most discovered true associations are inflated. Epidemiology,
19(5), 640-648. http://dx.doi.org/10.1097/EDE.0b013e31818131e7
Kish, L. (1965). Survey Sampling. New York: Wiley.
Lee, K., & Rispoli, K. (2016). Effects of individualized education programs on cognitive
outcomes for children with disabilities in Head Start programs. Journal of Social Service
Research, 42(4), 533-547. http://dx.doi.org/10.1080/01488376.2016.1185075
Marder, C. (2009). Facts from SEELS: Perspectives on students’ primary disability
classifications. Washington, D.C.: U.S. Department of Education, Office of Special
Education Programs. Retrieved from
https://www.seels.net/info_reports/DisabilityClassif1.9.09.pdf
McCoy, D. C., Yoshikawa, H., Ziol-Guest, K. M., Duncan, G. J., Schindler, H. S., Magnuson,
K., ... & Shonkoff, J. P. (2017). Impacts of early childhood education on medium-and
long-term educational outcomes. Educational Researcher, 46(8), 474-487.
http://dx.doi.org/10.3102/0013189X17737739
Morgan, P. L., Frisco, M. L., Farkas, G., & Hibel, J. (2010). A Propensity Score Matching
Analysis of the Effects of Special Education Services. The Journal of Special Education,
43(4), 236–254. http://doi.org/10.1177/0022466908323007
Morgan, P. L., Farkas, G., Hillemeier, M. M., & Maczuga, S. (2012). Are minority children
disproportionately represented in early intervention and early childhood special
education?. Educational Researcher, 41(9), 339-351.
https://dx.doi.org/10.3102/0013189X12459678
Morgan, P. L., Farkas, G., & Wu, Q. (2009). Five-year growth trajectories of kindergarten

143
children with learning difficulties in mathematics. Journal of Learning Disabilities, 42(4),
306–321. http://doi.org/10.1177/0022219408331037
Morgan, P. L., Farkas, G., & Wu, Q. (2011). Kindergarten Children’s Growth Trajectories in
Reading and Mathematics: Who Falls Increasingly Behind? Journal of Learning
Disabilities, 44(5), 472–488. http://doi.org/10.1177/0022219411414010
Morgan, P. L., Frisco, M. L., Farkas, G., & Hibel, J. (2010). A Propensity Score Matching
Analysis of the Effects of Special Education Services. The Journal of Special Education,
43(4), 236–254. http://doi.org/10.1177/0022466908323007
National Assessment of Education Progress (2015). U.S. Department of Education, Institute of
Education Sciences, National Center for Education Statistics. Retrieved from
https://nces.ed.gov/nationsreportcard/
National Center for Education Statistics (2011). U.S. Department of Education, Institute of
Education Sciences. Retrieved from https://www2.ed.gov/programs/osepidea/618-
data/state-level-data-files/index.html#bcc
National Council on Disability (2002). Individuals with Disabilities Education Act
reauthorization: Where do we really stand? Washington, DC: National Council on
Disability. Retrieved from https://www.ncd.gov/rawmedia_repository/80188aac_
b880_4bb1_9e5e_d2daeb62efce.pdf
Peterson, C. A., Wall, S., Jeon, H. J., Swanson, M. E., Carta, J. J., Luze, G. J., & Eshbaugh, E.
(2011). Identification of disabilities and service receipt among preschool children living
in poverty. The Journal of Special Education, 47(1), 28-40.
https://dx.doi.org/10.1177/0022466911407073
Phillips, D. A. & Meloy, M. E. (2012) High-quality school-based pre-K can boost early learning

144
for children with special needs. Exceptional Children, 78(4), 471-490.
http://dx.doi.org/10.1177/001440291207800405
Reedy, K. (2004). Response to intervention: A promising alternative to identifying students with
learning disabilities. In R&D Alert: When Special Education and General Education
Unite, Everyone Benefits. WestEd.
Reynolds, A. J., & Wolfe, B. (1999). Special education and school achievement: An exploratory
analysis with a central-city sample. Educational Evaluation and Policy Analysis, 21(3),
249-269. https://doi.org/10.3102%2F01623737021003249
Rock, D. A. (2007). A note on gain scores and their interpretation in developmental models
designed to measure change in the early school years. ETS Research Report
Series, 2007(1). http://dx.doi.org/10.1002/j.2333-8504.2007.tb02050.x
Schneider, B., Carnoy, M., Kilpatrick, J., Schmidt, W. H., & Shavelson, R. J. (2007). Estimating
causal effects using experimental and observational design. Washington, DC: American
Educational & Research Association.
Shifrer, D. (2013). Stigma of a Label. Journal of Health and Social Behavior, 54(4), 462–480.
http://doi.org/10.1177/0022146513503346
Sullivan, A. L., & Bal, A. (2013). Disproportionality in special education: Effects of individual
and school variables on disability risk. Exceptional Children, 79(4), 475-494.
https://dx.doi.org/10.1177/001440291307900406
Sullivan, A. L., & Field, S. (2013). Do preschool special education services make a difference in
kindergarten reading and mathematics skills? A propensity score weighting
analysis. Journal of School Psychology, 51(2), 243-260.
http://dx.doi.org/10.1016/j.jsp.2012.12.004

145
Sullivan, A. L., & Proctor, S. L. (2016). The shield or the sword? Revisiting the debate on racial
disproportionality in special education and implications for school psychologists. School
Psychology Forum: Research in Practice, 10(3), 278–288.
Weiland, C. (2016). Impacts of the Boston prekindergarten program on the school readiness of
young children with special needs. Developmental Psychology, 52(11), 1763.
http://dx.doi.org/10.1037/dev0000168
Wolery, M., & Bailey Jr, D. B. (2002). Early childhood special education research. Journal of
Early Intervention, 25(2), 88-99. http://dx.doi.org/10.1177/105381510202500204
Woods, A. D., Morrison, F. J., & Palincsar, A. S. (2017). Perceptions of communication
practices among stakeholders in special education. The Journal of Emotional and
Behavioral Disorders, 1063426617733716. http://dx.doi.org/10.1177/1063426617733716

146
Table IV.1 Balance of the Propensity Scores for Spring 1st Grade Placement (n = 640)
1st Grade Special Education
N = 230
1st Grade General Education
N = 410
Stratum n M SD n M SD
1 27 .15 .04 136 .13 .04
2 18 .25 .03 103 .24 .03
3 39 .35 .03 64 .35 .03
4 78 .50 .06 72 .48 .06
5 54 .68 .06 30 .67 .06
6 18 .87 .04 4 .87 .07

147
Table IV.2 Balance of the Propensity Scores for Spring 3rd Grade Placement (n = 250)
3rd Grade Special Education
N = 160
3rd Grade General Education
N = 90
Stratum n M SD n M SD
1 4 .18 .01 12 .11 .05
2 17 .32 .05 23 .30 .06
3 17 .52 .06 25 .47 .05
4 34 .71 .06 21 .67 .05
5 92 .92 .05 10 .88 .05

148
Table IV.3 Estimated Effects of Spring 1st Grade Special Education Services on 3rd And 5th Grade Academic Outcomes
Stratification Nearest-Neighbor Kernel Matching Summary
ATT ES ATT ES ATT ES ES 95% CI
Reading IRT score 3rd 5.95** .26 7.00** .30 6.12* .27 .28 .09, .46
Reading Gain K-3rd 5.21*** .29 6.12*** .34 5.34*** .29 .31 .12, .50
Reading IRT score 5th 7.31*** .27 10.16*** .38 7.27** .27 .31 .12, .49
Reading Gain K-5th 614*** .28 8.46*** .38 6.22** .28 .31 .12, .51
Math IRT score 3rd 3.16 .16 3.31 .17 3.44* .18 .17 -.01, .35
Math Gain K-3rd 0.81 .08 2.44 .18 2.59* .19 .16 -.04, .35
Math IRT score 5th 6.25** .25 9.35*** .37 6.44** .25 .29 .09, .49
Math Gain K-5th 2.60 .17 7.48*** .37 5.02** .25 .27 .06, .48 Note: ATT=Average Treatment on Treated; ES=Effect Size; CI=Confidence Intervals
Benjamini-Hochberg corrected significance levels: *p < .05, **p < .01, ***p < .001

149
Table IV.4 Estimated Effects of Spring 1st Grade Special Education Services on 3rd And 5th Grade Behavioral Adjustment
Stratification Nearest-Neighbor Kernel Matching Summary
ATT ES ATT ES ATT ES ES 95% CI
App. to Learning 3rd 0.11 .16 0.07 .10 0.12+ .18 .15 -.05, .35
App. Learning Gain K-3rd 0.09 .13 0.11 .16 0.11 .16 .15 -.05, .35
App. to Learning 5th 0.15+ .23 0.11 .16 0.16 .23 .21 .01, .41
App. Learning Gain K-5th 0.09 .13 0.08 .10 0.10 .14 .13 -.08, .33
Self-Control 3rd Grade -0.06 .09 -0.05 .07 -0.04 .05 .07 -.14, .28
Self-Control Gain K-3rd -0.05 .07 0.02 .02 -0.04 .05 .05 -.16, .25
Self-Control 5th Grade 0.06 .09 0.02 .03 0.06 .10 .07 -.13, .27
Self-Control Gain K-5th 0.03 .04 0.03 .04 0.02 .03 .03 -.17, .24
Interpersonal Skills 3rd -0.01 .02 -0.03 .04 0.02 .02 .03 -.19, .24
Interpersonal Gain K-3rd 0.01 .01 0.01 .01 0.01 .01 .01 -.19, .22
Interpersonal Skills 5th 0.11 .17 0.09 .14 0.14+ .21 .18 -.03, .38
Interpersonal Gain K-5th 0.10 .14 0.08 .11 0.11 .15 .13 -.08, .34
Externalizing Probs 3rd -0.04 .06 -0.11 .15 -0.07 .09 .10 -.10, .31
Externalizing Gain K-3rd -0.03 .04 -0.13 .18 -0.03 .04 .08 -.12, .28
Externalizing Probs 5th -0.03 .05 0.02 .03 -0.04 .06 .05 -.16, .25
Externalizing Gain K-5th -0.01 .01 0.03 .04 0.01 .01 .02 -.19, .23
Internalizing Probs 3rd -0.10 .15 -0.08 .12 -0.08 .13 .13 -.08, .35
Internalizing Gain K-3rd -0.04 .05 -0.12 .16 -0.01 .02 .07 -.15, .30
Internalizing Probs 5th -0.06 .11 -0.03 .05 -0.05 .08 .08 -.13, .28
Internalizing Gain K-5th 0.02 .03 0.01 .01 0.05 .07 .04 -.18, .26 Note: ATT=Average Treatment on Treated; ES=Effect Size; CI=Confidence Intervals
Benjamini-Hochberg corrected significance levels: +p < .10

150
Table IV.5 Estimated Effects of Spring 3rd Grade Special Education Services on 5th Grade Academic Outcomes
Stratification Nearest-Neighbor Kernel Matching Summary
ATT ES ATT ES ATT ES ES 95% CI
Reading IRT score 5th Grade -0.67 0.03 -4.74 0.18 -1.37 .05 0.10 -.36, .56
Reading Gain 1st-5th 3.84 0.21 -1.04 0.05 3.60 .20 0.13 -.27, .54
Math IRT score 5th Grade -3.28 0.13 -6.93 0.27 -5.20 .21 0.22 -.20, .65
Math Gain 1st-5th 0.05 0.00 -3.53 0.23 -0.41 .03 0.11 -.33, .55 Note: ATT=Average Treatment on Treated; ES=Effect Size; CI=Confidence Intervals

151
Table IV.6 Estimated Effects of Spring 3rd Grade Special Education Services on 5th Grade Behavioral Adjustment
Stratification Nearest-Neighbor Kernel Matching Summary
ATT ES ATT ES ATT ES ES 95% CI
App. Learning 5th Grade -0.01 0.02 0.17 0.24 -0.05 0.07 0.14 -.31, .59
App. Learning Gain 1st-5th 0.00 0.00 -0.02 0.02 0.00 0.00 0.01 -.38, .40
Self-Control 5th Grade -0.10 0.15 0.10 0.15 -0.12 0.18 0.17 -.28, .61
Self-Control Gain 1st-5th -0.19 0.27 -0.34 0.47 -0.27+ 0.39 0.41 -.02, .84
Interpersonal Skills 5th Grade -0.03 0.05 0.16 0.25 -0.05 0.08 0.15 -.32, .62
Interpersonal Gain 1st-5th -0.04 0.06 -0.14 0.19 -0.09 0.12 0.15 -.37, .66
Externalizing Probs 5th Grade 0.10 0.15 -0.10 0.15 0.10 0.15 0.15 -.28, .57
Externalizing Gain 1st-5th 0.08 0.11 0.22 0.30 0.08 0.12 0.20 -.25, .64
Internalizing Probs 5th Grade 0.05 0.09 -0.12 0.20 0.03 0.05 0.12 -.30, .54
Internalizing Gain 1st-5th 0.11 0.15 -0.11 0.15 -0.01 0.01 0.08 -.36, .53 Note: ATT=Average Treatment Effect on Treated; ES=Effect Size; CI=Confidence Intervals
Benajamini-Hochberg corrected significance levels: +p < .10

152
Table IV.7 Descriptive Statistics for Subsample of First-Graders (n = 180) and Third-Graders
(n = 310) with Linked Special Education Teacher Survey Data
1st Grade IEP
% or M (SD)
3rd Grade IEP
% or M (SD) p-value
Primary Disability
Learning Disability 33.0 57.8 .000
Speech or Language Impairment 39.8 22.2 .000
Developmental Delay 5.7 1.0 .002
Other Disability 21.6 16.0 .124
IEP Goals
Reading 57.4 73.0 .000
Mathematics 47.2 42.0 .268
Language Arts 46.0 66.1 .000
Auditory Processing 25.6 14.3 .002
Listening Comprehension 29.5 17.6 .002
Oral Expression 54.0 20.8 .000
Social Skills 17.6 12.7 .141
Adaptive Behavior 8.0 6.5 .535
Fine Motor Skills 14.8 10.1 .124
Gross Motor Skills 9.1 3.3 .007
Orientation/Mobility 6.3 0.1 .000
Hours/Week of Special Ed. 6.97 (8.30) 6.36 (8.54) .448
Types of Services Received
Audiology 3.9 5.4 .459
Counseling 12.9 15.1 .505
Occupational Therapy 11.7 9.3 .401
Physical Therapy 4.4 1.6 .065
Psychological Services 3.9 4.4 .792
School Health Services 10.7 6.0 .063
Social Work Services 5.0 6.4 .528
Language Therapy 64.0 45.7 .000
Other Services 8.3 6.3 .408
Primary Placement in Gen Ed. 84.4 89.9 .073
Time Outside Gen Ed. 3.01 (1.45) 3.08 (1.25) .575
Special Services Rendered
One-On-One Instruction 80.1 79.4 .853
Small Group Instruction 92.3 96.5 .040
Large Group Instruction 32.3 64.8 .000
Cooperative Learning 52.5 65.7 .004
Peer Tutoring 32.0 45.1 .004
Direct Instruction 85.1 89.0 .206
Cognitive Strategies 61.3 62.7 .758
Self-Management 44.8 51.6 .146
Behavior Management 41.4 37.5 .393

153
Curricular Modifications
General Ed. Curriculum 45.3 27.3 .000
Some Modifications 37.7 53.9 .001
Substantial Modifications 13.2 15.5 .515
Specialized Curriculum 0.6 0.0 .202
% General Ed. Goals Expected to Achieve 1.78 (.91) 1.78 (.76) 1.000
% IEP Goals Met 2.50 (1.19) 2.08 (1.05) .001

154
Figure IV.1 Publicly-Available Data Provided by The National Center for Education Statistics
(2011) Contrasting the Proportion of U.S. Students Aged 6-11 with Speech/Language
Impairments versus Learning Disabilities
0.00
0.10
0.20
0.30
0.40
0.50
0.60
Age 6 Age 7 Age 8 Age 9 Age 10 Age 11
Per
cent
of
All
Stu
den
ts i
n S
pE
d
National Center for Education Statistics (2011)
Primary Special Education Diagnosis by Age
Speech/Language Learning Disabilities

155
CHAPTER V
Conclusion:
What Does Examining Developmental Trajectories Tell Us About Special Education?
Implications Within and Across Studies
The three studies of this dissertation weave together a clearer picture of who receives
special education services, at what developmental timepoints, and where, as well as what are the
consequences of receiving services at different timepoints during K-8 schooling. First, Study 1
demonstrated that students follow different trajectories through the special education system, and
that these trajectories are composed of students from varied backgrounds. Although prior studies
have revealed global risk factors for special education placement, Study 1 demonstrates that
precursors to and consequences of special education placement differ according to pattern of
service receipt – not just the category in which students are served. This also helps to clarify
differences within disability categories that may emerge in other research. For instance, a
Kindergarten student with a speech or language impairment (SLI) who follows the Persistent
trajectory may be older at school entry, have poorer mathematics skills, and poorer learning-
related behaviors than a Kindergarten student with SLI who follows the Terminal trajectory.
However, in research assessing the timing of first identification or consequences of having an
IEP for SLI during the first few years of schooling, these two types of students may be collapsed
into the same category, so these differences would be washed out. In sum, this study aids in
understanding why and how the experiences of some students in special education are markedly

156
different than others, and ultimately may allow for more precise intervention targeting.
Study 2 contextualized the results of Study 1 within schools. Not only do students have
diverse experiences within the special education system, but there has been speculation that their
experiences with identification and service receipt may be dependent in some part on the type of
school that they attend. Indeed, Study 2 revealed that schools are important in predicting which
students receive special education, but that individual data is more important. At the very least,
one could argue that a more mildly impaired student's likelihood of receiving special education
services depends in part on the school they attend. Therefore, future analyses predicting special
education placement need to account for clustered data, though it would be preferable to include
a few school-level predictors such as the proportion of students with disabilities in the school and
a measure of urbanicity.
Another important implication from Study 2 is that students with parent-reported
disabilities get the earliest services. (This also aligns with findings from Study 1 in which
students following the Persistent and Terminal trajectories – i.e., the students who received the
earliest services – appeared more likely to have a parent-reported disability in Kindergarten than
students following the Delayed category.) Then, as time progressed, whether a child received a
disability diagnosis did little to change their likelihood of service receipt over time. Instead, their
mother's highest education level was the most important predictor of change over time.
Therefore, students may be more likely to receive special education if their parent is able to
advocate for this educational service – a point that is supported by prior research finding that
parents who are more able to communicate with their school, more able to understand the
legalese of the IEP, and more able to recognize problems with their child and/or advocate for
services are more apt to get services in place (Fitzgerald & Watkins, 2006; Howland et al., 2006;

157
Trainor, 2010). Interestingly, maternal education had an even larger influence on whether the
child received services over time than academic achievement. Overall, Study 2 clarifies how
differences between schools contribute to special education placement, and which factors predict
who receives services both initially and over time.
Lastly, Study 3 provided a more practical answer to the question of "so, what?" – in other
words, why does it matter if students from diverse backgrounds experience varied trajectories
through the special education system? Primarily, this study revealed that different academic
outcomes may be a function of receiving services at different timepoints, and that students who
receive earlier or later services may also come from substantively different populations. Results
support the idea that earlier services produce better outcomes, particularly for reading
achievement. However, students who receive earlier services may also be served more often for
SLI as opposed to LD, which might also be easier to remediate. This is an important
counterfactual to address in future research because it implies that prior evaluations of special
education effectiveness could be more strongly tied to student-level background characteristics
than to receiving services themselves. Study 3 reduced the impact of this problem by matching
similar students who were "equally" likely to receive similar services at a given timepoint (but
only some of whom did receive those services) and comparing them to students who did not
receive special education until later. This analytical method revealed that earlier special
education services continue to produce larger reading effects through 5th grade, but that earlier or
later services do not differentially impact behavior or mathematics outcomes.
Findings from Study 3 also provide insight into prior studies on special education
effectiveness. Specifically, results suggest that prior research may be over- or understating the
effects of service receipt even while using statistically rigorous, quasi-experimental methods. In

158
other words, it is incorrect to make broad claims about the (in)effectiveness of special education
by simply picking a baseline pre-test point and an outcome post-test point without accounting for
developmental trajectories. Studies need to account for the facts that 1) general education
students are a poor comparison group because they do not have a disability requiring special
education intervention; 2) students have varying special educational needs at certain
developmental time periods; and 3) the goals of special education and services delivered vary
widely at different developmental time periods. Within the context of longitudinal trajectories of
special education, Study 3 demonstrated that although the initial timing of service receipt matters
for later outcomes, it matters beyond the simple conclusion that "earlier is better."
Theoretical Implications
Beyond these study-specific implications, there were several noteworthy findings within
this dissertation. First, there were no race/ethnicity findings in either of the first two studies. In
other words, non-White students were no more or less likely to follow different trajectories of
service receipt, nor were their longitudinal likelihoods of placement differentially affected by the
school context. This is a very large departure from the literature on identification, which has
predominantly focused on issues of significant racial disproportionality and consistently found
that non-White students are underrepresented in special education (Morgan et al., 2015, 2017a,
2017b; but see also Hosp & Reschly, 2004; Skiba et al., 2008). However, with few exceptions
this literature has not focused on longitudinal trajectories of service receipt. It is therefore
possible that accounting for longitudinal pathways through the special education system washes
out any racial effects present at first identification.
To better illustrate this phenomenon, Table V.1 presents a simple visualization of the
proportion of White and Black students in the ECLS-K:1998 performing in the bottom 10th

159
percentile in reading at each year of data collection. At each wave cross-sectionally, there are
significantly fewer Black students with a reading score in the bottom 10th percentile who have an
IEP relative to White students in the bottom 10th percentile. Moreover, if one were to compare
the difference between White and Black students over time from Kindergarten to 5th grade (for
example), they would find that significantly more poorly-performing White students obtain an
IEP by 5th grade. This is consistent with existing literature (Morgan et al., 2015; Morgan et al.,
2017b). However, when examining the growth curves of Black and White students over time, the
shapes of these trajectories do not appear to significantly differ. This latter point is demonstrated
throughout my dissertation, which consistently failed to find evidence that race/ethnicity
significantly predicted trajectories of special education service receipt. In other words, though
there may be differences in the proportions of White and non-White students receiving special
education services both concurrently and over time, these students follow relatively similar
longitudinal pathways through the K-8 special education system. This is an important caveat for
both researchers and policymakers who have been following this disproportionality debate and
provides a point of caution to judgments about racial/ethnic representation in special education.
Another departure from previous literature regards the importance of individual academic
achievement in predicting special education service receipt. Though several authors have
regarded academic achievement as one of the most important variables to include in analyses
assessing identification (e.g., Donovan & Cross, 2002; Hosp & Reschly, 2004; Morgan et al.,
2016), here, achievement was predictive but not overly so. The effect sizes for reading and
mathematics were some of the smallest relative to other predictors (e.g., male sex, cognitive
stimulation in the home, private school attendance) in predicting the likelihoods of following
various special education trajectories in Study 1. In Study 2, though consistently predictive,

160
better academic achievement decreased the likelihood of special education status by only 2
percent in Kindergarten and by 1 percent over time.
However, parsing out the importance of individual achievement across studies reveals
interesting truths about methods used to assess both precursors to and consequences of
placement. For example, in Study 1 the descriptive statistics reveal that students Persistently
receiving special education services appear to have the poorest long-term academic outcomes,
while those in the Terminal category have the best academic outcomes (second only to general
education students). Conversely, Study 3 finds that students who receive these early services
have better academic outcomes than those receiving later services. This comparison is especially
useful in illustrating why researchers should not assess or predict the effects of special education
services at only one timepoint and ignore these longitudinal pathways. On the other hand, there
may have been students with more severe disabilities captured by Study 1's Persistent category
than were represented in Study 3's analytical sample, as none of this latter group received
services in Kindergarten while most of the Persistent group did. Indeed, only 29 percent of the
Persistent category who received 1st grade special education services would have been analyzed
in Study 3, while 45 percent of the Terminal category would have been analyzed (see Table II.3).
Therefore, the students receiving earlier services in Study 3 may have had milder disabilities that
were more amenable to special education intervention. If the students in the Persistent category
require the most intensive intervention, this would not only explain their reduced academic
outcomes, but why they had services put in place during Kindergarten. This would also align
with the results of Study 2 finding that the students who have services during Kindergarten are
significantly more likely to have a parent-reported disability.

161
Future Directions
One problem facing both educators and researchers regards our ability to identify and
remediate different types of impairments. For instance, Study 3 suggests that educators may be
relatively good at the early identification and remediation of SLI or early literacy issues.
However, special educational needs emerging later in development may be both harder to
identify and remediate, given the nonsignificant effect of later service receipt in Study 3. There
could also be more mathematics disabilities in this later-identified group, particularly since
mathematics as a discipline is not taught as intensively in early schooling as reading/literacy
(Early et al., 2010). To this point, students who received services for the first time in 3rd grade
had lower math scores than students who received initial services in 5th or 8th grade. Perhaps we
are not as good at remediating math disabilities as we are at remediating literacy or speech
disabilities, which is why outcomes did not appear to improve in the same way as for students
receiving earlier services. Students who receive later services may also be a more diverse group
relative to those who experience special education within the first few years of formal schooling.
Evidence suggests that behavioral difficulties interrelate with academic difficulties throughout
elementary school (e.g., Lin, Morgan, Farkas, Hillemeier, & Cook, 2013; Morgan, Farkas, &
Wu, 2009), which may contribute to more difficulty remediating later-identified students.
In any case, it is imperative that we understand these students who are receiving delayed
services. Why were these students not referred earlier? Why was this group so heterogeneous?
Why were their learning problems not remediated in the same way as they were for the 1st
graders who received services? The answers to these questions may provide practical guidance
for educators working with at-risk students. If interventions are not designed to address
heterogeneity in student needs at various stages in development, they will fail large groups of

162
children. In the meantime, educators should continue to push for the earliest possible referrals to
special education, since these appear to be associated with the best literacy outcomes regardless
of diagnosis, IEP goals, or the amount of special educational services received.
Another future direction regards the importance of disentangling the covariate pathway
contributing to disability identification and/or special education referral. As demonstrated in
Studies 1 and 2, parent-reported disability status was one of the largest predictors of early special
education placement. This is an important point because the factors that predict the likelihood of
having a disability may differ from those that predict the likelihood of receiving special
education services, but this difference is often glossed over. For instance, low birthweight is
more prevalent among Black children and has been linked to increased risk for cognitive delay or
disability (Morgan et al., 2015; Grunau, Whitfield, & Davis, 2002), which may indirectly boost
the likelihood of special education placement. However, though a student may have a disability,
the student is ineligible for special education if their disability does not adversely affect
educational performance. To my knowledge, no research has modeled the varying risk pathways
leading up to and moving between both disability identification and special education
identification. This oversight may lead to research studying the likelihood of disability
identification yet making claims about special education placement when the appropriate
predictors have not been modeled, and vice versa (for further discussion, see Donovan & Cross,
2002; Hosp & Reschly, 2004; Morgan et al., 2016; Wu, Morgan, & Farkas, 2014). Exploring
these covariate pathways will offer clarity to future researchers interested in correctly modeling
risk for special education placement.
Conclusion
Written about a decade after the Education for all Handicapped Children Act, Gerber and

163
Semmel (1984) believed that characterizing a child based on statistical deviations from the norm
represented an intolerance of social institutions to accommodate individual differences in
learners. They asserted that existing state and federal policy would result in children who are
identified for special education not on the basis of disability, but as "a function of how and why
one chooses to measure these characteristics" (p.137). Thirty years later, their unfortunate
prediction seems to align with the presence of population-level patterns in special education
enrollment based on individual- and school-level characteristics, indicating at least some
systemic bias.
This dissertation represents an important step toward understanding the full measure of
these inequities. Addressing the questions of who is placed in special education? and what
happens after they are placed? within developmental trajectories of service receipt served to
clarify inconsistencies and oversimplifications, as well as to extend and validate existing
research. Moreover, this dissertation demonstrated that accounting for developmental trajectories
of service receipt partially explains the paradox of special education, in which early
identification has been coupled with poorer academic achievement across primary schooling.
This not only has enormous policy consequences but supports the idea that research in special
education must be more strongly bridged with developmental psychology. As a field, we sorely
need an interdisciplinary focus at pathways through which disorder and disability manifest in
schools, as well as which students then receive special education services over time. In addition,
addressing special education identification from this framework may clarify for whom special
education is most effective. It is my hope that this dissertation can therefore help illuminate
systemic factors influencing service delivery and push toward identifying the students who
would be most benefitted by specialized services in various educational environments.

164
References
Donovan, M. S., & Cross, C. T. (Eds.). (2002). Minority Students in Gifted and Special
Education. Washington, DC: National Academy Press.
Early, D. M., Iruka, I. U., Ritchie, S., Barbarin, O. A., Winn, D. M. C., Crawford, G. M., ... &
Bryant, D. M. (2010). How do pre-kindergarteners spend their time? Gender, ethnicity,
and income as predictors of experiences in pre-kindergarten classrooms. Early Childhood
Research Quarterly, 25(2), 177-193. https://doi.org/10.1016/j.ecresq.2009.10.003
Fitzgerald, J. L., & Watkins, M. W. (2006). Parents' rights in special education: The readability
of procedural safeguards. Exceptional Children, 72(4), 497-510.
http://dx.doi.org/10.1177/001440290607200407
Gerber, M. M., & Semmel, M. I. (1984). Teacher as imperfect test: Reconceptualizing the
referral process. Educational Psychologist, 19(3), 137-148.
http://dx.doi.org/10.1080/00461528409529290
Grunau, R. E., Whitfield, M. F., & Davis, C. (2002). Pattern of learning disabilities in children
with extremely low birth weight and broadly average intelligence. Archives of Pediatrics
& Adolescent Medicine, 156(6), 615-620. http://dx.doi.org/10.1001/archpedi.156.6.615
Hosp, J. L., & Reschly, D. J. (2004). Disproportionate representation of minority students in
special education: Academic, demographic, and economic predictors. Exceptional
Children, 70(2), 185-199. https://dx.doi.org/10.1177/001440290407000204
Howland, A., Anderson, J. A., Smiley, A. D., & Abbott, D. J. (2006). School liaisons: Bridging
the gap between home and school. School Community Journal, 16, 47–68. Retrieved
from https://eric.ed.gov/?id=EJ794797
Lin, Y., Morgan, P. L., Farkas, G., Hillemeier, M. M., & Cook, M. (2013). Reading,

165
Mathematics, and Behavioral Difficulties Interrelate: Evidence from a Cross-lagged
Panel Design and Population-based Sample. Behavioral Disorders, 38(4), 212–227.
http://doi.org/10.1002/nbm.3369.Three
Morgan, P. L., Farkas, G., & Wu, Q. (2009). Five-year growth trajectories of kindergarten
children with learning difficulties in mathematics. Journal of Learning Disabilities,
42(4), 306–321. http://doi.org/10.1177/0022219408331037
Morgan, P. L., Farkas, G., Hillemeier, M. M., Mattison, R., Maczuga, S., Li, H., & Cook, M.
(2015). Minorities are disproportionately underrepresented in special education:
Longitudinal evidence across five disability conditions. Educational Researcher, 44(5),
278-292. https://dx.doi.org/10.3102/0013189X15591157
Morgan, P. L., Farkas, G., Cook, M., Strassfeld, N. M., Hillemeier, M. M., Pun, W. H., &
Schussler, D. L. (2017a). Are Black children disproportionately overrepresented in
special education? A best-evidence synthesis. Exceptional Children, 83(2), 181-198.
http://dx.doi.org/10.1177/0014402916664042
Morgan, P. L., Farkas, G., Hillemeier, M. M., & Maczuga, S. (2017b). Replicated evidence of
racial and ethnic disparities in disability identification in US schools. Educational
Researcher, 46(6), 305-322. https://doi.org/10.3102%2F0013189X17726282
Skiba, R. J., Simmons, A. B., Ritter, S., Gibb, A. C., Rausch, M. K., Cuadrado, J., & Chung, C.
G. (2008). Achieving equity in special education: History, status, and current
challenges. Exceptional Children, 74(3), 264-288.
http://dx.doi.org/10.1177/001440290807400301
Trainor, A. A. (2010). Diverse approaches to parent advocacy during special education home—

166
school interactions: Identification and use of cultural and social capital. Remedial and
Special Education, 31(1), 34-47. http://dx.doi.org/10.1177/0741932508324401
Wu, Q., Morgan, P. L., & Farkas, G. (2014). Does Minority Status Increase the Effect of
Disability Status on Elementary Schoolchildren’s Academic Achievement? Remedial and
Special Education, 35(6), 366-377. http://dx.doi.org/10.1177/0741932514547644

167
Figure V.1. Percent of Black and White Students with an IEP who Score in the Bottom 10th
Percentile for Reading at Each Wave of Data Collection.
0
10
20
30
40
50
60
70
80
Kindergarten 1st Grade 3rd Grade 5th Grade 8th Grade
% w
ith a
n I
EP
Percent of Black and White Students with an IEP in the Bottom
10th Percentile (Reading)
White
Black
White Trajectory
Black Trajectory

168
APPENDICES

169
Appendix A
Information and Justification for Home Environment and Parenting Variable Creation
Cognitively stimulating and enriched home environments have strong links with both brain
development (e.g., Kolb et al., 2012; Perry, 2002) and achievement (e.g., Bradley & Caldwell,
1984; Davis-Kean, 2005). To create the time-varying information about the home environment
and the child's experience with cognitive stimulation, variables capturing three broad constructs
available at each wave were summed and standardized (Table A.1). Predictors assessing
cognitive stimulation consisted of activities the child participated in, such as taking music
lessons or visiting the library, and the frequency with which they read outside of school.
Variables measuring home resources included whether the home had a library card or home
computer, how many books the child had (capped at 600 and then z-scored), and how safe it was
to play outdoors. Lastly, family routines and structure were assessed through predictors capturing
information about household rules and the number of days per week the family shared meals
together. The items within each block were summed together and standardized, and the resulting
three scores were again summed and standardized to create a composite variable assessing the
home environment and cognitive stimulation.
High quality parent-child interactions and parenting behaviors (e.g., reading books
together, attending museums or cultural events like sporting games) have also been demonstrated
to result in improved educational expectations and outcomes (Hao & Bonstead-Bruns, 1998;
Davis-Kean, 2005). To create the time-varying information about parenting behaviors (Table

170
A.2), variables capturing four broad constructs at each wave were utilized. First, items measuring
the frequency of parent-child interactions, such as reading to the child, telling stories, or singing
songs, were averaged together into one score. Next, two variables measuring help with
homework were re-scaled into a 1-4 scale (response category 6 was dropped) and averaged
together. A block of variables assessing parents' conversations with children, including
discussing friends, drug use, and sexual activity, was also averaged into one score. Lastly, a
block of variables assessing household rules and parent-child relationships (available only in the
8th grade wave of data collection) were averaged together. Each of these blocks were then
averaged into one score and standardized to capture general parenting behaviors.
Finally, parents' educational expectations for their children strongly influence educational
attainment (e.g., Fan & Chen, 2001; Englund, Luckner, Whaley, & Egeland, 2004), and these
expectations are negatively impacted by disability status (Shifrer, 2013). Educational
expectations were assessed using a question at each wave asking parents what academic degree
they expected of their child (with 1 = to receive less than a high school diploma, and 6 = to finish
a PhD, MD, or other advanced degree).

171
References
Bradley, R. H., & Caldwell, B. M. (1984). The relation of infants' home environments to
achievement test performance in first grade: A follow-up study. Child Development,
55(3), 803-809. http://dx.doi.org/10.2307/1130131
Davis-Kean, P. E. (2005). The influence of parent education and family income on child
achievement: the indirect role of parental expectations and the home
environment. Journal of Family Psychology, 19(2), 294-304.
https://dx.doi.org/10.1037/0893-3200.19.2.294
Englund, M. M., Luckner, A. E., Whaley, G. J., & Egeland, B. (2004). Children's achievement in
early elementary school: Longitudinal effects of parental involvement, expectations, and
quality of assistance. Journal of Educational Psychology, 96(4), 723-730.
http://dx.doi.org/10.1037/0022-0663.96.4.723
Fan, X., & Chen, M. (2001). Parental involvement and students' academic achievement: A meta-
analysis. Educational Psychology Review, 13(1), 1-22. Retrieved from
https://files.eric.ed.gov/fulltext/ED430048.pdf
Hao, L., and Bonstead-Bruns, M. (1998). Parent–child differences in educational expectations
and the academic achievement of immigrant and native students. Sociology of Education,
71(3), 175–198. http://dx.doi.org/10.2307/2673201
Kolb, B., Mychasiuk, R., Muhammad, A., Li, Y., Frost, D. O., & Gibb, R. (2012). Experience
and the developing prefrontal cortex. Proceedings of the National Academy of
Sciences, 109(Supplement 2), 17186-17193. http://dx.doi.org/10.1073/pnas.1121251109
Perry, B. D. (2002). Childhood experience and the expression of genetic potential: What

172
childhood neglect tells us about nature and nurture. Brain and Mind, 3(1), 79-100.
https://doi.org/10.1023/A:1016557824657
Shifrer, D. (2013). Stigma of a Label. Journal of Health and Social Behavior, 54(4), 462–480.
http://doi.org/10.1177/0022146513503346

173
Table A.1 Home Environment and Cognitive Stimulation Variable Creation Items
Variable Information and Scale
Grade Available K 1 3 5 8
1 COGNITIVE STIMULATION TAKES DANCE LESSONS (0/1) X X X X
PARTCP IN ATHLETIC EVENTS (0/1) X X X X
PARTICP IN ORGANIZED CLUBS (0/1) X X X X
TAKES MUSIC LESSONS (0/1) X X X X
TAKES ART LESSONS (0/1) X X X X
PARTCP IN ORGANIZED PERFORMING (0/1) X X X X
READ A BOOK IN LAST YEAR (0/1) X
FREQ READ OUTSIDE OF SCHOOL (1-4) X X X X
VISITED LIB IN PAST YEAR (0/1) X X
VISITED THE LIBRARY (PAST MONTH) (0/1) X X
GONE TO A PLAY, CONCERT, SHOWS (PAST MONTH) (0/1) X X
VISITED A MUSEUM (PAST MONTH) (0/1) X X
VISITED A ZOO, AQUARIUM (PAST MONTH) (0/1) X X
2 HOME RESOURCES
CHILD HAS OWN LIBRARY CARD (0/1) X X X
HAVE HOME COMPUTER CHILD USES (0/1) X X X X
HOW SAFE IN TO PLAY OUTSIDE (0-2) X X X X X
HOW MANY BOOKS CHILD HAS (0-600) – z-scored X X X
3 FAMILY RULES/STRUCTURE/ROUTINES
GO TO BED SAME TIME EACH NIGHT (0/1) X X X X
FAMILY RULES FOR TV (0/1) X X X
TV RULE HOW LATE WATCH TV (0/1) X X X
FAM RULES - HRS WEEKDAY TV (0/1) X X X
FAM RULES - HRS EACH WEEK TV (0/1) X X X
PLACE SET ASIDE FOR HOMEWORK (0/1) X X X
FAMILY RULES FOR GRADE PT AVG (0/1) X
FAMILY RULES FOR HOMEWORK (0/1) X
FAMILY RULES COMPUTER GAMES (0/1) X
# DAYS EAT BREAKFAST TOGETHER (0-7) X X X X X
# DAYS CHD EAT BRKFST REG TIME (0-7) X X X X X
# DAYS EAT DINNER TOGETHER (0-7) X X X X X
# DAYS EAT DINNER REG TIME (0-7) X X X X X
TOTAL NUMBER OF ITEMS 18 17 25 22 14

174
Table A.2 Parenting Quality and Behaviors Variable Creation Items
Variable Information and Scale
Grade Available K 1 3 5 8
1 PARENT-CHILD INTERACTION HOW OFTEN YOU READ TO CHILD (1-4) X X X
HOW OFTEN YOU TELL CHD STORIES (1-4) X X X
HOW OFTEN YOU ALL SING SONGS (1-4) X X X
HOW OFTEN YOU HELP CHD DO ART (1-4) X X X
HOW OFTEN CHILD DOES CHORES (1-4) X X X
HOW OFTEN YOU ALL PLAY GAMES (1-4) X X X
HOW OFTEN YOU TEACH CHD NATURE (1-4) X X X
HOW OFTEN YOU ALL BUILD THINGS (1-4) X X X
HOW OFTEN YOU ALL DO SPORTS (1-4) X X X
HOW OFTEN PRACTICE NUMBERS (1-4) X X
2 HELP WITH HOMEWORK
OFTEN HELP WITH READING HW (1-5) X X X
OFTEN HELP WITH MATH HW (1-5) X X X
3 CONVERSATIONS WITH CHILDREN
OFTEN TALK ABOUT DAY AT SCH (1-4) X X
OFTEN TALK ABOUT FRIENDS (1-4) X X
OFT TLK ABOUT SMKING/TOBACCO (1-4) X X
OFT TLK ABOUT ALCOHOLIC BVRG (1-4) X X
OFTEN TALK ABOUT SEX (1-4) X X
OFTEN TALK ABOUT DRUGS (1-4) X X
4 HOUSEHOLD RULES & PARENT-CHILD RELATIONSHIP
HOW OFT CHECK HOMEWORK (1-4) X
HOW OFT DISCUSS REPORT CARD (1-4) X
HOW OFT KNOW WHERE CHILD IS (1-4) X
HOW OFTEN SET CURFEWS (1-4) X
HOW OFTEN REQUIRE CHORES (1-4) X
OFTEN GET ALONG WELL WITH CHD (1-4) X
OFTEN MAKE DECISIONS TOGETHER (1-4) X
OFTEN DO NOT UNDERSTAND CHILD (1-4) – reversed X
OFTEN REALLY TRUST CHILD (1-4) X
OFT CHD INTERFERES WTH PLANS (1-4) – reversed X
TOTAL NUMBER OF ITEMS 9 10 12 8 18

175
Appendix B
Partial and Zero-Order Correlations

176
Table B.1 Partial and Zero-Order Correlations for Individual-Level Variables
1 2 3 4 5 6 7 8 1 IEP 0.11 *** 0.01 -0.02 *** -0.05 *** 0.00 -0.06 *** -0.07 ***
2 Male 0.05 *** -0.01 *** -0.01 -0.01 ** 0.00 0.00 0.01 *
3 Black -0.05 *** -0.01 * -0.22 *** -0.12 *** -0.11 *** -0.09 *** -0.27 ***
4 Hisp -0.03 *** -0.01 -0.20 *** -0.13 *** -0.12 *** -0.26 *** -0.21 ***
5 Asian -0.01 * 0.00 -0.07 *** -0.28 *** -0.06 *** 0.04 *** 0.01 **
6 Other -0.02 *** -0.01 -0.16 *** -0.15 *** -0.07 *** -0.01 -0.05 ***
7 Maternal Ed. -0.01 0.03 *** 0.00 -0.08 *** 0.04 *** 0.01 0.51 ***
8 Income -0.01 * 0.03 *** -0.17 *** -0.06 *** 0.00 -0.07 *** 0.29 ***
9 Disability 0.28 *** 0.02 *** -0.03 *** -0.01 -0.01 * -0.01 * 0.03 *** -0.02 ***
10 Home Cog. -0.01 * -0.06 *** -0.10 *** -0.08 *** -0.03 *** -0.04 *** 0.19 *** 0.14 ***
11 Parent Qual. 0.02 ** 0.01 * 0.02 *** 0.02 ** -0.02 *** 0.03 *** -0.01 -0.06 ***
12 Ed. Expect. -0.03 *** -0.03 *** 0.13 *** 0.11 *** 0.06 *** 0.04 *** 0.14 *** 0.08 ***
13 App to Learn -0.04 *** -0.16 *** 0.00 -0.01 * 0.02 ** 0.00 0.02 ** 0.02 *
14 Externalizing -0.01 * 0.11 *** 0.07 *** 0.01 -0.02 ** 0.01 0.00 -0.03 ***
15 Internalizing 0.05 *** -0.07 *** -0.07 *** -0.02 *** 0.00 0.00 0.00 -0.03 ***
16 Achievement -0.14 *** 0.07 *** -0.14 *** -0.06 *** 0.00 -0.06 *** 0.11 *** 0.11 ***
17 Low Birthweight 0.02 ** -0.03 *** 0.07 *** 0.02 *** 0.04 *** 0.01 -0.01 -0.01 18 Single Parent 0.00 -0.02 *** 0.17 *** 0.03 *** 0.00 0.05 *** 0.04 *** -0.38 ***
19 No Childcare -0.01 0.01 * -0.08 *** 0.04 *** 0.02 *** 0.02 * -0.12 *** -0.01 20 Language -0.01 0.02 ** -0.05 *** 0.44 *** 0.38 *** 0.02 ** -0.08 *** -0.13 ***
21 Grade 0.14 *** -0.07 *** 0.13 *** 0.06 *** 0.00 0.06 *** -0.12 *** -0.04 *** Note: Partial correlations below diagonal, zero-order correlations above diagonal.
***p < .001, **p < .01, *p < .05

177
(cont'd)
9 10 11 12 13 14 15 16
1 IEP 0.35 *** -0.05 *** 0.04 *** -0.14 *** -0.22 *** 0.12 *** 0.15 *** -0.08 ***
2 Male 0.08 *** -0.06 *** 0.00 *** -0.06 *** -0.24 *** 0.21 *** 0.04 *** -0.02 ***
3 Black -0.01 * -0.15 *** 0.04 *** -0.02 *** -0.14 *** 0.16 *** 0.02 *** -0.12 ***
4 Hisp -0.04 *** -0.21 *** -0.05 *** 0.10 *** -0.04 *** -0.02 *** 0.00 0.00 5 Asian -0.06 *** -0.02 *** -0.06 *** 0.11 *** 0.11 *** -0.10 *** -0.06 *** 0.03 ***
6 Other 0.01 -0.02 *** 0.03 *** -0.04 *** -0.02 *** 0.03 *** 0.02 *** -0.03 ***
7 Maternal Ed. 0.00 0.41 *** 0.05 *** 0.21 *** 0.17 *** -0.09 *** -0.09 *** 0.12 ***
8 Income -0.03 *** 0.41 *** 0.01 * 0.16 *** 0.21 *** -0.15 *** -0.13 *** 0.28 ***
9 Disability -0.01 * 0.04 *** -0.11 *** -0.19 *** 0.13 *** 0.16 *** -0.04 ***
10 Home Cog. 0.02 ** 0.23 *** 0.18 *** 0.17 *** -0.10 *** -0.09 *** 0.10 ***
11 Parent Qual. 0.02 ** 0.24 *** 0.05 *** -0.03 *** 0.01 * 0.02 *** -0.03 ***
12 Ed. Expect. -0.05 *** 0.10 *** 0.05 *** 0.18 *** -0.10 *** -0.10 *** 0.09 ***
13 App to Learn -0.05 *** 0.03 *** -0.01 0.06 *** -0.56 *** -0.40 *** 0.14 ***
14 Externalizing 0.03 *** 0.00 -0.01 0.01 -0.44 *** 0.31 *** -0.09 ***
15 Internalizing 0.07 *** -0.01 * 0.00 0.00 -0.26 *** 0.10 *** -0.03 ***
16 Achievement -0.01 0.06 *** -0.14 *** 0.10 *** 0.23 *** 0.03 *** -0.01
17 Low Birthweight 0.04 *** -0.01 0.02 *** 0.03 *** -0.02 ** -0.02 ** 0.02 *** -0.03 ***
18 Single Parent 0.00 -0.05 *** -0.01 ** 0.01 -0.02 ** 0.01 0.04 *** 0.01 19 No Childcare -0.01 -0.04 *** 0.03 *** -0.02 *** 0.01 -0.04 *** 0.01 -0.02 ***
20 Language -0.02 *** -0.02 *** -0.05 *** 0.13 *** 0.01 -0.02 ** -0.01 -0.05 ***
21 Grade 0.00 -0.07 *** 0.13 *** -0.10 *** -0.22 *** -0.03 *** 0.03 *** 0.94 ***
Note: Partial correlations below diagonal, zero-order correlations above diagonal. ***p < .001, **p < .01, *p < .05

178
(cont'd)
17 18 19 20 21
1 IEP 0.03 *** 0.04 *** -0.01 *** -0.05 *** 0.04 ***
2 Male -0.02 *** 0.00 0.01 * 0.00 0.00 3 Black 0.10 *** 0.30 *** -0.12 *** -0.18 *** 0.00 4 Hisp -0.01 ** 0.02 *** 0.15 *** 0.50 *** 0.00 5 Asian 0.00 -0.08 *** 0.03 *** 0.36 *** 0.00 6 Other -0.01 * 0.05 *** 0.02 *** -0.06 *** 0.00 7 Maternal Ed. -0.03 *** -0.20 *** -0.18 *** -0.24 *** 0.00 8 Income -0.06 *** -0.47 *** -0.08 *** -0.22 *** 0.16 ***
9 Disability 0.05 *** 0.04 *** -0.04 *** -0.08 *** 0.02 ***
10 Home Cog. -0.03 *** -0.23 *** -0.11 *** -0.20 *** 0.02 ***
11 Parent Qual. 0.03 *** 0.00 -0.01 -0.09 *** 0.02 ***
12 Ed. Expect. -0.01 -0.09 *** -0.03 *** 0.16 *** 0.00 13 App to Learn -0.05 *** -0.16 *** 0.00 0.03 *** -0.01 **
14 Externalizing 0.02 *** 0.15 *** -0.06 *** -0.07 *** -0.01 *
15 Internalizing 0.04 *** 0.12 *** 0.01 -0.03 *** 0.04 ***
16 Achievement -0.03 *** -0.10 *** -0.01 * 0.04 *** 0.93 ***
17 Low Birthweight 0.05 *** -0.01 * -0.02 *** 0.00 18 Single Parent 0.01 -0.02 *** -0.06 *** -0.03 ***
19 No Childcare 0.00 -0.02 *** 0.15 *** 0.00 20 Language -0.01 * -0.12 *** 0.01 0.00 21 Grade 0.02 *** 0.02 ** 0.02 ** 0.06 ***
Note: Partial correlations below diagonal, zero-order correlations above diagonal.
***p < .001, **p < .01, *p < .05

179
Table B.2 Partial and Zero-Order Correlations for School-Level Variables
1 2 3 4 5 6 7 8
1 IEP -0.03 *** -0.01 0.01 0.02 ** -0.04 *** -0.03 *** -0.03 ***
2 Urban 0.00 0.23 *** 0.26 *** 0.12 *** 0.43 *** 0.31 *** 0.19 ***
3 Neighborhood -0.02 ** 0.01 0.51 *** 0.35 *** 0.48 *** 0.34 *** 0.07 ***
4 Free Lunch 0.00 0.05 *** 0.19 *** 0.53 *** 0.59 *** 0.38 *** -0.01 **
5 Title I Funds 0.01 -0.06 *** 0.08 *** 0.37 *** 0.34 *** 0.20 *** -0.01 *
6 Non-White -0.01 0.17 *** 0.16 *** 0.38 *** -0.02 * 0.52 *** 0.23 ***
7 Lim. English 0.01 0.17 *** 0.09 *** 0.05 *** 0.03 *** 0.26 *** 0.20 ***
8 School Size -0.02 * 0.04 *** 0.00 -0.08 *** -0.04 *** 0.17 *** 0.09 ***
9 K Teacher Salary -0.03 *** 0.09 *** 0.03 *** -0.26 *** -0.03 *** 0.17 *** 0.10 *** 0.07 ***
10 Acad. Proficient 0.00 0.02 ** -0.14 *** -0.21 *** -0.04 *** -0.05 *** -0.08 *** 0.03 ***
11 Avg. Learn -0.07 *** 0.01 -0.03 *** -0.03 *** -0.04 *** -0.03 *** 0.02 ** -0.01 12 Avg. Extern -0.01 -0.02 ** 0.01 0.02 ** 0.03 *** 0.10 *** -0.04 *** -0.09 ***
13 Avg. Intern 0.04 *** 0.03 *** 0.04 *** 0.04 *** -0.04 *** -0.10 *** 0.02 * 0.02 *
14 # Disab/Class 0.12 *** -0.02 ** 0.04 *** 0.05 *** 0.01 -0.06 *** -0.06 *** 0.04 ***
15 Grade 0.04 *** -0.02 * -0.09 *** 0.12 *** -0.13 *** -0.01 0.03 *** 0.11 *** Note: Partial correlations below diagonal, zero-order correlations above diagonal.
***p < .001, **p < .01, *p < .05

180
(cont'd)
9 10 11 12 13 14 15
1 IEP -0.05 *** -0.01 -0.09 *** 0.07 *** 0.07 *** 0.14 *** 0.04 ***
2 Urban 0.15 *** -0.17 *** -0.04 *** 0.01 *** -0.01 ** -0.09 *** 0.00 3 Neighborhood -0.02 ** -0.42 *** -0.19 *** 0.18 *** 0.10 *** 0.02 *** -0.03 ***
4 Free Lunch -0.19 *** -0.47 *** -0.25 *** 0.24 *** 0.11 *** 0.02 *** 0.02 ***
5 Title I Funds -0.16 *** -0.33 *** -0.21 *** 0.19 *** 0.07 *** 0.01 ** -0.11 ***
6 Non-White 0.09 *** -0.41 *** -0.17 *** 0.14 *** 0.02 *** -0.09 *** -0.01 7 Lim. English 0.14 *** -0.31 *** -0.06 *** -0.01 0.03 *** -0.09 *** 0.01 8 School Size 0.15 *** -0.07 *** 0.02 *** -0.10 *** -0.04 *** -0.03 *** 0.10 ***
9 K Teacher Salary 0.02 *** 0.13 *** -0.19 *** -0.07 *** -0.04 *** 0.00 10 Acad. Proficient 0.00 0.17 *** -0.17 *** -0.07 *** 0.03 *** 0.03 ***
11 Avg. Learn -0.01 0.02 ** -0.62 *** -0.43 *** -0.07 *** -0.03 ***
12 Avg. Extern -0.11 *** -0.02 ** -0.44 *** 0.44 *** 0.08 *** -0.03 ***
13 Avg. Intern 0.02 * 0.00 -0.27 *** 0.27 *** 0.09 *** 0.10 ***
14 # Disab/Class 0.01 0.02 ** 0.00 0.02 ** 0.02 ** 0.04 ***
15 Grade -0.02 ** -0.01 0.00 -0.09 *** 0.14 *** 0.02 Note: Partial correlations below diagonal, zero-order correlations above diagonal.
***p < .001, **p < .01, *p < .05

181
Appendix C
Covariate Descriptions Used in 1st and 3rd Grade Propensity Score Generation
Table C.1 Descriptions of Variables Used in Propensity Score Creation
Variable Description
Demographics
Male 1=Male Sex
Non-English Lang 1=Non-English primarily spoken in the home
Race/Ethnicity 1=Non-Hispanic White, 2=Non-Hispanic Black, 3=Hispanic,
4=Asian, 5=Other
Low Birthweight 1=Born weighing less than 6 lbs.
Disability 1=Parent reports a disability
Age at K Entry Age at Kindergarten entry, ranging from 46 to 83 months
Family and Home
No Insurance 1=Child does not have health insurance coverage
No Regular Childcare 1=Child did not attend regular childcare (including daycare and
Head Start) before Kindergarten
Last Doctor Visit Most recent visit for routine healthcare checkup, with 1=2+ years,
2=1-2 years, 3=6 months-1 year, 4=less than 6 months
Income Parent-reported household income, ranging from 1 (less than
$5,000) to 13 (greater than $100,000)
Poverty 1=Family is at or below federal poverty line
Single Parent 1=Mother is single, separated, divorced, or widowed
Teenage Mother 1=Mother is less than 20 years old at time of first birth
Absent Bio. Father 1=Biological father is absent from the home
Maternal Education Level of mother’s education, ranging from 1 (8th grade education
or less) to 9 (doctoral or professional degree)
Home Cog Stimulation Standardized measure of cognitive stimulation in the home
environment, ranging from -3.73 to 2.34
Educational Expect. Educational attainment parent expects of child, ranging from
1=Receive less than a high school diploma, to 6=Finish a PhD,
MD, or other advanced degree
Parenting Interactions Standardized measure of high quality parent-child interactions,

182
ranging from -3.59 to 2.47
No. Siblings Number of siblings, ranging from 0-9
Achievement and Behavior Reading IRT-adjusted spring reading score, ranging from 11.4 to 69.02
Mathematics IRT-adjusted spring math score, ranging from 7.59 to 56.21
App. To Learning Teacher-reported positive learning behaviors, average scale
ranging from 1-4
Self-Control Teacher-reported self-regulation skills, average scale ranging from
1-4
Interpersonal Teacher-reported interpersonal relationships, average scale
ranging from 1-4
Externalizing Teacher-reported externalizing problem behaviors, average scale
ranging from 1-4
Internalizing Teacher-reported internalizing problem behaviors, average scale
ranging from 1-4
Dosage Number of data collection waves child is reported to have an IEP
on file, ranging from 1-4
School Demographics
Region 1=Northeast, 2=Midwest, 3=South, 4=West
Urban Area 1=Urban Area (Census Reported Population >250,000)
Rural Area 1=Rural Area (Census Reported Population <2,500)
Neighborhood Safety1 Standardized principal-reported measure of neighborhood quality
and safety, ranging from -0.84 to 1.98
Private School 1=Principal reports school is private or religious
K. Teacher Salary1 Highest annual base salary for Kindergarten teachers, ranging
from 1=less than $25,000 to 5=more than $60,000
School Size Principal-reported number of children enrolled in school, ranging
from 1 (149 or less) to 5 (750 or more)
School Climate1 Standardized measure of school climate reported by principal,
ranging from -2.94 to 2.67
Title I Funding 1=Principal reports that school receives schoolwide Title I
Funding
% Free Lunch1 Principal-reported proportion of student body receiving free lunch,
ranging from 0 to 100
Avg. SES1 Student-level measure of SES (created by ECLS-K), aggregated
across schools, ranging from -1.46 to 1.37
% Non-White Principal-reported proportion of student body that reports a non-
White race/ethnicity, ranging from 1 (less than 10%) to 5 (75%
or more)
% Limited English1 Principal-reported proportion of student body that are English
Language Learners, ranging from 0 to 99
No. Disabilities/Class Teacher-reported number of students with disabilities in their
classroom, aggregated across the school, ranging from 0 to 28
Avg. App. To Learn Student-level IRT-adjusted positive learning behaviors, as rated by
teachers and aggregated across schools, ranging from 2.2 to 4.0

183
Avg. Self-Control Student-level IRT-adjusted self-regulation skills, as rated by
teachers and aggregated across schools, ranging from 2.2 to 4.0
Avg. Interpersonal Student-level IRT-adjusted interpersonal skills, as rated by
teachers and aggregated across schools, ranging from 2.3 to 4.0
Avg. Externalizing Student-level IRT-adjusted externalizing problems, as rated by
teachers and aggregated across schools, ranging from 1.0 to 2.4
Avg. Internalizing Student-level IRT-adjusted internalizing problems, as rated by
teachers and aggregated across schools, ranging from 1.0 to 2.3
Note: 1 Covariate used in 3rd grade propensity-matching analysis only

184
Table C.2 Weighted Descriptive Statistics [M (SD) or %] by Spring 1st Grade Strata
Propensity-Matched Stratum Full
Sample 1 2 3 4 5 6
Special Education
Dosage 1.21
(.46)
1.34
(.59)
1.72
(.81)
1.89
(.91)
2.04
(1.00)
2.64
(1.08)
1.62
(.82)
IEP 1st gr. 17.4 15.7 37.4 51.9 65.9 86.9 37.8
IEP 3rd gr. 47.7 63.7 68.5 74.7 75.7 81.5 66.7
IEP 5th gr. 65.0 50.6 72.8 75.8 74.4 83.7 70.2
IEP 8th gr. 32.5 50.0 59.6 57.8 61.2 70.0 57.1
Demographics
Male 55.5 61.0 63.3 69.1 75.6 62.2 66.7
White 67.3 77.8 65.5 74.7 69.0 69.9 60.3
Black 16.7 12.8 16.2 11.3 6.6 8.8 15.2
Hispanic 13.7 6.9 9.4 7.4 15.0 8.7 18.0
Asian 1.3 0.0 0.8 0.9 1.9 0.0 1.4
Other 1.0 2.5 8.0 5.7 7.4 12.6 5.1
Disability 0.1 5.5 12.0 40.8 77.5 100.0 25.9
Low BW 0.6 2.7 7.5 10.9 13.6 19.7 7.9
K Age mo. 65.04
(4.22)
65.49
(3.86)
65.71
(4.23)
66.24
(4.23)
66.78
(4.63)
68.12
(4.76)
65.70
(4.40)
Achievement and Behavior
Reading 18.91
(6.21)
19.76
(6.79)
18.85
(7.42)
18.84
(7.88)
18.60
(7.20)
19.02
(10.54)
18.73
(7.35)
Mathematics 19.10
(8.17)
17.10
(6.62)
15.74
(5.59)
15.86
(5.69)
14.71
(5.21)
13.21
(6.04)
15.91
(6.66)
Learning 2.90 (.76) 2.77 (.70) 2.68 (.68) 2.67 (.71) 2.65 (.65) 2.47 (.63) 2.65 (.71)
Self-Control 3.07 (.70) 3.10 (.61) 2.97 (.67) 2.98 (.64) 3.04 (.67) 3.17 (.57) 2.96 (.67)
Interpersonal 3.01 (.74) 3.00 (.65) 2.87 (.65) 2.90 (.64) 2.87 (.65) 2.90 (.55) 2.86 (.67)
Extern Probs 1.71 (.68) 1.75 (.75) 1.85 (.73) 1.87 (.74) 1.86 (.78) 1.89 (.73) 1.88 (.75)
Intern Probs 1.55 (.47) 1.62 (.51) 1.67 (.55) 1.66 (.58) 1.78 (.55) 1.80 (.43) 1.70 (.57)
Family and Home
Maternal Ed. 4.21
(1.76)
3.94
(1.62)
4.00
(1.73)
3.82
(1.59)
3.91
(1.44)
3.78
(1.77)
3.91
(1.78)
Income 7.34
(3.35)
7.38
(3.31)
6.75
(3.34)
6.93
(3.16)
7.53
(3.01)
5.98
(3.00)
6.70
(3.38)
Poverty 25.2 24.8 25.8 20.9 16.5 21.8 26.4
Single Par. 28.0 34.8 31.6 31.8 31.0 41.7 33.2
Home Env. -.05 (1.02) -.03 (.95) -.12 (1.03) -.13 (.98) -.08 (.94) -.13 (.81) -.20 (1.00)
Ed. Expect 4.01
(1.16)
3.85
(1.12)
3.77
(1.21)
3.56
(1.09)
3.72
(1.19)
3.06
(1.33)
3.81
(1.20)
Parenting -.32 (.95) .12 (1.00) .11 (1.01) .17 (1.00) .41 (.87) .61 (.99) -.03 (1.03)
# Siblings 1.76
(1.26)
1.55
(1.06)
1.56
(.97)
1.54
(1.16)
1.47
(.98)
1.47
(.96)
1.54
(1.19)
Teen Mom 33.2 27.0 28.3 28.4 27.0 41.2 31.4
Non-English 10.4 2.9 1.0 3.3 2.8 0.0 11.0
Abs. Father 22.5 34.6 35.6 32.8 37.9 42.1 37.1

185
Doctor Visit 2.48 (.66) 2.47 (.66) 2.52 (.62) 2.52 (.63) 2.58 (.59) 2.67 (.47) 2.54 (.62)
No childcare 22.8 25.5 25.6 38.0 36.8 37.4 32.4
Not insured 14.3 5.4 4.4 6.4 7.5 4.5 9.6
School Demographics
Midwest 20.4 27.7 24.5 30.0 27.4 44.1 23.5
South 44.6 35.8 42.4 37.4 36.9 23.3 40.1
Northeast 20.9 28.6 24.7 20.7 22.6 26.6 20.2
West 14.0 7.9 8.4 11.9 13.0 5.9 15.6
Avg. SES -.01 (.47) .01 (49) -.01 (.51) -.05 (.43) .10 (.46) -.07 (.38) -.08 (.49)
% Minority 2.43
(1.38)
2.08
(1.30)
2.30
(1.40)
2.26
(1.36)
2.18
(1.30)
2.27
(1.48)
2.67
(1.50)
Size 3.18
(1.21)
3.35
(1.09)
3.52
(1.11)
3.36
(.95)
3.54
(1.02)
3.16
(1.14)
3.44
(1.10)
Avg. Learn 3.16 (.27) 3.11 (.25) 3.04 (.25) 3.01 (.26) 3.10 (.28) 2.98 (.23) 3.06 (.26)
Avg. Control 3.25 (.26) 3.21 (.24) 3.15 (.24) 3.11 (.23) 3.19 (.25) 3.06 (.22) 3.15 (.26)
Avg. Interp. 3.19 (.27) 3.15 (.23) 3.07 (.23) 3.05 (.24) 3.11 (.25) 2.99 (.22) 3.09 (.26)
Avg. Extern. 1.62 (.23) 1.64 (.22) 1.69 (.24) 1.73 (.22) 1.64 (.23) 1.71 (.23) 1.68 (.24)
Avg. Intern. 1.53 (.20) 1.57 (.22) 1.58 (.20) 1.62 (.21) 1.57 (.20) 1.59 (.21) 1.59 (.20)
Avg.# Disab 1.93
(2.01)
2.09
(1.70)
2.29
(1.77)
2.45
(2.24)
2.05
(1.84)
2.72
(2.98)
2.20
(2.06)
Title I Funds 59.9 61.1 60.2 54.7 37.7 56.2 54.9
Urban 6.6 6.5 4.5 9.5 8.6 8.9 12.7
Rural 10.9 17.7 23.4 19.4 17.3 31.9 15.4
Private 11.6 4.7 5.0 2.1 4.3 0.0 6.7

186
Table C.3 Weighted Descriptive Statistics [M (SD) or %] by Spring 3rd Grade Strata
Propensity-Matched Stratum Full
Sample 1 2 3 4 5
Special Education
Dosage 1.14 (.36) 1.23 (.46) 1.25 (.46) 1.42 (.59) 2.05 (.84) 1.62 (.76)
IEP 3rd gr. 16.6 38.7 41.4 66.2 91.9 66.3
IEP 5th gr. 76.1 60.3 76.2 68.2 83.7 76.2
IEP 8th gr. 43.7 64.4 45.6 54.5 61.3 57.0
Demographics
Male 67.0 56.4 62.9 62.3 59.7 60.8
White 77.0 76.6 73.7 72.1 71.1 72.9
Black 19.9 12.8 14.5 15.5 11.7 13.7
Hispanic 3.1 0.0 4.9 8.8 14.2 8.9
Asian 0.0 2.3 2.0 0.0 0.4 0.8
Other 0.0 8.2 4.9 3.5 2.6 0.4
K Disability 10.1 9.8 14.5 19.5 22.1 17.9
Low BW 0.0 4.5 0.0 3.5 11.5 6.3
K Age mo. 67.09
(4.51)
65.00
(4.76)
65.09
(3.93)
66.05
(3.86)
65.95
(4.38)
65.78
(4.30)
Achievement and Behavior
Reading 19.56
(4.33)
21.09
(9.41)
22.14
(9.13)
19.72
(6.47)
18.42
(5.68)
19.73
(7.07)
Mathematics 21.64
(10.39)
21.57
(11.36)
20.84
(8.16)
16.54
(6.21)
15.81
(4.81)
17.91
(7.61)
Learning 2.50 (.70) 2.95 (.89) 3.06 (.74) 2.78 (.74) 2.71 (.68) 2.80 (.75)
Self-Control 3.01 (.55) 3.26 (.65) 3.33 (.54) 3.05 (.62) 2.91 (.66) 3.06 (.65)
Interpersonal 2.90 (.64) 3.19 (.74) 3.27 (.61) 2.97 (.64) 2.90 (.66) 3.01 (.67)
Extern. Probs 1.68 (.44) 1.60 (.61) 1.54 (.60) 1.71 (.75) 1.93 (.72) 1.76 (.70)
Intern. Probs 1.87 (.51) 1.55 (.48) 1.40 (.37) 1.58 (.46) 1.70 (.53) 1.62 (.50)
Family and Home
Maternal Ed. 3.46 (1.15) 4.26 (1.96) 4.30 (1.75) 3.69 (1.62) 4.15 (1.82) 4.04 (1.78)
Income 7.73 (2.86) 6.96 (3.41) 7.74 (3.30) 7.28 (3.50) 7.28 (3.39) 7.33 (3.39)
Poverty 19.9 19.4 12.6 27.8 24.4 22.4
Single 17.5 27.4 24.0 25.7 40.5 31.4
Home Env. .22 (.83) .12 (.97) .10 (1.09) -.12 (.80) -.11 (1.01) -.03 (.97)
Ed. Expect 4.55 (1.07) 4.02 (1.19) 4.19 (1.13) 3.50 (1.13) 3.60 (1.03) 3.79 (1.14)
Parenting .11 (.88) .08 (.94) -.01 (1.21) -.22 (.85) .04 (1.02) -.01 (1.00)
# Siblings 2.26 (1.76) 1.59 (1.15) 1.27 (.99) 1.52 (.92) 1.44 (1.24) 1.50 (1.19)
Teen Mom 23.0 15.8 19.4 21.2 40.8 31.0
Non-English 0.0 0.0 3.4 1.8 7.4 4.0
Abs. Father 17.5 22.2 29.0 29.5 37.0 30.8
Doctor Visit 2.46 (.72) 2.53 (.62) 2.58 (.58) 2.45 (.60) 2.46 (.61) 2.49 (.62)
No childcare 52.4 16.5 17.9 25.2 12.3 19.1
Not insured 7.4 9.4 1.6 7.7 8.0 7.1

187
School Demographics
Midwest 37.2 19.5 21.6 24.2 25.9 24.7
South 48.6 32.8 27.8 45.3 35.8 38.6
Northeast 14.1 36.8 33.3 21.5 22.7 25.5
West 0.0 10.9 7.3 9.0 15.6 11.2
Avg. SES -.13 (.46) -.12 (.38) .10 (.48) -.02 (.44) .03 (.52) -.00 (.48)
Neighborhood 1.64 (1.98) 1.96 (2.08) 1.08 (1.57) 1.27 (1.59) .97 (1.48) 1.24 (1.68)
Climate 49.84
(5.40)
47.69
(7.15)
50.39
(4.06)
48.62
(6.09)
49.81
(5.39)
49.33
(5.74)
Lim. English .29
(.55)
3.57
(8.21)
2.17
(6.05)
2.20
(8.06)
4.18
(10.58)
3.10
(8.93)
% Free Lunch 27.82
(25.85)
35.90
(27.84)
28.96
(25.43)
28.46
(23.92)
30.50
(25.69)
30.41
(25.72)
% Minority 1.83 (1.42) 1.96 (1.30) 2.06 (1.33) 2.12 (1.41) 2.26 (1.27) 2.13 (1.34)
Size 3.10 (.88) 3.08 (1.19) 2.99 (1.22) 3.20 (1.23) 3.49 (1.01) 3.27 (1.13)
Avg. Learn 3.08 (.24) 3.13 (.28) 3.17 (.29) 3.12 (.24) 3.09 (.25) 3.12 (.26)
Avg. Control 3.21 (.24) 3.23 (.29) 3.28 (.29) 3.23 (.24) 3.20 (.26) 3.22 (.26)
Avg. Interp 3.10 (.25) 3.15 (.26) 3.23 (.30) 3.17 (.23) 3.14 (.25) 3.16 (.26)
Avg. Extern 1.66 (.22) 1.67 (.23) 1.60 (.27) 1.66 (.22) 1.65 (.22) 1.65 (.23)
Avg. Intern 1.65 (.26) 1.56 (.30) 1.52 (.22) 1.55 (.19) 1.53 (.20) 1.55 (.22)
Avg. # Disab 1.76 (1.63) 1.49 (1.30) 1.61 (1.79) 1.84 (1.81) 1.91 (1.36) 1.78 (1.56)
Title I Funds 36.0 53.8 44.7 42.7 62.2 52.3
Urban 0.0 16.1 2.6 2.8 10.8 7.8
Rural 23.3 33.5 23.4 19.4 18.2 21.7
Private 7.8 9.1 7.7 7.1 3.8 6.1
K Tch Salary 3.65 (.81) 3.22 (.92) 3.49 (1.03) 3.48 (.75) 3.64 (.89) 3.52 (.89)

188
Appendix D
Treatment Effects for Students Propensity-Matched on Special Education
Teacher Survey Variables
Table D.1 Balance of Propensity Scores for Spring 1st Grade Placement, Matched on Special
Education Teacher Survey Variables (n = 310)
1st Grade Special Education
N = 110
1st Grade General Education
N = 200
Stratum n M SD n M SD
1 12 .13 .06 112 .08 .06
2 19 .29 .05 45 .28 .05
3 19 .50 .06 18 .49 .06
4 21 .71 .07 17 .70 .06
5 43 .92 .05 3 .88 .05

189
Table D.2 Balance of Propensity Scores for Spring 3rd Grade Placement, Matched on Special
Education Teacher Survey Variables (n = 210)
3rd Grade Special Education
N = 140
3rd Grade General Education
N = 80
Stratum n M SD n M SD
1 7 .13 .05 24 .10 .05
2 7 .32 .07 22 .29 .05
3 11 .51 .05 11 .53 .06
4 23 .71 .05 12 .70 .07
5 89 .94 .06 6 .91 .06

190
Table D.3 Estimated Effects of Spring 1st Grade Special Education Services on 3rd and 5th Grade Academic Outcomes, Matched on
Special Education Teacher Survey Variables
Stratification Nearest-Neighbor Kernel Matching Summary
ATT ES ATT ES ATT ES ES 95% CI
Reading IRT score 3rd 5.23+ .23 3.96 .17 6.16* .27 .22 -.11, .56
Reading Gain K-3rd 6.30*** .35 4.69 .26 6.51** .36 .32 -.02, .66
Reading IRT score 5th 8.85*** .33 4.54 .17 9.37** .35 .28 -.08, .63
Reading Gain K-5th 7.70*** .35 4.34 .20 8.30** .38 .30 -.06, .67
Math IRT score 3rd -1.07 .06 -0.35 .02 1.14 .06 .04 -.37, .46
Math Gain K-3rd -0.65 .05 -0.60 .04 0.60 .04 .01 -.43, .45
Math IRT score 5th 1.25 .05 1.27 .05 3.95 .16 .10 -.29, .49
Math Gain K-5th -1.12 .06 -0.61 .03 1.54 .08 .06 -.36, .47 Note: ATT=Average Treatment Effect on Treated; ES=Effect Size; CI=Confidence Intervals
Benjamini-Hochberg corrected significance levels: *p < .05, **p < .01, ***p < .001

191
Table D.4 Estimated Effects of Spring 1st Grade Special Education Services on 3rd and 5th Grade Behavioral Adjustment, Matched on
Special Education Teacher Survey Items
Stratification Nearest-Neighbor Kernel Matching Summary
ATT ES ATT ES ATT ES ES 95% CI
App. to Learning 3rd 0.03 .04 -0.16 .24 0.02 .03 .12 -.37, .61
App. Learning Gain K-3rd -0.02 .04 -0.09 .12 -0.01 .02 .06 -.29, .41
App. to Learning 5th 0.14 .20 -0.15 .22 0.06 .09 .16 -.44, .75
App. Learning Gain K-5th 0.05 .06 -0.11 .14 0.01 .02 .07 -.34, .49
Self-Control 3rd Grade 0.09 .13 -0.08 .13 0.10 .15 .14 -.37, .65
Self-Control Gain K-3rd 0.04 .06 0.05 .08 0.13 .18 .12 -.27, .52
Self-Control 5th Grade 0.27+ .42 0.11 .17 0.22 .34 .28 -.20, .76
Self-Control Gain K-5th 0.19+ .26 0.19 .26 0.22+ .30 .28 -.13, .69
Interpersonal Skills 3rd 0.01 .01 -0.22 .31 0.02 .04 .14 -.43, .71
Interpersonal Gain K-3rd -0.15+ .20 -0.26 .35 -0.11 .14 .23 -.13, .59
Interpersonal Skills 5th 0.25+ .37 0.12 .17 0.25+ .38 .30 -.12, .71
Interpersonal Gain K-5th 0.06 .08 0.04 .05 0.09 .11 .09 -.29, .46
Externalizing Probs 3rd -0.31 .43 -0.13 .18 -0.33 .47 .35 -.32, 1.02
Externalizing Gain K-3rd -0.09 .13 -0.12 .17 -0.17 .24 .20 -.23, .63
Externalizing Probs 5th -0.30 .46 -0.12 .19 -0.29 .44 .34 -.19, .87
Externalizing Gain K-5th -0.06 .08 -0.11 .15 -0.16 .23 .18 -.24, .60
Internalizing Probs 3rd 0.06 .10 0.80 .13 -0.05 .08 .10 -.42, .62
Internalizing Gain K-3rd 0.03 .05 0.00 .00 -0.06 .09 .05 -.51, .60
Internalizing Probs 5th -0.14 .23 -0.05 .09 -0.11 .19 .16 -.42, .73
Internalizing Gain K-5th -0.10 .13 -0.04 .06 -0.03 .04 .06 -.41, .52 Note: ATT=Average Treatment on Treated; ES=Effect Size
Benjamini-Hochberg corrected significance levels: +p < .10

192
Table D.5 Estimated Effects of Spring 3rd Grade Special Education Services on 5th Grade Academic Outcomes, Matched on
Special Education Teacher Survey Items
Stratification Nearest-Neighbor Kernel Matching Summary
ATT ES ATT ES ATT ES ES 95% CI
Reading IRT score 5th Grade 7.17 .27 5.52 .19 3.06 .11 0.16 -.32, .65
Reading Gain 1st-5th 11.28+ .61 12.53+ .68 9.13 .49 0.59 -.04, 1.21
Math IRT score 5th Grade 1.09 .04 5.43 .21 -0.30 .01 0.10 -.43, .63
Math Gain 1st-5th 3.67 .24 7.67 .48 2.77 .18 0.32 -.30, .93 Note: ATT=Average Treatment on Treated; ES=Effect Size
Benjamini-Hochberg corrected significance levels: +p < .10

193
Table D.6 Estimated Effects of Spring 3rd Grade Special Education Services on 5th Grade Behavioral Adjustment, Matched on
Special Education Teacher Survey Items
Stratification Nearest-Neighbor Kernel Matching Summary
ATT ES ATT ES ATT ES ES 95% CI
App. Learning 5th Grade 0.21 .31 0.15 .22 0.29 .43 .33 -.26, .91
App. Learning Gain 1st-5th -0.08 .12 -0.06 .09 -0.06 .08 .09 -.54, .72
Self-Control 5th Grade -0.14 .22 -0.20 .30 -0.16 .24 .27 -.30, .83
Self-Control Gain 1st-5th -0.39+ .56 -0.14 .20 -0.32+ .46 .36 -.17, .89
Interpersonal Skills 5th Grade -0.08 .12 -0.17 .26 -0.05 .08 .16 -.44, .76
Interpersonal Gain 1st-5th -0.41+ .58 -0.14 .20 -0.28 .39 .33 -.28, .94
Externalizing Probs 5th Grade -0.11 .17 0.10 .15 -0.02 .02 .09 -.55, .74
Externalizing Gain 1st-5th 0.03 .05 -0.06 .08 0.02 .03 .06 -.62, .73
Internalizing Probs 5th Grade -0.15 .25 0.01 .02 -0.09 .15 .10 -.44, .65
Internalizing Gain 1st-5th -0.06 .09 0.11 .14 -0.03 .05 .09 -.54, .73 Note: ATT=Average Treatment on Treated; ES=Effect Size
Benajamini-Hochberg corrected significance levels: +p < .10

194
Appendix E
Alternative Specifications for Measuring Academic Gain Over Time
Table E.1 Estimated Effects of 1st Grade Special Education Services on 3rd and 5th Grade Reading and Mathematics Theta Scores and
Highest Proficiency Level Achieved
Stratification Nearest-Neighbor Kernel Matching Summary
ATT ES ATT ES ATT ES ES 95% CI
Reading T-score 3rd 2.58** .26 3.02* .31 2.65** .27 .28 .08, .49
Reading Proficiency 3rd 0.30* .24 0.41* .29 0.31* .25 .26 .05, .47
Reading T-score 5th 2.73** .28 3.91** .40 2.71** .28 .32 .11, .53
Reading Proficiency 5th 0.33** .30 0.52*** .48 0.35** .32 .30 .09, .52
Math T-score 3rd 1.56 .16 1.57 .16 1.69 .17 .21 -.01, .43
Math Proficiency 3rd 0.19 .17 0.20 .18 0.20 .18 .17 -.05, .39
Math T-score 5th 2.58** .27 3.97** .41 2.64* .27 .20 .07, .33
Math Proficiency 5th 0.18 .16 0.31* .27 0.19 .17 .13 .00, .25 Note: ATT=Average Treatment Effect on Treated; ES=Effect Size; CI=Confidence Intervals
Benjamini-Hochberg corrected significance levels: *p < .05, **p < .01, ***p < .001

195
Table E.2 Estimated Effects of Spring 3rd Grade Special Education Services on 5th Grade Reading and Mathematics Theta Scores and
Highest Proficiency Level Achieved
Stratification Nearest-Neighbor Kernel Matching Summary
ATT ES ATT ES ATT ES ES 95% CI
Reading T-score 5th Grade -0.55 .06 -1.96 .20 -0.85 0.09 0.13 -.37, .63
Reading Proficiency 5th 0.09 .09 -0.12 .11 0.14 0.13 0.12 -.43, .66
Math T-score 5th Grade -1.69 .17 -2.79 .30 -2.62 0.27 0.27 -.24, .78
Math Proficiency 5th -0.06 .05 -0.11 .11 -0.15 0.13 0.11 -.37, .59 Note: ATT=Average Treatment on Treated; ES=Effect Size

196
Figure E.1 T-Scores in Reading and Mathematics by IEP Status in 1st or 3rd Grade
44
45
46
47
48
49
50
51
Fall K Spring K 1st Grade 3rd Grade 5th Grade
T-S
core
Reading Theta Scores
Fall K Spring K 1st Grade 3rd Grade 5th Grade
Mathematics Theta Scores
1st Grade IEP
No 1st Grade IEP
Peer Norm
44
45
46
47
48
49
50
51
T-S
core
3rd Grade IEP
No 3rd Grade IEP
Peer Norm


![Assessing the Competitiveness of Smallholders …oar.icrisat.org/10635/1/04 Setotaw Ferede.pdfEthiop. J. Crop Sci. Vol 6 (Special Issue) No. 2, 2018 [51] Assessing the Competitiveness](https://img.dokumen.tips/doc/110x75/5e3b696df826af22814afda6/assessing-the-competitiveness-of-smallholders-oar-setotaw-feredepdf-ethiop-j.jpg)