Embed Size (px)
Citation preview
Who is data visualization for?

Data Visualization: Perils and Promises A suggestions for the use of Data Viz in education
Eric Newburger U S Census Bureau


The Census Bureau’s
Data Visualization Mission:
To increase the ratio of graphics to text in Census Bureau publications, both online and in print;
To open our datasets and analyses to a broader public.


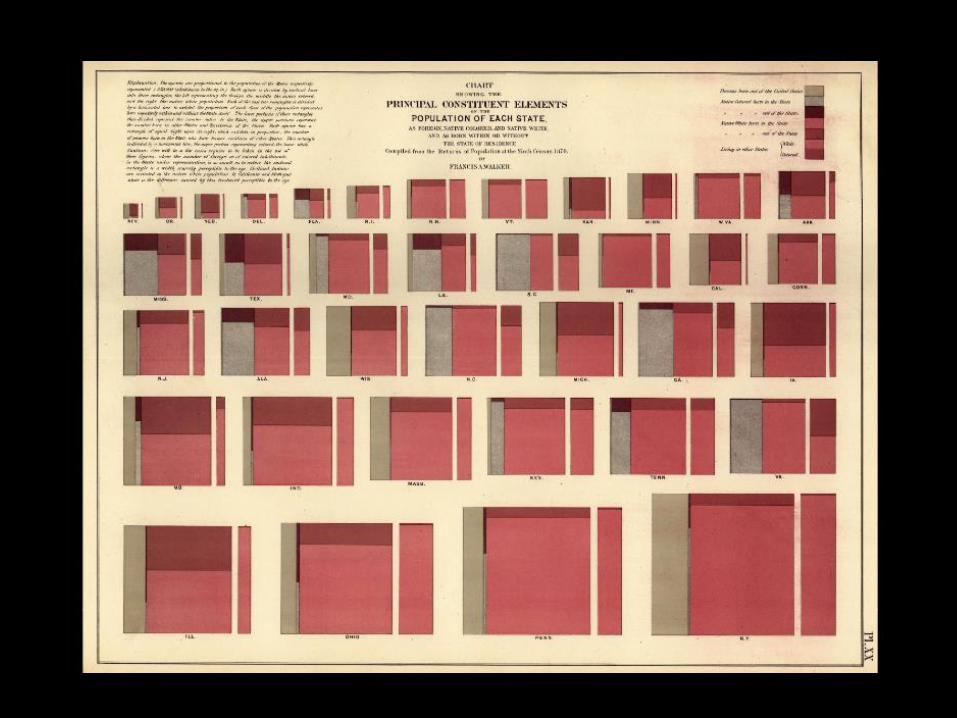
First subdivided squares
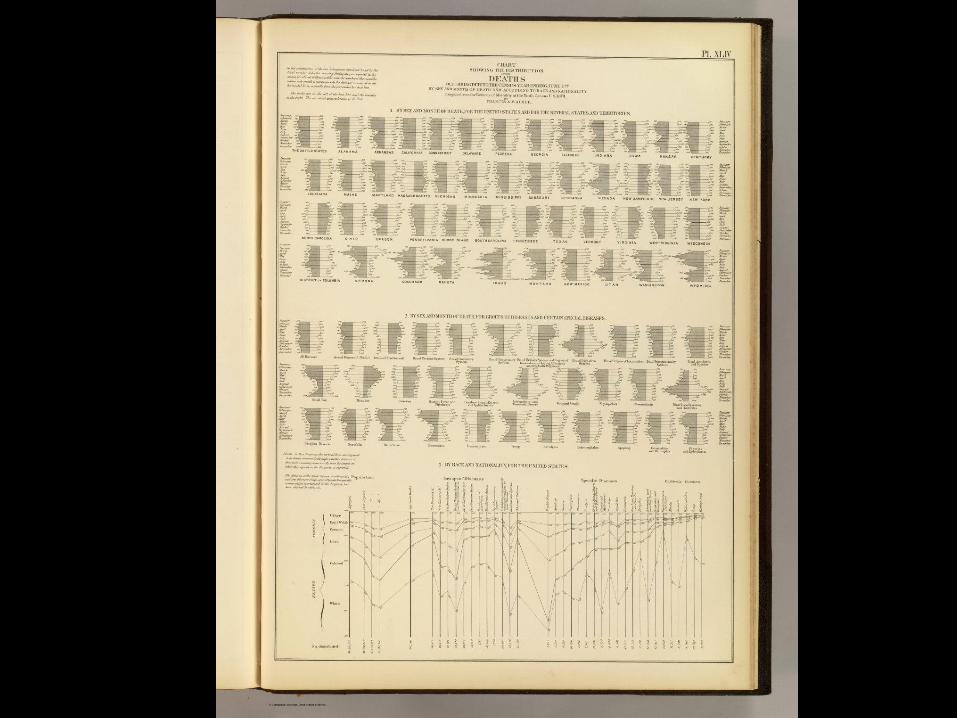

1880


Understanding
Newburger’s hypothesis of Data Visualization
A
B
Cognitive load


8.2
15.0
22.9
36.6
51.0
56.3
61.8
69.7
74.1
76.7 75.6
18.0
50.4
54.7
61.7
71.7
1984 1989 1993 1997 2000 2001 2003 2007 2009 2010 2011
Figure 1:
Household Computer and Internet Use: 1984-2011
Computer in household Internet use at home
Source: U.S. Census Bureau, Current Population Survey

8.2
15.0
22.9
36.6
51.0
56.3
61.8
69.7
74.1
76.7 75.6
18.0
50.4
54.7
61.7
71.7
1984 1989 1993 1997 2000 2001 2003 2007 2009 2010 2011
Figure 1:
Household Computer and Internet Use: 1984-2011
Computer in household Internet use at home
Source: U.S. Census Bureau, Current Population Survey


8.2
15.0
22.9
36.6
51.0
56.3
61.8
69.7 74.1
76.7 75.6
1984 1989 1993 1997 20002001 2003 2007 200920102011
Computer Ownership in Households: 1984-2011
Source: U.S. Census Bureau, Current Population Survey
8.2
15.0
22.9
36.6
51.0
56.3
61.8
69.7
74.1
76.7 75.6
1984 1989 1993 1997 20002001 2003 2007 200920102011
Computer Ownership in Households: 1984-011
Source: U.S. Census Bureau, Current Population Survey
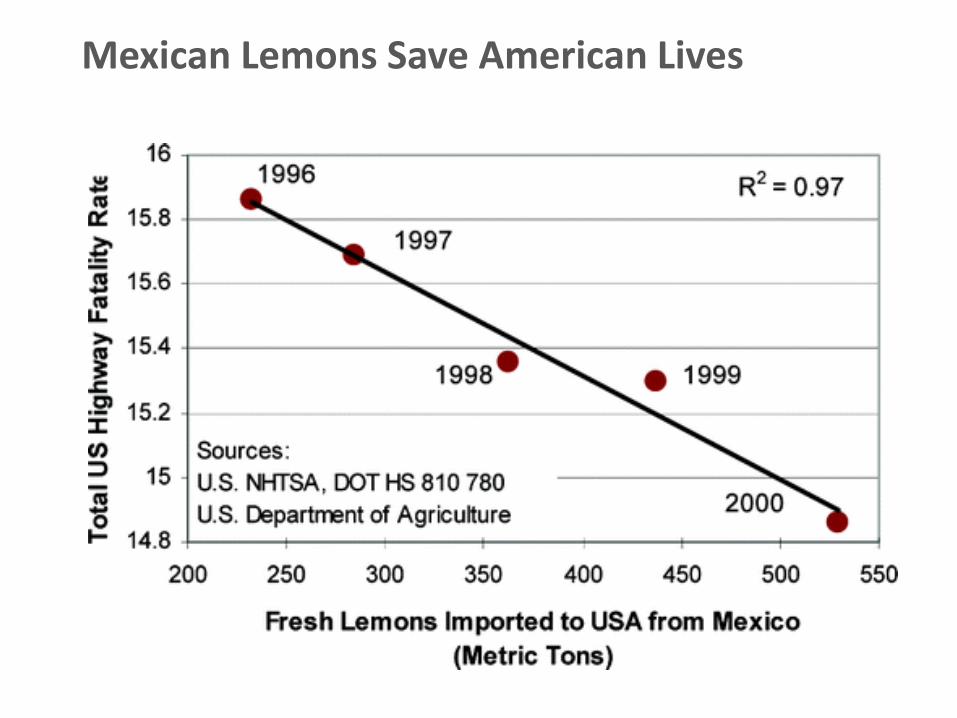
Mexican Lemons Save American Lives
Who is data visualization for
in education?


How big is it? What difference does it make? Are you sure that’s not just dumb luck?

x y x y x y x y
10 8.04 10 9.14 10 7.46 8 6.58
8 6.95 8 8.14 8 6.77 8 5.76
13 7.58 13 8.74 13 12.7 8 7.71
9 8.81 9 8.77 9 7.11 8 8.84
11 8.33 11 9.26 11 7.81 8 8.47
14 9.96 14 8.1 14 8.84 8 7.04
6 7.24 6 6.13 6 6.08 8 5.25
4 4.26 4 3.1 4 5.39 19 12.5
12 10.8 12 9.13 12 8.15 8 5.56
7 4.82 7 7.26 7 6.42 8 7.91
5 5.68 5 4.74 5 5.73 8 6.89
Anscombe's quartet
I II III IV
Mean Variance
Correlation Linear regression
9, 7.50 9, 7.50 9, 7.50 9, 7.50 11, 4.1 11, 4.1 11, 4.1 11, 4.1
0.816 0.816 0.816 0.816 Y=0.500x + 3.00…..

0
2
4
6
8
10
12
14
0 5 10 15 200
2
4
6
8
10
12
14
0 5 10 15 20
0
2
4
6
8
10
12
14
0 5 10 15 20
0
2
4
6
8
10
12
14
0 5 10 15 20
I II
III IV


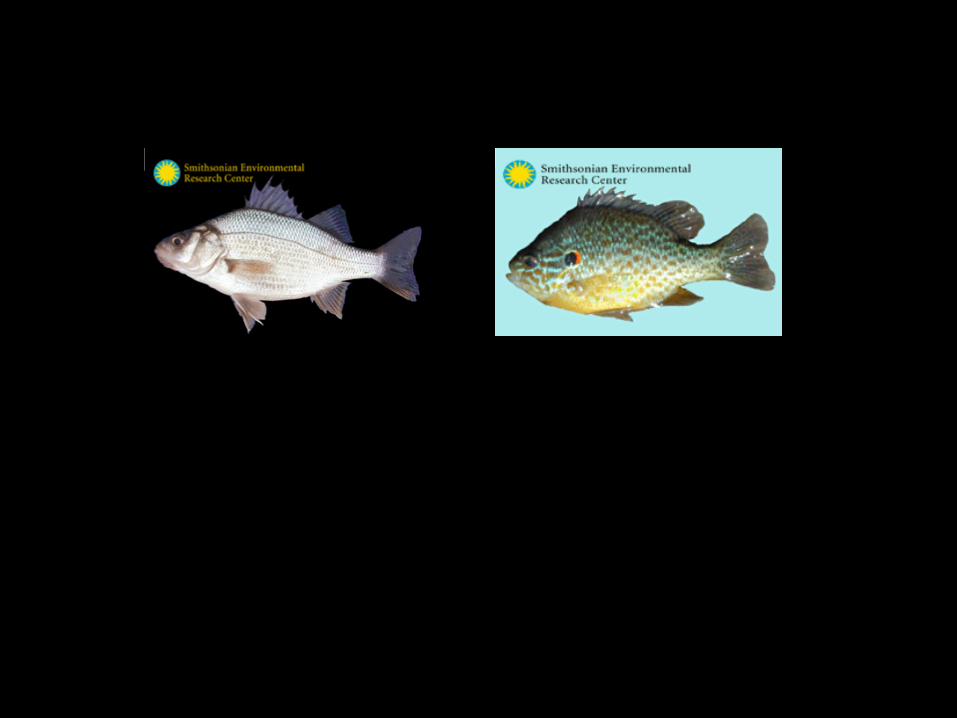


White perch Pumpkinseed
Total infected clear Total infected clear
Total 32 12 20 38 16 22
big 17 7 11 18 12 6
small 15 5 9 20 4 16
0 5 10 15 20 25
Total
0 5 10 15 20 25
Total
0 2 4 6 8 10 12
big
small
0 5 10 15 20
big
small

White perch Pumpkinseed
Total infected clear Total infected clear
Total 32 12 20 38 16 22
big 17 7 11 18 12 6
small 15 5 9 20 4 16
0 5 10 15 20 25
Total
0 5 10 15 20 25
Total
0 2 4 6 8 10 12
big
small
0 5 10 15 20
big
small

White perch Pumpkinseed
Total infected clear Total infected clear
Total 32 12 20 38 16 22
big 17 7 11 18 12 6
small 15 5 9 20 4 16
0 5 10 15 20 25 30 35
Total
0 5 10 15 20 25 30 35 40
Total
0 5 10 15 20
big
small
0 5 10 15 20 25
big
small
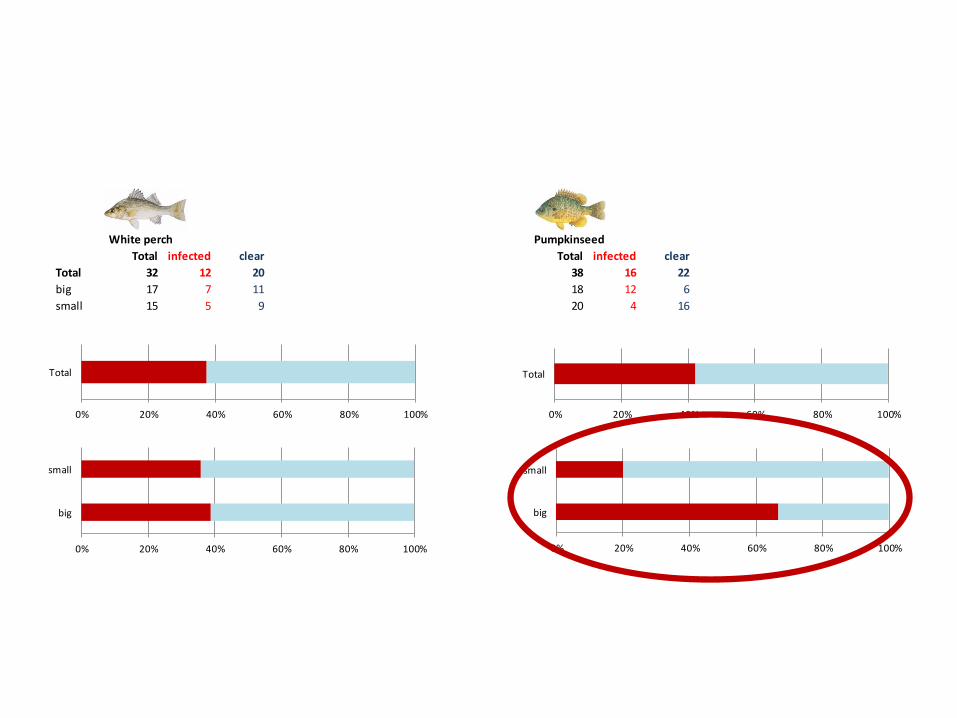
White perch Pumpkinseed
Total infected clear Total infected clear
Total 32 12 20 38 16 22
big 17 7 11 18 12 6
small 15 5 9 20 4 16
0% 20% 40% 60% 80% 100%
Total
0% 20% 40% 60% 80% 100%
Total
0% 20% 40% 60% 80% 100%
big
small
0% 20% 40% 60% 80% 100%
big
small


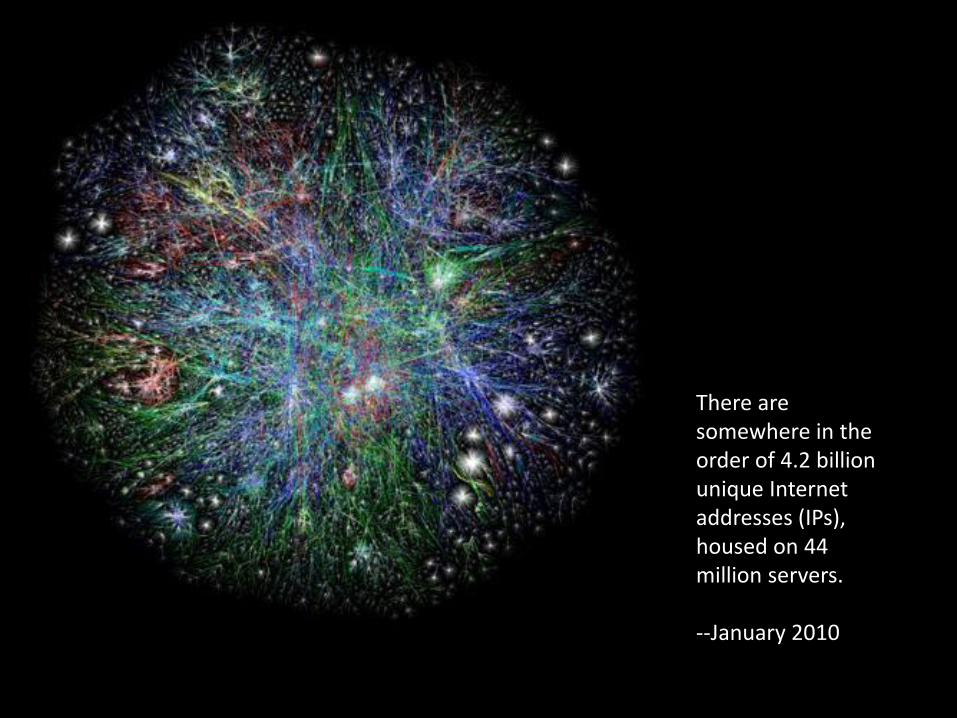
There are somewhere in the order of 4.2 billion unique Internet addresses (IPs), housed on 44 million servers. --January 2010

http://www.data.gov/


The first principle is that you must not fool yourself – and you are the easiest person to fool. -- Richard Feynman
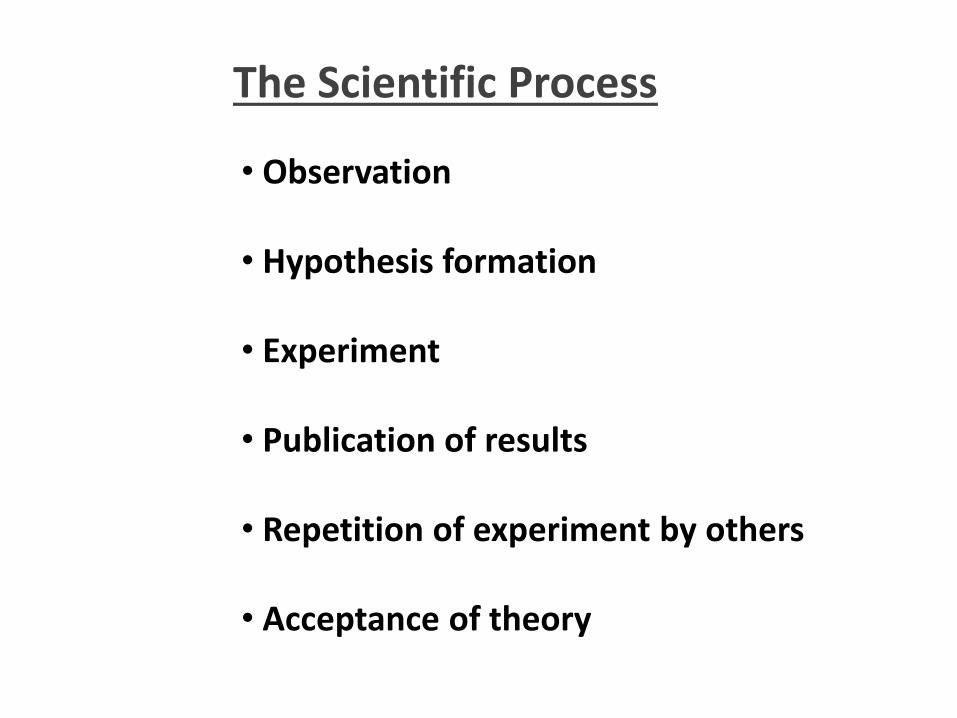
• Observation
• Hypothesis formation
• Experiment
• Publication of results
• Repetition of experiment by others
• Acceptance of theory
The Scientific Process
• Observation
• Hypothesis formation
• Experiment
• Publication of results
• Repetition of experiment by others
• Acceptance of theory
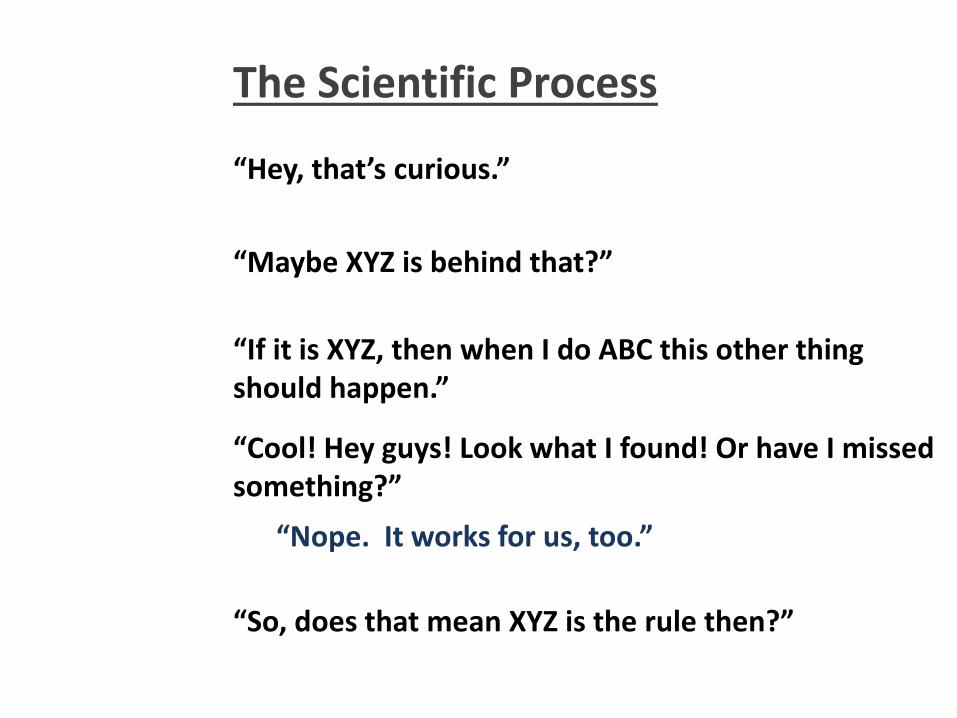
The Scientific Process
“Hey, that’s curious.”
“Maybe XYZ is behind that?”
“If it is XYZ, then when I do ABC this other thing should happen.”
“Cool! Hey guys! Look what I found! Or have I missed something?”
“Nope. It works for us, too.”
“So, does that mean XYZ is the rule then?”
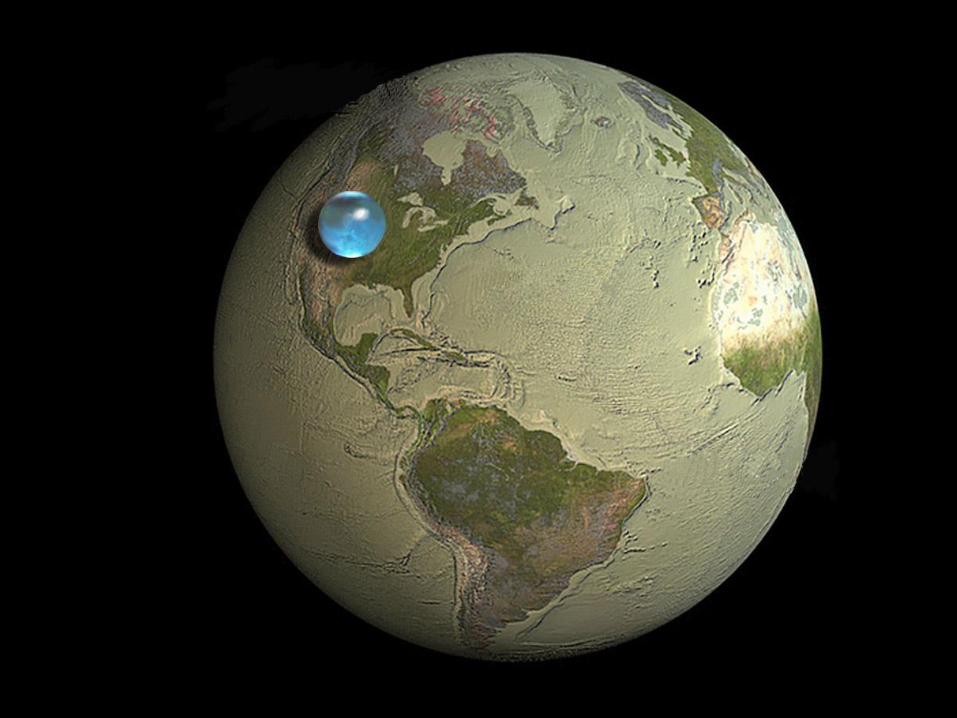


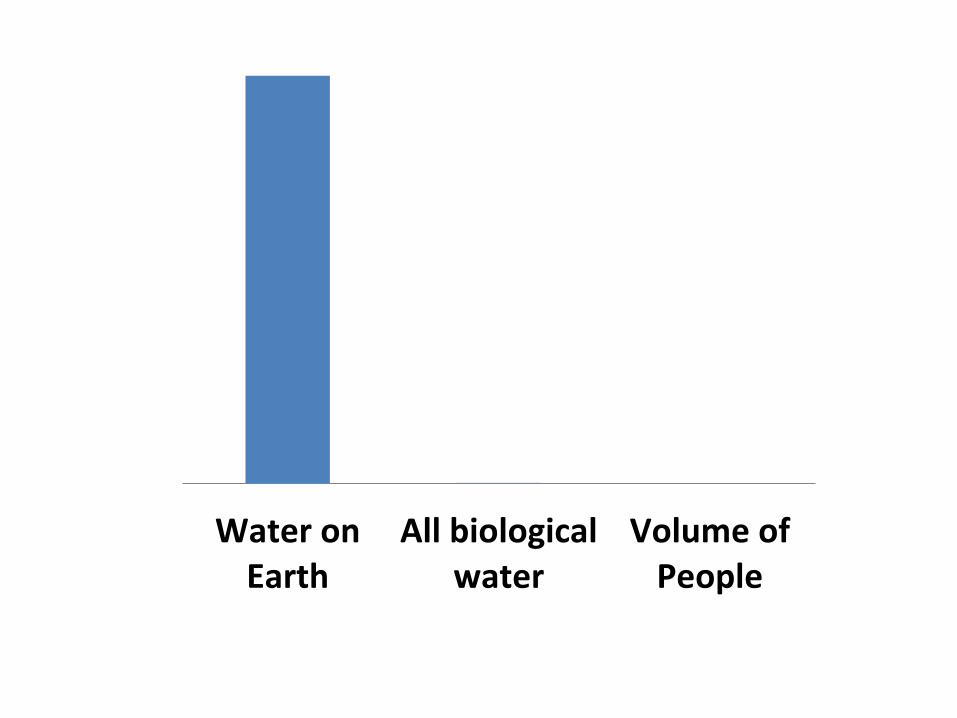
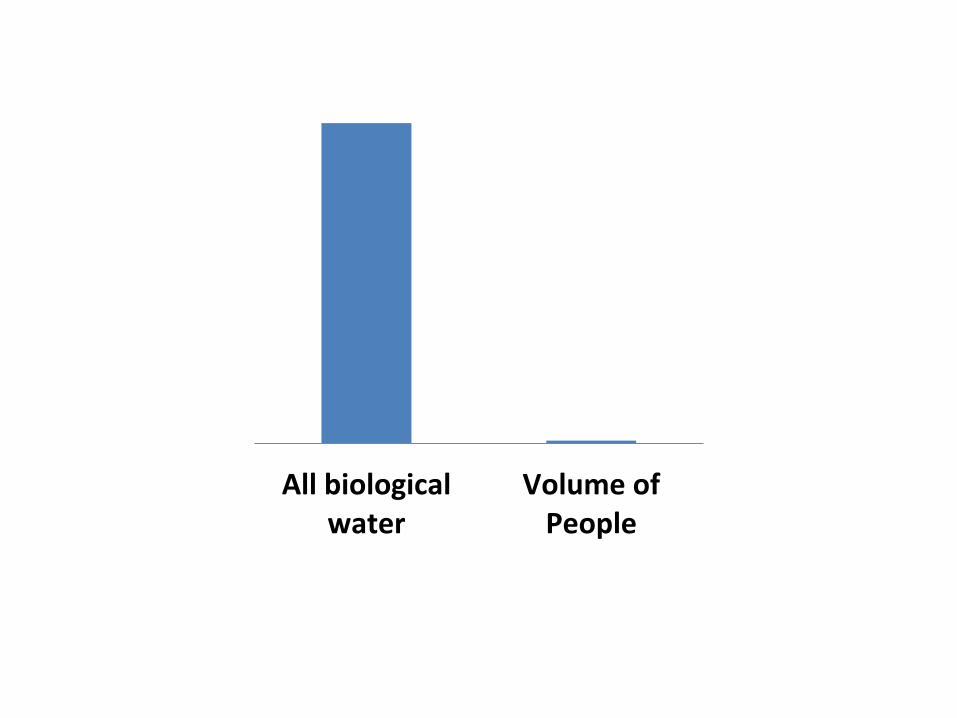
Water onEarth
All biologicalwater
Volume ofPeople
All biologicalwater
Volume ofPeople


To fully appreciate the revolutionary nature of PRIM-9 one has to view it against the backdrop of its time. When Statistics was widely taken to be synonymous with inference and hypotheses testing, PRIM-9 was a purely descriptive instrument designed for data exploration. When statistics research meant research in statistical theory, employing the tools of mathematics, the research content of PRIM-9 was in the area of computer-human interfaces, drawing on tools from computer science. When the product of statistical research was theorems published in journals, PRIM-9 was a program documented in a movie. John W. Tukey's Work on Interactive Graphics. The Annals of Statistics, Vol. 30 No. 6. 2002.