Embed Size (px)
Citation preview

WHO IAQ Guidelines: household fuel combustion – Review 11: Costs and financing
1
WHO Indoor Air Quality Guidelines:
Household Fuel Combustion
Review 11: Costs and financing for adoption at scale
Convening lead authors: Kristin Aunan1,2, Hisham Zerriffi3 Lead author: Nigel Bruce4,5 Affiliations 1CICERO (Center for International Climate and Environmental Research, Oslo), Norway
2Dept. of Chemistry, University of Oslo, Norway
3Liu Institute for Global Issues, University of British Columbia, Vancouver, Canada
4Department of Public Health and Policy, University of Liverpool, Liverpool, UK
5 World Health Organization, Public Health, Social and Environmental Determinants of Health,
Interventions for Healthy Environments, Geneva, Switzerland Convening lead authors: those authors who led the planning and scope of the review, and managed the
process of working with other lead authors and contributing authors, and ensuring that all external peer review comments were responded to. Lead author: that author who contributed to one or more parts of the full review, and reviewed and commented
on the entire review at various stages.
Disclaimer:
The work presented in this technical paper for the WHO indoor air quality guidelines: household fuel combustion has been carried out by the listed authors, in accordance with the procedures for evidence review meeting the requirements of the Guidelines Review Committee of the World Health Organization.
Full details of these procedures are described in the Guidelines, available at: http://www.who.int/indoorair/guidelines/hhfc ; these include declarations by the authors that they have no actual or potential competing financial interests. The review was conducted in order to inform the development of recommendations by the Guidelines Development Group. Some of the authors are staff members of, or consultants to, the WHO. The authors alone are responsible for the views expressed in this publication, which do not necessarily represent the views, decisions, or policies of the WHO.
This article should not be reproduced for use in association with the promotion of commercial products, services or any legal entity. The WHO does not endorse any specific organization or products. Any reproduction of this article cannot include the use of the WHO logo.

WHO IAQ Guidelines: household fuel combustion – Review 11: Costs and financing
2
Table of contents
Summary ................................................................................................................. 3
1. Introduction and scope .................................................................................... 4
2. Costs of a representative range of types of stove and fuel interventions .. 5 2.1. Technology Cost Trends ........................................................................................ 5 2.2. Stove Costs versus Programmatic Costs ............................................................ 8 2.3. Macro-Level Cost Estimates .................................................................................. 9 2.4. Conclusion ............................................................................................................. 11
3. Economic analyses: Cost Effectiveness and Cost benefits analysis ........ 11 3.1. CBA Versus CEA in Determining Economic Value of Cookstove Programs . 12 3.2. Guidelines for Conducting CBA .......................................................................... 13 3.3. CBA and CEA Evidence for Cookstoves ............................................................ 18
3.3.1. CBA studies ............................................................................................................. 18 3.3.2. CEA health studies ................................................................................................. 20 3.3.3. CEA for other outcomes ....................................................................................... 21
3.4. Conclusion ............................................................................................................. 22
4. Financing universal energy access .............................................................. 22 4.1. Producer Versus Consumer Financing Options ................................................ 24 4.2. Role of the Public Sector and Subsidies ............................................................ 24 4.3. Climate co-benefits of cleaner household fuel combustion and opportunities for carbon finance ............................................................................................................ 26
4.3.1. Climate impacts of incomplete combustion products ................................. 26 4.3.2. Opportunities to secure carbon finance .......................................................... 30
5. Conclusions .................................................................................................... 33
References ............................................................................................................ 34
WHO IAQ Guidelines: household fuel combustion – Review 11: Costs and financing
3
Summary
Background The cost incurred by various stakeholders in implementing a cookstove program or project can pose significant challenges to improved cookstove diffusion. In considering how the Indoor Air Quality Guidelines: Household Fuel Combustion might be implemented, it is necessary to understand their financial implications and analytical tools that might be brought to bear in assessing any particular intervention. Objectives This aim of this review was to provide data on, and frameworks of analysis for, the financial implications of trying to improve air quality via changes in cooking technologies and fuels. Methods This review summarizes (at the micro and macro levels), the financial implications of cookstove diffusion. In order to aid users of these guidelines in terms of thinking about implications of implementing programs to improve air quality through cookstove interventions, a short summary of Benefit-Cost Analysis (BCA) and Cost-Effectiveness Analysis (CEA) is also reviewed. This includes both a summary of the existing WHO Guidelines on BCA for cookstoves, as well as results from applications of these methods at a global, regional and local level. Options for alleviating some of the financial challenges to cookstove interventions are discussed, particularly the role of carbon markets. A review of the climate implications of the use of different fuels for cooking is provided and a discussion of the potential for carbon markets to solve some of the financial hurdles of implementing clean cooking is presented. Findings At the micro-level, improved cooking technologies range widely in price as do the costs of implementing clean cooking programs. However, it is clear that the cleanest options also present the highest financial burden on poor households. At the macro-level, while estimates for providing universal access to clean cooking vary as well, they are all in the range of billions or tens of billions of dollars per year. This is a small fraction of existing energy infrastructure investments and of existing energy subsidies and well within reach of the international community. When BCA or CEA approaches have been applied, all of the existing analyses point to significant benefits outweighing costs in almost all cases. Carbon markets may be a significant source of revenue that can help both enterprises and households access better stoves. However, they also have their limitations. Conclusions While the overall financial burden of providing universal access may be manageable, actually mobilizing resources and, in particular, determining the best avenues for distributing resources continues to pose obstacles. Mechanisms need to be implemented to solve the financing problem at multiple levels. In particular, both implementers of clean cooking technologies and consumers of those technologies need new options for solving their particular financial obstacles.

WHO IAQ Guidelines: household fuel combustion – Review 11: Costs and financing
4
1. Introduction and scope
Achieving wide-spread dissemination of cleaner cooking options entails overcoming a number of challenges from developing appropriate policies to navigating complex household decision-making processes in order to encourage uptake of new stoves and/or fuels. One clear challenge that continues to defy easy solutions is the financial one. Adopting new cooking technologies and fuels requires an investment on the part of stakeholders (e.g. the household, non-governmental organizations (NGOs), donors, governments, the private sector, etc.). Even though the benefits generally outweigh the costs, it is not always a given that a stove program can be successful on financial grounds or that relevant stakeholders will have either the willingness or the ability to pay for cleaner cooking options. Whether it is the fact that households have limited financial resources to purchase stoves and fuels despite the benefits or the burden that some subsidy programs have placed on government budgets, solving the financial challenge will be a major factor in implementation of the Indoor Air Quality Guidelines: Household Fuel Combustion. This aim of this review was to summarize and synthesize information on, and frameworks of analysis for, the financial implications of trying to improve air quality via changes in cooking technologies and fuels. It seeks to highlight some of the challenges and to provide pointers to some solutions. This review addresses the following general issues:
1. The costs of particular improved cookstove technologies and the programmatic efforts to diffuse cookstoves.
2. Global cost estimates for diffusion of improved cookstoves at a large scale. 3. The role of economic analyses in assessing cookstove diffusion benefits and costs
and examples of application of those tools. 4. Issues in financing cookstove interventions and the potential role of carbon markets
and carbon credits in alleviating financial constraints on cookstove adoption. In order to provide a structured discussion of these issues to inform eventual implementation of the Guidelines, a wide ranging and narrative review of the literature was conducted. Given the complexity and breadth of issues to be considered here, the nature of the information to be conveyed and the need to provide contextual information and frameworks for understanding financial considerations for increasing access to clean and efficient household energy, this narrative approach is more appropriate. Section 2 provides an overview at both the micro-level and macro-level of technology cost trends and stove/fuel intervention costs. At the micro-level, stove technology costs vary quite widely, even within a given class of technologies (e.g. rocket stoves). Stoves can involve an investment of just a few dollars to tens of dollars (and more in the case of some biogas systems). At the macro-level, differing assumptions lead to a range of cost estimates for providing universal access to clean cooking. However, while these estimates tend to be in the tens of billions of dollars per year, this represents only a small fraction of global energy investments. Section 3 then puts those costs into context by reviewing options for economic analysis of clean cooking technologies and fuels and some of the existing data on benefits and costs of cooking interventions. This includes a brief introduction to the concepts of cost-benefit analysis and cost-effectiveness analysis and a summary of the limited number of studies that apply these methods to cooking. These studies, both at the global scale and at the scale of individual interventions, show that benefits generally outweigh costs, in some cases, providing significantly higher benefits than costs. We also discuss some of the challenges to realizing those significant benefits, including the issue of split incentives and the fact that costs and benefits accrue to different stakeholders and are measured in a mix of both monetary and non-monetary units.

WHO IAQ Guidelines: household fuel combustion – Review 11: Costs and financing
5
In Section 4 we revisit the macro-level cost estimates of providing universal clean cooking and discuss the financial options available and some of the issues inherent in mobilizing then necessary capital to achieve those goals. Section 4 covers a number of different options by which the problems of providing financing to either producers or consumers can be overcome. We then highlight one particular financing option that is increasingly being used, namely carbon credits. The basic science linking cooking to climate change is reviewed as well as the current state of carbon markets and their potential use in this sector. Finally, in Section 5 we draw some general conclusions regarding the financing challenge and the opportunities for solving that challenge in the context of meeting the Indoor Air Quality Guidelines.
2. Costs of a representative range of types of stove and fuel interventions
The transition to cleaner stoves and fuels is determined by a range of socio-economic, technical and financial factors. These factors are discussed in greater detail in Review 7 (Factors influencing adoption). This section focuses solely on a factor known to be critical to household adoption, namely the cost of the replacement technologies. Unfortunately, there is no systematic collection of data on stove costs and information is scattered across various publications, project documents and websites. HEDON has a stove database that is voluntary but stove costs are not included in the information participants are asked to provide (1). As a result, the quality of the evidence on costs and cost trends is varied. There are no standards for reporting costs, no consistent boundaries applied to determining stove costs, lack of reporting in many cases and most costs estimates that do exist are self-reported and not independently verified. This raises a number of issues in trying to determine representative stove costs and cost trends.
2.1. Technology Cost Trends
Like all technologies, stove costs should decline over time for a given stove. This would come from economies of scale in production, economies of scale in programmatic costs and learning by doing in manufacturing, installation and use. With the above considerations in mind, data can be found within the micro-level literature on individual stoves and technologies that provide an estimate of stove production costs and prices, cost trends and programmatic costs. A desk survey of stove information was produced for the Global Energy Assessment with data on stoves over the last two decades1 (2). At the lowest end are stoves that cost less than five dollars. These are typically artisanally produced small mud and clay stoves. Conversely some non-metal stoves have been reported as significantly more expensive. A mud rocket stove in Nicaragua had reported costs of $30 in 1994 (2). Bailis et al. 2009 report on a stove that is constructed in-situ from bricks, sand, mortar and wood and with metal cooking surfaces whose production costs are approximately $100 (no year specified) (3). Metal versions of the “rocket” stove also exhibit a wide range of costs, with some reportedly costing in the five dollar range and others in the low tens of dollars (2). More advanced cookstoves, for example those that incorporate fans to improve air flow or are based on gasification processes, tend to be even more expensive. A survey of stove companies in India revealed a range of costs from $5 to $85 for household stoves in 2010, with those at the higher end of the range corresponding to stoves with efficiencies approaching some of the more modern fuels (4).
1 The desk survey was completed by collecting information about stoves listed in the HEDON database from the
individual stove developer sites, as well as, from a literature review of papers reporting on stove projects.

WHO IAQ Guidelines: household fuel combustion – Review 11: Costs and financing
6
One aspect that complicates the analysis of stove technology cost trends is the development of these more advanced stoves and the fact that the stoves (or at least components of the stove) are now patented and thus there are not yet multiple manufacturers and distributors for a given stove design (i.e. there is only one Biolite stove and one First Energy Oorja stove). Even rocket stoves with more advanced combustion chamber designs and manufacturing have been patented (e.g. the Envirofit stoves). It is unclear what impact this is having on stove pricing. For other (non-cooking) technologies, the patenting of the technology and the lack of direct competitors for the same design and performance can lead to pricing well above costs (termed in economics ‘supra-normal pricing’). However, there is reason to believe that this might not be the case for stoves. First, while individual stove designs are patented there are multiple stoves and stove designs on the market or entering the market. Secondly, and reinforcing the first point, the consumers in this market are extremely price-sensitive. It appears to be proving difficult enough to sell these more advanced stoves with even minimal profit, and thus increasing prices to achieve supra-normal profits would seem to be impossible without pricing the stove out of the market. A possible exception to this would be stoves that also sell to consumers in industrialized countries, where prices may be higher. This also acts as a cross-subsidy for stoves intended to improve energy access. However, as noted above, this has not been studied in the context of cookstoves and these hypotheses would have to be tested against field data. Another class of technology options would involve moving away from burning solid fuels altogether and towards liquid/gaseous fuels or electricity. For commercial liquid/gaseous fuels such as kerosene or LPG, a household’s financial commitment is no longer limited to the technology investment itself but also to ongoing fuel costs. In some cases, this will be an additional financial commitment for the household. In other cases, particularly in some urban areas, households are already purchasing fuels (e.g. wood or charcoal) and fuel switching will not require as much in new financial commitments or could even save households money. Fuel prices vary widely depending upon both the variable price of oil, the highly variable and context dependent costs of transportation, etc. and the presence of market distorting factors that can drive the price up or down (e.g. monopoly provision, supplier price collusion, taxes and subsidies). Similarly, fuel costs for electric cookers vary widely depending upon whether the household is grid connected or not, technologies used for generation, presence of subsidies or taxes, and tariff regulations. For this reason, we are not including a comprehensive review of the cost of fuels. However, there are a few considerations that must be borne in mind when considering the suitability of any cooking option being promoted or considered if it involves fuel purchases. First, the impact of fuel prices on household decision-making will depend greatly upon whether households currently purchase fuel already. Second, variability of fuel supply and fuel prices will influence both initial adoption decisions as well as ongoing decisions regarding usage of a new stove/fuel combination (see (4) and (5) for an example in India). Third, to the degree that fuels are subsidized, increased access can have a significant effect on choices of how and when fuels are used with attendant impacts on the subsidy budget (see (6) for an example in South Africa of the impact of free electricity). With the caveat about fuels, the technologies themselves to cook with liquid/gaseous fuels or with electricity are generally comparable to the more advanced improved biomass cookstoves discussed above. The International Energy Agency (IEA)’s background document on its Universal Access Scenario assumes an advanced biomass cookstove to cost $45 while an liquefied petroleum gas (LPG) stove with canister is assumed to cost $60 (7). Gaseous cooking fuel can also be provided using a biogas digester. Extensive diffusion has occurred in China and biogas digesters have also been promoted in various other parts of the world (e.g. Latin America) (8, 9). However, biogas digesters fall into an entirely different price category, as they can easily cost into the hundreds of dollars (the IEA uses a mid-point estimate of $400 for a household-scale digester). For electric cooking devices, it

WHO IAQ Guidelines: household fuel combustion – Review 11: Costs and financing
7
is difficult to establish an overall cost range as the variety of devices that can be used to cook with electricity is vast in both technology and scale. The price difference between a small electric hotplate and a modern stove is an order of magnitude. However, it is safe to assume that households moving from solid fuel burning to an electric cooking device are likely transitioning to the simplest devices (e.g. water geysers for heating liquids, small hotplates, etc.). An analysis in South Africa of their Free Basic Electricity program assumed a cost of roughly $12 USD (2005 USD) for a hotplate. In comparison, the LPG system costs were $17 (2005 USD) (6). We assume that, in general, these technologies generally cost in the tens of dollars to purchase. Table 1 provides a summary of the technology costs likely for a range of cooking options as well as some comments on technologies considered and other factors. There is quite wide variation among reported sources (in part due to lack of reporting on the dollar years, making it hard to account for inflation over time between estimates). Table 1: Stove Technology Cost Summary
Technology Cost Estimate
(US$)
Comments
Improved Solid Fuel Stove
~5-50 Includes rocket stoves, planchas, and other metal or mud stoves that primarily act to enclose the combustion and improve the thermodynamics as well as advanced stoves that are based on gasification, have fans, or utilize other combustion processes/ technologies to achieve higher efficiencies
Kerosene Stove 10-60 Includes only stove cost plus cylinders and not fuel LPG Stove 60-120 Includes only stove cost plus cylinders and not fuel
Electric Stoves (various designs)
100-500 Does not include fuel
Biogas Digester $400 IEA estimate used in their universal access scenario. Sources: (2, 7, 10)
The Global Energy Assessment (GEA) has produced a schematic that illustrates the differences in performance, financial cost and time cost of various cooking options based on a delivered output of 11 MJ/day per household (11). As it shows, moving from the simplest of cooking options (e.g. dung) to cleaner and more advanced options (e.g. LPG or electricity) involves improvements in performance (e.g. efficiency of combustion), increases in monetary costs and decreases in time costs (

WHO IAQ Guidelines: household fuel combustion – Review 11: Costs and financing
8
Figure 1).

WHO IAQ Guidelines: household fuel combustion – Review 11: Costs and financing
9
Figure 1: Illustrative graph of costs of energy provision for cooking
Source: Reproduced with permission from the International Institute for Applied Systems Analysis (IIASA) (11) Note: Most emission factors are in terms of TSP not PM2.5. Specific values used for rocket and blower for PM,
assumed same emission factors for GHGs (Greenhouse gases).
2.2. Stove Costs versus Programmatic Costs
Programmatic costs are often left unreported and there is no consistency in reporting when they are included. These costs (for research and development, marketing, program overhead, etc.) can be explicitly incorporated into reported stove costs/prices in some cases, sit separately in other cases or not be reported at all (leaving the reader to guess whether the reported prices and costs do or do not include programmatic costs). For example, Kees et al. 2011 reports a cost of 3-12 euros per person for their Uganda project, but without distinguishing how much of that cost is the stove itself and how much is the overhead for the program (12).
A massive project in Indonesia to convert households and small/medium enterprises from kerosene to LPG for cooking reports costs of 1.15 billion USD for converting 44 million households and enterprises over three years but like many reports, this appears to be primarily the cost of subsidized stoves and equipment and does not include the costs to Pertamina (the national oil company) of actually running the program (13). Smith et al report that in the highly successful Chinese stove program, the government (from local to central) spent approximately $200 million while stove costs themselves were approximately $1 billion, so that government expenditures on R&D, personnel, etc. amounted to about 20% of what householders paid to obtain stoves (14). Bailis et al also report on programmatic costs for a stove intervention in Mexico. There stoves cost $98 while administrative costs were $22, operating costs for the installations, marketing, etc. were $8 and the cost of follow-up

WHO IAQ Guidelines: household fuel combustion – Review 11: Costs and financing
10
visits (critical for ensuring continued usage) were $5. Overall, this means non-stove costs (not including R&D) were about 35% of the actual cost of the stove (3).
In their global analysis of cost effectiveness of cooking interventions, Mehta and Shahpar report on both assumed technology costs and programmatic costs, with programmatic costs as a fraction of total costs varying quite widely depending on technology/fuel and region. Fossil fuel based interventions were assumed to have relatively constant programmatic costs (in the range of $9-58 million depending on region) even when scale of interventions (and technology costs) were very different (in the range of $9 million to $16 billion). On the other hand, within a given region, improved stove programs had lower technology costs (ranging from $2 million to $4 billion) but higher programmatic costs (ranging from $11.5 – 163 million) (all costs in Year 2000 International Dollars) (15). The degree to which this reporting issue arises may differ significantly between private, market based, distributors of stoves and publicly supported stove dissemination programs (whether government or donor funded). Private retailers of stoves must price stoves to incorporate all of their costs or they will not be able to continue operations over the long-term. Having said that, there may be circumstances where a private entity may accept lower profits or even no profits for a period of time in order to establish a market. This appears to have been the case with the two most successful stove programs in India outside of the government programs (one being a private enterprise and the other a social enterprise.). The first case is a private enterprise, where stove and fuel prices were initially set in order to spur the market and not to achieve profit levels typical of a private enterprise. Later price increases (particularly for the fuel pellets used by one company’s stove) were necessary in order to maintain the business but have also reduced their competitiveness in the market (4). The second case is an example of a social enterprise, with operations being run commercially but development and programmatic costs being covered by foundations and other sources. Publicly funded programs would be expected to absorb some of the costs related to distribution, marketing, technical assistance, as well as potentially some of the technology cost itself. The stove price faced by the consumer is a poor reflection of the actual costs of the stove. Such subsidies are justified as being for the public good, but the subsidies can take a variety of forms. As mentioned, some cover programmatic costs while others cover the costs of either the technology or the fuel. Further discussion of the role of subsidies is included in the section on financing below. The fact that these cost/price relationships are not generally reported, however, makes it somewhat difficult to assess stove programs and, in particular, to compare public and private efforts. Furthermore, many stove programs or projects do not sit squarely within the private/public dichotomy presented above. Stove programs often have a mix of the private and public, including relying on public funding for programmatic activities while trying to run the operations side as a market based program (i.e. stove production and distribution costs are covered by the stove price) (4).
2.3. Macro-Level Cost Estimates
There are also some macro-level estimates of stove and fuel interventions, generally done in support of analyses on achieving universal access to cleaner technologies and fuels. The International Energy Agency, in its 2011 World Energy Outlook, estimates an additional $74 billion in investments by 2030 to achieve universal access to clean cooking facilities (on top of an assumed $21 billion of investment). Of the total, roughly half is for biogas systems, with the rest nearly evenly split between LPG and advanced biomass cookstoves. However, the LPG and advanced cookstoves are expected to reach around 3.5 times as many people each (16). Bazilian et al note that the IEA and other analyses showing similar figures only account for the direct technology capital costs and not for costs associated with infrastructure, distribution or, most significantly, fuel (17). The Global Energy Assessment’s

WHO IAQ Guidelines: household fuel combustion – Review 11: Costs and financing
11
estimate is significantly higher (~$300 billion USD) as it is based on a different set of assumptions and includes a more comprehensive set of costs (e.g. fuel) (11) (see Figure 2). In conducting their global and regional calculations of the Cost-Benefit ratio for stoves, the World Health Organization developed an estimate for reducing those without improved stoves by half by 2015. Those costs were estimated at 23.5 billion per year for LPG and 2.3 billion per year for improved biomass stoves (18). For universal access by 2015, the annual costs were estimated at 4.63 billion for improved biomass stoves, 47.1 billion for universal LPG access and 106.3 billion for biofuels (assuming a switch to a liquid biofuel, specifically ethanol) (18). Figure 2: Population lacking access to modern energy and estimated investment needs for universal access (2) Reproduced with permission
Note: reproduced with permission from the International Institute for Applied Systems Analysis (IIASA)
Despite the significant variation in macro-level cost estimates (both those reported here and others), the cost estimates all show that improved access to cleaner cooking technologies and fuels can be obtained for billions or, perhaps, tens of billions of dollars per year. While each stove purchase may represent a significant expenditure for a household and an individual stove dissemination program may represent a significant level of effort by either a private or public entity, the overall costs can also be compared to other macro-level costs within the energy industry. For example, the same IEA report that estimated $74 billion in investments necessary for universal access to clean cooking by 2030 also estimates that cumulative investments in the energy sector as a whole from 2011-2035 will be nearly $38 trillion under the “New Policies” scenario or roughly $1.5 trillion per year (19). Seen in that light, the additional costs for achieving improved cooking energy access would be less than one percent of annual energy investments. Alternatively, the annual government expenditures on energy subsidies for consumption alone in 2010 were $409 billion, approximately half to fossil fuels. Of this amount, approximately 8% (~$30 billion) went to the poorest 20% of the population in those countries with subsidies. Renewable energy subsidies were another $66 billion in 2010 (19). Whether one uses the smaller IEA numbers for energy access or the larger GEA number, it is clear that the few billions or tens of billions of dollars needed every year would be a fraction of government subsidies on energy already in place.

WHO IAQ Guidelines: household fuel combustion – Review 11: Costs and financing
12
2.4. Conclusion
At the micro-level, cost components for stoves vary quite widely, even among a given class or design of stoves (e.g. rocket stoves). At the lowest end, stoves can cost only a few dollars, while more advanced biomass stoves, larger stoves with chimneys, LPG stoves, electric cooking devices, can be in the tens of dollars and higher. Biogas digester systems can easily run into the hundreds of dollars. The existing information on stoves is inconsistent in terms of distinguishing between technology costs, programmatic costs, subsidies and the range of other factors that determine overall stove costs and the relationship between costs and prices. etc. This makes it difficult to establish any sort of long-term trends in stove costs or prices. However, it is clear that to reach significantly lower levels of emissions, the required stove technologies and fuels are those at the higher end of the range, posing a financial challenge to households. This financial challenge is dealt with is Section 4. At the macro-level, calculations of the investments required to achieve universal access vary widely depending upon underlying assumptions. While the IEA estimates universal access by 2030 would cost ~$95 billion (the existing $21 billion assumed to be invested plus an additional $74 billion required for universal access), the GEA estimate is $300 billion. However, significantly, the latter includes fuel costs. In either case, the costs are in the range of a few billion to ten billion dollars per year. This represents only a small fraction of the annual energy investments globally and also a small fraction of what governments spend on energy consumption subsidies already globally. In other words, while significant investments are required, they are not of a scale that makes them unfeasible to mobilize. The larger challenge will be to develop the financial and institutional mechanisms necessary to solve the financing challenge for both organizations and firms wishing to distribute cleaner cooking options and households wishing to adopt cleaner cooking options. While financial barriers are significant, as discussed elsewhere in these Guidelines, diffusion of new cooking technologies and fuels will also require a number of context specific non-financial barriers to adoption to be overcome.
3. Economic analyses: Cost Effectiveness and Cost benefits analysis
The previous section reviewed the costs of cleaner cooking technologies and fuels at both the micro and macro level. While the transition to cleaner cooking would bring significant benefits, the more effective technologies and clean fuels would impose relatively high costs on households that are generally at the lower end of the socio-economic scale and would require mobilizing significant investments across a range of stakeholders (e.g. households, governments, donors, and the private sector). Increasingly, formal economic tools for analyzing the value of a particular action, whether a government regulation or a programmatic activity, have been used to understand how to compare costs and benefits and to make the case for investment in a given technology or activity. These tools have been around for a long time but are only now starting to be deliberately and carefully applied to the cookstove problem. In this section, we briefly review two main criteria for decision-making used to justify cookstove efforts (and other public programs): Cost Benefit Analysis (CBA) and Cost Effectiveness Analysis (CEA). While similar, there are important distinctions between the two that have implications for how attractive a cookstove intervention may appear. We will then review the existing guidelines from the World Health Organization on conducting Cost Benefit Analyses of cookstoves. Finally, we will review the existing studies that apply, at least in part, one of these two methodologies and discuss their findings in terms of overall expectations for the value of cookstove programs.

WHO IAQ Guidelines: household fuel combustion – Review 11: Costs and financing
13
3.1. CBA Versus CEA in Determining Economic Value of Cookstove Programs
In discussing the findings of such analyses and what they signify in terms of justifying large scale interventions to diffuse cleaner cooking technologies, it is necessary to distinguish between two related but distinct approaches: Cost Benefit Analysis (also known as Benefit Cost Analysis) and Cost Effectiveness Analysis (20). Cost Benefit Analysis seeks to delineate the full range of costs of an activity (e.g. a regulation to reduce a pollutant or a programmatic activity to disseminate improved cookstoves) and the full range of benefits that arise from the activity (which can include both monetary and non-monetary benefits). The standard assumption is to consider the costs and benefits from the perspective of a single “social planner.” In reality, of course, costs and benefits accrue to different actors within the system. All costs and benefits are then converted into monetary terms for comparison. The comparison can be either by subtracting costs from benefits to calculate the net benefits or by dividing benefits by costs to obtain the Benefit/Cost ratio. Clearly either positive net benefits or a BCR above 1 indicates that the expenditure is produces more benefits than it costs and define the lower limit of economic viability for a project or program. Of course, the actual threshold for decision-making will depend on the uncertainty in the estimates and the risk-averseness of the decision-maker. While both Net Benefits and Benefit Cost Ratios answer the question of whether benefits outweigh the costs, the information they provide is complementary rather than substitutable (i.e. a program could have high net benefits but a low BCR or vice versa). Despite this, most Cost Benefit Analyses do not report both net benefits and BCR. The BCR can be particularly problematic in the case of stove programs as the use of BCR was originally developed in contexts where costs were always positive (i.e. implementing the program did not result in cost savings). However, with the switch from traditional stoves to improved cookstoves or modern fuels, the monetized fuel savings can be significant and even exceed the costs of the new stove. The result is cost savings (even absent any of the “benefits” included on that side of the ledger) and a BCR that is negative rather than positive since positive Benefits are divided by negative Costs. This is discussed in the results of the WHO’s analysis of global benefits and costs of cookstove interventions (21). By contrast, Cost Effectiveness Analysis starts with a desired objective and examines whether a particular course of action is a cost effective method of meeting that objective. The objective to be met should be well specified and the relevant costs properly accounted for in order to make an accurate comparison. In the case of cookstoves, there are a number of possible objectives. An obvious one, and most relevant to these guidelines, would be the cost effectiveness of improved cooking facilities in reducing negative health outcomes. For example, one could compare the cost per DALY of a cookstove intervention with either other possible cookstove interventions or with other means of reducing the burden of disease to determine whether it is a cost effective means of achieving a given health outcome. Similarly, one could also look at the cost-effectiveness of cookstoves for mitigating climate change, reducing household labor burdens, improving educational opportunities, etc. While both CBA and CEA require a careful accounting of costs and benefits, CEA does not require the conversion of non-monetary benefits (like improved health outcomes) into monetary terms as is the case with CBA. Whether it is a CBA or a CEA, such economic analyses can be of interest to a wide range of stakeholders (consumers, NGOs, donors, governments, private firms) as they can be used to evaluate program alternatives, assess social impacts, and develop new policies.

WHO IAQ Guidelines: household fuel combustion – Review 11: Costs and financing
14
3.2. Guidelines for Conducting CBA
The publication of the WHO CBA guidelines and the demonstration of their application at the micro-scale should hopefully result in further application of CBA (21-23). In particular, future discussions of costs and benefits should be based on more systematic and carefully constructed analyses that properly account for and report on costs and benefits. The remainder of this section briefly summarizes the WHO CBA guidelines in order to further introduce the concept of economic analyses for evaluating cooking programs and some of the factors that would need to be taken into consideration when applying such techniques in the application of the IAQG’s. In considering options for economic evaluation of household energy projects, the WHO CBA Guidelines make a clear distinction between financial and economic analyses (see Table 2, reproduced from the CBA Guidelines). Financial analysis is strictly limited to the monetary aspects of the problem and is concerned with cash flows, expenditures, profits and all other associated financial considerations for both suppliers and consumers of cooking technologies and fuels. The financial aspects of diffusion of cooking technologies and fuels (i.e. financial performance of those implementing cookstove programs or the financial implications for consumers) were discussed above and are considered further below. This section, and the CBA Guidelines, is more concerned with economic analysis. The focus is, therefore, on the overall balance between resource usage and outcomes (both monetary and non-monetary), often taken at the national level, and effectively assuming a single decision-maker that incurs all costs and accrues all benefits. In some cases, (e.g. the Malla et al. study described below), the costs and benefits are broken down for some payers/beneficiaries in order to conduct a CBA for a specific group (e.g. households). However, this is not universally done and when it is, it tends to be limited to a small number of potential sub-groups. Table 2: Differences between financial and economic analysis (21).
Variable Financial Analysis Economic Analysis
Outputs of Interest Income; expenditure; cash flow; profit; end-of-period balance; internal financial rate of return; net present financial value.
Benefit–cost ratio; internal economic rate of return; net present value.
Costs All financial outlays, present or future, which have a monetary cost.
All uses of resources, present or future, which have an economic (“opportunity”) cost.
Examples include actual monetary payments for human resources, materials, or infrastructure.
Examples include the use of scarce human resources, infrastructure that has alternative uses, and donated goods.
Valuation of future expenditures is at present value using market interest rates.
Valuation of future expenditures is at present value using a discount rate that reflects social time preference
a
Consequences All financial consequences of a given or outcomes intervention, including further associated expenditures, cost savings or revenues.
All resource consequences associated with a given intervention, including the freeing up of spare capacity for alternative uses, improvements in qualitative indicators and economic value of resource savings.
a Social time preference is defined as the value society attaches to present, as opposed to future, consumption. The social time preference rate (STPR) is used for discounting future benefits and costs, and is based on comparisons of utility across different points in time or different generations.

WHO IAQ Guidelines: household fuel combustion – Review 11: Costs and financing
15
The WHO guidelines begin with a series of ten questions that can be used to guide any economic evaluation of an intervention, including in cooking technologies/fuels. The questions are designed to ensure that any economic evaluation is both complete and credible. The questions can guide the implementation of the economic analysis in developing a plan for collecting and analyzing relevant data and using the analysis to aid in decision-making (see Box 1 for a summary of the questions and Hutton and Rehfuess 2006 (21) for further expansion on each question).
Box 1: Questions to Guide a Benefit Cost Analysis
1. Was a well-defined question posed in answerable form?
2. Was a comprehensive description of the competing alternatives given?
3. Was the effectiveness of the programmes or services established?
4. Were all the important and relevant costs and consequences for each
alternative identified?
5. Were costs and consequences measured accurately in appropriate physical
units?
6. Were costs and consequences valued credibly?
7. Were costs and consequences adjusted for differential timing?
8. Was an incremental analysis of costs and consequences of alternatives
performed?
9. Was allowance made for uncertainty in the estimates of costs and
consequences?
10. Did the presentation and discussion of study results include all issues of
concern to users?
Source: Summarized from as reproduced in Hutton and Rehfuess 2006 (21)
The core of the economic analysis, once the relevant policy questions have been identified and potential interventions described is to assess the resulting costs and benefits. Hutton and Rehfuess (21) identify five key elements for estimating both costs and benefits:
1. Identification and choice of costs/benefits 2. Quantification of costs/benefits 3. Valuation of costs/impacts 4. Adjustment for differential timing 5. Quantification of uncertainty in costs/impacts
While relatively straightforward in theory, the execution of an economic analysis can be quite complex and involve a number of judgments by the analyst. First, the analyst must determine how to account for differing viewpoints and the flow of funds and services between different actors (e.g. ministries vs. households). Economic analyses generally take a societal viewpoint, as mentioned above, but this requires a careful accounting of the various costs and impacts to ensure there is no double counting and that the evaluation is comprehensive. Second, the analyst must account for costs and impacts that are both direct and indirect. In particular, the degree to which indirect costs/impacts are included and which indirect costs/impacts are included can have significant consequences for the conclusions of the analysis. Figure 3 provides examples of ‘More Direct’ (e.g. direct capital costs or averted health care costs), ‘Less Direct’ (e.g. income impacts or time-use savings) and ‘Least Direct’

WHO IAQ Guidelines: household fuel combustion – Review 11: Costs and financing
16
(e.g. changes in income or education) effects and which ones are generally included in Cost-Benefit Analyses. Figure 3: Distinctions between more direct, less direct and least direct effects of household energy interventions to reduce exposure to indoor air pollution
Source: Adapted from Hutton and Rehfuess 2006 (21). CBA: Cost-benefit analysis. Reproduced with permission
Third, it is necessary to account for costs and impacts over time. In most cases, the majority of investment occurs immediately or over relatively short time horizons (e.g. a few years) while impacts can last for much longer periods of time (i.e. decades). This is true even when financing mechanisms attempt to spread costs out over time in order to reduce the burden on households (see below). The small investments required at the household level for improved cooking and the fact that stoves have lifetimes on the order of a few years in many cases, means that the of financing for would be in the order of a few years. Similarly, overall programs for disseminating stoves might be considered on a five or maybe ten year timeframe. On the other hand, some benefits, such as some health benefits, might have timescales that are on the order of decades. Similarly, changes in time-use might reap rewards significantly later than the investment time horizon (e.g. improved education access). Choosing a relatively short time horizon would mean that some benefits would not be captured in the calculation and the overall Benefit/Cost ratio would decrease. At the same time, the present value of any future cost or impact generally becomes smaller every year due to discounting of future values (as well as becoming increasingly uncertain). The choice of a discount rate for valuing future costs and benefits can have a significant impact on the results given long enough time horizons. It is common when analyzing health related problems to use a “social” discount rate of 3% (as opposed to market based discount rates that can be significantly higher). This ensures that social outcomes that take a while to manifest (e.g. economic effect of diseases that take decades to manifest themselves) will influence the analysis (c.f. Grayelle et al. 2007 (24) or Claxton et al. 2011 (25) for discussion of the debate over appropriate discount rates for health in the U.K. context).

WHO IAQ Guidelines: household fuel combustion – Review 11: Costs and financing
17
However, if the value of environmental amenities grows fast then health benefits could increase with time (26, 27). The degree to which benefits far into the future impact the Benefit-Cost ratio is highly dependent upon the discount rate chosen. Therefore, the choice of time horizons and of discount rate can have a significant effect on the outcome of the analysis. While many economic analyses use time horizons in the range of 10-20 years, the WHO’s general guidelines on conducting economic analyses recommends a ten year time horizon for interventions and a 100 year time horizon for impacts (as some impacts can take many years to manifest themselves). Having established the parameters of the study, it is then necessary to collect and analyze the relevant data. This poses several challenges. We identify three here from the WHO CBA Guidelines that are worth highlighting: Sources of Data As noted above, conducting an economic analysis requires identification and quantification of all relevant costs and impacts to be included in the analysis. The WHO CBA guidelines include a summary of differing types of costs and impacts that can be considered and the different ways of measuring incremental costs. Obtaining accurate cost and impact estimates can be a significant challenge and requires integration of data from a variety of sources. Common sources of data for costs include market prices (e.g. for technologies or fuels), data from government ministries, private firms or NGOs, labor market statistics, surveys and expert opinions. Similarly, impact quantification can rely on sources as varied as surveys, prior studies, routine information sources such as national level data from health information systems or agricultural statistics, or periodic information sources (e.g. household surveys). A key challenge is determining the actual health impacts of any intervention (see Review 4). The cost and complexity of conducting an economic analysis will depend, in part, on the availability of suitable data and the need for additional data collection. Valuation of Costs/Impacts Not all costs or impacts are directly measurable in monetary terms, particularly in the case of impacts. For cooking interventions, non-monetary values could include: health benefits (as measured by mortality, type and severity of illness, etc.); indirect health benefits (e.g. time lost due to illness); changes in time use (e.g. due to changes in required fuelwood collection); changes in the household environment (e.g. in educational activities or productive activities); and local and global environmental effects (e.g. changes in forest resource usage or in climate relevant pollutant emissions). Economic analyses require conversion of such costs and impacts into monetary terms. The WHO CBA Guidelines review three main approaches to converting such non-monetary values into an equivalent monetary value and the choice of approach can have an effect on the resulting cost-benefit analysis. The Human Capital Approach values changes in health by calculating the change in a person’s production in the marketplace, using labor market statistics. Revealed Preference methods use household behavior (e.g. purchasing behavior) to determine the value of a non-monetary good or service. Finally, Contingent Valuation methods use surveys to elicit an individual’s willingness to pay for a good or service. Differing methods are appropriate for differing types of non-monetary goods and services (see Table 13 of (21)), but each also has their own limitations and disadvantages that must be acknowledged and understood (these are also described in the WHO CBA Guidelines). In all three methods, a key challenge is valuing mortality. This can be done by estimating future earnings that are foregone, changes in risk resulting from payments to avoid exposure or willingness to pay based on contingent valuation surveys (21). In all cases, the results are closely tied to the economic status of the population. For example, the “Value of

WHO IAQ Guidelines: household fuel combustion – Review 11: Costs and financing
18
a Statistical Life” (VSL) is often used to convert mortality risks into monetary terms and it is often based upon the willingness to pay to avoid risk (or, put another way, the willingness to pay (WTP) to increase their current chances of survival). This WTP can be then compared to the cost of any intervention. For example, West et al. find a cost of $420,000 per avoided mortality from abatement of CH4 and state that “the 65 MT-yr-1 reduction would be justified in cost-benefit terms, for any globally averaged VSL > $420,000.” Indeed, they use an estimate of $1 million for VSL and find that action to reduce CH4 is justified (28). This WTP will be dependent upon the individual’s wealth (or income), as well as a host of other factors at the individual level (e.g. current health status, current mortality risk and age) and societal level (e.g. other financial obligations in the future or culture) and the nature of the risk being faced (e.g. long versus short term diseases or whether it is an injury versus a disease). While the wealth effect is clear (increasing wealth implies greater WTP and therefore greater VSL), the impact of the other effects is not clear and often context dependent. As discussed below, this can raise a number of questions when applying these techniques across different contexts (29). However, the challenge in the case of valuing mortality benefits of cleaner cooking is two-fold. The first challenge is essentially a technical one, namely the lack of data usually used to make such calculations in the case of developing countries. WTP estimates have been developed for industrialized economies (often on the basis of a relationship between wages and occupational exposure). However, such data might not exist and may be prohibitively complicated to collect for many contexts. Some estimates have been made using statistical techniques (rather than simply scaling from the industrialized estimates on the basis of relative incomes) (30, 31). For example, Bowland and Beghin use regression techniques to estimate willingness to pay on the basis of age, education, gender, etc. using 33 studies from industrialized countries on wage differentials and occupational risk. They then use their regression equation for the urban air pollution problem in Chile and estimate VSL at $519,000-675,000 (1992 PPP$) (31). Other approaches that produce an economic value for life but aren’t based on WTP, include the one used in the follow-on study to the WHO’s Benefit Cost Analysis Guidelines. In that case, averted deaths were valued by multiplying the Gross National Income per capita (GNI) by the number of years lost that a person might earn income (with some assumptions about useful working years and time lags between exposure and disease onset) (22). Smith and Haigler utilize a similar approach in their scoping study of health and climate benefits of energy systems (32). Setting aside the technical challenges, VSL techniques also raise a number of ethical concerns and remain controversial, despite their wide-spread use in Benefit Cost Analysis and regulatory rule-making, as recognized even by those trying to establish the statistical techniques to use it more widely (31, 33). The fact that derived values are at least partially dependent upon income levels means that the VSL will be quite different for countries at differing levels of economic development. This is particularly problematic with a problem like clean cooking, where the majority of impacts are in lower income countries. Larson and Rosen provide a review of this subject for the cooking case (34, 35). As they note, households in developing countries are not only facing a major risk from cooking emissions, but also a number of other risk factors (e.g. lack of clean water access). Accounting for multiple risks could impact the WTP estimates. Second, the use of income ratios to convert VSL estimates is highly dependent upon assumptions made regarding income elasticities for reducing health risks and the correct elasticity is subject to great debate (26, 35). For comparison, a similar problem emerges in climate change, where mortality impacts are projected to be greatest in low-income countries and the choice of VSL method can have a great impact on assumed costs of climate change (36). In that context, Fankhauser et al. found that an equity weighting approach to estimating Willingness to Pay can have a significant effect on assumed damages from climate change (though the effect can both lower and increase damages) (36, 37). Therefore, application of these techniques should be carefully considered in terms of their implications for motivating action and the possible perception issues it raises in terms of equity.

WHO IAQ Guidelines: household fuel combustion – Review 11: Costs and financing
19
Uncertainty Another issue in conducting a comprehensive economic analysis is how to treat uncertainty and sensitivity. Uncertainty and sensitivity analysis is a well-developed field (see (38) for an excellent treatment of the subject) and the WHO Guidelines also summarize some of the major issues in incorporating uncertainty into an economic analysis. The first task is to identify the types of uncertainty, which can include analytical uncertainty (e.g. what variables to include), data uncertainty (e.g. lack of information about a variable) and translational uncertainty (i.e. uncertainty created by transferring results obtained in one context to another context). The second task is to decide on the type of uncertainty analysis to be conducted. This can include variation of the input parameters over a given range, defining a threshold and determining the value of certain inputs that achieve the threshold, and changing model assumptions (e.g. the costs/impacts included, the time horizon or discount rate, etc.).
3.3. CBA and CEA Evidence for Cookstoves
While there are a number of studies that mention costs versus benefits or the cost effectiveness of an intervention, there are very few that make it the focus of analysis and that undertake such an analysis in the careful and methodical way seen in the application of these tools to other problems, including air quality related problems.
3.3.1. CBA studies
The studies that do exist tend to show Benefit Cost Ratios above 1 (the lower limit of economic viability, as described above) and, in some cases, well above 1. Earlier CBAs have tended to focus on a narrow set of costs and benefits. Rubab and Kandpal 1996 calculate a net present value due solely to fuel savings with the more efficient stove of $28 and a stove cost of $5, resulting in a BCR of 5.6, which is significantly above 1 (39). Habermahl’s analysis of a rocket stove project of GTZ’s in Uganda reports a BCR of 25:1 based solely on reductions in morbidity (40). In addition to developing guidelines for conducting cost benefit analysis of cookstove interventions, the WHO conducted an analysis of the aggregate cost and benefits for the different WHO regions, Table 3. The analysis included a broader range of possible benefits that included other burdens of disease, environmental outcomes and time savings. The analysis was conducted for each WHO region, divided between rural and urban populations and for two scenarios (an LPG scenario and an improved stoves scenario). The results (reproduced below) show very high BCRs in some cases (e.g. a global BCR of ~22 for conversion to LPG in urban centres). In other cases, the BCR was positive but closer to 1 (e.g. a BCR of 1.5 for switch to LPG in rural areas of SEAR-D, countries in South East Asia that includes Bangladesh, India, and Nepal among others). Of the 44 outcomes (11 world regions times urban/rural times two scenarios), there were 28 in which the cost savings exceeded the intervention costs. In other words for over half of the results, there were net cost savings rather than positive costs and the Benefit-Cost ratio is overall negative (though in this case a net benefits calculation might have been more informative than a BCR) (22). Others have conducted national level Benefit Cost Analyses along the lines of that conducted by Hutton et al. at the regional scale. For example, an analysis done for Nigeria, also considering a switch to either an improved stove or LPG, found Benefit Cost Ratios in the range of 3 (though reported as the inverse cost-benefit ratio) (41). Malla et al. examined three actual interventions and found BCRs at the household level ranging from 1.4 to 21.4 and high internal rates of return in all three cases. Significantly, the major source of benefits in monetary terms was the savings in fuel costs or time spent collecting fuel as compared to the health benefits (23). Another intervention specific analysis in Mexico similarly found high BCRs (between 9:1 and 14:1) with the majority of the benefit again due to fuel savings (42).
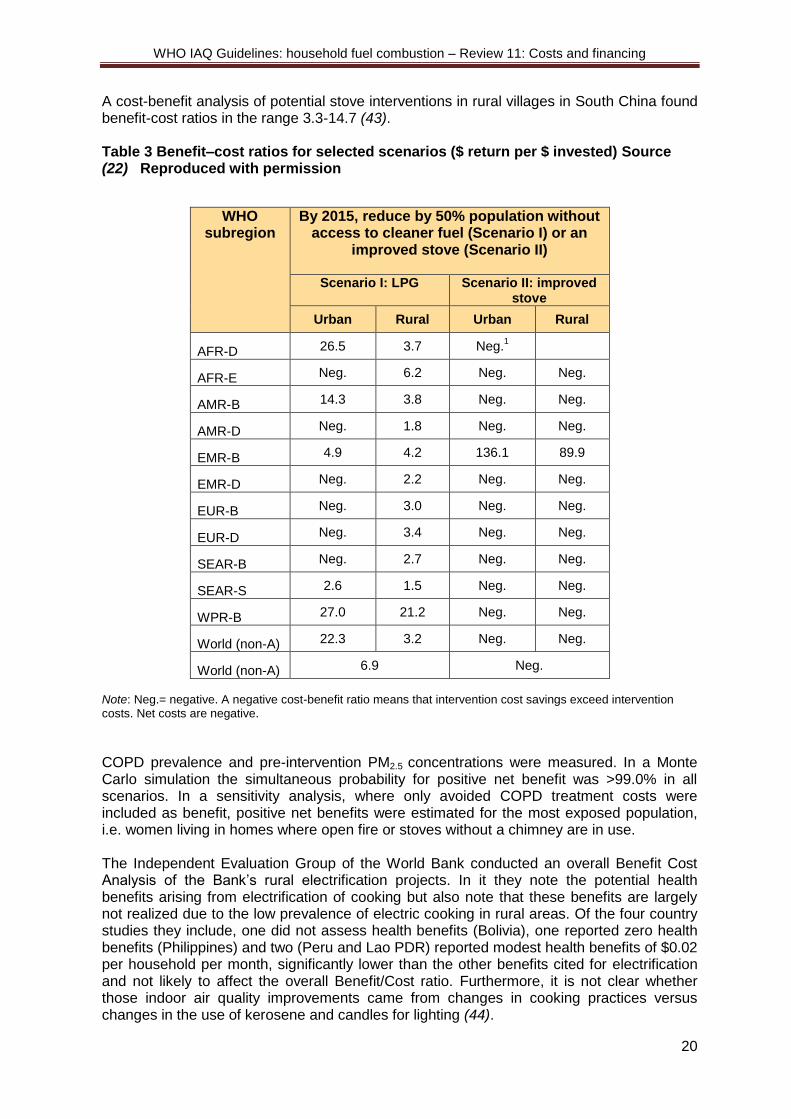
WHO IAQ Guidelines: household fuel combustion – Review 11: Costs and financing
20
A cost-benefit analysis of potential stove interventions in rural villages in South China found benefit-cost ratios in the range 3.3-14.7 (43). Table 3 Benefit–cost ratios for selected scenarios ($ return per $ invested) Source (22) Reproduced with permission
WHO subregion
By 2015, reduce by 50% population without access to cleaner fuel (Scenario I) or an
improved stove (Scenario II)
Scenario I: LPG Scenario II: improved stove
Urban Rural Urban Rural
AFR-D 26.5 3.7 Neg.1
AFR-E Neg. 6.2 Neg. Neg.
AMR-B 14.3 3.8 Neg. Neg.
AMR-D Neg. 1.8 Neg. Neg.
EMR-B 4.9 4.2 136.1 89.9
EMR-D Neg. 2.2 Neg. Neg.
EUR-B Neg. 3.0 Neg. Neg.
EUR-D Neg. 3.4 Neg. Neg.
SEAR-B Neg. 2.7 Neg. Neg.
SEAR-S 2.6 1.5 Neg. Neg.
WPR-B 27.0 21.2 Neg. Neg.
World (non-A) 22.3 3.2 Neg. Neg.
World (non-A) 6.9 Neg.
Note: Neg.= negative. A negative cost-benefit ratio means that intervention cost savings exceed intervention costs. Net costs are negative.
COPD prevalence and pre-intervention PM2.5 concentrations were measured. In a Monte Carlo simulation the simultaneous probability for positive net benefit was >99.0% in all scenarios. In a sensitivity analysis, where only avoided COPD treatment costs were included as benefit, positive net benefits were estimated for the most exposed population, i.e. women living in homes where open fire or stoves without a chimney are in use. The Independent Evaluation Group of the World Bank conducted an overall Benefit Cost Analysis of the Bank’s rural electrification projects. In it they note the potential health benefits arising from electrification of cooking but also note that these benefits are largely not realized due to the low prevalence of electric cooking in rural areas. Of the four country studies they include, one did not assess health benefits (Bolivia), one reported zero health benefits (Philippines) and two (Peru and Lao PDR) reported modest health benefits of $0.02 per household per month, significantly lower than the other benefits cited for electrification and not likely to affect the overall Benefit/Cost ratio. Furthermore, it is not clear whether those indoor air quality improvements came from changes in cooking practices versus changes in the use of kerosene and candles for lighting (44).

WHO IAQ Guidelines: household fuel combustion – Review 11: Costs and financing
21
Using a very different methodology, Jeuland and Pattanayak (2012) conduct a modeling exercise that examined various stove switching options using data from secondary sources and a Monte Carlo simulation to incorporate uncertainty (10). With some exceptions, the net benefits (both private and social) all tended to be positive for the median values of their parameters (the exception being a switch to charcoal). However, the uncertainty ranges were such that a number of interventions could result in net costs rather than net benefits (for example, the 10th percentile outcome for all interventions except kerosene were negative in terms of private benefits to the households) (10). Furthermore, the private benefits were dependent upon the assumptions made regarding carbon offsets. For example, the median private benefits of switching from a traditional stove to an improved stove went from $0.2/HH/month to $0.8/HH/month when carbon offsets for CO2, N2O and CH4 result in household subsidies and then jump to $10 if the carbon offsets include CO, NMHC and black carbon (see Section 4.3 for further discussion of the implications of carbon offset systems). Their results are summarized in Table 4.
Table 4: Range of private net benefits of different stove options as a function of the amount of capital subsidy, and ranges of overall social (all in $/hh-month; parentheses indicate negative outcome).
Source: Adapted from (10). Reproduced with permission
3.3.2. CEA health studies
The results of cost-effectiveness analyses vary widely as they depend on the particular outcome being evaluated. Smith et al. for example, discuss the cost effectiveness of the large Chinese national cookstove program. They note that government expenditures were only 15% of total costs making it highly cost effective in disseminating stoves in comparison to other programs (14). In terms of improved health outcomes, it would appear that cookstoves may be a cost effective means of obtaining significant health improvements. Bailis et al reproduce an analysis that shows that the midpoint estimate for cookstoves are in the range of $100/DALY saved. As seen in Figure 2 of Bailis 2009, this is more than for malaria (~10/DALY saved), and comparable to a number of other interventions (e.g. tobacco addiction and tuberculosis are both ~100/DALY but with greater uncertainty) and significantly cheaper than others (e.g. ischemic heart disease, with a mid-point estimate of roughly $5,000/DALY saved) (3). Mehta and Shahpar estimate that improved stoves could have Cost Effectiveness Ratios as low as $500 (PPP, 2000) per healthy life year gained.2
2 Purchasing Power Parity or PPP exchange rates are often used instead of market exchange rates for
currencies as they account for the relative costs of goods and services between countries by using a standard basket of goods to compare purchasing power of consumers. For example, the market exchange rate between Indian Rupees and U.S. dollars does not account for the fact that many goods and services are significantly cheaper in India than the United States and thus underestimates the buying power of the Rupee in India.
WHO IAQ Guidelines: household fuel combustion – Review 11: Costs and financing
22
However, for cleaner fuels, such as LPG or Kerosene, the CERs range from 1,400 (Western Pacific) to ~$24,000 (Eastern Mediterranean) (15).
3.3.3. CEA for other outcomes
The role of improved cookstoves as a climate change mitigation measure is gaining increasing exposure and raising questions about its cost effectiveness. Masera et al. in 1995 evaluated cookstoves along with other forestry-based measures to sequester carbon in Mexico and found that cookstoves were the least effective in terms of dollars per ton of carbon or carbon dioxide equivalent ($/tC or $/tCO2e). However, this was solely on the basis of avoided deforestation and accounting for carbon uptake by trees (45). More recent evidence regarding the impact of products of incomplete combustion on climate (see Section 5) indicate that the climate impact of cookstoves might be significant and therefore transitioning households away from traditional stoves may end up being a cost effective climate solution. Smith and Haigler 2008 show that switching from coal to biomass gasification in China is cost effective in terms of both health and climate outcomes (32). The overall BCR was 6, with 69% of the benefits coming from improvements in health. In terms of cost effectiveness, the health cost of $370/DALY is significantly lower than the “market threshold” of $1500/DALY based on the GDP/capita/DALY.3 Similarly, the cost of carbon mitigation was calculated to be $5.6/ton CO2e, less than the assumed $10/ton CO2e, though cost-effectiveness would be dependent upon a volatile market (32). Johnson et al. 2009 calculate GHG (greenhouse gas) mitigation costs of approximately $8/tCO2e, making it a cost effective alternative in comparison to many technological options available in developed economies (46). There are a number of other studies that show either various costs of traditional cooking practices or benefits from improved stoves but do not take the next step and calculate the cost effectiveness of the intervention or the benefit cost ratio. For example, Arcenas et al. 2010 calculate the economic costs of resulting from the indoor air pollution due to solid fuel use in three countries (47). Their results illustrate the range of results that can be obtained depending upon the technique used to value mortality (discussed above). The authors estimated mortality impacts using both a Human Capital Approach (mortality valued at foregone wages in the future) and a Value of Statistical Life approach (based upon adjusting existing VSL results based on relative income). For Indonesia, the mortality results alone range from $196 million to $1.9 billion, illustrating the impact that methodology can have on results (with a central estimate of $1.4 billion when all health damages are included). Similarly, for the Philippines, the mortality results range from $67-416 million. To put this in context, their central estimate for Indonesia represents 0.4% of GNI. For Timor Lieste, the third country studied, the higher population adjusted exposures and higher child mortalities associated with solid fuel use, puts their mean estimate for morbidity and mortality damages at 1.4% of GNI (47). However, while they do discuss possible interventions and the results of other Cost Benefit Analyses, they do not present the costs of interventions and so cannot calculate the BCR of interventions in those countries. Nor can they calculate the cost effectiveness of reducing IAP due to solid fuel use as compared to other types of interventions in those countries (47). On the other hand, Budya et al. 2011 (13) do present data on various costs and benefits from the massive Indonesian fuel switching program and clearly show financial benefits outweighing costs for the Indonesian government. However, they also report various other benefits but do not attempt to incorporate them into an overall cost/benefit framework (13).
3 The “market threshold” is defined as 1-3 times the $GDP/capita per DALY, which in the case of China is
equivalent to $1500-$4500 per DALY in 2004.

WHO IAQ Guidelines: household fuel combustion – Review 11: Costs and financing
23
3.4. Conclusion
The existing studies utilizing Benefit Cost or Cost Effectiveness analysis justify significant action to support the transition to cleaner cooking options. Both global and local studies indicate Benefit Cost Ratios well above 1 and the cost effectiveness analyses that have been done show relatively low expenditures per DALY saved. However, these conclusions are on the basis of a very limited number of studies and there are significant challenges in conducting CBAs and CEAs that need to be addressed in order to facilitate further studies, improve the evidence base and inform decision-makers facing competing priorities for limited budgets. In particular:
Coordinated and enhanced data collection efforts to provide the necessary inputs into national analyses would be useful in order to minimize inaccuracies due to data estimation and lack of relevant data on key costs and benefits. This could include specific data collection efforts as well as integration of key data needs into existing large-scale data collection efforts (e.g. national surveys);
Promotion of the value of economic analyses among various stakeholders and training (or promotion of good practices) so that full cost and benefit accounting can be reported. As noted, some studies report out a more limited set of economic or financial information but not enough to fully judge costs and benefits.
Continued development and improvement of methods, including methods for estimating non-monetary impacts (particularly health impacts), accounting for flows of costs and benefits between stakeholders and incorporation of uncertainty.
4. Financing universal energy access
Given the immense scale of global need, it is important to consider what options are available for securing the investment needed, and how the poor can access the energy technology and services along with others who are better off. The International Energy Agency (IEA) has recently published an analysis of the financing requirements that will be needed to achieve the UN Secretary General’s universal access targets, the ‘Energy for all case’ (16). There are a number of other estimates that have been made (e.g. in the recent Global Energy Assessment) and the details and results differ between the different estimates due to the boundary of the analysis and underlying assumptions regarding technologies and costs (see section above on macro-level cost estimates) (11). Here we summarize the IEA estimate in more detail as an example of such estimates. We then discuss some of the opportunities and challenges for creating the financial options that would result in such investments being realized, in particular highlighting questions around producer versus consumer financing. The Energy for All Case of the IEA is compared with the current level of investment and a ‘New Policies scenario’ which takes account of recently announced commitments and plans, although these are yet to be formally adopted. The Energy for all case, like any scenario analysis, is based on assumptions about a mix of on-grid, mini-grid and home based electrification, and the adoption of a mix of advanced (solid-fuel) combustion, biogas and LPG for cooking, with relative proportions varying across different regions of the world. While these assumptions may or may not be the most appropriate over the period considered, this scenario analysis nevertheless provides a useful assessment of the level of investment that would be needed to achieve universal access to low emission solid fuel stoves or clean fuels by 2030 and provides an opportunity to consider the issues and assumptions involved.

WHO IAQ Guidelines: household fuel combustion – Review 11: Costs and financing
24
The investment required has been estimated for both electrification, as well as provision of cleaner stoves and fuels for household cooking and heating needs. Both of these components are important for addressing household air pollution from fuel combustion (and the related risks from burns and poisonings as detailed in Review 10). According to IEA estimates, the levels of investment required for electrification are substantially greater than for cooking and heating needs. In 2009, the IEA estimated that a total of US$ 9.1 billion was invested globally in increasing access to modern energy services (16). Under the new policies scenario, it is expected that around US$ 14 billion per year will be invested to 2030, but this will leave around 1 billion people without electricity, and (due to population growth) around 2.7 billion still relying on traditional solid fuels and technologies. In order to ensure universal access by 2030, an additional US$ 34 billion per year (on average) is required. As noted above, the total required is still only 3% of projected global investment in energy infrastructure over this period. The IEA concludes that this additional investment should come from increased commitments from all sectors, but in particular private finance (16). The levels of investment proposed for the four main sectors are shown in Figure 5. In this regard, the public sector role is also critical and mainly directed at creating the policy and fiscal conditions needed to provide the incentives and reduced risks that will encourage more substantial private finance while also mitigating equity implications of private sector involvement or, even more directly, ensuring the needs of market segments not served by the private sector are met. Mobilization of the private sector in solving energy access problems does raise issues and questions in terms of both the challenges to the sustainability of purely commercial enterprises as well as equity issues given the assumption that private actors are primarily interested in maximizing their financial benefits (3-5). In the case of public-private partnerships, the economic situation of those facing energy access problems can necessitate an explicitly pro-poor approach to partnerships (see (48) for some examples). Figure 5: Investment in modern energy access by source of financing (annual averages)
Source: IEA 2011 (16)
Unfortunately, analyses of financial flows tend to highlight the fact that financial flows (whether in the form of private capital or overseas development assistance) are not at the levels necessary to ensure access (though the analyses tend to either lump together electricity and clean cooking or look primarily at electricity, the conclusions remain relevant). For example, Bhattacharyya 2013 (49) estimates a funding gap of $50-60 billion per year (with a range of $11-120 billion) but also notes that while there is an overall funding gap,

WHO IAQ Guidelines: household fuel combustion – Review 11: Costs and financing
25
that gap is most acute in the least developed countries, precisely where the problem is the largest. He also highlights an important issue. Development assistance from industrialized economies is not likely to fill this gap for a variety of reasons. Instead the gap will have to be filled through South-South mechanisms (e.g. China’s investments in infrastructure in Africa), innovative financing mechanisms (e.g. carbon finance) and the private sector. This will require changes within developing countries to improve the business environment and governance structures in order for those financial flows to be realized (49). Investment for effective development, marketing and adoption of these modern energy services requires a range of innovations in policy and financial instruments (16). These are in general all aimed at extending access through increasing demand (e.g. through stable national policy and targets, consumer credit), reducing risk to investors (e.g. grants, loan guarantees), and extending access and equity (e.g. cross subsidies, microfinance, carbon finance (discussed in more detail in Section 4.3), etc. Although it is beyond the scope of this review to discuss these in great detail, a brief review of options and issues is presented below.
4.1. Producer Versus Consumer Financing Options
In contemplating the various options available for improving the financial feasibility of expanding cleaner cooking options, it is useful to differentiate between those options that are geared towards facilitating the necessary financing to suppliers or producers of technologies and fuels and those geared towards providing financial solutions to consumers that allow them to afford new cooking options (with recognition that there may be overlap between the two). Producer side options can include improved credit facilities, venture capital, new and innovative methods of accessing cross-subsidies, and allowing for a mix of supplier types that may require different levels of return on investment (e.g. facilitating NGOs and Social Enterprises in addition to public and fully private sector solutions). On the consumer side, solutions include direct financing (i.e. extending some form of credit to the consumer through various loan mechanisms), leasing and rental models (though these have been applied more to electricity access solutions than cooking solutions), service models (again, applied more to electricity than cooking thus far), third party financing (e.g. micro-financing or carbon financing), and subsidies (which can be used to either bring down initial capital costs or to reduce ongoing costs, such as fuel costs) (49-52). The role of carbon finance (Section 4.3) and the role of subsidies (Section 4.2) are both discussed further below.
4.2. Role of the Public Sector and Subsidies
While commercial approaches to solving energy poverty problems have recently been promoted there is no evidence that such solutions can effectively meet all of the demand for clean cooking solutions, particularly as fully private sector activities (c.f. (3, 4) plus activities of the Global Alliance for Clean Cookstoves). The public sector (defined loosely here as not only governments, but also donor agencies and NGOs) will clearly continue to play a role including to help achieve more equitable access. This can include providing or facilitating financing options, aiding in technology development, improving technical and human capacity in the sector, etc. One crucial role for governments is to create a stable and supportive policy and regulatory regime that encourages actors in the sector to invest, expand and find innovative solutions to delivering clean cooking solutions. One key aspect of that environment is the subsidy regime in place to support improved energy access. In many cases, the subsidy system, while expending significant amounts of money, does not result in either improved access by those it is most meant to aid and can hinder others from providing solutions that may be more effective (11, 19, 53). In fact, in some cases, energy subsidies designed to be “pro-poor” or improve access can have the

WHO IAQ Guidelines: household fuel combustion – Review 11: Costs and financing
26
opposite effect. As noted by the United Nations Environment Programme, since subsidies have an overall budgetary implication for governments, everybody, including the poor, ends up paying for the subsidy. However, the poor may not benefit as much as others (e.g. energy companies and richer households). UNEP notes three reasons for this (54):
1. Lack of Physical Access or Economic Access: If physical access is lacking (e.g. no connection to the grid or no delivery of LPG), then poor households will not benefit from subsidized energy. Even in cases where physical access is not an issue, some households may still not be able to afford the energy service, even at subsidized prices, while richer households will.
2. Consumption Levels: If both poorer and richer households have access to energy at the subsidized price, richer households will benefit more due to their higher consumption levels.
3. Rationing and Diversion: Where subsidized energy sources (e.g. kerosene in India) are rationed, it is the middle and higher income households that consume the majority of the subsidized fuel. In addition, when subsidized fuels are available alongside commercially priced fuels, there is a strong incentive for diversion of the subsidized fuel into other sectors.
Two particular subsidy issues are highlighted here. First is the issue of first-cost versus recurrent cost subsidies (53). First-cost subsidies are designed to bring down the initial investment needs of a consumer (e.g. the cost of a stove) to one that matches their ability to pay. By contrast, recurrent cost subsidies are designed to reduce the cost of ongoing expenses (e.g. a fossil fuel subsidy that reduces the cost of LPG to households). While both can reduce the financial burden of households for improved energy access, the two different types of subsidies have different effects. First cost subsidies may be favored as a tool for enhancing access as they cover one-time expenditures and solve a major issue for low-income households, namely the lack of savings or access to larger pools of capital (53, 55). Recurrent expense subsidies, particularly fuel subsidies, can be more problematic. They involve ongoing expenditures by the government, are often poorly targeted resulting in subsidy funds being used to reduce the cost of fuel to those that can afford it, and can increase consumption in some sectors with negative consequences (e.g. fossil fuel based emissions) (54, 56) . The environmental implication of energy subsidies is a complicated issue when it comes to clean cooking fuels, however. While some of the literature on subsidies concerns itself with the problems of fossil fuel subsidies (e.g. (19, 54, 56)), many of the cleanest cooking options do involve fossil fuels (e.g. LPG) and achieving greater access among low-income households may require some form of subsidy on such fuels. In other words, the social benefit may justify a subsidy, if properly implemented. Furthermore, given some of the local and global environmental impacts of solid fuel combustion, fossil fuels such as LPG may represent a net environmental improvement over unsustainably harvested and inefficiently combusted biomass (or coal). This is illustrated by the case of Brazil, where a subsidy on LPG is at least partially responsible for significant penetration of the fuel into the household sector with positive implications for both health and local deforestation (57). Second is the issue of the design of the subsidy regime itself, which could alleviate some of the concerns around fuel subsidies. UNEP have developed a set of often-reproduced criteria for energy subsidies though these should perhaps be considered minimum criteria and not guarantees of an effective subsidy (see Box 2) (54, 56). Sovacool 2012 reports on eight case studies globally that demonstrate the potential for public-private partnerships to increase access, as long as those partnerships are designed to be “pro-poor” (48). As he notes, pro-poor private-public partnerships (or 5P rather than traditional PPP) require a different mix of actors and expectations as improving energy access can involve high business risks to the private partner. These 5P cases use a mix of the financing options discussed above (e.g. cash models versus credit models versus fee-

WHO IAQ Guidelines: household fuel combustion – Review 11: Costs and financing
27
for-service models). Sovacool’s conclusions, based on the eight case studies, is that these 5P models occupy a middle ground between the commercial and public sector, incorporate a broader range of actors and stakeholders than traditional PPP and are effective because they focus on markets and energy services rather than on technologies (48). Similarly, Kolk and Buuse 2012 study off-grid renewable energy businesses and find little evidence of purely market based businesses. Instead, the businesses must segment their market such that at least a portion of their customer base is non-subsidized or require investors that are motivated by social concerns as well as profit (58).
Box 2: Criteria for Effective Energy Subsidies
1) Clear Mandates and Soundly Based: Clear mandates for a subsidy with an
associated financial commitment are necessary to ensure costs are allocated
appropriately and outcomes can be clearly measured and assessed.
2) Transparent: The beneficiaries of the subsidy and the financial burden of the subsidy
should be disclosed.
3) Practical: Both the administrative burden of running the subsidy and the overall
financial impact of the subsidy have to reasonable given budgetary and other
constraints.
4) Targeted: This is one of the greatest challenges with subsidies to improve energy
access. Properly targeted subsidies should reach those in need of the subsidy while
reducing leakage of the subsidy to those who can afford the energy technology or
fuel.
5) Phased: Once subsidies are in place, they are difficult to remove. Phased subsidies
with sunset clauses or performance targets ensure that inefficient subsidies can be
removed or replaced.
6) Market Enhancing: To the degree that markets can play a role in promulgating better
cooking solutions, subsidies should at minimum not be harmful to the development of
markets and at best should facilitate market solutions while also encouraging efficient
use of energy.
7) Flexible: Implementation of any large-scale program involves inherent uncertainties
as well as the need to adjust to shifting circumstances. Flexible subsidies can be
adjusted to accommodate new information and new circumstances and improve
efficiency.
8) Complemented: If multiple programs are implemented, subsidies need to be
complementary to ensure effectiveness and efficiency.
4.3. Climate co-benefits of cleaner household fuel combustion and opportunities for carbon finance
Policies and measures to promote cleaner and more efficient household stoves may potentially bring large benefits in terms of avoided emissions of global warming components. The current section gives a brief introduction to how household fuel combustion affects climate, the opportunities to secure carbon financing for stove interventions, and the potential for climate change mitigation through household energy improvements to also bring health benefits.
4.3.1. Climate impacts of incomplete combustion products
4.3.1.1. Radiative forcing components and mechanisms Fuel combustion leads to emissions of a range of pollutants that may affect climate both on a global and a regional scale. Incomplete combustion in household stoves means that some

WHO IAQ Guidelines: household fuel combustion – Review 11: Costs and financing
28
of the fuel carbon is not fully oxidized to CO2 and is emitted as partially combusted components, the most important being carbon monoxide (CO), methane (CH4), non-methane volatile organic components (NMVOC), and carbonaceous aerosols. Carbonaceous aerosols (or soot) is a mixture of organic carbon (OC) and black carbon (BC). Incomplete combustion also implies that some of the fuel nitrogen is oxidized to nitrous oxide (N2O), a strong greenhouse gas. In addition to these products of incomplete combustion (PIC), combustion of household fuels leads to emissions of sulfur dioxide and nitrogen oxides. Moreover, important secondary pollutants, such as ozone, sulfates and nitrates, and secondary organic aerosols are formed in the atmosphere from the primary pollutants. Along with CO2, CH4 and N2O are species included in the Kyoto Protocol. CH4 and N2O have an estimated atmospheric life-time of 12 and 114 years respectively, and are thus well-mixed species (59). Most products of incomplete combustion, however, are short-lived species, with life-times ranging from days to a few months, which means that their distribution in the atmosphere may vary considerably depending on the spatial distribution of emissions sources. Similar to CO2, CH4 and N2O trap long-wave heat radiation from the Earth and thereby contribute to the greenhouse effect. The climate impacts of the PIC gases CO and NMHC are primarily indirect, via atmospheric chemistry processes that affect the abundance of global warming components. For instance, CO contributes to elevated concentrations of CH4 and ozone, both of which are important greenhouse gases. Different from the greenhouse gases, aerosols like carbonaceous aerosols, sulfates and nitrates interfere with solar short-wave radiation. Globally, most aerosols in the atmosphere scatter sunlight [i.e. exert a negative radiative forcing (RF) (see Box 3), but some are absorbing (i.e. exert a positive RF)].
Box 3: Definition of Radiative forcing (RF)
A measure of the net change in the energy balance of the Earth with space,
that is, the change in incoming solar radiation minus outgoing terrestrial
radiation. At the global scale, the annual average RF at the top of the
atmosphere, the tropopause, is generally a good indicator of the global mean
temperature change. For black carbon in particular, RF corresponds less
closely to temperature change than for other agents (60).
To what degree an aerosol scatters or absorbs sunlight depends primarily on the composition and color of the particles, and is measured by its single scattering albedo (SSA) at specified wavelengths. Broadly speaking, bright-colored particles reflect radiation in all directions and back to space. This implies less energy into the system and a cooling effect on global climate. OC, sulfates, and nitrates are scattering aerosols. Darker aerosols absorb sunlight, thereby contributing to atmospheric heating. BC is the main absorbing aerosol. Pure carbon aerosols are defined as either BC or elemental carbon (EC) depending on measurement technique. While often assumed to be the same, BC or EC concentrations may differ substantially depending on measurement technique (61). In reality the morphology of carbonaceous soot is more complex than the dichotomous distinction between BC (or EC) and OC suggests. Scattering and absorbing properties display a continuum, may differ depending on the wavelength, and are affected by aging and coating of the primary particles. Some organic matter in carbonaceous aerosols also absorbs radiation, particularly at shorter wavelength (62).

WHO IAQ Guidelines: household fuel combustion – Review 11: Costs and financing
29
As all aerosols interfere with sunlight, high concentrations of aerosols in the atmosphere leads to less sunlight reaching the surface, and a surface cooling may result regardless of whether the atmosphere above is heated or not. Changes in the vertical temperature profile may affect evaporation, latent heat fluxes, atmospheric stability and the strength of convection. This may lead to changes in the larger scale hydrological cycles and regional precipitation patterns (63). For example, studies indicate that increased emissions of carbonaceous aerosols, especially BC, may have played a vital role in the drying trend over tropical Africa, and generally that these emissions seem to affect the hydrologic cycle in the region (64, 65). In addition to the direct cooling and heating effects resulting from aerosols’ interference with sunlight, various indirect effects occur due to the way aerosols affect cloud formation and brightness. While complex and not well understood, cloud effects most likely imply an overall cooling of Earth’s climate. Finally, carbonaceous aerosols, particularly BC, may have a strong warming effect on climate by reducing the albedo of snow and ice on which it is deposited. Ultimately, melting of snow and ice may result from BC deposition. BC albedo effects are found to be particularly strong in the Himalayas and the Arctic (66). The climate effect of short-lived species depends on where and when the emissions are introduced into the atmosphere – both the regional distribution, the resulting distribution as a function of altitude, and the distribution relative to surfaces with high albedo (clouds, snow and ice) are important (67, 68). For instance, BC in low atmospheric layers seems to exert a lower top-of-the-atmosphere RF compared to BC in higher layers (69). Thus, if BC is transported to higher altitudes in the atmosphere, and particularly when reaching above bright clouds, the RF increases compared to a lower position. Seasonal emission patterns may also be of importance, as temperature and humidity as well as the solar flux and angle may affect the atmospheric chemistry and the resulting RF exerted by species. Models used to estimate the RF from emissions may have different parameterization of features and processes, leading to different estimates of both atmospheric burden and RF from an identical emission perturbation (70).
4.3.1.2. Comparing the impacts of radiative forcing components The Global Warming Potential (GWP, see Box 4) is a metric that is used by the Intergovernmental Panel on Climate Change (IPCC) and in the Kyoto Protocol to compare the impacts of various well-mixed, long-lived greenhouse gases.
Box 4: Definition of Global Warming Potential (GWP)
GWP is defined as the integrated radiative forcing due to 1 kg of
emission of a pollutant relative to that of 1 kg of CO2 over a
particular time period such as 20 or 100 years. It is expressed in
terms of equivalent carbon dioxide (CO2e) emissions. The GWP
compares the integrated radiative forcing of pulse emissions of
particular forcing agents with the forcing from of an equal mass of
carbon dioxide over some chosen time period. The GWP with a time
horizon of 100 years (GWP100) is used in the Kyoto Protocol.
The metric was developed to enable ‘cost-effective’ policy solutions to achieving specific targets. The underlying assumption is that mitigation of different gases and emission sources can have an equivalent impact on global warming and that GWP values enable an assessment of equivalency. GWP values vary in the literature and increased understanding has led to GWP values being revised in later IPCC assessments compared to the values that are applied in the Kyoto Protocol. These adjustments are, however, not very large. A more noticeable development since the GWP was first introduced is attempts to estimate

WHO IAQ Guidelines: household fuel combustion – Review 11: Costs and financing
30
and apply the GWP concept for short-lived species. There are many limitations to the GWP concept as such and especially with regards to its use for short-lived species. For instance, the applied time horizon of the GWP (for instance 20 years versus 100 years) may strongly affect conclusions about cost-effectiveness of alternative policies. Which time horizon to choose depends on the purpose of an analysis, what targets are addressed and the temporal scale of targets, and thus involves value-laden choices (67).
4.3.1.3. Climate impact of household solid fuel burning – current estimates BC (or more generally, absorbing aerosols) is gaining increasing attention as a potent warming component. BC is claimed to be the second or third most important individual anthropogenic warming agent after CO2 and possibly methane (63, 71-73). Household solid fuel use in developing countries has been identified as a major source of BC, contributing about one fourth of total global emissions, second only to open burning of forests, savanna, grasslands etc. (74). Mitigation policies targeting household fuel combustion are among the least expensive options for BC abatement, which makes such policies particularly attractive in context of achieving health and climate co-benefits (75). Measures designed to reduce BC typically also have considerable impact on other PICs, as OC (thus on fine fraction particulate matter in general) and CO emissions (see Review 4 for impacts of fine fraction particulate matter (PM2.5) and CO on health). To estimate the net impact of solid household fuel burning and how abatement actions may affect global warming one therefore needs to take into account the full portfolio of co-emitted species. Estimations of the net impact on climate of these emissions is highly sensitive to, inter alia, assumptions about the balance of cooling and warming components and the vertical distribution of pollutants in the models used. While household coal burning is estimated to imply a clear net positive RF, results for household biomass burning are ambiguous (72, 76, 77). An assessment of opportunities for air pollution and climate benefits from reducing short-lived climate forcers carried out by UNEP (2011) note the larger uncertainties attached to estimating the net climate effect of BC abatement compared to CH4 abatement, but conclude that BC abatement likely lead to climate benefits. Notably, they estimate that a switch from traditional biomass cookstoves to stoves fueled by LPG or biogas or to fan-assisted biomass stoves in developing countries is the policy option for BC reduction that would have, by far, the largest impact on global temperature in 2050. The report stresses that only a combination of abatement of short-lived forcers, methane and CO2 substantially reduces the risk of exceeding the 2⁰C target in both the short run and the
long run (60, 66) Summary:
Incomplete combustion of solid household fuels implies that a certain fraction of the fuel carbon is not fully oxidized to CO2 during the combustion process. This means less energy is produced than under optimal combustion conditions and that the fuel carbon is instead converted into various products of incomplete combustion (PIC).
Many PIC components exert a radiative forcing (RF) of climate, either because they are greenhouse gases (GHGs) able to trap long wave heat radiation from the Earth (methane, N2O), they affect GHGs via chemical processes in the atmosphere (CO, nmVOC), or because they interfere with short wave solar radiation and/or they affect climate through impacts in clouds (particulate matter/aerosols).
Many PIC components are toxic and carcinogenic substances (see Review 4).
As incomplete combustion of household fuels results in emissions that are both health damaging and affect climate, switching to fuels and technologies that imply less fuel is burnt under suboptimal conditions, would have benefits for both health and climate.

WHO IAQ Guidelines: household fuel combustion – Review 11: Costs and financing
31
4.3.2. Opportunities to secure carbon finance
Emissions of short-lived climate forcers (particularly BC) as well as the GHGs included in the Kyoto Protocol (CO2, CH4, N2O) constitute an important opportunity for reaping climate benefits of stove interventions. Current climate financing schemes allow only inclusion of avoided emissions of Kyoto gases. While avoided emissions of short-lived climate forcers, as well as the health benefits described elsewhere in this report, are both likely co-benefits of stove interventions, mechanisms to account for these in current carbon finance schemes are not established. In the following, an introduction to carbon finance schemes and opportunities for accessing carbon finance for household stove interventions are given. Finally, we briefly discuss opportunities for including impacts on health and short-lived climate forcers into carbon market projects.
4.3.2.1. Carbon finance schemes The lion’s share of the global carbon credit market is the European Emission Trading Scheme (EU-ETS), which constituted 84% of the global market in 2010. EU-ETS is a major pillar of the climate policy of the European Union, launched in 2005. It follows the ‘cap and trade’ principle, hence a cap is set on the total emission of GHGs from all participating institutions and ‘quotas’ (European Union Allowances - EUA) are allocated (by auction or for free) and can then be traded. Carbon credits under the Clean Development Mechanism (CDM) of the Kyoto Protocol (denoted Certified Emission Reductions – CER) had 14% of the market, whereas other allowances and offsets constituted the remaining 2%. Uncertainties about post-2012 regulations and other factors as declining CER prices and high price volatility, have currently decreased the value of primary CDM (purchased from original parties generating the reduction – an indicator of registration of new projects) (78). As the balance between supply and demand determines the price of CERs, the price is sensitive to economic fluctuations as well as establishment of new trading schemes (especially in large countries, e.g., China). Of course, substantial investment in renewable energy will also reduce the demand for CER and thus affect the price. Whereas household stove projects currently account for a negligible share of the total carbon credit market, this segment of the market is growing rapidly. Two main schemes for obtaining carbon finance of household stove interventions in developing countries exist. These are compliance market projects under the CDM4 and voluntary market arrangements. Regarding CDM, the number of individual projects and Program of Activities (see below) increased from 11 in 2009, one year after relevant CDM methodologies were approved, to 63 in 2012. Still, however, many more offsets are traded on the voluntary market compared to the CDM market - more than three times as many in 2012 (79). In 2011, 4% of the total offsets traded in the voluntary market were from cook stove projects. Particularly, the number of offsets from projects in Africa that promote the use of clean cookstoves among the rural poor is increasing rapidly, from 2010 to 2011 the increase was at least 40 percent (80). In addition to the CDM and voluntary market arrangements, a range of donor driven programs assist projects in linking up to these schemes, for instance various carbon funds and facilities of developments banks such as the World Bank (WB) and Asian Development Bank. The CDM allows projects in developing countries to generate emission credits (CERs) that can be bought by industrialized countries (and firms in these countries) and used to fulfill their commitments under the Kyoto Protocol.5 The European Emission Trading Scheme (EU-ETS), as well as other carbon trading schemes, such as the global voluntary emission trading scheme and the Japanese emission trading scheme, allow for some inflow of CER (i.e. CERs can replace EUAs and allowances in the other schemes up to a certain level). After 2012 EU-ETS allow only for CERs generated in the least developed countries (LDCs).
4 For economies in transition, the Joint Implementation mechanism is available.
5 CDM projects should also support sustainable development in the host developing country.

WHO IAQ Guidelines: household fuel combustion – Review 11: Costs and financing
32
Carbon credits generated by voluntary market projects are denoted verified (or voluntary) emission reductions (VER) and are not recognized under the Kyoto Protocol or the EU-ETS.
4.3.2.2. Estimation of emission reductions To obtain carbon finance from either of these schemes the intervention project must establish the CO2 equivalent emission reduction. This, together with a detailed description of all elements of the project, is presented in the Project Design Document (PDD). A project’s emission reduction is calculated from an estimated emission baseline minus the estimated emission after the project is implemented. Any leakage resulting from the project (i.e. increased emissions outside the project that are due to the project) shall be included in the calculation. A range of methodologies have been developed to ensure projects deliver real and permanent emissions reductions. Methodologies are regularly revised and expand in numbers as project developers are free to submit a new methodology. Current methodologies available under the CDM are described in (81). PDDs of all CDM projects, with description of how emission reductions are estimated, can be downloaded from UNFCC’s web page: http://cdm.unfccc.int/Projects/projsearch.html Current methods for estimating the emission baseline of stove intervention projects have been criticized. For instance, current methods for estimating the fraction of non-renewable biomass harvesting in the baseline is disputed. As this fraction is a primary source of carbon credits it is critical to the profitability of projects that it is adequately estimated. Current CDM methods suggest no specific assessment method and use a general definition of renewable biomass instead of requiring an assessment of the local conditions when it comes to potential non-renewable harvesting in the project area. There is also dispute about the emission factors to be used in the baseline calculation. The current CDM method uses IPCC default emission factors for fossil fuels, which may be very different from emissions factors for solid fuel burned in cook stoves (82).
4.3.2.3. Project types and Gold Standard label Regarding projects to upgrade household biomass stoves there is currently one methodology under the CDM, the CDM AMS II.G, denoted “Small-scale Energy Efficiency Measures in Thermal Applications of Non-Renewable Biomass”. This is a simplified methodology for replacing non-renewable biomass by renewable energy or improving efficiency in non-renewable biomass end-use. The method is applicable for projects in areas where one is able to substantiate that wood combusted in stoves originates from non-renewable stocks in the baseline. Projects with renewable wood, crop residues, or dung combustion in baseline are not eligible. The basic assumption for exclusion of these fuels is the assumption that the stock is rapidly replaced and there are no net CO2 emissions. Particularly for slow growing wood, it has been estimated, however, that the Global Warming Potential (GWP, see Box 4) of CO2 from renewable harvesting has a value larger than zero (83). So far, only avoided CO2 emissions are included in CDM AMS II.G. In reality, more efficient biomass stoves and switch to renewable energy will also reduce CH4 and N2O (Kyoto gases, see above). In the voluntary market both CO2 reductions from avoided use of non-renewable wood fuel and CH4 and N2O may be included in the VERs. The methodology used is denoted Gold Standard Methodology for “Improved Cooking Stoves and Kitchen Regimes” and involves a range of requirements for certification6. CDM projects may also obtain the Gold Standard Label as an additional quality label. Since the price of the carbon credits is negotiated between the buyer and seller, such quality labels
6 Gold Standard certification of renewable energy and energy efficiency carbon offset projects shall ensure that
real and permanent GHG reductions and sustainable development benefits are measured, reported and verified. The largest single issuance so far for all cookstove projects under the Gold Standard Registry was issued for a project in Ghana in 2012 as a quarter million Verified Emission Reductions (VERs) were generated and sold through the Gold Standard Registry http://www.cdmgoldstandard.org/

WHO IAQ Guidelines: household fuel combustion – Review 11: Costs and financing
33
may be of importance in addition to major issues such as assumed financial risks and general market conditions. Other types of stove projects reducing non-renewable biomass in stoves, such as biogas and solar cookers, are also eligible under the CDM, (see (81) for details on methodology). Completing the cycle of actions needed before CERs/VERs of a small-scale single stove intervention project can be issued is a cumbersome and time-consuming affair. To overcome the proportionately high transaction costs for small-scale projects, the programmatic CDM approach (Programme of Activities – PoA) was established in 2007. A PoA is a set of individual small projects (CDM Programme Activities – CPA). As soon as the PoA is registered, the time needed for individual CPAs to be included and registered is considerably reduced. This is attractive for investors as the time lag between their pre-payment and access to the carbon credits becomes shorter, and the financial risks are reduced. The same methodologies may be applied for individual CPAs as are available for single projects.
4.3.2.4. Monitoring Monitoring of emission reduction must be carried out before CERs/VERs can be issued. Most projects issue credits on a yearly basis. The PDD shall contain a description of how and when monitoring will take place. For projects using the methodology AMS.II.G the project operator shall check efficiency of all appliances or a representative sample to ensure that they are still operating at the specified efficiency or replaced by an equivalent in service appliance. Where replacements are made, monitoring shall also ensure that the efficiency of the new appliances is similar to the appliances being replaced. Under the CDM, project operators may choose between laboratory tests like the Water Boiling Test or controlled cooking tests. Under the Gold Standard only kitchen tests are applicable. An independent institution (Designated Operational Entity) verifies the monitoring report, and if approved CERs/VERs are issued (84). Monitoring is of critical importance to the credibility of carbon finance schemes. The monitoring and certification procedure for carbon credits has been pointed at as a particularly beneficial aspect of carbon finance, as it gives a value to the delivery of outcomes rather than inputs. This provides an incentive to ensure the long-term functioning of stove interventions, an element often missing in stove intervention programs (85).
4.3.2.5. Profitability and demand for stove intervention projects The profitability of stove intervention projects depends on both the costs of the project and the price of the CERs/VERs that are produced. CDM-related fees and consultancy costs involved in registration, validation, verification and certification etc. are more or less fixed, whereas other items such as developing the baseline, carrying out monitoring etc. may vary between projects. CDM-fee reduction or exemption is in place for projects in LDCs and for Gold Standard projects. The revenue of a project is a function of the number of CERs/VERs obtained as well as their price. The number of credits varies depending on the methodology chosen (e.g. the CDM AMS II.G typically renders fewer compared to the Gold Standard as only CO2 is included), the efficiency of the stoves introduced, and, as described above, the fraction of non-renewable biomass in the baseline. Whereas the programmatic approach increases the profitability of stove improvement projects and thus may have a positive impact on demand for such projects, barriers to upscale remain. Facing the low carbon price resulting from uncertainties about post-Kyoto regulations and other factors, leading developers in the voluntary carbon market are looking beyond emissions reductions to get projects financed. Monetizing health co-benefits has been suggested as a possible means of attracting donors. Accounting for co-control of

WHO IAQ Guidelines: household fuel combustion – Review 11: Costs and financing
34
short-lived climate forcers could be another and would also link into the health impacts because of the importance of the short-lived climate forcers for health damage (especially BC, a sub-fraction of fine PM). Bilateral and multilateral donors could choose to finance activities reducing these emissions for the specific purpose of near-term climate benefits to sensitive areas such as the Himalayas and the Arctic (60). Summary:
There is a significant potential for using carbon offset mechanisms to finance projects and programs to promote access to cleaner household energy. However, uncertainties about the carbon offset market imply uncertainties about the profitability of projects. Thus, any financial motives of project developers in most cases need to go hand in hand with a broader agenda for sustainable development and welfare.
Many carbon offset projects for improved household energy are likely to bring health and additional climate benefits due to co-control of air pollutants. We suggest opportunities and methodologies for accounting for these co-benefits to health and climate in carbon offset schemes should be explored. State-of-the-art methods for assessing health impacts and radiative effects of air pollutants may be applied, and developed over time as increased understanding of impacts of these components is gained.
5. Conclusions While the investment needs are significant, they remain relatively small in comparison to overall investment annually in the energy sector as a whole. What makes these investments challenging are the particular nature of the markets and consumers being served and the mix between public and private actions that are likely necessary to significantly increase access. Furthermore, in considering these investment options, financial instruments and implementation, it is important maintain a perspective of equity, especially given that the health burden is greatest among the least well-off. This will need to form an important aspect of planning, as well as in monitoring and evaluation efforts, taking into account the impacts of different financing methods. However, even with these challenges, the goal of financing universal access appears achievable through concerted efforts by all interested parties. The lack of a one-size-fits-all solution does increase the transaction costs of finding suitable solutions but there are a number of possible financing options suited to different types of interventions and contexts and creative solutions to solving the financing gap for both producers and consumers are continuously being developed. It is also clear that there is a need for a strong, but better rationalized, subsidy regime that ensures coverage to the most vulnerable and makes new solutions affordable in situations where the private sector or other actors cannot sustainably provide them. At the same time, the subsidy regime should ideally be designed to facilitate and promote other avenues and solutions when possible.

WHO IAQ Guidelines: household fuel combustion – Review 11: Costs and financing
35
References
1. HEDON. Household Energy Network Stove Database 2013. Available from: http://www.hedon.info//Stoves+Database?bl=y. 2. Pachauri S, Brew-Hammond A, Barnes DF, Bouille DH, Gitonga S, Modi V, et al. Chapter 19 - Energy Access for Development. Global Energy Assessment - Toward a Sustainable Future. Cambridge University Press, Cambridge, UK and New York, NY, USA and the International Institute for Applied Systems Analysis, Laxenburg, Austria2012. p. 1401-58 ST - Chapter 19 - Energy Access for Dev. 3. Bailis R, Cowan A, Berrueta V, Masera O. Arresting the Killer in the Kitchen: The Promises and Pitfalls of Commercializing Improved Cookstoves. World Development. 2009;37:1694-705. 4. Shrimali G, Slaski X, Thurber MC, Zerriffi H. Improved stoves in India: A study of sustainable business models. Energy Policy. 2011;39:7543-56. doi: 10.1016/j.enpol.2011.07.031. 5. Kowsari R. Twisted energy ladder: complexities and unintended consequences in the transition to modern energy services. Vancouver, BC: University of British Columbia; 2013. 6. Howells M, Victor DG, Gaunt T, Elias RJ, Alfstad T. Beyond Free Electricity: The Costs of Electric Cooking in Poor Households and a Market-friendly Alternative. Energy Policy. 2006;34(17):3351–8. 7. International Energy Agency. Energy and Development Methodology. 2010. 8. Chen Y, Yang G, Sweeney S,Feng Y. Household biogas use in rural China: A study of opportunities and constraints. Renewable and Sustainable Energy Reviews. 2010;14:545-9. doi: 10.1016/j.rser.2009.07.019. 9. Garfí M, Cadena E, Pérez I, Ferrer I. Technical, economic and environmental assessment of household biogas digesters for rural communities. Renewable Energy. 2014;62:313-8. doi: 10.1016/j.renene.2013.07.017. 10. Jeuland MA, Pattanayak SK. Benefits and Costs of Improved Cookstoves: Assessing the Implications of Variability in Health, Forest and Climate Impacts. PLoS ONE. 2012;7:e30338. doi: 10.1371/journal.pone.0030338. 11. GEA. Global Energy Assessment - Toward a Sustainable Future. 2012. 12. Kees M, Feldmann L. The role of donor organisations in promoting energy efficient cook stoves. Energy Policy. 2011;39:7595-9. doi: 10.1016/j.enpol.2011.03.030. 13. Budya H, Yasir Arofat M. Providing cleaner energy access in Indonesia through the megaproject of kerosene conversion to LPG. Energy Policy. 2011;39:7575-86. doi: 10.1016/j.enpol.2011.02.061. 14. Smith KR, Shuhua G, Kun H, Daxiong Q. One hundred million improved cookstoves in China: How was it done? World Development. 1993;21:941-61. doi: 10.1016/0305-750X(93)90053-C. 15. Mehta S, Shahpar C. The health benefits of interventions to reduce indoor air pollution from solid fuel use: a cost-effectiveness analysis. Energy for Sustainable Development. 2004;8:53-9. doi: 10.1016/S0973-0826(08)60466-4. 16. IEA. Energy for All: Financing access for the poor (Special early excerpt of the World Energy Outlook 2011). World Energy Outlook 2011. Paris, France: International Energy Agency (IEA); 2011. p. 52. 17. Bazilian M, Nussbaumer P, Haites E. Understanding the Scale of Investment for Universal Energy Access. Geopolitics of Energy. 2010;32. 18. WHO. Evaluation of the costs and benefits of household energy and health interventions at global and regional levels, (2006) Available at: http://www.who.int/indoorair/publications/evaluation/en/ (Accessed 17 July 2014). 19. International Energy Agency. World Energy Outlook 2011. Paris, France: OECD Publishing; 2011.
WHO IAQ Guidelines: household fuel combustion – Review 11: Costs and financing
36
20. Drummond MF, O'Brien B, Stoddart GL, Torrance GW. Cost-benefit analysis. Methods for the economic evaluation of health care programmes. New York Oxford Medical Publications, Oxford University Press; 1997. 21. Hutton G, Rehfuess E. Guidelines for conducting cost-benefit analysis of household energy and health interventions. Geneva: World Health Organization, 2006. 22. Hutton G, Rehfuess E, Tediosi F. Evaluation of the costs and benefits of interventions to reduce indoor air pollution. Energy for Sustainable Development. 2007;XI. 23. Malla MB, Bruce N, Bates E, Rehfuess E. Applying global cost-benefit analysis methods to indoor air pollution mitigation interventions in Nepal, Kenya and Sudan: Insights and challenges. Energy Policy. 2011;39:7518-29. doi: 10.1016/j.enpol.2011.06.031. 24. Gravelle H, Brouwer W, Niessen L, Postma M, Rutten F. Discounting in economic evaluations: stepping forward towards optimal decision rules. Health Economics. 2007;16:307-17. doi: 10.1002/hec. 25. Claxton K, Paulden M, Gravelle H. Discounting and decision making in the economic
evaluation of health‐care technologies. Health Economics. 2011;20:2-15. doi: 10.1002/hec. 26. Hammitt JK, Robinson La. The Income Elasticity of the Value per Statistical Life: Transferring Estimates between High and Low Income Populations. Journal of Benefit-Cost Analysis. 2011;2(1). doi: 10.2202/2152-2812.1009. 27. World Bank. Air Quality Analysis of Ulaanbaatar: Improving Air Quality to Reduce Health Impacts. Washington, DC: World Bank, Sustainable Development Department (EASSD) of the East Asia and Pacific Region, 2011 66082 V1. 28. West JJ, Fiore AM, Horowitz LW, Mauzerall DL. Global health benefits of mitigating ozone pollution with methane emission controls. Proceedings of the National Academy of Sciences of the United States of America. 2006;103(11):3988-93. 29. Roman H, Hammitt JK, Walsh TL, Stieb DM. Expert elicitation of the value per statistical life in an air pollution context. Risk analysis. 2012;32(12):2133-55. doi: doi:10.1111/j.1539-6924.2012.01826.x. 30. Bellavance F, Dionne G, Lebeau M. The value of a statistical life: a meta-analysis with a mixed effects regression model. Journal of health economics. 2009;28:444-64. doi: 10.1016/j.jhealeco.2008.10.013. 31. Bowland B, Beghin J. Robust estimates of value of a statistical life for developing economies. Journal of Policy Modeling. 2001;23:385-96. 32. Smith KR, Haigler E. Co-benefits of climate mitigation and health protection in energy systems: scoping methods. Annual Review of Public Health. 2008;29:11-25. doi: 10.1146/annurev.publhealth.29.020907.090759. 33. Viscusi WKIP. The Value of a Statistical Life: A Critical Review of Market Estimates Throughout the World. 2003:5-76. 34. Larson BA, Rosen S. Household Benefits of Indoor Air Pollution Control in Developing Countries. 2000. Available at: http://pdf.usaid.gov/pdf_docs/PNACN655.pdf (Accessed 17 July 2014). 35. Larson BA, Rosen S. Understanding household demand for indoor air pollution control in developing countries. Social Science & Medicine (1982). 2002;55:571-84. 36. IPCC. Climate Change 2007: Impacts, Adaptation and Vulnerability. Contribution of Working Group II to the Fourth Assessment Report of the Intergovernmental Panel on Climate Change. Alzaraz EdA, Allali A, Kajfez-Bogataj L, Love G, Stone J, Ypersele JPV, et al., editors. Cambridge, UK: Cambridge University Press; 2007. 37. Fankhauser S, Tol RSJ, Pearce DW. The Aggregation of Climate Change Damages : A Welfare Theoretic Approach. 1997:249-66. 38. Morgan MG, Henrion M, Small M. Uncertainty: a guide to dealing with uncertainty in quantitative risk and policy analysis. Cambridge, UK: Cambridge University Press; 1990. 39. Rubab S, Kandpal T. Biofuel mix for cooking in rural areas: implications for financial viability of improved cookstoves. Bioresource Technology. 1996;56:169-78. 40. Habermehl H. Economic evaluation of the improved household cooking stove dissemination programme in Uganda : Dissemination of the Rocket Lorena stove in the districts of Bushenyi and. Eschborn. 2007.

WHO IAQ Guidelines: household fuel combustion – Review 11: Costs and financing
37
41. Isihak S. Interventions for mitigating indoor-air pollution in Nigeria: a cost-benefit analysis. International Journal of Energy Sector Management. 2012;6(3):417-29. 42. García-Frapolli E, Schilmann A, Berrueta VM, Riojas-Rodríguez H, Edwards RD, Johnson M, et al. Beyond fuelwood savings: Valuing the economic benefits of introducing improved biomass cookstoves in the Purépecha region of Mexico. Ecological Economics. 2010;69:2598-605. doi: 10.1016/j.ecolecon.2010.08.004. 43. Aunan K, Alnes LWH, Berger J, Dong Z, Ma L, Mestl HES, et al. Upgrading to cleaner household stoves and reducing chronic obstructive pulmonary disease among women in rural China — A cost-benefit analysis. Energy for Sustainable Development. 2013;17(5):489-96. doi: 10.1016/j.esd.2013.06.002. 44. World Bank, Editor. The Welfare Impact of Rural Electrification: A Reassessment of the Costs and Benefits2008; Washington, DC: Independent Evaluation Group, The World Bank. 45. Omar R. Masera, Mauricio R. Bellon, Segura G. Forest management options for sequestering carbon in Mexico. Biomass and Bioenergy. 1995;8(5):357-67. 46. Johnson M, Edwards R, Ghilardi An, Berrueta V, Gillen D, Frenk CA, et al. Quantification of Carbon Savings from Improved Biomass Cookstove Projects. Environmental Science & Technology. 2009;43:2456-62. doi: 10.1021/es801564u. 47. Arcenas A, Bojö J, Larsen B, Ruiz F. The Economic Costs of Indoor Air Pollution : New Results for Indonesia , the Philippines, and Timor-Leste. Journal of Natural Resources Policy Research. 2010:37-41. 48. Sovacool BK. Expanding renewable energy access with pro-poor public private partnerships in the developing world. Energy Strategy Reviews. 2012:1-12. doi: 10.1016/j.esr.2012.11.003. 49. Bhattacharyya SC. Financing energy access and off-grid electrification: A review of status, options and challenges. Renewable and Sustainable Energy Reviews. 2013;20:462-72. doi: 10.1016/j.rser.2012.12.008. 50. Glemarec Y. Financing off-grid sustainable energy access for the poor. Energy Policy. 2012;47:87-93. doi: 10.1016/j.enpol.2012.03.032. 51. Gujba H, Thorne S, Mulugetta Y, Rai K, Sokona Y. Financing low carbon energy access in Africa. Energy Policy. 2012;47:71-8. doi: 10.1016/j.enpol.2012.03.071. 52. Zerriffi H. Innovative business models for the scale-up of energy access efforts for the poorest. Current Opinion in Environmental Sustainability. 2011;3(4):272-8. 53. Barnes DF, Halpem J. Subsidies and Sustainable Rural Energy Services: Can We Create Incentives Without Distorting Markets?, (2000). Available at: http://documents.worldbank.org/curated/en/2000/12/1089491/subsidies-sustainable-rural-energy-services-can-create-incentives-without-distorting-markets (Accessed 17 July 2014) 54. UNEP, editor Reforming Energy Subsidies: Opportunities to Contribute to the Climate Change Agenda 2008; Geneva. 55. Barnes DF, Halpern J. The role of energy subsidies. Energy Services for the World’s Poor: ESMAP Energy and Development Report 2000. Washington, D.C: Energy Sector Management Assistance Program (ESMAP), The World Bank 2000. p. 60-6. 56. UNEP, Editor. Reforming Energy Subsidies: An explanatory summary of the issues and challenges in removing or modifying subsidies on energy that undermine the pursuit of sustainable development 2002; New York: United Nations Environment Programme, United Nations. 57. Lucon O, Coelho S, Goldemberg J. LPG in Brazil: lessons and challenges. Energy for Sustainable Development. 2004;8:82-90. doi: 10.1016/S0973-0826(08)60470-6. 58. Kolk A, van den Buuse D. In search of viable business models for development: sustainable energy in developing countries. Corporate Governance. 2012:1-20. 59. Forster PEA. Climate Change 2007: The Physical Science Basis. Contribution of Working Group I to the Fourth Assessment Report of the Intergovernmental Panel on Climate Change. In: Solomon et al. S, editor. Changes in atmospheric constituents and in radiative forcing. Cambridge, United Kingdom and New York, NY, USA: Cambridge University Press; 2007. p. 130-234.

WHO IAQ Guidelines: household fuel combustion – Review 11: Costs and financing
38
60. UNEP, editor term Climate Protection and Clean Air Benefits: Actions for Controlling Short-Lived Climate Forcers. A UNEP Synthesis Report 2011. 61. Watson JG, Chow JC, Chen LWA. Summary of Organic and Elemental Carbon/Black Carbon Analysis Methods and Intercomparisons. Aerosol Air Qual Res 2005;5:65–102. 62. Lewis K, Arnott WP, Moosmueller H, Wold CE. Strong spectral variation of biomass smoke light absorption and single scattering albedo observed with a novel dual-wavelength photoacoustic instrument. Journal of Geophysical Research-Atmospheres. 2008;113. doi: 10.1029/2007jd009699. 63. Ramanathan V, Carmichael G. Global and regional climate changes due to black carbon. Nature Geoscience. 2008;1:221-7. doi: 10.1038/ngeo156. 64. Kawase H, Takemura T, Nozawa T. Impact of carbonaceous aerosols on precipitation in tropical Africa during the austral summer in the twentieth century Journal of Geophysical Research 2011;116:D18116. doi: doi:10.1029/2011JD015933. 65. Randles C, Ramaswamy V. Direct and semi-direct impacts of absorbing biomass burning aerosol on the climate of southern Africa: a Geophysical Fluid Dynamics Laboratory GCM sensitivity study. Atmos Chem Phys. 2010;10:9819-31. doi: doi:10.5194/acp-10-9819-2010. 66. Shindell D, Kuylenstierna JCI, Vignati E, van Dingenen R, Amann M, Klimont Z, et al. Simultaneously Mitigating Near-Term Climate Change and Improving Human Health and Food Security. Science. 2012;335:183-9. doi: 10.1126/science.1210026. 67. Fuglestvedt JS, Shine KP, Berntsen T, Cook J, Lee DS, Stenke A, et al. Transport impacts on atmosphere and climate: Metrics. Atmospheric Environment. 2010;44:4648-77. doi: 10.1016/j.atmosenv.2009.04.044. 68. Ramanathan V, Ramana MV, Roberts G, Kim D, Corrigan C, Chung C, et al. Warming trends in Asia amplified by brown cloud solar absorption. Nature. 2007;448:575-U5. doi: 10.1038/nature06019. 69. Samset BH, Myhre G. Vertical dependence of black carbon, sulphate and biomass burning aerosol radiative forcing. Geophysical Research Letters. 2011;38. doi: 10.1029/2011gl049697. 70. Textor C, Schulz M, Guibert S, Kinne S, Balkanski Y, Bauer S, et al. Analysis and quantification of the diversities of aerosol life cycles within AeroCom. Atmospheric Chemistry and Physics. 2006;6:1777-813. 71. Hansen J, Nazarenko L. Soot climate forcing via snow and ice albedos. Proceedings of the National Academy of Sciences of the United States of America. 2004;101:423-8. doi: 10.1073/pnas.2237157100. 72. Bond TC, Doherty SJ, Fahey DW, Forster PM, Berntsen T, DeAngelo BJ, et al. Bounding the role of black carbon in the climate system: A scientific assessment. Journal of Geophysical Research: Atmospheres. 2013:n/a-n/a. 73. Jacobson MZ. Control of fossil-fuel particulate black carbon and organic matter, possibly the most effective method of slowing global warming (vol 107, pg 4410, 2002). Journal of Geophysical Research-Atmospheres. 2002;110. doi: 10.1029/2004jd005888. 74. Bond TC, Streets DG, Yarber KF, Nelson SM, Woo JH, Klimont Z. A technology-based global inventory of black and organic carbon emissions from combustion. Journal of Geophysical Research-Atmospheres. 2004;109. doi: 10.1029/2003jd003697. 75. Bond TC, Sun H. Can Reducing Black Carbon Emissions Counteract Global Warming? Environmental Science & Technology. 2005;39:5921-6. doi: doi:10.1021/es0480421. 76. Aunan K, Berntsen TK, Myhre G, Rypdal K, Streets DG, Woo J-H, et al. Radiative forcing from household fuel burning in Asia. Atmospheric Environment. 2009;43:5674-81. doi: 10.1016/j.atmosenv.2009.07.053. 77. Unger N, Shindell DT, Koch DM, Streets DG. Air pollution radiative forcing from specific emissions sectors at 2030. Journal of Geophysical Research-Atmospheres. 2010;113. doi: 10.1029/2007jd008683. 78. World Bank, Editor. Status and trends of the carbon market. Carbon Finance at the World Bank2011: World Bank.

WHO IAQ Guidelines: household fuel combustion – Review 11: Costs and financing
39
79. SEI (Stockholm Environmental Insitute). Assessing the Climate Impacts of Cookstove Projects: Issues in Emissions Accounting. Stockholm Environment Institute, 2013. 80. Peters-Stanley M, Hamilton K. Developing dimension: State of the Voluntary Carbon Markets 2012. A Report by Ecosystem Marketplace & Bloomberg New Energy Finance. New York: 2012. 81. UNFCCC, Editor. CDM Methodology Booklet 2011. 82. Johnson M, Edwards R, Masera O. Improved stove programs need robust methods to estimate carbon offsets. Climatic Change. 2010. 83. Cherubini F, Peters GP, Berntsen T, Stromman AH, Hertwich E. CO2 emissions from biomass combustion for bioenergy: atmospheric decay and contribution to global warming. Global Change Biology Bioenergy. 2011;3:413-26. doi: 10.1111/j.1757-1707.2011.01102.x. 84. Blunck C, Rammelt MZ, Zimm C, Griebenow C. Eds - Carbon Markets for Improved Cooking Stoves. A GIZ guide for project operators. Revised edition – January 2011. 2011; Eschborn: GIZ-HERA – Poverty-oriented Basic Energy Services. 85. Mann P. Carbon finance for clean cooking – time to grasp the opportunity. Boiling Point. 2007;54:2.