Embed Size (px)
Citation preview

Hannah Thompson, PhD, MPHResearch Scientist
UC Berkeley School of Public Health
Who has access to physical education teachers in California public schools?

Physical Activity
Moderate-to-Vigorous Physical Activity (MVPA)

Benefits of MVPA
Strong et al, Pediatrics, 2005; Warburton et al, CMAJ, 2006; Rasberry et al, Prev Med, 2011

Evidence-based recommendation
US Department of Health and Human Services, 1996; Institute of Medicine, 2013
Children and adolescents should
get at least 60 minutes
of MVPA every day
60 minutes of MVPA during school

School-based opportunities for MVPAPhysical
Education
Recess
Classroom physical
activity breaks
Active commuting
Before and after school
programs
School sportsComprehensive School Physical
Activity Program

Physical Education (PE)
Madsen et al, Arch Ped Adol Med, 2009; Institute of Medicine, 2013; Trudeau, Sports Medicine, 2005

SHAPE America, 2017
30mins/day
National elementary PE recommendation

20CA Dept of Ed, Ed Code 51210
mins/day
California elementary PE law

California elementary PE law compliance
Sanchez-Vaznaugh et al, AJPM, 2012
> 3 million public elementary students in California


Barriers to elementary PE law compliance

Barriers to elementary PE law compliance

Classroom teacher
Single-subject credentialed PE teachervs.

How many PE teachers are there in California elementary schools?

Methods
• Called all California school districts in 2016-17 with elementary students
– 75% of districts responded (n = 669)
• How many single-subject credentialed elementary PE teachers are in your district?
• Calculated the ratio of PE teachers to students in each district

FitnessGram

Presumed pathway
Determined if the district-level PE teacher to student ratio was associated with student cardiorespiratory fitness.

Half of California school districts don't have single subject credentialed elementary PE teachers on staff.
Thompson, Prev Med, 2019
What did we learn?

Thompson, Prev Med, 2019
What did we learn?
PE teachers are disproportionately lacking in districts with more African American and Latinx youth.


Thompson, Prev Med, 2019
What did we learn?
Having more PE teachers per students is associated with increased student fitness.

Thompson, Prev Med, 2019
What did we learn?
Each additional PE teacher per 500 students was associated with a 3% increase in aerobically fit students (95% CI: 1%, 4%).

Access to elementary PE teachers in California is lacking and may be negatively impacting student health
Thompson, Prev Med, 2019
Implications
Half of California school districts serving elementary students (n=725,000) don’t have single subject credentialed elementary PE teachers on staff.
Having more PE teachers per students was associated with increased student fitness
Disparities in PE teacher availability exist, with PE teachers disproportionately lacking in districts with more students of color

Creative action is needed to fund improvements in PE to ensure
youth from all backgrounds are physically active

Opportunities for increased PE funding

Creative Solutions in Action

Creative Solutions in Action

Creative Solutions in Action

Creative Solutions in Action

Opportunities for increased PE funding

Thank you
Robert Wood Johnson FoundationEvidence for Action Program
KrisMadsen
BhaaniSingh
AnaIbarra-Castro
Gail Woodward-
Lopez

Weighing the Options: Strategies Associated with Lower Obesity and
Improved Fitness in Low-Income Schools
Carolyn Rider, MASenior Program Evaluator
University of California, Nutrition Policy Institute
July 16, 2019

Roadmap for Today
Background
What is Intervention Dose?
Study Methods
Study Results
Next Steps

What is FitnessGram?• Testing used for Presidential Youth Fitness Program• In CA, students are tested in 5th, 7th, and 9th grades• Assesses six “Healthy Fitness Zones” (HFZ)
Aerobic capacity Abdominal strength and endurance Upper body strength and endurance Body composition Trunk extensor strength and flexibility Flexibility

Overweight and Obesity 2013-2017: California
37.2% 37.4%
18.8% 19.1%
0%
10%
20%
30%
40%
50%
2013 2014 2015 2016 2017Overweight + Obese Obese
Rates adjusted for grade, gender, race/ethnicity, SED, and school FRPM
FitnessGram trends analyzed by John Pugliese, PhD, California Dept of Public Health

Aerobic and Overall HFZ 2013-2017: California
64.6% 64.0%
4.4 4.4
0
1
2
3
4
5
6
50%
60%
70%
80%
90%
100%
2013 2014 2015 2016 2017
# of
HFZ
Ach
ieve
d
% A
chie
ving
Aer
obic
HFZ
Aerobic HFZ Overall HFZ Score
Rates adjusted for grade, gender, race/ethnicity, SED, and school FRPM
FitnessGram trends analyzed by John Pugliese, PhD, California Dept of Public Health

California’s CalFresh Healthy Living Program (SNAP-Ed)
• Four State Implementing Agencies
• Provide information and support for healthy eating and physical activity to low-income Californians
• Network of local health departments, volunteers, non-profits, area agencies on aging, and other local partners

California Department of Public Health CalFresh Healthy Living: -60 local health departments-57 of 58 California counties-3 city health departments

FFY 16 LHD Efforts in School SettingPSE: 688 schools
Direct Education: 1.26 million students (duplicated count)
Indirect Education: 1.5 million students (duplicated count)

N=3,530
N=906
No SNAP-Edintervention
LHD SNAP-Edintervention
California School SNAP-Ed Intervention Efforts: 2016

Combinations of School Interventions
N = 906 schools with LHD SNAP-Ed PA interventions *District-level PSE interventions are also counted above in the PSE only number.

Frequency of PA-Related PSEs
0% 20% 40% 60% 80% 100%
Physical Education
Recess PA
PA facilities
Before/after school PA
Active transport
Classroom PA
Wellness policies
District-Level PSE (n=288) School-Level PSE (n=96)
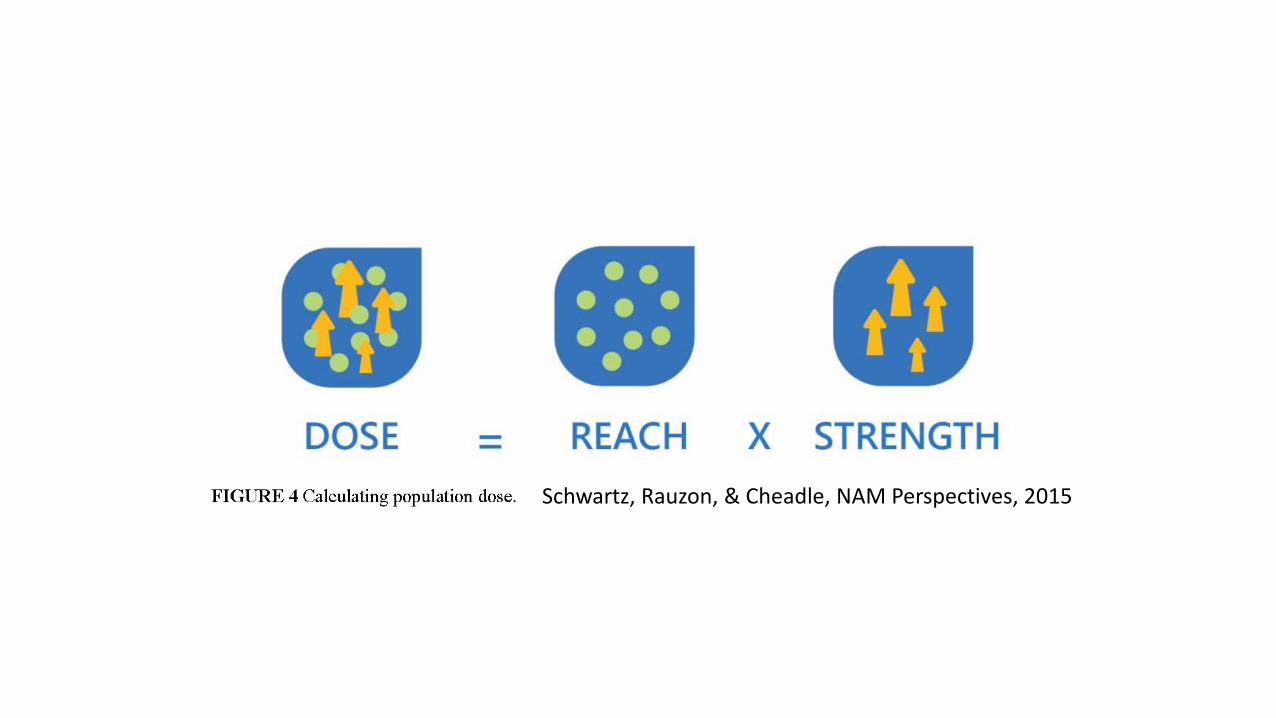
Schwartz, Rauzon, & Cheadle, NAM Perspectives, 2015

SNAP-ED DOSE
Indirect Ed
PSE
Direct Ed

How is dose calculated?PSE (40%)Intensity (# of PSE change domains) * Reach (% of students)
Direct Education (40%)Sum of [Intensity (Hours) * Reach (% of students)]
Indirect Education (20%)Sum of [Intensity (weighted sum of activities) * Reach (% of students)]
Full methods in manuscript: Hewawitharana, Kao, Rider, et al. under development

SNAP-Ed Dose (FFY 16):Schools where LHDs delivered SNAP-Ed with PA focus
Outcomes (FFY 17) from FitnessGram:5th and 7th graders
• BMI z-score• # of HFZ achieved• Aerobic fitness (VO2 Max)
Methods

Analysis
Models• Linear multilevel model (BMI z, VO2 max)• Poisson multilevel model (HFZ)Covariates• School level (urbanicity, FRPM, enrollment)• Student level (age, gender, race/ethnicity)Cluster variable• School

Results: Weight
Students in schools with any LHD SNAP-Ed programming had lower BMI z-scores than those attending schools with no SNAP-Ed (b = -0.0307, p = 0.0006).

Results: Healthy Fitness Zones
There was no difference in the # of Healthy Fitness Zones met by students in schools with or without LHD SNAP-Ed programming.

Results: Aerobic fitness
Students in schools with LHD SNAP-Ed programming had higher VO2 max than those attending schools with no SNAP-Ed programming (b = 0.2211, p = 0.0013).

School-based interventions with a physical activity component are associated with: improved student
cardiovascular fitness modestly lower student BMI

What’s Next?
Additional years of dose & outcome
data
Types & combinations of
interventions
Nutrition intervention dose &
outcomes

Thank you!
Co-authors:Sridharshi Hewawitharana, MPH
Janice Kao, MPHEvan Talmage
Sadie Costello, PhDWendi Gosliner, DrPH
Gail Woodward-Lopez, MPH
The California Department of Education and California Department of Public Health-Nutrition Education and Obesity Prevention Branch are the original source of data used in this presentation.
This material was funded by USDA’s Supplemental Nutrition Assistance Program - SNAP.

Integrating Classroom Physical Activity
Putting Strategies into Action
Springboard to Active Schools is an initiative of the National Network of Public Health Institutes (NNPHI) and Health Resources in Action (HRiA) through Cooperative Agreement CDC-RFA-DP16-1601 with the Centers for Disease Control and Prevention (CDC).

Special Thanks
National Collaboration to Promote Health, Wellness, and Academic Success of School-Age Children
Cooperative Agreement CDC-RFA-DP16-1601 with the Centers for Disease Control and Prevention (CDC)
58

Objectives
Introduce Springboard to Active Schools.
Articulate the link between classroom physical activity and improved academic achievement.
Define classroom physical activity and the national guidance and strategies for supporting classroom physical activity.
Identify key resources for classroom physical activity.
59

About Springboard to Active Schools
60
www.nnphi.org www.hria.org
Support CDC’s Healthy Schools Funded States to create environments supportive of physical education and physical activity via:
1. Professional Develop and Technical Assistance
2. Education and Dissemination3. Partnership and Collaboration
www.schoolspringboard.org

Creating a Culture Supportive of Physical Activity
61

Comprehensive School Physical Activity Program Roadmap
62
Recess
Classroom Physical Activity

Classroom Physical Activity: Definition and Policies
63

Definition of Classroom Physical Activity
Any physical activity done in the classroom
• Takes place at any time
• Occurs in one or several brief periods
• Occurs at all school levels
• Offered in addition to PE and recess
64

Approaches to Classroom Physical Activity• Integrated into planned
academic instruction
• Outside of planned academic instruction
65

Vote in Motion
In your schools or districts, physical activity is integrated into subjects other than physical education.
66
In your schools or districts, most people think that physical activity will cause children to not pay attention in class.
In your schools or districts, most teachers and administrators understand that physical education and physical activity enhances academic achievement.

Benefits of Classroom Physical Activity
Improves concentration and ability to stay on-task
Reduces disruptive behavior
Improves motivation and engagement
Improves academic performance
Increases daily physical activity

National Perspective: School PracticeStudents participate in regular physical activity breaks*
during the school day
43% of Elementary Schools 64% of Middle Schools 27% of High Schools
School Health Policies and Practices Study, 2014.*For elementary schools, this is defined as “outside of physical education class and recess.” For middle schools and high schools, this is defined as “outside of physical education class.”

National Guidance for Classroom Physical Activity
• Incorporate classroom physical activity in CSPAP
• Do not replace physical education and recess
• Integrate physical activity into academic instruction
• Provide physical activity outside of academic instruction

National Guidance for Classroom Physical Activity
(continued)• Reinforce skills learned in physical education
• Minimize barriers
• Do not withhold classroom physical activity
• Provide ongoing professional development

Strategies for Classroom Physical Activity
71

Strategies for Classroom Physical Activity in Schools
Describes 10 strategies for promoting and planning classroom physical activity
www.schoolspringboard.org/classroomphysicalactivity

Strategies for Classroom Physical Activity in Schools
1. Identify who to engage and how to involve them in planning for classroom physical activity (PA)
2. Identify what PA activity policies and practices currently exist
3. Provide professional development or in-service training on classroom PA
4. Identify approaches to incorporate classroom PA
5. Identify opportunities and appropriate times for classroom PA
6. Identify materials, technology, and resources to promote classroom PA
7. Identify ways to create and use classroom space for PA
8. Ensure that classroom PA is appropriate and safe for all students
9. Collect information on classroom physical activity
10. Share successes, challenges, and lessons learned from classroom physical activity

Integrate Physical Activity in Schools: A Guide for Putting Strategies into Practice
• Assess current classroom physical activity practices
• Identify opportunities to enhance or sustain classroom physical activity
• Take practical steps to integrate physical activity into the classroom
www.schoolspringboard.org/classroomphysicalactivity

Online Platform: Integrate Classroom Physical Activity in Schools
www.schoolspringboard.org/classroomphysicalactivity

Additional Classroom Physical Activity Resources
Data Brief: Integrate Classroom Physical Activity in Schools
Ideas for Parents: Classroom Physical Activity
PowerPoint Presentation: Integrate Classroom Physical Activity: Getting
Students Active During School
www.schoolspringboard.org/classroomphysicalactivity

Just updated, will be updated every year
Will start to be updated in late 2019
Additional CDC Key Resources to Support PE and PA
Will start to be updated in late 2019

Thank you!
Follow us on Twitter: @Springboard2AS
78
Brittany Chen, DrPH, MPHHealth Resources in ActionDirector, Springboard to Active Schools
Visit us at www.schoolspringboard.org
Questions? Reach out to [email protected]