Embed Size (px)
Citation preview

WHO Essential Medicines Policies and Use in Developingand Transitional Countries: An Analysis of ReportedPolicy Implementation and Medicines Use SurveysKathleen Anne Holloway1*, David Henry2,3,4
1 Regional Office for South-East Asia, World Health Organization, New Delhi, India, 2 Institute for Clinical Evaluative Sciences, Toronto, Ontario, Canada, 3 Dalla Lana
School of Public Health, University of Toronto, Toronto, Ontario, Canada, 4 Institute for Health Policy Management and Evaluation, University of Toronto, Toronto, Ontario,
Canada
Abstract
Background: Suboptimal medicine use is a global public health problem. For 35 years the World Health Organization (WHO)has promoted essential medicines policies to improve quality use of medicines (QUM), but evidence of their effectiveness islacking, and uptake by countries remains low. Our objective was to determine whether WHO essential medicines policiesare associated with better QUM.
Methods and Findings: We compared results from independently conducted medicines use surveys in countries that didversus did not report implementation of WHO essential medicines policies. We extracted survey data on ten validated QUMindicators and 36 self-reported policy implementation variables from WHO databases for 2002–2008. We calculated theaverage difference (as percent) for the QUM indicators between countries reporting versus not reporting implementation ofspecific policies. Policies associated with positive effects were included in a regression of a composite QUM score on totalnumbers of implemented policies. Data were available for 56 countries. Twenty-seven policies were associated with betteruse of at least two percentage points. Eighteen policies were associated with significantly better use (unadjusted p,0.05),of which four were associated with positive differences of 10% or more: undergraduate training of doctors in standardtreatment guidelines, undergraduate training of nurses in standard treatment guidelines, the ministry of health having aunit promoting rational use of medicines, and provision of essential medicines free at point of care to all patients. Inregression analyses national wealth was positively associated with the composite QUM score and the number of policiesreported as being implemented in that country. There was a positive correlation between the number of policies (out of the27 policies with an effect size of 2% or more) that countries reported implementing and the composite QUM score (r = 0.39,95% CI 0.14 to 0.59, p = 0.003). This correlation weakened but remained significant after inclusion of national wealth inmultiple linear regression analyses. Multiple policies were more strongly associated with the QUM score in the 28 countrieswith gross national income per capita below the median value (US$2,333) (r = 0.43, 95% CI 0.06 to 0.69, p = 0.023) than in the28 countries with values above the median (r = 0.22, 95% CI 20.15 to 0.56, p = 0.261). The main limitations of the study arethe reliance on self-report of policy implementation and measures of medicine use from small surveys. While the data canbe used to explore the association of essential medicines policies with medicine use, they cannot be used to compare orbenchmark individual country performance.
Conclusions: WHO essential medicines policies are associated with improved QUM, particularly in low-income countries.
Please see later in the article for the Editors’ Summary.
Citation: Holloway KA, Henry D (2014) WHO Essential Medicines Policies and Use in Developing and Transitional Countries: An Analysis of Reported PolicyImplementation and Medicines Use Surveys. PLoS Med 11(9): e1001724. doi:10.1371/journal.pmed.1001724
Academic Editor: Margaret E. Kruk, Columbia University Mailman School of Public Health, United States of America
Received February 27, 2014; Accepted July 31, 2014; Published September 16, 2014
Copyright: � 2014 Holloway, Henry. This is an open-access article distributed under the terms of the Creative Commons Attribution License, which permitsunrestricted use, distribution, and reproduction in any medium, provided the original author and source are credited.
Data Availability: The authors confirm that, for approved reasons, some access restrictions apply to the data underlying the findings. The study uses secondarydata from databases maintained in WHO. One database is on medicines use and contains information extracted from published articles and reports. This databasenow contains more that 1000 surveys and references for the period 1990-2009. Provision of such extensive QUM data in the public domain would be difficult butinformation can be supplied on request to the corresponding author. The other databases are on reported policy implementation in 2003 and 2007 and containinformation collected by questionnaire from Ministries of Health. The policy data from individual countries cannot be shared because many countries have notgiven written permission for the information to be shared in the public domain. Despite these restrictions, all data used for this study has been supplied asSupporting Information files. Extracted data on ten medicines use indicators for the period 2002-2008 by country and with references and data on 36 reportedpolicy indicators for the period 2003-2007 by country have been supplied as Supporting Information files.
Funding: The WHO funded the collection of data used in this study and the maintenance of the databases within the WHO. The development and analysis of theindividual databases was supported by the WHO Collaborating Centre at Boston and Harvard Universities with WHO financial support. The analysis of mergeddata on medicines use and reported policy implementation was done solely by the authors without extra financial support.
Competing Interests: Dr Holloway (KAH) is an employee of the WHO. Senior staff at WHO had no role in the design and analysis of the study. Senior WHO staffviewed a copy of the manuscript prior to submission but did not request any substantive changes. Dr Henry (DAH) has no competing interests to declare. Theviews expressed in this article are those of the authors and do not reflect the views of WHO.
Abbreviations: GNIpc, gross national income per capita; IMCI, Integrated Management of Childhood Illness; INRUD, International Network for the Rational Useof Drugs; QUM, quality use of medicines; WHO, World Health Organization.
* Email: [email protected]
PLOS Medicine | www.plosmedicine.org 1 September 2014 | Volume 11 | Issue 9 | e1001724

Introduction
Suboptimal use of medicines (over- and underuse) is a global
public health problem with serious consequences [1–3]. Unnec-
essary use consumes scarce resources and has adverse effects,
including antibiotic resistance [4–6] and avoidable adverse drug
events, hospitalisation, and death [7–9]. Underuse deprives people
of the undisputed benefits of many essential medicines [1–3].
Since 1977, the World Health Organization (WHO) has
advocated the ‘‘essential medicines’’ concept and has developed
a range of policies to promote quality use of medicines (QUM)
[10,11]. However, WHO surveys of member countries in 2003
and 2007 showed that fewer than half of responding countries
reported implementing many of the recommended policies
[12,13].
Policy implementation increases with country income level
[12,13]. QUM also improves with income level. For instance,
adherence to guidelines is greater, and misuse of antibiotics less, in
middle-income compared with low-income countries [3,14,15].
Coordinated medicine policy implementation in some high-
income countries in Europe has resulted in improved antibiotic
use [16–18]. However, there is little evidence of policy effective-
ness in developing countries [19], and associated doubts may
contribute to low uptake.
Our aim was to determine whether public sector medicine use is
better in low- and middle-income countries that have implement-
ed essential medicines policies than in those that have not. Our
hypotheses were that (1) countries implementing essential medi-
cines policies have better QUM than those that do not, (2) policies
vary in their effectiveness, and (3) those countries implementing a
larger number of effective policies have better QUM than those
implementing fewer policies.
Methods
Most WHO member countries do not publish national data on
QUM and policy implementation, nor do they collect time series
data that enable longitudinal analyses of the impacts of policies on
QUM. Consequently, we used the results of survey data to derive
appropriate measures and compare QUM in countries that did
versus did not report implementing certain medicine policies to the
WHO. In addition, we correlated the numbers of key policies that
have been reported by different countries with a composite
measure of QUM.
Information SourcesIn order to monitor the impact of essential medicines policies,
the WHO, in collaboration with the Boston University/Harvard
University WHO Collaborating Center in Pharmaceutical Policy,
collects information on medicine use [3,14,15] and reported
medicine policy implementation [12,13]. Because of lack of data
on medicine use in the private health care sector, information was
limited to the public sector.
Medicine use database. Studies reporting quantitative
measures of medicine use during 1990–2009 in primary health
care in any region/country other than North America, Western
Europe, Australia, New Zealand, and Japan [3,14] were identified
by systematic searches in PubMed, searches on institutional web
sites, and hand searching of 50 journals using standard search
terms such as ‘‘drug use’’, ‘‘drug utilization’’, ‘‘prescribing’’, and
‘‘developing countries’’. The WHO refers to these countries as
‘‘developing or transitional’’, and the majority are of low- or
middle-income status. Only studies reporting standardised
measures of QUM [20,21] were used. Data on medicine use
and details of study setting and methodology were extracted from
the articles/reports and entered into a Microsoft Access database.
The 102 explicitly defined data fields covered setting (e.g., type of
facility and prescriber, sector, year of survey), survey methods,
intervention details (if any), and measures of medicine use, using a
set of predetermined rules [3]. Data from multiple countries or
multiple settings (e.g., different facility or prescriber type)
described in the same article were entered as separate records,
and data from the same study reported in multiple articles were
entered as a single record. All articles/reports were read by two
persons, and all data entry for each field agreed to by the same two
persons (including K. A. H.). Distributions of key variables were
scrutinised to assess data entry accuracy prior to analysis.
Nine hundred studies from 104 countries are entered into the
database for the period 1 January 1990–31 December 2009. Only
26% of studies addressed medicine use in the private sector [14].
Analyses of the database have been published by the WHO (for
1990–2006, including actual details of data) [3] and in research
journals (for 1990–2009) [14,15]. For the purposes of this study,
quantitative data on public sector medicine use by country for
surveys undertaken during 2002–2008 were extracted. Only
surveys using validated measures of QUM recommended by the
International Network for the Rational Use of Drugs (INRUD)
and the Integrated Management of Childhood Illness (IMCI)
programmes [20,21] and estimated from at least 600 prescriptions
or three or more facilities were included.
Database on reported policy implementation. The
WHO collects data on reported pharmaceutical policy implemen-
tation by sending a questionnaire to the ministries of health of all
member states every 4 y. The questionnaire requests information
in a standard format [22] on all aspects of pharmaceutical policy
implementation, regulation, and practices. The policy question-
naire was developed by the WHO in 2002 in collaboration with
the Boston University/Harvard University WHO Collaborating
Center in Pharmaceutical Policy, using experience gained from a
much smaller pilot survey done in 1999; the questionnaire was
further refined during an expert meeting in 2006 [23]. The
questionnaires used in this study were sent in 2003 and 2007 in
electronic (email) and paper (post) format to all 192 WHO
member states through official WHO channels, and follow-up was
done by WHO staff. Countries were asked to nominate a
government staff member in the ministry of health to coordinate
completion of different sections of the questionnaire by the
relevant government agencies/departments or expert groups. All
completed questionnaires were processed centrally and quality
checked, and erroneous or inconsistent data were excluded.
Response parameters were set for each question, and any
responses falling outside these parameters were verified (going
back to the country respondents if necessary) before being
manually entered into the database. Data accuracy was assessed
by cross-checking and triangulation with data from other sources.
Data analysis was done in Microsoft Excel; results for the 2003
survey were published by the WHO in 2006 [12], and those of the
2007 survey in 2010 [13]. Out of 192 WHO member states, 156
countries in 2003 and 146 countries in 2007 responded to the
questionnaire, although no country completed responses to all
questions (the questionnaire comprises more than 200 questions,
including core and sub-questions). For the purposes of this study,
data on implementation of policies hypothesized to affect QUM
were extracted from responses to questions asked exactly the same
way in the questionnaires sent to the ministries of health in 2003
and 2007 [12,13]. The WHO sent the policy questionnaire to
WHO Policies and Use of Medicines
PLOS Medicine | www.plosmedicine.org 2 September 2014 | Volume 11 | Issue 9 | e1001724

Table 1. Medicine policy variables with reasons for inclusion or exclusion in the analysis.
Policies Hypothesized to Improve QUM* Inclusion/Exclusion from Analysis (with Reasons)
NMP and monitoring QUM
NMP document Excluded since there are two other variables indicative of NMP implementation
NMP implementation plan Included
NMP integrated into national health plan Included
National strategy to contain antimicrobial resistance Included
National prescribing audit in the last 5 y Included
Prescription audit in the last 2 y Excluded because insufficient numbers of countries responded
Educational policies
Undergraduate training of doctors on theessential medicines list
Included
Undergraduate training of nurses on the essential medicines list Included
Undergraduate training of pharmacistson the essential medicines list
Excluded because there were insufficient data on pharmacist prescribing, which occurs primarily in theprivate sector
Undergraduate training of pharmacyassistants on the essential medicines list
Excluded because there were insufficient data on pharmacist assistant prescribing, which occursprimarily in the private sector
Undergraduate training of paramedicson the essential medicines list
Included
Undergraduate training of doctors onstandard treatment guidelines
Included
Undergraduate training of nurses on standardtreatment guidelines
Included
Undergraduate training of pharmacists onstandard treatment guidelines
Excluded because there were insufficient data on pharmacist prescribing, which occurs primarily in theprivate sector
Undergraduate training of pharmacy assistantson standard treatment guidelines
Excluded because there were insufficient data on pharmacy assistant prescribing, which occurs primarilyin the private sector
Undergraduate training of paramedics onstandard treatment guidelines
Included
Continuing medical education of doctors Included
Continuing medical education of nurses and paramedics Included
Continuing medical education of pharmacists Excluded because there were insufficient data on pharmacist prescribing
Continuing medical education of pharmacy assistants Excluded because there were insufficient data on pharmacy assistant prescribing
Public education on antibiotics in last 2 y Included
Public education on injections in last 2 y Included
Managerial policies
National essential medicines list updated in the last 5 y Excluded because insufficient numbers of countries responded to make a comparison (last 2 y usedinstead)
National essential medicines list updated in the last 2 y Included
Public insurance drug coverage limited tonational essential medicines list
Included
National standard treatment guidelinesupdated in the last 5 y
Excluded because insufficient numbers of countries responded to make a comparison (last 2 y usedinstead)
National standard treatment guidelines updated in the last 2 y Included
National formulary updated in the last 5 y Included
Generic prescribing in public sector Included
Generic substitution in public sector Included
Economic policies
Some drugs covered by public health insurance Included but graded response adapted to yes/no response as follows: all/some population covered =yes; none covered = no
Coverage of some of the population bypublic health insurance
Included but graded response adapted to yes/no response as follows: all/some population covered =yes; none covered = no
Dispensing prescribers in public sector Excluded because of similarity to ‘‘No revenue for prescribers from drug sales’’ and because thisquestion did not exist in 2003 questionnaire
No revenue for prescribers from drug sales Included but graded response adapted to yes/no response as follows: never used = yes; always/occasionally used = no
WHO Policies and Use of Medicines
PLOS Medicine | www.plosmedicine.org 3 September 2014 | Volume 11 | Issue 9 | e1001724

ministries of health in 2011 [24], but these policy data cannot be
used to assess impact on medicines use because medicines use
surveys done in 2011–2012 have not yet been fully reported.
Merged Dataset of Quality Use of Medicines andReported Policy Implementation
We formed one dataset containing all the exposure and
outcome data—policies reported as implemented and QUM
measures for the period 2002–2008. Only one set of policy and
medicine use data for each country was included. We included
medicines use surveys from 2002 to 2008 (i.e., from 1 y before the
2003 policy survey to 1 y after the 2007 policy survey) in order to
increase the sample size of countries with medicine use data
(increase of eight countries, with 377 extra medicine use
measurements). In doing this, we assumed that most policies
would have been the same within 1 y of the policy survey. For
countries where more than one survey was done using the same
medicine use indicator during 2002–2008, an average was taken
across the surveys to increase the sample size and improve
generalisability of the results, giving equal weight to each survey.
Where policy information was available for both 2003 and 2007,
and found to differ, the policy information chosen was that which
was within 1 y of the medicines use survey dates; otherwise, the
data were excluded from analysis.
Derivation of Variables for AnalysisPolicy variables. The policy variables (Table 1) were derived
from country responses to the WHO questionnaires seeking
information on implementation of specific medicine policies (see
above) [22]. Most were yes/no categorical variables. Where
variables had a graded response, we categorised them as yes/no
variables (details are provided in Table 1). Fifty-two relevant
Table 1. Cont.
Policies Hypothesized to Improve QUM* Inclusion/Exclusion from Analysis (with Reasons)
Provision of essential medicines free at thepoint of care to all patients
Included
Provision of essential medicines free at thepoint of care to patients ,5 y of age
Included
Provision of essential medicines free at thepoint of care to pregnant women
Excluded because of similarity to other questions about provision of free essential medicines andbecause pregnant women’s drug treatment is not captured by the drug use indicators
Provision of essential medicines free at thepoint of care to elderly patients
Excluded because of similarity to other questions about provision of free essential medicines andbecause elderly patients’ drug treatment is not captured by the drug use indicators
Regulatory policies
Antibiotics not available over-the-counter Included but graded response adapted to yes/no response as follows: never/occasionally available =yes; always/frequently available = no
Injections not available over-the-counter Included but graded response adapted to yes/no response as follows: never/occasionally available =yes; always/frequently available = no
Active monitoring of adverse drug reactions Included
Joint regulation of drug promotion by government andindustry (as opposed to regulation by government alone)
Included
Structural policies
National MOH unit promoting rational use of medicines Included
MOH mandate to have drug and therapeuticscommittees
Excluded because it is too similar to the other DTC variables, which capture actual policy better andbecause a mandate was difficult to define
Half or more of all referral hospitals have a DTC Excluded since the prescribing indicators relate to primary care in primary care centres and generalhospitals, but not referral hospitals
Half or more of all general hospitals have a DTC Included but graded response adapted to yes/no response as follows: all/most/half = yes; few/none =no
Half or more of all provinces/districts have a DTC Included but graded response adapted to yes/no response as follows: all/most/half = yes; few/none =no
National reference laboratory for antimicrobial resistance Excluded because of similarity to other ‘‘AMR’’ questions
National task force to contain antimicrobial resistance Excluded because insufficient numbers of countries responded
Presence of national drug information centre Included
Human resource policies
Prescribing by doctors in public primary care Included but graded response adapted to yes/no response as follows: always = yes; frequently/occasionally/never = no
Prescribing by nurses in public primary care Included but graded response adapted to yes/no response as follows: always/frequently = yes;occasionally/never = no
Prescribing by pharmacists in public primary care Excluded because pharmacists do not generally determine prescribing
No prescribing by untrained staff (i.e., with lessthan 1 month’s training) in public primary care
Included but graded response adapted to yes/no response as follows: never = yes; always/frequently/occasionally = no
*Includes all the policy questions hypothesized to act on the QUM that were asked of ministries of health in the surveys of 2003 and 2007 [12,13].DTC, drug and therapeutics committee; MOH, ministry of health; NMP, national medicines policy.doi:10.1371/journal.pmed.1001724.t001
WHO Policies and Use of Medicines
PLOS Medicine | www.plosmedicine.org 4 September 2014 | Volume 11 | Issue 9 | e1001724

policies were identified [12,13]. Because of overlap we did not
include them all. For example, the questions on implementation of
drug and therapeutics committees ask separately whether they
exist in half or more of referral hospitals, general hospitals, and
provinces; for the purposes of this study, only the policies on drug
and therapeutics committees in general hospitals and provinces
were examined. This process of eliminating overlapping questions
resulted in 36 distinct policies. Although there was still overlap
between them, we erred on the side of inclusion, since only a
limited number of countries reported data for all policies. Table 1
shows the selected policy variables plus those excluded (generally
because of duplication or irrelevance to prescribing in the public
sector).
Quality use of medicines indicators (Table 2). QUM
indicators were drawn from those developed and validated by the
INRUD [20] and IMCI programmes [21]. We excluded
indicators that measured other aspects of patient care or health
system functioning. The indicators, with their specified directions
of ‘‘better’’ or ‘‘worse’’ use of medicines, are described in Table 2.
For example, antibiotics are generally not recommended for acute
upper respiratory infections, which are mostly viral in nature, so
lower rates of prescribing were categorised as better use. We also
excluded a small number of indicators that were not expressed as
proportions and indicators where data were sparse, i.e., for which
fewer than five countries reported data. This left ten indicators for
inclusion in the analyses (Table 2).
Measures of national wealth. We extracted data on gross
national income per capita (GNIpc) for each country in 2009 from
the World Bank (http://data.worldbank.org/indicator/NY.GDP.
PCAP.CD).
AnalysesUnivariate analyses. Each policy was the principal unit of
analysis. We ensured that the directionality of ‘‘improved’’ or
‘‘worse’’ was aligned for each of the ten QUM indicators. For each
QUM indicator we calculated the mean difference (as percent),
with its standard error, between countries reporting implementa-
tion of that policy versus not. These differences were averaged to
give an overall difference across the indicators for each policy. The
difference could be positive or negative. We calculated the
weighted mean difference to account for the fact that varying
numbers of countries reported data on specific QUM indicators.
The estimated differences, with their 95% confidence intervals, are
given in Figure 1 and represent our best estimates of the
quantitative impacts of the individual policies. We did not perform
direct ‘‘head to head’’ comparisons of the impacts of the different
policies and did not adjust the statistical analyses for multiple
comparisons.
Correlations of multiple policies with a composite quality
use of medicines variable. We realised that countries
employed various combinations of policies, but there was too
much heterogeneity and insufficient sample size to measure the
joint effects of particular combinations. So we looked for
correlations between the numbers of implemented policies
(derived from those deemed effective in the univariate analyses)
and a composite score of QUM. Countries were the unit of
analysis, and all countries were given equal weight in the
regression analyses. We derived the policy implementation and
QUM variables as follows. We estimated the number of policies
that a country reported implementing, out of the total number of
27 policies that were associated with effect sizes of 2% or more,
and separately for the 18 policies that were associated with effect
sizes significantly (unadjusted p,0.05) different from zero
(Figure 1). Since a number of countries did not respond on
whether they implemented a specific policy, the variable had to be
adjusted for missing data. We used the following formula:
adjusted policy number ~
number of policies in place
N{ number of missing values for policies|N
ð1Þ
where N was 27 or 18. Countries typically had survey data for only
a subset of the ten medicine use indicators. Therefore, we created
a composite measure of QUM to enable all 56 countries to be
included in the analyses. For each country and each individual
QUM variable, we calculated how far that country lay above or
below the mean value from all countries reporting values for that
variable. We used standard deviation units, so the number was
dimensionless. We calculated the mean value (in standard
deviation units) for each country (which could be positive or
negative) across the multiple medicine use measures, and this was
regressed on two ‘‘number of policies’’ variables: (1) the number
out of 27 policies with an effect size of 2% or more, estimated from
the univariate analyses (27-policy variable) and (2) the number out
of 18 policies with an effect size that was statistically significantly
(unadjusted p,0.05) different from zero (18-policy variable). We
assessed the impact of national wealth in two ways. We included
Table 2. Medicines use indicators and direction of better use.
Variable Name Direction of Better Use
Percent of patients prescribed antibiotics Less
Percent of acute diarrhoea cases treated with anti-diarrhoeal drugs Less
Percent of acute diarrhoea cases treated with antibiotics Less
Percent of acute diarrhoea cases treated with oral rehydration solution More
Percent of prescribed drugs belonging to the essential medicines list More
Percent of drugs prescribed by generic name More
Percent of patients prescribed injections Less
Percent of acute pneumonia cases treated with an appropriate antibiotic More
Percent of patients treated in compliance with guidelines More
Percent of acute upper respiratory tract infection cases treated with antibiotics Less
Ten standard medicine use indicators [20,21] expressed as proportions and reported in surveys in more than four countries during 2002–2008.doi:10.1371/journal.pmed.1001724.t002
WHO Policies and Use of Medicines
PLOS Medicine | www.plosmedicine.org 5 September 2014 | Volume 11 | Issue 9 | e1001724

Figure 1. Differences in quality use of medicines between countries that did versus did not report implementation of specificmedicine policies. The figure presents the weighted mean (and 95% confidence interval) of differences (in percent) across ten selected QUMmeasures. ‘Joint regulation by government and industry as opposed to government regulation only. CME, continuing medical education; DTC, drugand therapeutics committee; EML, essential medicines list; NMP, national medicines policy; STG, standard treatment guidelines.doi:10.1371/journal.pmed.1001724.g001
WHO Policies and Use of Medicines
PLOS Medicine | www.plosmedicine.org 6 September 2014 | Volume 11 | Issue 9 | e1001724

each country’s value for GNIpc in multiple linear regressions of
the composite QUM measure on each of the two number-of-
policies variables. We also performed simple linear regression
analysis of the composite QUM measure on the 27-policy and 18-
policy variables separately for countries that had GNIpc values
above or below the median for the whole group (US$2,333). In
addition, we included the GNIpc values in the regressions of the
QUM scores on the two number-of-policies variables in countries
with wealth levels above and below the median value. Finally, we
regressed the values for two selected individual medicine use
indicators (percentage of acute upper respiratory tract infection
cases receiving antibiotics; percentage of acute diarrhoea cases
receiving oral rehydration solution) on the policy variables. These
were the indicators reported by the greatest number of countries;
they have the advantage that they are widely valued measures of
quality of care and enabled estimation of the health impacts of
policies that were not apparent from standard deviation units. We
repeated all regression analyses using a non-parametric approach
(Spearman rank correlation). All analyses were done with
StatsDirect (version 2.7.9; StatsDirect).
Results
Sixty-four developing and transitional countries were identified
in the WHO database with analysable data on the ten selected
QUM indicators, of which 56 also had analysable data on policies.
On average, for the period 2002–2008, there were three QUM
surveys per country, and data on each of the ten QUM indicators
was collected (between all the surveys done) at least once per
country (Table 3). Out of a potential 2,016 policy responses (36
policies in each of 56 countries), 1,646 (82%, 95% CI 80% to 83%)
were available. Of 56 countries with relevant policy and QUM
data, 24 countries provided policy data in both 2003 and 2007.
Out of a potential 864 policy responses (24 countries636 policies),
174 responses (20%, 95% CI 18% to 23%) differed between 2003
and 2007, of which 123 responses, or 14% (95% CI 12% to 17%)
of all responses from the 24 countries reporting policy data in 2003
and 2007, were excluded from the analysis. The regional
distribution of the 56 countries was Africa, 24; Eastern Mediter-
ranean, 9; Europe, 4; Latin America, 7; South East Asia, 4; and
Western Pacific, 8.
Estimating the Impacts of Individual Essential MedicinesPolicies
Information on the self-reported implementation of the 36
individual essential medicines policies by the 56 study countries is
provided in Table S1. Table 3 lists the survey-derived values for
the ten key QUM indicators for these countries. Additional
information, including references for the studies from which the
medicine use measures were obtained and the GNIpc figures for
each country, are provided in Table S2. Interpretation of the
medicine use data requires specification of whether higher values
reflect better or worse care, and this is provided in Table 2.
It will be appreciated from Table 3 that there were substantial
missing outcomes data, and the impact of this on the regression
analyses is tested in sensitivity analyses below.
Figure 1 and Table 4 summarise the weighted mean differences
(as percent) across ten QUM indicators between countries that did
versus did not report implementation of specific policies. Twenty-
seven policies were associated with effect sizes of 2% or more, and
18 policies demonstrated unadjusted p-values of less than 0.05 for
association with better medicine use. The largest positive associa-
tions were seen with undergraduate training in standard treatment
guidelines for doctors (12.4%, 95% CI 5.2% to 19.7%) and nurses
(11.2%, 95% CI 4.4% to 18.0%), the ministry of health having a
unit promoting rational use of medicines (10.9%, 95% CI 4.2% to
17.7%), and provision of essential medicines free at point of care to
all patients (10.0%, 95% CI 3.6% to 16.3%) and to children under 5
y of age (8.6%, 95% CI 3.6% to 13.6%). Negative effects were
associated with continuing medical education for doctors (25.7%,
95% CI 20.1% to 211.2%) and for nurses and paramedical
workers (28%, 95% CI 22.0% to 214.3%).
Effects of Multiple Policies and Impact of National WealthThere were weak to moderate positive correlations between the
numbers of essential medicines policies reported implemented and
the composite QUM indicator: r = 0.39 (95% CI 0.14 to 0.59),
p = 0.003, for the 27-policy variable, and r = 0.39 (95% CI 0.14 to
0.59), p = 0.003, for the 18-policy variable. In order to assess the
impact of missing QUM data (Table 3), we repeated the
regression analyses including only countries with three or more,
or five or more, observations contributing to their composite
QUM score. This generated stronger correlations than were seen
in the base case: r = 0.48 (95% CI 0.21 to 0.68), p = 0.001, for
three or more observations, and r = 0.64 (95% CI 0.38 to 0.81),
p,0.0001, for five or more observations (Figure S7).
There were weak to moderate correlations between per capita
national wealth (GNIpc) and the QUM indicator (r = 0.51, 95% CI
0.28 to 0.68, p,0.001) and between GNIpc and the numbers of
policies implemented: 27-policy variable, r = 0.36 (95% CI 0.11 to
0.57), p = 0.006; 18-policy variable, r = 0.30 (95% CI 0.04 to 0.52),
p = 0.024.
To adjust for confounding by national wealth levels, we performed
multiple linear regression analyses that included the number-of-policies
variables and GNIpc. In these analyses the regression coefficients for
the number-of-policies variables weakened (r = 0.25, 95% CI 20.015
to 0.52, p = 0.064, for the 27-policy variable, and r = 0. 29, 95% CI
0.025 to 0.56, p = 0.033, for the 18-policy variable) but remained
statistically significant for the 18-policy variable.
Figure 2 shows the regression analysis for QUM versus the 27-
policy variable, with results for individual countries highlighted.
The figures illustrating the other regression analyses referred to
here are provided as Figures S1–S6.
We performed separate regression analyses using the 27-policy
variable in countries with national wealth measures above and
below the median value for GNIpc (US$2,333). In countries with
GNIpc above the median value, the correlation coefficient was
weak and not statistically significant: r = 0.22 (95% CI 20.15 to
0.56), p = 0.261(Figure S5). In countries with GNIpc values below
the median, the correlation was moderate and statistically
significant: r = 0.43 (95% CI 0.06 to 0.69), p = 0.023 (Figure
S6). Importantly, the inclusion of GNIpc in a multiple linear
regression analysis did not weaken the association of multiple
policies with better QUM in the lower-income countries: r = 0.44
(95% CI 0.075 to 0.81), p = 0.020 (27-policy variable).
In regression analyses using the 27-policy variable, the number
of medicine policies correlated positively (as expected) with use of
oral rehydration solution in acute diarrhoeal illness (r = 0.58, 95%
CI 0.29 to 0.77, p,0.001) (Figure 3) and negatively (as expected)
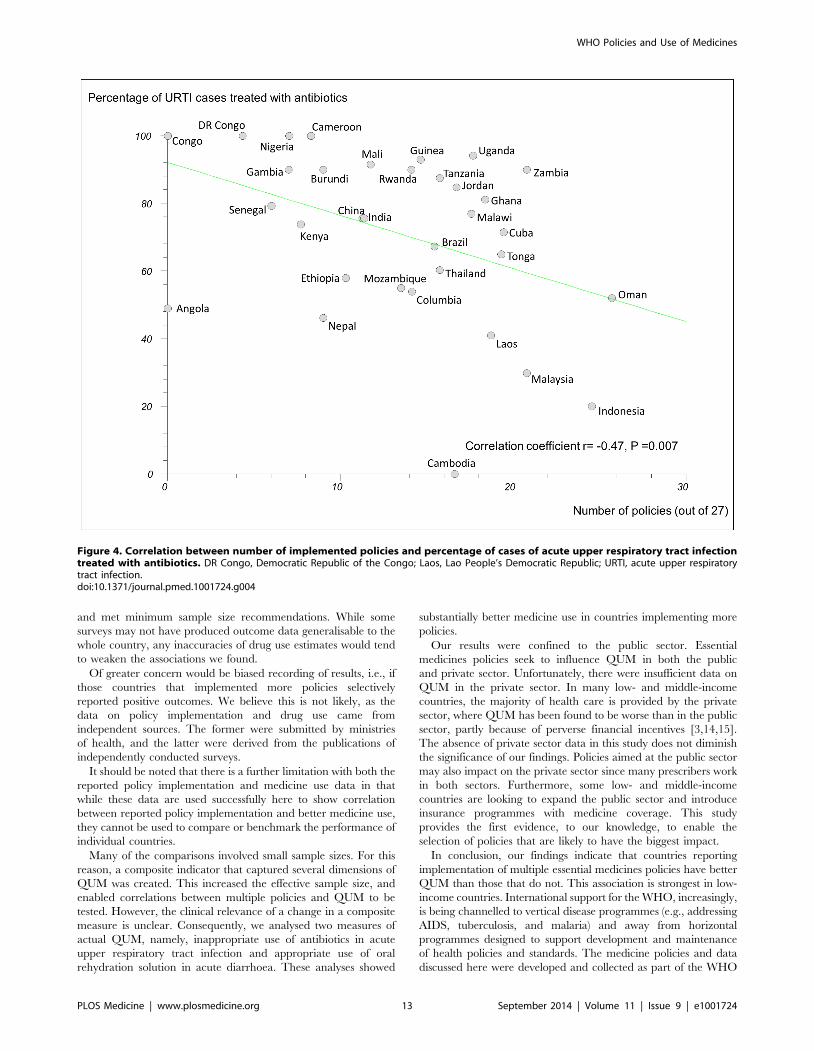
with use of antibiotics in upper respiratory infection (r = 20.47,
95% CI 20.71 to 20.14, p = 0.007) (Figure 4).
For the main analyses, non-parametric regression provided
results similar to those presented here (Table S3).
Discussion
Our most important findings were 2-fold. First, some essential
medicines policies—particularly the provision of undergraduate
WHO Policies and Use of Medicines
PLOS Medicine | www.plosmedicine.org 7 September 2014 | Volume 11 | Issue 9 | e1001724

Ta
ble
3.
Re
sult
sfo
rth
ete
nin
div
idu
alm
ed
icin
eu
sem
eas
ure
me
nts
de
rive
dfr
om
surv
eys
con
du
cte
din
the
56
stu
dy
cou
ntr
ies.
Co
un
try
Pe
rce
nt
of
Pa
tie
nts
Tre
ate
dw
ith
An
tib
ioti
cs
Pe
rce
nt
of
Acu
teD
iarr
ho
ea
Ca
ses
Tre
ate
dw
ith
An
ti-
Dia
rrh
oe
al
Ag
en
ts
Pe
rce
nt
of
Acu
teD
iarr
ho
ea
lC
ase
sT
rea
ted
wit
hA
nti
bio
tics
Pe
rce
nt
of
Acu
teD
iarr
ho
ea
Ca
ses
Tre
ate
dw
ith
Ora
lR
eh
yd
rati
on
So
luti
on
Pe
rce
nt
of
Pre
scri
be
dD
rug
sB
elo
ng
ing
toth
eE
sse
nti
al
Dru
gL
ist
Pe
rce
nt
of
Dru
gs
Pre
scri
be
db
yG
en
eri
cN
am
e
Pe
rce
nt
of
Pa
tie
nts
Tre
ate
dw
ith
Inje
ctio
ns
Pe
rce
nt
of
Acu
teP
ne
um
on
iaC
ase
sT
rea
ted
wit
hth
eC
orr
ect
An
tib
ioti
c
Pe
rce
nt
of
Pa
tie
nts
Tre
ate
din
Co
mp
lia
nce
wit
hS
tan
da
rdT
rea
tme
nt
Gu
ide
lin
es
Pe
rce
nt
of
Acu
teU
pp
er
Re
spir
ato
ryT
ract
Infe
ctio
nC
ase
sT
rea
ted
wit
hA
nti
bio
tics
Arm
en
ia8
6.0
05
9.0
0
An
go
la3
8.2
00
.30
37
.60
41
.20
58
.80
60
.80
4.6
03
9.2
04
9.0
0
Bah
rain
27
.60
Bo
livia
39
.30
Bra
zil
28
.80
5.0
02
4.3
09
0.0
07
9.4
08
3.7
06
.70
49
.30
51
.40
67
.25
Bu
rkin
aFa
so5
8.0
04
4.0
09
3.0
02
3.0
03
4.0
0
Bu
run
di
50
.00
0.0
06
0.0
04
0.0
09
2.4
08
7.3
01
0.0
09
0.0
09
0.0
0
Cam
bo
dia
60
.00
0.0
06
0.0
01
00
.00
10
0.0
01
00
.00
57
.60
10
0.0
08
9.1
00
.00
Cam
ero
on
62
.90
10
.00
75
.00
77
.50
92
.50
88
.80
45
.00
80
.00
10
0.0
0
Ch
ile8
3.1
0
Ch
ina
55
.23
45
.00
52
.50
36
.63
80
.25
44
.91
75
.59
Co
lom
bia
30
.00
11
.00
53
.00
49
.00
94
.20
13
.30
37
.00
54
.00
Co
ng
o4
3.4
08
0.0
06
5.0
01
0.0
05
9.1
05
7.0
04
0.0
09
5.0
01
00
.00
Cu
ba
93
.30
71
.50
De
mo
crat
icR
ep
ub
lico
fth
eC
on
go
66
.00
0.0
06
0.0
08
0.0
08
8.0
05
4.9
03
1.6
06
0.0
01
00
.00
Egyp
t7
2.0
07
4.0
0
Eth
iop
ia5
6.8
04
.66
51
.81
72
.80
21
.81
52
.49
43
.00
58
.06
Gam
bia
50
.00
0.0
07
0.0
07
0.0
01
00
.00
69
.60
28
.40
90
.00
Gh
ana
42
.80
0.0
05
3.1
07
6.6
09
3.9
03
4.9
09
1.1
08
1.2
0
Gu
ate
mal
a4
1.5
09
7.0
01
0.5
0
Gu
ine
a6
4.5
01
.00
66
.00
86
.00
68
.00
93
.00
Ind
ia5
0.7
77
7.8
09
1.5
64
4.4
31
8.6
97
5.7
0
Ind
on
esi
a5
0.0
05
.00
55
.00
95
.00
10
0.0
00
.00
10
0.0
04
7.4
02
0.0
0
Iran
70
.00
10
0.0
03
0.0
0
Jord
an6
1.5
08
9.2
08
4.9
0
Ke
nya
73
.36
2.7
65
3.2
15
4.4
57
9.2
84
8.5
73
4.1
46
7.2
71
5.7
57
3.7
7
Kyr
gyz
stan
35
.00
59
.00
30
.00
Lao
Pe
op
le’s
De
mo
crat
icR
ep
ub
lic4
7.0
05
.00
46
.00
77
.00
86
.15
75
.85
18
.00
91
.00
74
.00
41
.00
Mal
awi
49
.00
55
.33
61
.00
55
.33
77
.00
Mal
aysi
a2
1.7
31
00
.00
42
.05
0.0
02
9.8
0
Mal
i5
8.9
03
4.7
07
7.7
04
6.8
09
4.6
59
3.3
03
5.1
56
0.5
02
3.1
69
1.5
0
WHO Policies and Use of Medicines
PLOS Medicine | www.plosmedicine.org 8 September 2014 | Volume 11 | Issue 9 | e1001724

Ta
ble
3.
Co
nt.
Co
un
try
Pe
rce
nt
of
Pa
tie
nts
Tre
ate
dw
ith
An
tib
ioti
cs
Pe
rce
nt
of
Acu
teD
iarr
ho
ea
Ca
ses
Tre
ate
dw
ith
An
ti-
Dia
rrh
oe
al
Ag
en
ts
Pe
rce
nt
of
Acu
teD
iarr
ho
ea
lC
ase
sT
rea
ted
wit
hA
nti
bio
tics
Pe
rce
nt
of
Acu
teD
iarr
ho
ea
Ca
ses
Tre
ate
dw
ith
Ora
lR
eh
yd
rati
on
So
luti
on
Pe
rce
nt
of
Pre
scri
be
dD
rug
sB
elo
ng
ing
toth
eE
sse
nti
al
Dru
gL
ist
Pe
rce
nt
of
Dru
gs
Pre
scri
be
db
yG
en
eri
cN
am
e
Pe
rce
nt
of
Pa
tie
nts
Tre
ate
dw
ith
Inje
ctio
ns
Pe
rce
nt
of
Acu
teP
ne
um
on
iaC
ase
sT
rea
ted
wit
hth
eC
orr
ect
An
tib
ioti
c
Pe
rce
nt
of
Pa
tie
nts
Tre
ate
din
Co
mp
lia
nce
wit
hS
tan
da
rdT
rea
tme
nt
Gu
ide
lin
es
Pe
rce
nt
of
Acu
teU
pp
er
Re
spir
ato
ryT
ract
Infe
ctio
nC
ase
sT
rea
ted
wit
hA
nti
bio
tics
Mo
ng
olia
27
.40
15
.40
Mo
rocc
o8
3.0
01
.00
72
.00
30
.90
Mo
zam
biq
ue
34
.00
93
.00
97
.00
55
.00
Nam
ibia
50
.50
65
.50
Ne
pal
50
.65
40
.00
55
.35
45
.75
74
.93
58
.97
5.6
07
9.1
01
8.1
04
6.2
0
Nig
er
8.0
07
6.0
02
1.0
0
Nig
eri
a5
3.5
04
0.0
08
0.0
04
0.0
08
6.8
04
1.8
01
0.9
54
0.0
01
00
.00
Om
an3
8.6
36
.50
19
.50
91
.50
97
.50
6.3
95
2.0
0
Pak
ista
n5
5.2
03
7.1
0
Pe
ru5
9.0
07
2.0
07
0.0
02
6.0
07
6.0
0
Ph
ilip
pin
es
55
.40
58
.60
0.0
04
2.9
0
Rw
and
a5
0.0
00
.00
60
.00
70
.00
94
.00
80
.00
20
.00
90
.00
90
.00
Sam
oa
56
.00
75
.00
28
.00
18
.00
Sen
eg
al4
6.0
02
5.7
03
4.9
56
1.6
08
3.2
06
0.0
02
5.0
05
6.6
57
8.5
07
9.3
0
Serb
iaan
dM
on
ten
eg
ro2
7.5
0
Sou
thA
fric
a2
7.0
05
9.5
06
4.2
03
2.0
7
Sud
an7
0.4
06
1.9
74
7.5
18
6.0
82
7.9
82
6.8
04
4.4
05
0.4
2
Th
aila
nd
60
.40
To
ng
a5
3.5
02
.00
17
.35
67
.00
99
.00
37
.00
7.0
08
4.5
06
5.0
0
Tu
nis
ia5
5.5
0
Ug
and
a6
4.3
03
.70
49
.75
68
.05
92
.15
71
.50
23
.10
45
.00
49
.00
94
.15
Tan
zan
ia4
6.4
35
.00
44
.00
71
.00
98
.50
87
.45
25
.67
86
.50
68
.35
87
.50
Uzb
eki
stan
0.0
00
.00
38
.89
Vie
tN
am3
3.3
03
3.3
0
Zam
bia
59
.00
30
.00
61
.00
10
0.0
04
1.0
01
6.0
08
6.8
08
4.4
59
0.0
0
Th
en
um
be
ro
fco
mp
lete
dm
eas
ure
so
fm
ed
icin
eu
seva
rie
db
yco
un
try.
Th
eim
pac
to
fin
com
ple
ted
ata
on
the
resu
lts
of
the
reg
ress
ion
anal
yse
so
fth
eco
mp
osi
tem
eas
ure
of
me
dic
ine
use
on
nu
mb
er
of
po
licie
sre
po
rte
das
imp
lem
en
ted
was
exp
lore
din
sen
siti
vity
anal
yse
s(s
ee
Re
sult
s).
do
i:10
.13
71
/jo
urn
al.p
me
d.1
00
17
24
.t0
03
WHO Policies and Use of Medicines
PLOS Medicine | www.plosmedicine.org 9 September 2014 | Volume 11 | Issue 9 | e1001724

training in standard treatment guidelines to doctors and nurses,
provision of essential medicines free at point of care to all patients,
and having a ministry of health unit promoting QUM—were
associated with improved measures of QUM in a multi-country
study. Second, there was a positive correlation between the
number of medicine policies that countries reported implementing
and the quality of their medicine use. This correlation was
strongest and statistically significant in countries with national per
capita wealth levels below the median of the study countries
(US$2,333), underscoring the importance of essential medicines
policies in low-income countries.
We found that national wealth was associated with a larger
number of implemented policies and also with better medicine use.
Consequently, we treated wealth as a confounder in our analyses
Table 4. Differences in quality use of medicines between countries that did versus did not report implementation of specificmedicine policies.
Policy
Weighted MeanDifference(Percent) 95% Confidence Interval
Undergraduate training in STG for doctors 12.4 5.2 to 19.7
Undergraduate training in STG for nurses 11.2 4.4 to 18.0
Ministry of health unit promoting rational use of medicines 10.9 4.2 to 17.7
Essential medicines free at the point of care for all patients 10.0 3.7 to 16.3
Essential medicines free at the point of care for children under 5 y 8.6 3.6 to 13.6
Undergraduate training in EML for doctors 8.2 4.1 to 12.3
National drug information centre 8.2 2.0 to 14.4
Undergraduate training in EML for nurses 8.1 2.5 to 13.7
DTC in more than half of general hospitals 7.9 1.6 to 14.2
National strategy on antimicrobial resistance 7.2 21.7 to 16.2
Antibiotics not available over-the-counter 7.0 2.7 to 11.4
DTC in more than half of provinces 7.0 1.9 to 12.1
Undergraduate training in STG for paramedics 6.7 0.2 to 13.3
Generic substitution in public sector 6.6 0.3 to 13.0
Prescribing by doctors in primary care 6.6 2.8 to 10.4
National formulary updated in last 5 y 6.1 1.7 to 10.5
Public education on injections in last 2 y 5.4 0.4 to 10.3
Public education on antibiotics in last 2 y 5.2 20.4 to 10.8
Joint regulation‘ of drug promotion 5.1 0.01 to 10.2
Generic prescribing in public sector 4.3 20.5 to 9.1
Injections not available over-the-counter 4.1 21.0 to 9.1
No revenue from drugs to prescribers 3.8 22.9 to 10.6
Active monitoring of adverse drug reactions 3.8 20.2 to 7.7
No prescribing by untrained staff 3.5 21.0 to 8.1
National prescribing audit in last 5 y 3.3 22.6 to 9.1
Undergraduate training in EML for paramedics 2.9 22.0 to 7.9
Public insurance drug coverage limited to EML 2.2 0.03 to 4.4
National EML updated in last 2 y 1.9 22.5 to 6.3
Public insurance for some of the population 1.8 22.0 to 5.7
NMP implementation plan 0.6 22.5 to 3.7
STG updated in last 2 y 20.2 27.9 to 7.5
Public insurance for some drugs 20.6 24.7 to 3.5
Prescribing by nurses in primary care 22.0 26.3 to 2.4
NMP integrated into national health plan 23.1 29.6 to 3.3
CME for doctors 25.7 211.2 to 20.1
CME for nurses and paramedics 28.2 214.3 to 22.0
The table presents the weighted mean (and 95% confidence interval) of differences (in percent) across ten selected measures of QUM between countries that did versusdid not report implementation of specific medicine policies.‘Joint regulation by government and industry, as compared to regulation by government alone.CME, continuing medical education; DTC, drug and therapeutics committee; EML, essential medicines list; NMP, national medicines policy; STG, standard treatmentguidelines.doi:10.1371/journal.pmed.1001724.t004
WHO Policies and Use of Medicines
PLOS Medicine | www.plosmedicine.org 10 September 2014 | Volume 11 | Issue 9 | e1001724

of the impacts of policies. Wealth’s importance has been reported
previously but, to our knowledge, has not been quantified in a
multi-country analysis [3,12,13]. It may be that economic status
improves QUM through generally better health systems and more
educated and healthy populations. However, it could also be that
increased economic status enables policy implementation and that
it is the policies themselves that lead to better medicine use. The
finding that the correlation between number of policies reported
implemented and QUM was unaffected by inclusion of GNIpc in
a multi-linear regression analysis in low-income countries suggests
that the policies may be the most important factor. The findings of
this study are in agreement with several literature reviews that
point to the importance of multiple policy interventions
[3,14,15,25–27], but this is the first time, to our knowledge, that
this approach has been shown to be important on a global scale.
While the data presented here cannot prove causality, they
provide the strongest evidence to date that some essential
medicines policies are effective. The benefits of multiple policies
were seen via a composite measure of QUM that incorporated ten
indicators, as well as by variables that reflected optimal treatment
of acute respiratory tract infection and acute diarrhoeal illness,
strategies that have been shown to lead to improved health
outcomes. The associations of the policies with these two
conditions were robust and comparable with the intervention
effects reported elsewhere [3,14,15]. We believe the sustainability
of such improvements in treatment will be greater with national
policy implementation than with the discrete interventions that are
reported in most reviews [3,14,15,26,27].
Comparisons with Previous StudiesOur findings are consistent with the literature, which shows that
educational interventions are associated with improved prescribing
[3,14,15], but the effects are limited and short term unless there is
follow-up [1]. Published studies also show that some managerial
interventions are effective [1,3,14,15]. This was confirmed here for
provision of free essential medicines, establishment of drug and
therapeutics committees, non-availability of antibiotics over-the-
counter, and several others. Studies point to the effects (positive
and negative) of other policies we examined. A national ministry of
health unit to promote rational use of medicines was associated
with improved medicine use in Oman [28]; enforcing non-
availability of antibiotics over-the-counter in Chile was associated
with reduced antibiotic use [29]; public education resulted in
modestly improved antibiotic use in Europe [17]. Supplementa-
tion of prescriber income by the selling of medicines has been seen
to be associated with worse medicine use in China [30] and
Zimbabwe [31,32], and separation of the prescriber and dispenser
functions in Korea was associated with reduced inappropriate
antibiotic use [33]. Government regulation of drug promotion has
been found to be more effective than self-regulation [34]. In our
Figure 2. Correlation between the number of policies that countries reported implementing (out of 27) and a composite measure ofquality use of medicines in 56 countries. Details of calculation of the composite QUM measure are provided in the Methods. B Faso, BurkinaFaso; DR Congo, Democratic Republic of the Congo; Laos, Lao People’s Democratic Republic; S Africa, South Africa; Serbia Montenegro, Serbia andMontenegro.doi:10.1371/journal.pmed.1001724.g002
WHO Policies and Use of Medicines
PLOS Medicine | www.plosmedicine.org 11 September 2014 | Volume 11 | Issue 9 | e1001724

study, joint government and industry regulation was associated
with better medicine use than government regulation alone.
It is important to note that other potentially effective policies
were not examined in this study. For example, prescription audit
and feedback and some pricing policies have been found effective
[3,14,15] and form part of a broader range of policy instruments
that should be considered by governments.
Disconcertingly, policies encouraging continuing medical edu-
cation of doctors, nurses, and paramedical workers were associated
with actual worsening of QUM. In our view, this may be because
such activities in the study countries were funded by the
pharmaceutical industry. The effectiveness of continuing medical
education conducted in other circumstances may be different.
Potential Sources of BiasOur findings should be interpreted carefully. Governments with
effective overall health policies may be more likely to implement
rational medicine policies; consequently, it may be the general
functioning of the health care system in these countries that leads
to better QUM. Some outcomes may be a result of specific vertical
disease policies. There was a moderate to strong positive
correlation between the number of medicine policies reported as
implemented and the frequency of oral rehydration solution use in
acute diarrhoea. This may be because governments that are
successful in implementing acute diarrhoea treatment programmes
are those that also implement essential medicines policies. On the
other hand, the moderate to strong inverse correlation between
the number of policies reported as implemented and the use of
antibiotics in acute upper respiratory tract infection is more likely
to point to a specific effect of the medicine policies.
LimitationsThe study design is, in effect, an ecological study using
secondary data analysis showing that the more policies that are
implemented, the better the QUM. However, without consistent
longitudinal data (which do not exist in many countries), causality
cannot be inferred.
The policy data are based on responses to questionnaires sent to
ministries of health, and there may be an incentive to over-report
successes in policy implementation or to report that policies were
implemented when, in fact, they were not. If this happened, then
the associations between policy implementation and QUM that we
found are likely to be weaker than if policy implementation had
been reported correctly. Furthermore, the assumption that policies
remained the same throughout 2002–2008 for those countries not
reporting in both 2003 and 2007 may not be correct. Nevertheless,
the fact that there was only a 20% difference in reported policies
for those countries reporting in both 2003 and 2007 suggests that
the majority of policies are likely to have remained the same
throughout the period.
We were also reliant on surveys to measure QUM. These were
not part of a single planned prospective study. However, the
WHO, in collaboration with INRUD, did extensive work to
establish minimum standards (methodology and indicators) for
surveying medicine use in primary health care facilities [3,14].
Consequently, the surveys we relied on had standardised methods
Figure 3. Correlation between number of implemented policies and percentage of cases of acute diarrhoeal illness treated withoral rehydration solution. DR Congo, Democratic Republic of the Congo; Laos, Lao People’s Democratic Republic; ORS, oral rehydration solution.doi:10.1371/journal.pmed.1001724.g003
WHO Policies and Use of Medicines
PLOS Medicine | www.plosmedicine.org 12 September 2014 | Volume 11 | Issue 9 | e1001724
and met minimum sample size recommendations. While some
surveys may not have produced outcome data generalisable to the
whole country, any inaccuracies of drug use estimates would tend
to weaken the associations we found.
Of greater concern would be biased recording of results, i.e., if
those countries that implemented more policies selectively
reported positive outcomes. We believe this is not likely, as the
data on policy implementation and drug use came from
independent sources. The former were submitted by ministries
of health, and the latter were derived from the publications of
independently conducted surveys.
It should be noted that there is a further limitation with both the
reported policy implementation and medicine use data in that
while these data are used successfully here to show correlation
between reported policy implementation and better medicine use,
they cannot be used to compare or benchmark the performance of
individual countries.
Many of the comparisons involved small sample sizes. For this
reason, a composite indicator that captured several dimensions of
QUM was created. This increased the effective sample size, and
enabled correlations between multiple policies and QUM to be
tested. However, the clinical relevance of a change in a composite
measure is unclear. Consequently, we analysed two measures of
actual QUM, namely, inappropriate use of antibiotics in acute
upper respiratory tract infection and appropriate use of oral
rehydration solution in acute diarrhoea. These analyses showed
substantially better medicine use in countries implementing more
policies.
Our results were confined to the public sector. Essential
medicines policies seek to influence QUM in both the public
and private sector. Unfortunately, there were insufficient data on
QUM in the private sector. In many low- and middle-income
countries, the majority of health care is provided by the private
sector, where QUM has been found to be worse than in the public
sector, partly because of perverse financial incentives [3,14,15].
The absence of private sector data in this study does not diminish
the significance of our findings. Policies aimed at the public sector
may also impact on the private sector since many prescribers work
in both sectors. Furthermore, some low- and middle-income
countries are looking to expand the public sector and introduce
insurance programmes with medicine coverage. This study
provides the first evidence, to our knowledge, to enable the
selection of policies that are likely to have the biggest impact.
In conclusion, our findings indicate that countries reporting
implementation of multiple essential medicines policies have better
QUM than those that do not. This association is strongest in low-
income countries. International support for the WHO, increasingly,
is being channelled to vertical disease programmes (e.g., addressing
AIDS, tuberculosis, and malaria) and away from horizontal
programmes designed to support development and maintenance
of health policies and standards. The medicine policies and data
discussed here were developed and collected as part of the WHO
Figure 4. Correlation between number of implemented policies and percentage of cases of acute upper respiratory tract infectiontreated with antibiotics. DR Congo, Democratic Republic of the Congo; Laos, Lao People’s Democratic Republic; URTI, acute upper respiratorytract infection.doi:10.1371/journal.pmed.1001724.g004
WHO Policies and Use of Medicines
PLOS Medicine | www.plosmedicine.org 13 September 2014 | Volume 11 | Issue 9 | e1001724

core ‘‘normative’’ functions, which are now under threat [35,36]. It
is important that the critical role of the WHO is recognised and that
these efforts are sustained and enhanced.
Supporting Information
Figure S1 Correlation between the number of policies that
countries reported implementing (out of 18) and a composite
measure of quality use of medicines in 56 countries.
(DOCX)
Figure S2 Correlation between gross national income per capita
and a composite measure of quality use of medicine in 56 countries.
(DOCX)
Figure S3 Correlation between gross national income per capita
and the number of policies countries report implementing (27-
policy variable).
(DOCX)
Figure S4 Correlation between gross national income per capita and
the number of policies countries report implementing (18-policy variable).
(DOCX)
Figure S5 Correlation between the number of policies that
countries reported implementing (out of 27) and a composite
measure of quality use of medicines in countries with gross
national income per capita values above the median for the group
(US$2,333).
(DOCX)
Figure S6 Correlation between the number of policies that
countries reported implementing (out of 27) and a composite
measure of quality use of medicines in countries with gross
national income per capita values below the median for the group
(US$2,333).
(DOCX)
Figure S7 Correlation between the number of policies that
countries reported implementing (out of 27) and a composite
measure of quality use of medicines in 56 countries. This analysis
was restricted to countries that had five or more measures of
medicine use contributing to their composite QUM score.
(DOCX)
Table S1 Reported implementation of policies by country.
(XLSX)
Table S2 Individual medicine use measures by country and with
references.
(XLS)
Table S3 Spearman rank correlation coefficients for the main
regression analyses.
(DOCX)
Author Contributions
Conceived and designed the experiments: KAH. Performed the experi-
ments: KAH DAH. Analyzed the data: KAH DAH. Contributed reagents/
materials/analysis tools: KAH DAH. Wrote the first draft of the
manuscript: KAH. Wrote the paper: KAH DAH. ICMJE criteria for
authorship read and met: KAH DAH. Agree with manuscript results and
conclusions: KAH DAH.
References
1. Holloway KA (2011) Combating inappropriate use of medicines. Expert Rev
Clin Pharmacol 4: 335–348.
2. Holloway KA, van Dijk L, World Health Organization (2011) The
world medicines situation, third edition. WHOb/EMP/MIE/2011.2.2.
Geneva: World Health Organization. Available: http://www.who.int/medicines/
areas/policy/world_medicines_situation/en/index.html. Accessed 5 July 2013.
3. World Health Organization (2009) Medicines use in primary care in developing
and transitional countries: fact book summarizing results from studies reported
between 1990 and 2006. WHO/EMP/MAR/2009.3. Geneva: World Health
Organization.
4. Livermore DM (2003) Bacterial resistance: origins, epidemiology, and impact.
Clin Infect Dis 36 (Suppl 1): S11–S23.
5. Harbarth S, Samore MH (2005) Antimicrobial resistance determinants and
future control. Emerg Infect Dis 11: 794–801.
6. Goossens H (2009) Antibiotic consumption and link to resistance. Clin Microbiol
Infect 15 (Suppl 3): 12–15.
7. Pirmohamed M, James S, Meakin S, Green C, Scott AK, et al. (2004) Adverse
drug reactions as cause of admission to hospital: prospective analysis of 18,820
patients. BMJ 329: 15–19.
8. Howard RL, Avery AJ, Slavenburg S, Royal S, Pipe G, et al. (2006) Which drugs
cause preventable admissions to hospital? A systematic review. Br J Clin
Pharmacol 63: 136–147.
9. Hitchen L (2006) Adverse drug reactions result in 250 000 UK admissions a
year. BMJ 332: 1109.
10. World Health Organization (1985) The rational use of drugs: report of the
conference of experts. Geneva: World Health Organization.
11. World Health Organization (2002) Promoting rational use of medicines: core
components. WHO Policy Perspectives of Medicines, No. 5. Geneva: World
Health Organization.
12. World Health Organization (2006) Using indicators to measure country
pharmaceutical situations: fact book on WHO level I and level II monitoring
indicators. WHO/TCM/2006.2. Geneva: World Health Organization.
13. World Health Organization (2010) Country pharmaceutical situations: fact book
on WHO level 1 indicators 2007. WHO/EMP/MPC/2010.1. Geneva World
Health Organization.
14. Holloway KA, Ivanovska V, Wagner AK, Vialle-Valentin C, Ross-Degnan D (2013)
Have we improved use of medicines in developing and transitional countries and do
we know how to? Two decades of evidence. Trop Med Int Health 18: 656–664.
15. Holloway KA, Ivanovska V, Wagner AK, Vialle-Valentin C, Ross-Degnan D
(2014) Prescribing for acute childhood infections in developing and transitional
countries, 1990–2009. Paediatr Int Child Health. E-pub ahead of print.
doi:10.1179/2046905514Y.0000000115
16. Molstad S, Erntell M, Hanberger H, Melander E, Norman C, et al. (2008)
Sustained reduction of antibiotic use and low bacterial resistance: 10 year follow-
up of the Swedish STRAMA programme. Lancet Infect Dis 8: 125–132.
17. Huttner B, Goossens H, Verheij T, Harbath S, CHAMP consortium (2009)
Characteristics and outcomes of public campaigns with the aim to improve
outpatient antibiotic use in high income countries. Lancet Infect Dis 10: 17–31.
18. Sabuncu E, David J, Bernede-Bauduin C, Pepin S, Leroy M, et al. (2009)
Significant reduction of antibiotic use in the community after a nationwide
campaign in France, 2002–2007. PLoS Med 6: e1000084.
19. Ratanawijitrasin S, Soumerai SB, Weerasuriya K (2001) Do national medicinal
drug policies and essential drug programs improve drug use? A review of
experiences in developing countries. Soc Sci Med 53: 831–844.
20. World Health Organization (1993) How to investigate drug use in health
facilities: selected drug use indicators. WHO/DAP/93.1. Geneva: World Health
Organization.
21. Gove S (1997) Integrated management of childhood illness by outpatient health
workers: technical basis and overview. The WHO Working Group on
Guidelines for Integrated Management of the Sick Child. Bull World Health
Organ 75 (Suppl 1): 7–24.
22. World Health Organization (2007) WHO operational package for assessing,
monitoring and evaluating country pharmaceutical situations: guide for
coordinators and data collectors. WHO/TCM/2007.2. Geneva: World Health
Organization.
23. World Health Organization (2006) Expert meeting on pharmaceutical
indicators, monitoring and assessment. Geneva: World Health Organization.
24. World Health Organization (2011) Development of country profiles and
monitoring of the pharmaceutical situation in countries. Available: http://
www.who.int/medicines/areas/coordination/coordination_assessment/en/.
Accessed 15 May 2014.
25. Rowe AK, de Savigny D, Lanata CF, Victora CG (2005) How can we achieve
and maintain high-quality performance of health workers in low resource
settings? Lancet 366: 1026–1035.
26. Francke AL, Smit MC, De Veer AJE, Mistiaen P (2008) Factors influencing the
implementation of clinical guidelines for health care professionals: a meta-
review. BMC Med Inform Decis Mak 8: 38.
27. Sketris IS, Ingram EML, Lummis HL (2009) Strategic opportunities for effective
optimal prescribing and medication management. Can J Clin Pharmacol 16:
e103–e125.
WHO Policies and Use of Medicines
PLOS Medicine | www.plosmedicine.org 14 September 2014 | Volume 11 | Issue 9 | e1001724

28. Jaffer B (2007) National approach of promote rational use of medicines: the
Omani experience. Available: http://www.who.int/drugresistance/OmanDRD
UforWHAMeetingGeneva.pdf. Accessed 5 July 2013.
29. Bavestrello L, Cabello A, Casanova D (2002) Impact of regulatory measures in
the trends of community consumption of antibiotics in Chile. Rev Med Chil 130:
1265–1272.
30. Chen W, Tang S, Sun J, Ross-Degnan D, Wagner A (2010) Availability and use
of essential medicines in China: manufacturing, supply and prescribing in
Shandong and Gansu provinces. BMC Health Serv Res 10: 211. doi:10.1186/
1472-6963-10-211
31. Trap B, Hansen EH, Hogerzeil HV (2002) Prescription habits of dispensing and
non-dispensing doctors in Zimbabwe. Health Policy Plan 17: 288–295.
32. Trap B, Hansen EH (2002) Treatment of upper respiratory tract infections—a
comparative study of dispensing and non-dispensing doctors. J Clin Pharm Ther27: 289–299.
33. Park S, Soumerai SB, Adams AS, Finkelstein JA, Jang S, et al. (2005) Antibiotic
use following a Korean national policy to prohibit medication dispensing byphysicians. Health Policy Plan 20: 302–309.
34. World Health Organization (2004) Drug Promotion: what we know, what wehave yet to learn—reviews of materials in the WHO/HAI Database on Drug
Promotion. EDM Research Series, No. 32, WHO/EDM/PAR/2004.3. Gene-
va: World Health Organization.35. Saunders P, Kamal-Yanni M (2012) Urgent need for WHO’s reform to prioritise
core functions. Lancet 379: 1878.36. Saunders P, Kamal-Yanni M (2013) Action to preserve WHO’s core medicines-
related roles—1 year on. Lancet 381: 293–294.
WHO Policies and Use of Medicines
PLOS Medicine | www.plosmedicine.org 15 September 2014 | Volume 11 | Issue 9 | e1001724

Editors’ Summary
Background. The widespread availability of effectivemedicines, particularly those used to treat infectious diseas-es, has been largely responsible for a doubling in the averageglobal life expectancy over the past century. However, thesuboptimal use (overuse and underuse) of medicines is anongoing global public health problem. The unnecessary useof medicines (for example, the use of antibiotics for sorethroats caused by viruses) needlessly consumes scarceresources and has undesirable effects such as encouragingthe emergence of antibiotic resistance. Conversely, underusedeprives people of the undisputed benefits of manymedicines. Since 1977, to help optimize medicine use, theWorld Health Organization (WHO) has advocated theconcept of ‘‘essential medicines’’ and has developed policiesto promote the quality use of medicines (QUM). Essentialmedicines are drugs that satisfy the priority needs of thehuman population and that should always be available tocommunities in adequate amounts of assured quality, in theappropriate dosage forms, and at an affordable price.Policies designed to promote QUM include recommenda-tions that medicines should be free at the point of care andthat all health care professionals should be educated aboutthe WHO list of essential medicines (which is revised everytwo years) throughout their careers.
Why Was This Study Done? Surveys of WHO membercountries undertaken in 2003 and 2007 suggest that theimplementation of WHO policies designed to promote QUMis patchy. Moreover, little is known about whether thesepolicies are effective, particularly in middle- and low-incomecountries. For most of these countries, it is not knownwhether any of the policies affect validated QUM indicatorssuch as the percentage of patients prescribed antibiotics (alower percentage indicates better use of medicines) or thepercentage of patients treated in compliance with nationaltreatment guidelines (a higher percentage indicates betteruse of medicines). Here, the researchers analyze data frompolicy implementation questionnaires and medicine usesurveys to determine whether implementation of WHOessential medicines policies is associated with improvedQUM in low- and middle-income countries.
What Did the Researchers Do and Find? The researchersextracted data on ten validated QUM indicators and onimplementation of 36 policy variables from WHO databas-es for 2002–2008 and compared the average differencesfor the QUM indicators between low- and middle-incomecountries that did versus did not report implementation ofspecific WHO policies for QUM. Among 56 countries forwhich data were available, 27 policies were associated withimproved QUM. Four policies were particularly effective,namely, doctors’ undergraduate training in standardtreatment guidelines, nurses’ undergraduate training instandard treatment guidelines, the existence of a ministryof health department promoting the rational use ofmedicines, and the provision of essential medicines freeto all patients at point of care. The researchers also
analyzed correlations between how many of the 27effective policies were implemented in a country and acomposite QUM score. As national wealth increased, boththe composite QUM score of a country and the reportednumber of policies implemented by the country increased.There was also a positive correlation between the numbersof policies that countries reported implementing and theircomposite QUM score. Finally, the implementation ofmultiple policies was more strongly associated with thecomposite QUM score in countries with a gross nationalincome per capita below the average for the studycountries than in countries with a gross national incomeabove the average.
What Do These Findings Mean? These findings showthat between 2002 and 2008, the reported implementationof WHO essential medicines policies was associated withbetter QUM across low- and middle-income countries.These findings also reveal a positive correlation betweenthe number of policies that countries report implementingand their QUM. Notably, this correlation was strongest inthe countries with the lowest per capita national wealthlevels, which underscores the importance of essentialmedicines policies in low-income countries. Because ofthe nature of the data available to the researchers, thesefindings do not show that the implementation of WHOpolicies actually causes improvements in QUM. Moreover,the age of the data, the reliance on self-report of policyimplementation, and the small sample sizes of the medicineuse surveys may all have introduced some inaccuracies intothese findings. Nevertheless, overall, these findings suggestthat WHO should continue to develop its medicine policiesand to collect data on medicine use as part of its corefunctions.
Additional Information. Please access these websites viathe online version of this summary at http://dx.doi.org/10.1371/journal.pmed.1001724.
N The World Health Organization provides information aboutessential medicines; its latest lists of essential medicinesare available on the Internet; information about WHOpolicies to improve the quality use of medicines is alsoavailable (in several languages)
N The International Network for the Rational Use of Drugsdesigns, tests, and disseminates effective strategies toimprove the way drugs are prescribed, dispensed, andused, particularly in resource-poor countries
N The essentialdrugs.org website helps health care profes-sionals, researchers, and policy makers obtain and discusscurrent information on essential drugs, policy, programactivities, education, and training (available in severallanguages); the website is run by Satellife, which aims touse technology to connect health workers in resource-limited countries to each other and to up-to-date clinicaland public health content
WHO Policies and Use of Medicines
PLOS Medicine | www.plosmedicine.org 16 September 2014 | Volume 11 | Issue 9 | e1001724