Embed Size (px)
Citation preview

8/7/2019 WHO Child growth standards idi SAM
http://slidepdf.com/reader/full/who-child-growth-standards-idi-sam 1/12
WHOh d row h
d rdd h
d f oo v r
um u r o
d h dr
A Joint Statementby the World HealthOrganizationand the United NationsChildren’s Fund

8/7/2019 WHO Child growth standards idi SAM
http://slidepdf.com/reader/full/who-child-growth-standards-idi-sam 2/12
2
This statement presents the recommended cut-o s, summarizes the rationale
or their adoption and advocates or their harmonized application in theidenti cation o 6–60 month old in ants and children or the management o
severe acute malnutrition (SAM). It also reviews the implications on patient load, ondischarge criteria and on programme planning and monitoring.
Using weight- or-height: WHO and UNICEFrecommend the use o a cut-o or weight- or-height o below -3 standard deviations (SD)o the WHO standards to identi y in ants andchildren as having SAM. The commonly usedcut-o is the same cut-o or both the new 2006WHO child growth standards (WHO standards)as with the earlier National Center or HealthStatistics (NCHS re erence). The reasons or the
choice o this cut-o are as ollows:1) Children below this cut-o have a highly
elevated risk o death compared to thosewho are above;
2) These children have a higher weight gainwhen receiving a therapeutic diet comparedto other diets, which results in asterrecovery;
3) In a well-nourished population there arevirtually no children below -3 SD (<1%).
4) There are no known risks or negative e ectsassociated with therapeutic eeding o thesechildren applying recommended protocolsand appropriate therapeutic oods.
Using MUAC: WHO standards or mid-upperarm circum erence (MUAC)- or-age show that ina well nourished population there are very ewchildren aged 6–60 months with a MUAC lessthan 115 mm. Children with a MUAC less than115 mm have a highly elevated risk o deathcompared to those who are above. Thus it isrecommended to increase the cut-o point rom110 to 115 mm to de ne SAM with MUAC.
When using the WHO child growth standards toidenti y the severely malnourished among 6–60month old children, the below -3SD cut-o orweight- or-height classi es two to our timesas many children compared with the NCHSre erence. The prevalence o SAM, i.e. numberso children with SAM, based on weight- or-height below -3 SD o the WHO standards andthose based on a MUAC cut-o o 115 mm, arevery similar. The shi t rom NCHS to WHO childgrowth standards or the adoption o the newcut-o or MUAC will there ore sharply increasecase loads. This has programmatic implications.
R omm d oBOx 1. DiagnOstic cRiteRia OR saM in cHilDRen ageD 6–60 MOntHs
i d or M ur cu -o
S v r wasting ( 2 ) W ight-for-h ight ( 1 ) < -3 SD
S v r wasting ( 2 ) MUAC < 115 mm
Bilat ral o d ma ( 3 ) Clinical sign
1 Bas d on WHO Standards ( www.who.int/childgrowth/standards )2,3 Ind p nd nt indicators of SAM that r quir urg nt action

8/7/2019 WHO Child growth standards idi SAM
http://slidepdf.com/reader/full/who-child-growth-standards-idi-sam 3/12
3
R oThe WHO Child Growth StandardsIn 2006, WHO published child growth standards
or attained weight and height to replace the
previously recommended 1977 NCHS/WHOchild growth re erence. These new standardsare based on breast ed in ants and appropriately
ed children o di erent ethnic origins raisedin optimal conditions and measured in astandardized way ( 1). The same cohort wasused to produce standards o mid-upper armcircum erence (MUAC) in relation to age ( 2 ).The new WHO growth standards con rm earlierobservations that the e ect o ethnic di erenceson the growth o in ants and young children in
populations is small compared with the e ects othe environment. Studies have shown that theremay be some ethnic di erences among groups,just as there are genetic di erences amongindividuals, but or practical purposes theyare not considered large enough to invalidatethe general use o the WHO growth standardspopulation as a standard in all populations.These new standards have been endorsedby international bodies such as the UnitedNations Standing Committee on Nutrition ( 3 ),
the International Union o Nutritional Sciences(4 ) and International Pediatric Association andadopted in more than 90 countries ( 5 ).
Diagnosing severe acute malnutrition(severe wasting or kwashiorkor ormarasmic kwashiorkor)In 1999, WHO de ned severe malnutrition inchildren as a weight- or-height 1 below -3 SD 2
(based on NCHS re erence) and/or the presenceo oedema ( 6 ). Experts in a meeting in 2005, ( 7 ,8 )recommended to add MUAC less than 110 mm(in 6 to 60 month old children) as an independentdiagnostic criterion. Since the 2005 meeting, theWHO standards have been published and thereis there ore a need to reassess diagnostic criteriaincluding MUAC. The rationale or keeping thesame cut-o or weight- or-height when de ningsevere acute malnutrition and or adjusting theMUAC cut-o up to 115 mm, based on the WHO
standards is given below.
Risk o death and severe acute malnutritionFollowing the release o the WHO child growthstandards, the relationship between weight- or-
BOx 2. saM ManageMent
i d p d • No appetite • Appetite dd o r r • Medical • No medical
complications complications
typ o h r p u y-b d commu y-b d d
i rv o F75 → F100/RUTF RUTF, basicAnd 24 hour m dical m dical carcar
D h r r r R duc d o d ma 15 to 20%(tr o r r Good app tit w ight gain
rom y o (with acc ptabla
intak ommu y-b d of RUTF)
r )a Child ats at l ast 75% of th ir calculat d RUTF ration for th day
1 When assessing weight- or-height, in ants and childrenunder 24 months o age should have their lengthsmeasured lying down (supine). Children over 24 monthso age should have their heights measured whilestanding. For simplicit y, however, in ants and childrenunder 87 cm can be measured lying down (or supine) and
those above 87 cm standing.2 A z-score is the number o standard deviations (SD)
below or above the re erence median value.

8/7/2019 WHO Child growth standards idi SAM
http://slidepdf.com/reader/full/who-child-growth-standards-idi-sam 4/12
4
height and the risk o dying was reassessed inexisting epidemiological studies. 1 This analysisshowed that h dr w h w h - or-h hb ow -3 sD b d o h WHO d rd h v
h h r k o d hexceeding 9- old that ochildren with a weight- or-height above -1 SD( ur 1) (9 ). s m r ud u MUac d o r r how d h h r k o dy
r d b ow 115 mm (10 ). The elevatedrisk o death below these cut-o s requires theimplementation o intensive nutritional andmedical support.
Speci city o recommended cut-o s ordiagnosing severe acute malnutritionW h - or-h h b ow -3 sD h h y
p f r r o o d y v r y u ym our h d d h dr . Statisticaltheory shows that in a well-nourishedpopulation, only 0.13% o children will havea weight- or-height less than -3 SD, giving a
speci city o more than 99%2
or this cut-o .With the release o the WHO standards orMUAC- or-age, the revision o the earlier
recommended MUAC cut-o o 110 mm as anindependent diagnostic criterion or severeacute malnutrition was necessary. a h h r
u -o o 115 mm r omm d d wd y mor d h dr h v
v r u m u r o d h v h hp f y o mor h 99% ov r h r
6–60 mo h .
Children below -3 SD o the WHOchild growth standards bene t romtherapeutic eedingCurrently, children with severe acutemalnutrition are treated with special therapeutic
oods, most commonly Ready-to-Use-Therapeutic Foods or F75 and F100 milk-baseddiets.
Data rom Malawi suggests that in ants andchildren 6–60 months o age with a weight-
or-height above -3 SD o the NCHS re erencealso bene t rom these therapeutic diets(11 ). The children who are above -3 SD o theNCHS re erence but are below -3 SD o theWHO standards are most likely to bene t romtherapeutic eeding.
Absence o risk and o negativeconsequences o therapeutic eedingThe current treatment protocols or managingsevere acute malnutrition have no known risk,and minimise negative social consequences.l r dm o r r or
h r p u d hou d b promo d r r r r d d o d y d h dr h h r k o mor y. The
below -3 SD cut-o based on the WHO growthstandards or weight- or-height and the MUACcut-o o 115 mm seem well adapted to currentprotocols.
imp o o u hWHO d rdProgrammatic implications o theadoption o the WHO standards andchanging the MUAC cut-o or identi cationo children with SAMUsing the new WHO standards in developingcountry situations results in a 2–4 timesincrease in the number o in ants and children
alling below -3 SD compared to using theormer NCHS re erence ( 12 ,13 ).
1 The assessment o the risk o death associated withdi erent degrees o was ting can be carried out only bycommunity based longitudinal studies with a ollow upo untreated malnourished children. This can be analysedonly rom a limited number o existing s tudies. Forethical reasons, these observational studies cannot berepeated, as an e ective community-based treatment osevere acute malnutrition is now possible.
2 Speci city is de ned as the percentage o healthyindividuals correctly diagnosed as healthy by thediagnostic test.
Not : r f r nc cat gory: childr n with a w ight-for-h ight> -1 SD.
FIGURe 1
Odd r o or mor y by w h - or-h h .ad p d rom r r 9
0
2
4
6
8
10
Odds ratio
More than -1 -2 to < -1 -3 to < -2 < -3
Weight-for-height

8/7/2019 WHO Child growth standards idi SAM
http://slidepdf.com/reader/full/who-child-growth-standards-idi-sam 5/12
5
To better estimate the increase in patient loadresulting rom the adoption o the WHO growthstandards, an analysis was per ormed on adata base comprising 560 di erent nutritionalsurveys conducted in 31 countries ( 14 ). The dataset contained anthropometric measurements ormore than 450 000 children aged 6–60 months.th pr v o saM d f d by w h -
or-h h b ow -3 sD o h WHO d rdd by MUac u -o o 115 mm w r v rym r: 3.22% and 3.27% respectively. When
using the NCHS re erence, the prevalence osevere acute malnutrition was very similar whende ned using weight- or-height below -3 SD andwith MUAC below 110 mm: 1.48% and 1.49%,respectively.
i mpor o o h u h r h
WHO d rd or h ncHs r r , h d u w h - or-h h d
MUac w r o h m . Only about 40%selected by the one criterion were also selectedby the other. Part o the explanation is thatchildren with a ow MUAC tend to be youngerthan those with a weight- or-height less than-3 SD. The implications o these di erencesin terms o associated risk and response totreatment deserves urther investigation and inthe meantime bo h hou d o u o b u d
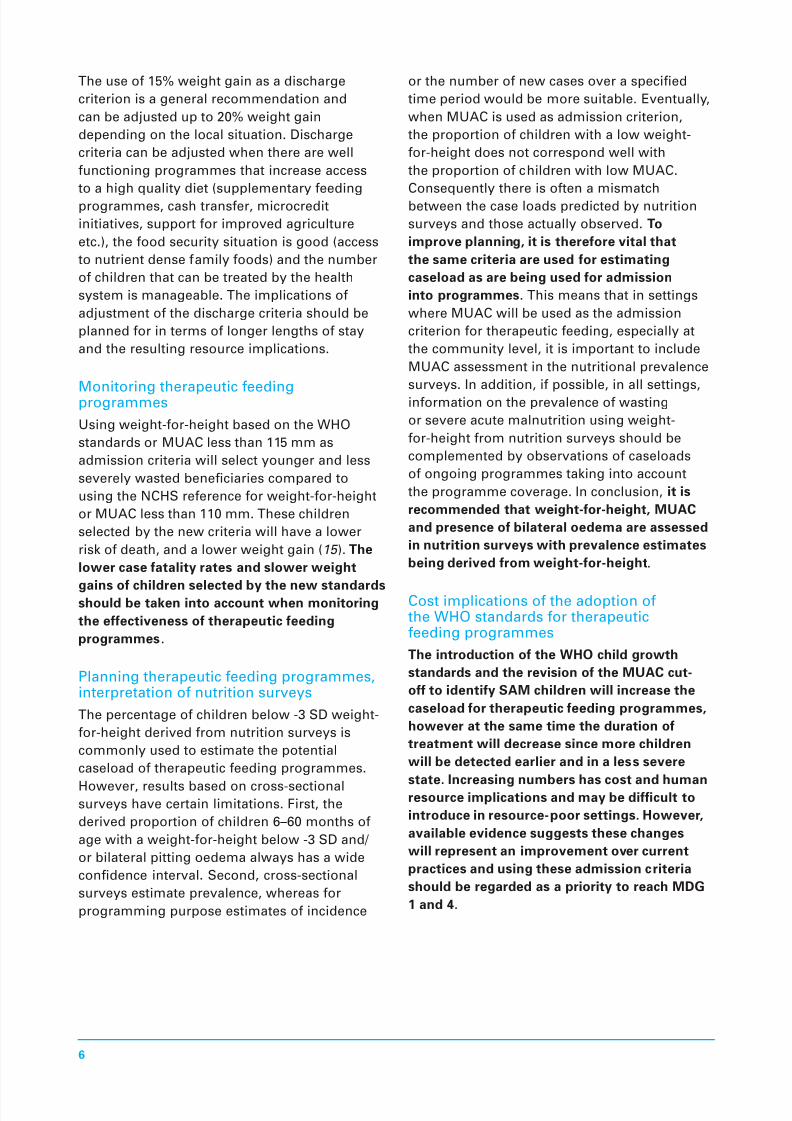
d p d r r or dm o.Selection o patients according to the WHOstandards is greatly acilitated by the use olook-up tables as shown in a 1 .1
Rede ning discharge criteriaPreviously recommended discharge criteriabased on a minimum weight- or-height arenot applicable to programmes using MUAC asadmission criteria, as some children selected
using MUAC already ul l these weight- or-height discharge criteria on admission into theprogramme. This is a concern especially withlarge scale community-based programmesrelying extensively on MUAC as the criterion oradmission.
It is recommended that the discharge criterionbe based on percentage weight gain. Usinga discharge criterion based on percentageweight gain has the advantage o being easy
to apply to children admitted based on MUACas well to those admitted on weight- or-height.This approach has the added advantage asit eliminates the need or repeated heightmeasurements during treatment.
Children with weight- or-height above -2 andbelow -1 SD, have a lower mortality risk thanthose below -3 SD. Those with a weight- or-
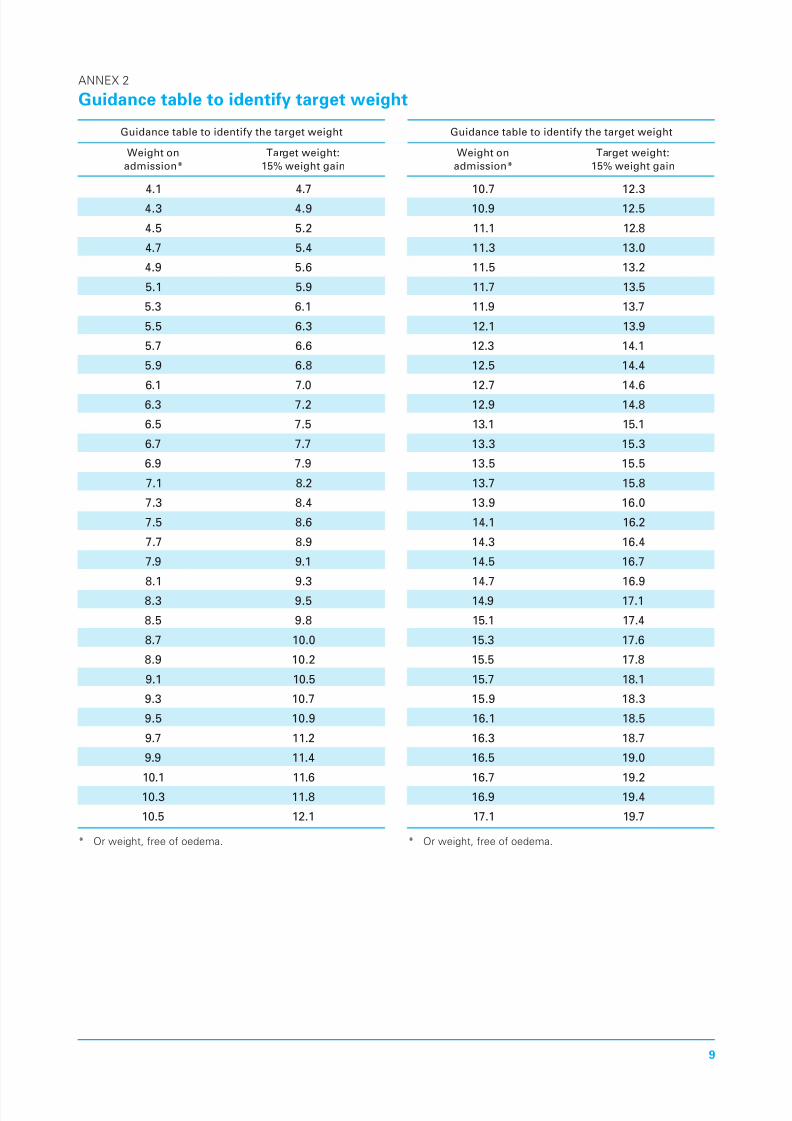
height above -1 SD have an even lower risk odeath ( ur 1). Reaching a weight- or-heightabove -2 or above - 1 SD can be used as ayardstick or de ning discharge criteria. Forchildren admitted at -3 SD weight- or-heightde ned by the WHO standards, a discharge at-2 SD and at -1 SD corresponds on average toa weight gain o 9% and 19% respectively. Thispercentage varies little or di erent lengths orheights ( ur 2). or mp y, po b
o u 15 % w h d h r r r o
or d h dr dm d oh r p u d pro r mm ( t b 2
). When weight- or-height is used as anadmission criterion, it is advisable to continue todischarge children at weight- or-height -1 SD.
For children with oedema, the same dischargecriterion should be applied using the weighta ter oedema has disappeared as the baseline.However, or children who have a weight- or-height above -3 SD or a MUAC above 115 mmonce they are ree rom oedema, a dischargetwo weeks a ter the disappearance o oedema isusually su cient to prevent relapse.
FIGURe 2
P r o w h d d o movrom -3 o -2 or -1 sD w h h WHO row h
d rd r o o h or h h
Data ar shown for girls only. Th top curv corr sponds to a
chang up to -1 SD, th low r curv to a chang up to -2.
% weight gain
Length/height (cm)
0
5
10
15
20
25
40 50 60 70 80 90 100 110 120 130
1 More detailed tables are available on: http://www.who.int/childgrowth/standards/weight_ or_length/en/index.html and http://www.who.int/childgrowth/standards/ weight_ or_height/en/index.html
8/7/2019 WHO Child growth standards idi SAM
http://slidepdf.com/reader/full/who-child-growth-standards-idi-sam 6/12
6
The use o 15% weight gain as a dischargecriterion is a general recommendation andcan be adjusted up to 20% weight gaindepending on the local situation. Dischargecriteria can be adjusted when there are well
unctioning programmes that increase accessto a high quality diet (supplementary eedingprogrammes, cash trans er, microcreditinitiatives, support or improved agricultureetc.), the ood security situation is good (accessto nutrient dense amily oods) and the numbero children that can be treated by the healthsystem is manageable. The implications oadjustment o the discharge criteria should beplanned or in terms o longer lengths o stayand the resulting resource implications.
Monitoring therapeutic eedingprogrammesUsing weight- or-height based on the WHOstandards or MUAC less than 115 mm asadmission criteria will select younger and lessseverely wasted bene ciaries compared tousing the NCHS re erence or weight- or-heightor MUAC less than 110 mm. These childrenselected by the new criteria will have a lowerrisk o death, and a lower weight gain ( 15 ). th
ow r y r d ow r w h
o h dr d by h w d rdhou d b k o ou wh mo orh v o h r p u d
pro r mm .
Planning therapeutic eeding programmes,interpretation o nutrition surveysThe percentage o children below -3 SD weight-
or-height derived rom nutrition surveys iscommonly used to estimate the potentialcaseload o therapeutic eeding programmes.
However, results based on cross-sectionalsurveys have certain limitations. First, thederived proportion o children 6–60 months oage with a weight- or-height below -3 SD and/ or bilateral pitting oedema always has a widecon dence interval. Second, cross-sectionalsurveys estimate prevalence, whereas orprogramming purpose estimates o incidence
or the number o new cases over a speci edtime period would be more suitable. Eventually,when MUAC is used as admission criterion,the proportion o children with a low weight-
or-height does not correspond well withthe proportion o children with low MUAC.Consequently there is o ten a mismatchbetween the case loads predicted by nutritionsurveys and those actually observed. to
mprov p , h r or v hh m r r r u d or m
o d r b u d or dm oo pro r mm . This means that in settings
where MUAC will be used as the admissioncriterion or therapeutic eeding, especially atthe community level, it is important to includeMUAC assessment in the nutritional prevalencesurveys. In addition, i possible, in all settings,in ormation on the prevalence o wastingor severe acute malnutrition using weight-
or-height rom nutrition surveys should becomplemented by observations o caseloadso ongoing programmes taking into accountthe programme coverage. In conclusion, r omm d d h w h - or-h h , MUac
d pr o b r o d m r d u r o urv y w h pr v m
b d r v d rom w h - or-h h .
Cost implications o the adoption othe WHO standards or therapeutic
eeding programmesth rodu o o h WHO h d row h
d rd d h r v o o h MUac u -o o d y saM h dr w r h
o d or h r p u d pro r mm ,how v r h m m h dur o o
r m w d r mor h drw b d d r r d v r
. i r umb r h o d humr our mp o d m y b d f u orodu r our -poor . How v r,
v b v d u h hw r pr mprov m ov r urrpr d u h dm o r r
hou d b r rd d pr or y o r h MDg1 d 4 .

8/7/2019 WHO Child growth standards idi SAM
http://slidepdf.com/reader/full/who-child-growth-standards-idi-sam 7/12
7
ANNex 1
W h - or-l h R r c rd (b ow 87 m)
Boys’ weight (kg) Length Girls’ weight (kg)
-4 SD -3 SD -2 SD -1 SD Médian (cm) Médian -1 SD -2 SD -3 SD -4 SD
1.7 1.9 2.0 2.2 2.4 45 2.5 2.3 2.1 1.9 1.7
1.8 2.0 2.2 2.4 2.6 46 2.6 2.4 2.2 2.0 1.92.0 2.1 2.3 2.5 2.8 47 2.8 2.6 2.4 2.2 2.0
2.1 2.3 2.5 2.7 2.9 48 3.0 2.7 2.5 2.3 2.1
2.2 2.4 2.6 2.9 3.1 49 3.2 2.9 2.6 2.4 2.2
2.4 2.6 2.8 3.0 3.3 50 3.4 3.1 2.8 2.6 2.4
2.5 2.7 3.0 3.2 3.5 51 3.6 3.3 3.0 2.8 2.5
2.7 2.9 3.2 3.5 3.8 52 3.8 3.5 3.2 2.9 2.7
2.9 3.1 3.4 3.7 4.0 53 4.0 3.7 3.4 3.1 2.8
3.1 3.3 3.6 3.9 4.3 54 4.3 3.9 3.6 3.3 3.0
3.3 3.6 3.8 4.2 4.5 55 4.5 4.2 3.8 3.5 3.2
3.5 3.8 4.1 4.4 4.8 56 4.8 4.4 4.0 3.7 3.43.7 4.0 4.3 4.7 5.1 57 5.1 4.6 4.3 3.9 3.6
3.9 4.3 4.6 5.0 5.4 58 5.4 4.9 4.5 4.1 3.8
4.1 4.5 4.8 5.3 5.7 59 5.6 5.1 4.7 4.3 3.9
4.3 4.7 5.1 5.5 6.0 60 5.9 5.4 4.9 4.5 4.1
4.5 4.9 5.3 5.8 6.3 61 6.1 5.6 5.1 4.7 4.3
4.7 5.1 5.6 6.0 6.5 62 6.4 5.8 5.3 4.9 4.5
4.9 5.3 5.8 6.2 6.8 63 6.6 6.0 5.5 5.1 4.7
5.1 5.5 6.0 6.5 7.0 64 6.9 6.3 5.7 5.3 4.8
5.3 5.7 6.2 6.7 7.3 65 7.1 6.5 5.9 5.5 5.0
5.5 5.9 6.4 6.9 7.5 66 7.3 6.7 6.1 5.6 5.15.6 6.1 6.6 7.1 7.7 67 7.5 6.9 6.3 5.8 5.3
5.8 6.3 6.8 7.3 8.0 68 7.7 7.1 6.5 6.0 5.5
6.0 6.5 7.0 7.6 8.2 69 8.0 7.3 6.7 6.1 5.6
6.1 6.6 7.2 7.8 8.4 70 8.2 7.5 6.9 6.3 5.8
6.3 6.8 7.4 8.0 8.6 71 8.4 7.7 7.0 6.5 5.9
6.4 7.0 7.6 8.2 8.9 72 8.6 7.8 7.2 6.6 6.0
6.6 7.2 7.7 8.4 9.1 73 8.8 8.0 7.4 6.8 6.2
6.7 7.3 7.9 8.6 9.3 74 9.0 8.2 7.5 6.9 6.3
6.9 7.5 8.1 8.8 9.5 75 9.1 8.4 7.7 7.1 6.5
7.0 7.6 8.3 8.9 9.7 76 9.3 8.5 7.8 7.2 6.67.2 7.8 8.4 9.1 9.9 77 9.5 8.7 8.0 7.4 6.7
7.3 7.9 8.6 9.3 10.1 78 9.7 8.9 8.2 7.5 6.9
7.4 8.1 8.7 9.5 10.3 79 9.9 9.1 8.3 7.7 7.0
7.6 8.2 8.9 9.6 10.4 80 10.1 9.2 8 .5 7.8 7.1
7.7 8.4 9.1 9.8 10.6 81 10.3 9.4 8.7 8.0 7.3
7.9 8.5 9.2 10.0 10.8 82 10.5 9.6 8.8 8.1 7.5
8.0 8.7 9.4 10.2 11.0 83 10.7 9.8 9.0 8.3 7.6
8.2 8.9 9.6 10.4 11.3 84 11.0 10.1 9.2 8.5 7.8
8.4 9.1 9.8 10.6 11.5 85 11.2 10.3 9.4 8.7 8.0
8.6 9.3 10.0 10.8 11.7 86 11.5 10.5 9.7 8.9 8.1

8/7/2019 WHO Child growth standards idi SAM
http://slidepdf.com/reader/full/who-child-growth-standards-idi-sam 8/12
8
W h - or-H h R r c rd (87 m d bov )
Boys’ weight (kg) Height Girls’ weight (kg)
-4 SD -3 SD -2 SD -1 SD Médian (cm) Médian -1 SD -2 SD -3 SD -4 SD
8.9 9.6 10.4 11.2 12.2 87 11.9 10.9 10.0 9.2 8.4
9.1 9.8 10.6 11.5 12.4 88 12.1 11.1 10.2 9.4 8.6
9.3 10.0 10.8 11.7 12.6 89 12.4 11.4 10.4 9.6 8.8
9.4 10.2 11.0 11.9 12.9 90 12.6 11.6 10.6 9.8 9.0
9.6 10.4 11.2 12.1 13.1 91 12.9 11.8 10.9 10.0 9.1
9.8 10.6 11.4 12.3 13.4 92 13.1 12.0 11.1 10.2 9.3
9.9 10.8 11.6 12.6 13.6 93 13.4 12.3 11.3 10.4 9.5
10.1 11.0 11.8 12.8 13.8 94 13.6 12.5 11.5 10.6 9.7
10.3 11.1 12.0 13.0 14.1 95 13.9 12.7 11.7 10.8 9.8
10.4 11.3 12.2 13.2 14.3 96 14.1 12.9 11.9 10.9 10.0
10.6 11.5 12.4 13.4 14.6 97 14.4 13.2 12.1 11.1 10.2
10.8 11.7 12.6 13.7 14.8 98 14.7 13.4 12.3 11.3 10.4
11.0 11.9 12.9 13.9 15.1 99 14.9 13.7 12.5 11.5 10.511.2 12.1 13.1 14.2 15.4 100 15.2 13.9 12.8 11.7 10.7
11.3 12.3 13.3 14.4 15.6 101 15.5 14.2 13.0 12.0 10.9
11.5 12.5 13.6 14.7 15.9 102 15.8 14.5 13.3 12.2 11.1
11.7 12.8 13.8 14.9 16.2 103 16.1 14.7 13.5 12.4 11.3
11.9 13.0 14.0 15.2 16.5 104 16.4 15.0 13.8 12.6 11.5
12.1 13.2 14.3 15.5 16.8 105 16.8 15.3 14.0 12.9 11.8
12.3 13.4 14.5 15.8 17.2 106 17.1 15.6 14.3 13.1 12.0
12.5 13.7 14.8 16.1 17.5 107 17.5 15.9 14.6 13.4 12.2
12.7 13.9 15.1 16.4 17.8 108 17.8 16.3 14.9 13.7 12.4
12.9 14.1 15.3 16.7 18.2 109 18.2 16.6 15.2 13.9 12.713.2 14.4 15.6 17.0 18.5 110 18.6 17.0 15.5 14.2 12.9
13.4 14.6 15.9 17.3 18.9 111 19.0 17.3 15.8 14.5 13.2
13.6 14.9 16.2 17.6 19.2 112 19.4 17.7 16.2 14.8 13.5
13.8 15.2 16.5 18.0 19.6 113 19.8 18.0 16.5 15.1 13.7
14.1 15.4 16.8 18.3 20.0 114 20.2 18.4 16.8 15.4 14.0
14.3 15.7 17.1 18.6 20.4 115 20.7 18.8 17.2 15.7 14.3
14.6 16.0 17.4 19.0 20.8 116 21.1 19.2 17.5 16.0 14.5
14.8 16.2 17.7 19.3 21.2 117 21.5 19.6 17.8 16.3 14.8
15.0 16.5 18.0 19.7 21.6 118 22.0 19.9 18.2 16.6 15.1
15.3 16.8 18.3 20.0 22.0 119 22.4 20.3 18.5 16.9 15.415.5 17.1 18.6 20.4 22.4 120 22.8 20.7 18.9 17.3 15.6
8/7/2019 WHO Child growth standards idi SAM
http://slidepdf.com/reader/full/who-child-growth-standards-idi-sam 9/12
9
ANNex 2
gu d b o d y r w h
Guidance table to identi y the target weight
Weight on Target weight:admission* 15% weight gain
4.1 4.7
4.3 4.9
4.5 5.2
4.7 5.4
4.9 5.6
5.1 5.9
5.3 6.1
5.5 6.3
5.7 6.6
5.9 6.8
6.1 7.0
6.3 7.2
6.5 7.5
6.7 7.7
6.9 7.9
7.1 8.2
7.3 8.4
7.5 8.6
7.7 8.9
7.9 9.1
8.1 9.3
8.3 9.5
8.5 9.8
8.7 10.0
8.9 10.2
9.1 10.5
9.3 10.7
9.5 10.9
9.7 11.2
9.9 11.4
10.1 11.6
10.3 11.8
10.5 12.1
* Or w ight, fr of o d ma.
Guidance table to identi y the target weight
Weight on Target weight:admission* 15% weight gain
10.7 12.3
10.9 12.5
11.1 12.8
11.3 13.0
11.5 13.2
11.7 13.5
11.9 13.7
12.1 13.9
12.3 14.1
12.5 14.4
12.7 14.6
12.9 14.8
13.1 15.1
13.3 15.3
13.5 15.5
13.7 15.8
13.9 16.0
14.1 16.2
14.3 16.4
14.5 16.7
14.7 16.9
14.9 17.1
15.1 17.4
15.3 17.6
15.5 17.8
15.7 18.1
15.9 18.3
16.1 18.5
16.3 18.7
16.5 19.0
16.7 19.2
16.9 19.4
17.1 19.7
* Or w ight, fr of o d ma.

8/7/2019 WHO Child growth standards idi SAM
http://slidepdf.com/reader/full/who-child-growth-standards-idi-sam 10/12
10
ANNex 3
Or d d v opm o h jo m
A ter the publication o the WHO growthstandards or weight and height in 2006WHO, UNICEF, WFP and SCN agreed in a jointstatement (available at: http://www.who.int/ child_adolescent_health/documents/pd s/ severe_acute_malnutrition_en.pd ) to keepthe same cut-o o -3 z-scores or de nitiono severe acute malnutrition (SAM) based onweight- or-height. When this document wasdra ted, however, WHO standards or mid-upperarm circum erence (MUAC) were not availableand a cut-o o 110 mm was mentioned. Thepublication o WHO MUAC standards in April2007 showed that the current MUAC cut-owas too low. A WHO working group involvingall WHO sta involved in the management oSAM (André Briend CAH, Zita Weise Prinzoand Chantal Gégout NHD) with input o thoseinvolved in the development o WHO standards(Mercedes de Onis, Monika Bloessner, AdelheidOnyango, NHD) then dra ted a discussion papersuggesting a new cut-o o 115 mm or de ningSAM with MUAC. This paper was reviewedby Flora Sibanda Mulder and Tanya Khara,UNICEF New York, Bruce Cogill o the GlobalNutrition Cluster and Claudine Prudhon, o theUN Standing Committee on Nutrition. Thispaper was then presented at an IASC NutritionCluster In ormal Consultation held in Genevain 2008 (June 25–27). The meeting report(available at: http://www.humanitarianre orm.org/humanitarianre orm/Portals/1/cluster%20approach%20page/clusters%20pages/Nutrition/ WHO%20growth%20standards%20meeting%20report%20FINAL.pd ) endorsed the increaseo the MUAC cut-o up to 115 mm andrecommended that UN agencies release a jointstatement to give guidance on the transition
to WHO standards in the treatment o acutemalnutrition. This WHO UNICEF joint statement,written by WHO and UNICEF sta , based onthe WHO discussion paper, is a ollow up othe IASC Cluster meeting. Participants o theIASC Nutrition Cluster meeting did not sign adeclaration o interest. They all came rom UNagencies, academic institutions, governmentaland non governmental agencies. The list oparticipants is available in the meeting report.
The dra t joint statement also mentions thepossible use o percentage weight gain asdischarge criteria rom therapeutic eedingprograms. Agencies using MUAC as admission
criteria reported di culties in applyingdischarge criteria based on a weight- or-heightas some children ul lled discharge criteria onadmission. The present recommendation avoidsthis problem, and di ers little rom currentpractice or most children.
All these authors and reviewers involved inwriting and reviewing this Joint statement areUN sta and are submitted to UN general rulesin terms o confict o interest.
The use o the WHO growth standards orthe identi cation o severe acute malnutritionin children 6 to 60 months o age willremain a WHO policy or the oreseeable
uture. Discharge criteria mentioned in thisstatement may need some adjustment lateron as management o malnutrition evolves.It is anticipated, however, that this statementwill remain valid until 2012 at least. TheDepartments o Child and Adolescent Healthand Nutrition or Health and Development willbe responsible or initiating a review o thisdocument at that time, i needed.

8/7/2019 WHO Child growth standards idi SAM
http://slidepdf.com/reader/full/who-child-growth-standards-idi-sam 11/12
11
R r1 WHO Multicentre Growth Re erence Study
Group: WHO Child Growth Standards: Length/ height- or-age, weight- or-age, weight- or-length,weight- or-height and body mass index- or-age:Methods and development. Geneva, World HealthOrganization, 2006. Available at: http://www.who.
int/childgrowth/standards/technical_report/en/ index.html
2 WHO. Child growth standards. Arm circum erenceor age. Available at: http://www.who.int/
childgrowth/standards/ac_ or_age/en/index.html
3 UN Standing Committee on Nutrition. SCNEndorses the New WHO Growth Standards orIn ants and Young Children. Available at: http:// www.who.int/childgrowth/endorsement_scn.pd
4 International Union o Nutrition Sciences.Statement o Endorsement o the WHO ChildGrowth Standards. 2006. Available at: http://www.
who.int/childgrowth/endorsement_ IUNS.pd5 International Pediatric Association Endorsement.
The New WHO Growth Standards or In ants andYoung Children. 2006. Available at: http://www.who.int/childgrowth/Endorsement_IPA.pd
6 World Health Organization. Management of severe malnutrition: a manual for physicians and other senior health workers . Geneva, 1999.Available at: http://www.who.int/nutrition/ publications/en/manage_severe_malnutrition_eng.pd
7 WHO, UNICEF, and SCN in ormal consultation
on community-based management o severemalnutrition in children. SCN Nutrition PolicyPaper No. 21. 2006. Available at: http://www.who.int/child_adolescent_health/documents/pd s/
nb_v27n3_suppl.pd
8 WHO/UNICEF/WFP/SCN Joint statement.Community-based management of severe acute malnutrition . Geneva, New York, Rome,2007. Available at: http://www.who.int/child_adolescent_health/documents/pd s/severe_acute_malnutrition_en.pd
9 Black RE, Allen LH, Bhutta ZA, Caul eld LE, deOnis M, Ezzati M, Mathers C, Rivera J; Maternaland Child Undernutrition Study Group. Maternaland child undernutrition: global and regionalexposures and health consequences. Lancet ,2008, 371:243–60.
10 Myatt M, Khara T, Collins S. A review o methodsto detect cases o severely malnourished childrenin the community or their admission intocommunity-based therapeutic care programs.Food Nutr Bull , 2006, 27(3 Suppl):S7–23.
11 Patel MP, Sandige HL, Ndekha MJ, Briend A,Ashorn P, Manary MJ. Supplemental eedingwith ready-to-use therapeutic ood in Malawianchildren at risk o malnutrition. J Health Popul Nutr , 2005, 23:351–7.
12 de Onis M, Onyango AW, Borghi E, GarzaC, Yang H or the WHO Multicentre Growth
Re erence Study Group. Comparison o theWorld Health Organization (WHO) Child GrowthStandards and the National Center or HealthStatistics/WHO international growth re erence:implications or child health programmes. Public Health Nutrition , 2006, 9:942–7.
13 Seal A, Kerac M. Operational implications ousing 2006 World Health Organization growthstandards in nutrition programmes: secondarydata analysis. BMJ , 2007, 334:733:705–6.
14 Myatt M, Du eld A. Weight- or-height andMUAC or estimating the prevalence o acutemalnutrition. SCN Cluster meeting backgroundpaper. Geneva, 22nd October 2007.
15 Isanaka S, Villamor E, Shepherd S, Grais RF.Assessing the impact o the introduction o theWorld Health Organization growth standardsand weight- or-height z-score criterion onthe response to treatment o severe acutemalnutrition in children: secondary data analysis.Pediatrics , 2009, 123:e54–9.

8/7/2019 WHO Child growth standards idi SAM
http://slidepdf.com/reader/full/who-child-growth-standards-idi-sam 12/12
ISBN 978 92 4 159816 3 (NLM classification: WS 103)
© World Health Organization and UNICEF 2009All rights reserved. Publications of the World Health Organization can be obtained from WHO Press, World HealthOrganization, 20 Avenue Appia, 1211 Geneva 27, Switzerland (tel: +41 22 791 3264; fax: +41 22 791 4857; email:[email protected]).
The World Health Organization and UNICEF welcome requests for permission to reproduce or translate theirpublications — whether for sale or for noncommercial distribution. Applications and enquiries should be addressed to
WHO, Office of Publications, at the above address (fax: +41 22 791 4806; email: [email protected]) or to UNICEF(email: [email protected] ).