Embed Size (px)
Citation preview

C o m m u n i t y H e a l t H n e e d s a s s e s s m e n t 2 0 1 6
Whitesburg ARH Hospital

cedik.ca.uky.edu
This Community Health Needs Assessment (CHNA) Implementation Strategy was
prepared for Appalachian Regional Healthcare by the Community and Economic
Development Initiative of Kentucky (CEDIK) at the University of Kentucky.
CEDIK works with stakeholders to build engaged communities and vibrant economies.
If you have questions about the assessment process, contact CEDIK:
Dr. Alison Davis, CEDIK Executive Director
(859) 257-7260
Marisa Aull, CEDIK CHNA Coordinator
(859) 218-4385
Whitesburg ARH Hospital CHNA
1

Dear ARH Service Area Resident,
Sincerely,
Joseph L. Grossman
ARH President and CEO
Thank you for your interest in the 2015-2016 ARH Community Health Needs
Assessment (CHNA). The data reflected in this report was collected from surveys
and focus groups conducted in your local ARH community. These results are being
reported along with an update about how we utilized the results from our previous
needs assessment from three years ago.
The unique design of this CHNA permits an examination of the diverse aspects of
each of our 11 ARH communities. The assessment results from each ARH facility
demonstrate the desire for individual and community health improvement. These
results provide valuable information that will be used for planning purposes, service
improvements and community outreach.
Special thanks to the CHNA Community Steering Committees in each of our 11
communities for giving of their valuable time and guiding this community health needs
assessment process. It is our hope that this assessment will help ARH, in partnership
with our communities, to identify respective health concerns, measure the impact of
current public health efforts and guide the appropriate use of local resources. We
also hope that together, we can improve the health and well-being of the residents of
Eastern Kentucky and Southern West Virginia.
Whitesburg ARH Hospital CHNA
2

ARH - Our HistoryIn 1956, the United Mine Workers of America (UMWA) and thousands of citizens
in the coal communities dedicated the Miners Memorial Hospital Association’s
(MMHA) facilities. The system’s hospitals were located in Harlan, Hazard, McDowell,
Middlesboro, Whitesburg, Pikeville and South Williamson, Kentucky; Man and Beckley
West Virginia; and Wise, Virginia. By the early 1960s, MMHA announced its intention
to close some of the hospitals and soon after the Board of National Missions formed
a new and independent not-for-profit health system Appalachian Regional Hospitals
(ARH)--that purchased the Miners Memorial Hospitals. The health system changed its
name in 1986 to Appalachian Regional Healthcare to more accurately describe its far-
ranging activities.
Today we operate hospitals in Barbourville, Harlan, Hazard, Hyden, McDowell,
Middlesboro, Morgan County, South Williamson and Whitesburg, Kentucky, and
Beckley and Summers County, West Virginia. ARH has always responded to the
changing demands of rural healthcare. Over the years, we have built and acquired
new facilities as well as invested in new technology and medical capabilities.
MissionTo improve health and promote well-being of all the people in Central Appalachia in
partnership with our communities.
VisionTo earn the confidence and trust of the diverse communities we serve by offering
healthcare excellence, delivered with compassion in a timely manner.
ValuesExcellence, Compassion, Safety, Teamwork, Inclusion, Professionalism
Whitesburg ARH Hospital CHNA
3

Appalachian Regional Healthcare contracted with the Community and Economic
Development Initiative of Kentucky (CEDIK) in the fall of 2015 to conduct a Community
Health Needs Assessment (CHNA) in accordance with the Affordable Care Act (ACA).
The Affordable Care Act (ACA), enacted March 23, 2010, added new requirements
that hospital organizations must satisfy in order to be described in section 501(c)(3),
as well as new reporting and excise taxes.
The IRS requires hospital organizations to complete a CHNA and adopt an
implementation strategy at least once every three years. This CHNA was the second
prepared by CEDIK for this organization; the first was completed in 2013.
Here is an overview of the CHNA process that CEDIK uses based on the IRS
guidelines:
CHNA Background
Whitesburg ARH Hospital CHNA
4

Since the 2013 Community Health Needs Assessment, we have taken these opportunities
to fulfill our promise to the community:
Monthly Diabetes Support Group; Smoking Cessation Class; Stroke Awareness presentations with Stroke Scale Screening; Heart Healthy Fair to celebrate National Heart Month; Colon Cancer Awareness Event; Letcher County Senior Citizens Program Speakers; Elementary School Fitness Fairs
Increase Number of Specialty Physicians
PRI
ORIT
Y #2
PRI
ORIT
Y #1
PRI
ORIT
Y #3
PRI
ORIT
Y #4
Extended Hours for Clinics
Education and Prevention Programs
Cooperation with Health Care Facilities and Physicians in the Community
Joint education offerings with Mountain Comprehensive Health Corporation(MCHC) and the Letcher County Health Department.
Collaboration with MCHC in community activities.
ARH Cardiology Associates is now located inside the MCHC Whitesburg Clinic.
Evening hours at Whitesburg ARH Clinic and Jenkins ARH Family Care Center
Wednesday evenings, Saturday and Sunday clinic at MCHC
Whitesburg ARH joined with MCHC on the opening Sunday of the extended hours, offering a lunch and colon cancer awareness information.
Orthopedic physician available weekly
Cardiologist available daily
Visiting services on-site for Oncologist, Dermatology, Nephrologist and Ophthalmic Surgery
“We are beyond excited that our Community Health Needs results identified collaboration with other health care facilities and preventive health education as a part of the key priorities.
The future success of our communities’ health, and success in health care as a whole, will depend on a close partnership with health care agencies and offering preventive services.”
- Dena C. Sparkman, Whitesburg ARH Community CEO
www.arh.org/whitesburg

Table of Contents
1. Portrait of Community Served by the Hospital 9
2. The Assessment Process 10
10 3. Secondary Data Exploration:
Community, Economic & Health Profiles
4. Hospital Utilization Data 13
The Community Steering Committee 16
6. Community Feedback 17
7. Survey Results 18
8. Prioritization of Identified Health Needs 20
9. Implementation Strategy 21
10. Next Steps 23
11. Appendix 24
*Secondary Data Sources
*Survey Template
12. Approval 33
Whitesburg ARH Hospital CHNA
6
5.

IntroductionAppalachian Regional Healthcare (ARH) is a not-for-profit health system serving
350,000 residents across Eastern Kentucky and Southern West Virginia. Operating
eleven hospitals, multi-specialty physician practices, home health agencies,
HomeCare Stores and retail pharmacies, ARH is the largest provider of care and
single largest employer in southeastern Kentucky and the third largest private
employer in southern West Virginia.
The ARH system employs nearly 5,000 employees and has a network of more than
600 active and courtesy medical staff members representing various specialties.
Consistently recognized for its medical excellence, the ARH system is one of two
Kentucky health systems to be named to the 2012 IMS Top 100 Integrated Healthcare
Networks list of the most highly integrated healthcare networks in the nation, and
was selected as the 2010 Outstanding Rural Health Organization in the nation by the
National Rural Health Association (NRHA).
Whitesburg ARH HospitalWhitesburg ARH Hospital is a 90 bed acute care hospital serving the Letcher
County region. The hospital enjoys the reputation of achieving excellence as a
patient oriented and community centered hospital that is Joint Commission
Accredited.
Whitesburg ARH Hospital CHNA
7

• Clinics
• Aquatic Therapy
• Cancer Care
• Dialysis
• Ear, Nose and Throat
• Emergency
• Heart Care
• Home Health
• HomeCare Stores
• Imaging
• MRI
• Nuclear Medicine
• Obstetrics and Gynecology
• Occupational Therapy
• Orthopedics
• PET Scan
• Pharmacy
• Physical Therapy
• Rehabilitation Therapy
• Sleep Lab
• Speech Language - Pathology
• Surgery
• Swing Beds
• Urology
Whitesburg ARH Services
Whitesburg ARH Hospital CHNA
8

Whitesburg ARH Hospital is located in
the county seat Whitesburg, Letcher
County, Kentucky. Whitesburg hosts a
population of just over 2,100 while the
county is home to 24,500 people.
Letcher County students are served by
two public school districts.
Whitesburg is home to Appalshop, an
arts and education center founded in
1969. Mountain Heritage Festival is
held each year in September welcoming
over 10,000 visitors. Jefferson National
Forest is found in Letcher County.
A Portrait of the Community Served by Whitesburg ARH
Map created with Google Maps, 2016
Whitesburg ARH Hospital CHNA
9

Assessment ProcessThe assessment process included collecting secondary data related to the health
of the community. Social and economic data as well as health outcomes data were
collected from secondary sources to help provide context for the community (see
below). In addition, CEDIK compiled hospital utilization data to better understand
who was using the facility and for what services (next section). Finally, with the
assistance of the Community Steering Committee, input from the community was
collected through focus group discussions and surveys (see appendix for summary).
First we present the demographic, social, economic and health outcomes data that
were compiled through secondary sources. These data that follow were retrieved from
County Health Rankings, April 2013. For data sources see appendix.
Demographics
Indicator (2013)LetcherCounty Kentucky
National Level
Total Population 23,619 4,395,295 311,536,594
Percent of Population under 18 years 21.7% 23.1% 23.7%
Percent of Population 65 year and older 15.9% 14.4% 13.4%
Percent of Population Non-Hispanic White 97.9% 85.6% 74.0%
Percent of Population Non-Hispanic African American 0.5% 8.0% 12.6%
Percent of Population Hispanic 0.7% 3.3% 16.6%
Percent of Population other Race 0.4% 1.7% 5.9%
Percent of the Population not Proficient in English* 0.0% 1.0% n/a
Percent of the Population that are Female 50.6% 50.8% 50.8%
Percent of the Population that are Rural** 100.0% 41.6% n/a*2007-2011 5 year estimate**2010 Estimate
Whitesburg ARH Hospital CHNA
10

Social and Economic Factors
IndicatorLetcherCounty Kentucky
National Benchmark*
Median Household Income $31,799 $43,307 $52,250
High School Graduation Rate 92 86 81
Percent of Population with Some College Education 50.0% 58.1% n/a
Unemployment Rate 17.3% 8.3% 7.4%
Percent of Children in Poverty 34.4% 25.5% 22.2%
Percent of Children Eligible for Free Lunch 56.1% 46.7% 48.1%
Percent of Children Living in a Single Parent Household 27.4% 34.3% n/a
Percent of Adults without Adequate Social Support 23.3% 19.9% n/aPercent of the Population Spending More
Than 30% of Income on Housing Costs 17.1% 28.0% n/a
Violent Crime Rate (per 100,000 population) 48 235 404.5
Health Behaviors
IndicatorLetcherCounty Kentucky
National Benchmark*
Percent of Adults who Smoke Regularly 28.4% 25.6% 19.3%
Percent of Adults who are Obese (BMI>=30) 37.9% 32.1% 27.4%Percent of Adults who are
Physically Inactive During Leisure Time 37.7% 29.1% 25.4%Percent of Adults who Drink Excessively
(Heavy or Binge) 6.9% 11.8% n/a
Motor Vehicle Crash Deaths (per 100,000 population) 31 18 n/a
STDs: Chlamydia Rate (per 100,000 population) 104 394 456.1
Teen Birth Rate (per 1,000 females ages 15-19) 64 48 26.5*National Benchmarks indicate the 90th percentile at the national level. “N/a” denotes where national benchmarks where not made available by County Health Rankings.
Whitesburg ARH Hospital CHNA
11

Health Outcomes
IndicatorLetcherCounty Kentucky
National Benchmark*
Premature Death (Years of Potential Life Lost per 100,000 population) 12,763 8,900 n/a
Percent of Adults Reporting Poor or Fair Health 29.9% 21.1% 15.9%
Average Poor Physical Health Days in Past 30 Days 6.3 4.8 3.6
Average Poor Mental Health Days in Past 30 Days 5.3 4.3 3.5Percent of Babies Born with Low Birthweight (<2500
grams) 10.7% 9.1% 8.0%
Percent of Adults with Diabetes 17.6% 11.8% 20.6%
HIV Prevalence Rate (per 100,000 population) 67 145 447.8
Premature Age-Adjusted Mortality 628.0 446.1 n/a
Child Mortality (per 100,000 population) 60.5 61.3 n/a
Infant Mortality (per 100,000 population) n/a 6.9 n/a
Access to Care
IndicatorLetcher County Kentucky
Percent Uninsured (< age 65 without health insurance) 17.5% 16.2%
Percent of Uninsured Adults 21.4% 20.2%
Percent of Uninsured Children 6.4% 6.0%
Ratio of Population to Primary Care Physicians 1597:1 1551:1
Ratio of Population to Dentists 3374:1 1683:1
Ratio of Population to Mental Health Providers 1389:1 621:1Percent of Adults Reporting that They Could Not See a Doctor Due to Cost 22.9% 16.9%
Rate of Preventable Hospital Stays (per 1,000 Medicare Enrollees) 202 94
Percent of Diabetics that Receive HbA1c Screening 81.8% 85.2%
Percent of Women Receiving Mammography Screening 53.6% 60.1%
12

Table: Hospital Inpatient Discharges, 1/1/14-12/31/14
City of Origin DischargesTotal
ChargesAverage Charges
Whitesburg, KY 985 $19,063,244.16 $19,353.55
Jenkins, KY 272 $5,028,165.93 $18,485.90
Neon, KY 171 $3,286,523.48 $19,219.44
Isom, KY 166 $3,353,742.23 $20,203.27
Cumberland, KY 118 $1,705,245.76 $14,451.24
Hazard, KY 117 $985,100.05 $8,419.66
Ermine, KY 115 $1,991,804.63 $17,320.04
Jeremiah, KY 114 $2,315,869.43 $20,314.64
Mayking, KY 97 $1,805,957.52 $18,618.12
Blackey, KY 95 $1,776,186.88 $18,696.70
Cornettsville, KY 87 $1,806,426.71 $20,763.53
Eolia, KY 81 $1,447,831.70 $17,874.47
Jackhorn, KY 77 $1,759,008.43 $22,844.27
Thornton, KY 72 $1,397,403.07 $19,408.38
Mc Roberts, KY 63 $1,191,252.83 $18,908.78
Premium, KY 61 $1,344,078.15 $22,034.07
The Tables below provide an overview of Whitesburg ARH Hospital’s patients and in
particular where they come from, how they pay, and why they visited.
Hospital Utilization Data
Whitesburg ARH Hospital CHNA
13

Table: Hospital Inpatient Payer Mix, 1/1/14-12/31/14
Payer DischargesTotal
ChargesAverage Charges
Medicare (Excluding Medicare Managed Care) 1,375 $31,555,807.12 $22,949.68
WellCare of Kentucky Medicaid Managed Care 1,153 $14,158,360.77 $12,279.58
Blue Cross Blue Shield 296 $3,396,120.36 $11,473.38
Medicare Managed Care 275 $6,070,445.33 $22,074.35
In State Medicaid 115 $1,198,970.83 $10,425.83
Commercial - PPO 98 $1,407,420.66 $14,361.44
Black Lung 85 $2,373,577.68 $27,924.44
Other Self Administered Plan 85 $835,344.36 $9,827.58Coventry Cares of KY Medicaid Managed
Care 75 $942,044.18 $12,560.59
Commercial - Other 74 $798,099.69 $10,785.13
Self Pay 66 $1,039,286.12 $15,746.76
Table: Hospital Outpatient Discharges, 1/1/14-12/31/14
City of Origin DischargesTotal
ChargesAverage Charges
Letcher, KY 23,848 $56,580,328.48 $2,372.54
Knott, KY 2,343 $5,711,452.05 $2,437.67
Perry, KY 1,871 $5,243,839.01 $2,802.69
Harlan, KY 1,214 $3,256,972.54 $2,682.84
Pike, KY 926 $2,123,024.77 $2,292.68
Wise, VA 231 $432,330.12 $1,871.56
Leslie, KY 118 $363,070.27 $3,076.87
Floyd, KY 106 $264,554.87 $2,495.80
Dickenson, VA 63 $132,643.42 $2,105.45
Breathitt, KY 56 $154,984.51 $2,767.58
Whitesburg ARH Hospital CHNA
14

Table: Hospital Inpatient Diagnosis Related Group, 1/1/14-12/31/14DRG Description
(Top 10 for inpatient visits) DischargesTotal
ChargesAverage Charges
Medicine - Pulmonary 1,040 $26,108,939.73 $25,104.75
Medicine - General 758 $12,830,961.92 $16,927.39
Obstetrics Del 469 $4,263,809.99 $9,091.28
Medicine - Cardiovascular Disease 422 $7,998,145.03 $18,952.95
Normal Newborns 290 $779,925.10 $2,689.40
Neonatology 204 $716,233.20 $3,510.95
Medicine - Nephrology/Urology 175 $2,967,801.87 $16,958.87
Surgery - General 160 $4,920,131.02 $30,750.82
Medicine - Neuro Sciences 122 $2,519,039.39 $20,647.86
Surgery - Gynecology 58 $1,013,822.56 $17,479.70
Table: Hospital Outpatient Payer Mix, 1/1/14-12/31/14
Payer DischargesTotal
ChargesAverage Charges
WellCare of Kentucky Medicaid Managed Care 10,094 $22,881,553.64 $2,266.85
Medicare (Excluding Medicare Managed Care) 9,720 $25,671,835.25 $2,641.14
Blue Cross Blue Shield 3,081 $7,032,834.13 $2,282.65
Commercial - Other 2,555 $5,480,364.18 $2,144.96
Commercial - PPO 1,353 $3,108,120.39 $2,297.21
Self Pay 1,001 $2,170,746.47 $2,168.58
Coventry Cares of KY Medicaid Managed Care 632 $1,161,525.25 $1,837.86
In State Medicaid 543 $1,448,978.23 $2,668.47
BCBS Medicaid Managed Care 475 $1,204,789.25 $2,536.40
Humana Medicaid Managed Care 426 $1,161,276.75 $2,726.00
Workers Compensation 331 $847,090.51 $2,559.19
Whitesburg ARH Hospital CHNA
15

The Community Steering CommitteeThe Community Steering Committee is a vital part to the CHNA process.
These individuals represent organizations and agencies from the service area and in
particular, the individuals who were willing to volunteer enabled the hospital to get input
from populations that were often not engaged in conversations about their health needs.
CEDIK provided a list of potential agencies and organizations that would facilitate broad
input.
The Community Steering Committee met twice as a group and each time a hospital
representative welcomed and thanked the individuals for assisting in the process and
then excused themselves if focus group discussion was being conducted. CEDIK
asked that hospital representatives not be present during any focus group discussions
or debriefing with the Community Steering Committee.
Whitesburg ARH Hospital Community Steering Committee
Name Organization
Trenda Kincer Senior Citizens Director
Drenda Cornett Letcher Co Board of Education
Tyrone Fields City Police Chief/Lives in Housing Authority
Billy Tilly Director, Neon Fire and Rescue
Brenda Depriest Letcher County Chamber of Commerce
Scotty Caudill Social Worker/ Admission Director at Letcher Manor
Roy Crawford Business Owner/Letcher Co. Education Foundation
Matthew Combs Director, Letcher County Health Department
Leanna Mullins Retired, Family Services
Beth Halcomb Employee Family Services
Bill Frazier Mountain Shrine Club
Whitesburg ARH Hospital CHNA
16

Four focus groups were conducted throughout the communities that Whitesburg ARH
serves. These groups were conducted as separate meetings or in conjunction with
other meetings. The senior and under-served population were targeted as participants
to ensure everyone had an opportunity to voice their opinions. Below is a list of ideas
discussed within the groups.
Healthcare Suggestions for Whitesburg ARH Hospital• Mobile Clinic for entire county
• Additional staff because the wait time for doctors is too long
• Move smoking section away from the front of the hospital
• Increased access to:
Psychiatry/Psychologist/Mental health
Endocrinologist
Cancer Center
Dermatologist
Drug treatment
Orthopedics
Optometrist
Bariatric services
Dental
Neurology
After-hours for laboratory, pharmacy, non-emergency care/urgent treatment
Outreach suggestions for Whitesburg ARH Hospital• Community health fairs with basic testing available
• Increase marketing and public relations to improve perception
• Increase social media presence to promote programs and services
• Educational Programs
Support group for dementia and Alzheimer’s caregivers as well as loss of a child
Diabetes
Nutrition and Exercise
Parenting
Drug Prevention including support for the family and caregivers
Smoking Cessation
Suicide Prevention
Stress Management
Caregiver roles and support
Community Feedback
Whitesburg ARH Hospital CHNA
17

Whitesburg ARH HospitalWinter 2015 Survey Results
Respondents surveyed by hospital for their CHNA.
246
Households that used the services of a hospital in the past 24 months.
Households with someone receiving treatment for:
Households that delayed health care due to lack of money and/or insurance.
Households that are currently without health insurance.
Household eligibility:
Respondents that have a family doctor.
Respondents that regularly visit a physician for a check-up.
Medicare 23%
Medicaid 10%
Public Housing Assistance 0%
SNAP (Food Stamp Program) 3%
Average respondent rating of the overall health of their community.Scale: 1=poor to 5=excellent
3.51How can Whitesburg ARH better meet the community’s health needs?After-hours clinic, mental illness treatment, educational programs on diabetes, nutrition, drug abuse, elderly, exercise facility, mobile office
What other healthcare services should be provided in your community?Healthy diet choices, mental health, drug abuse program and treatment, home care for elderly, specialists, dental care, cancer care, grief counseling, hospice care, stress management
Whitesburg ARH Hospital CHNA
18
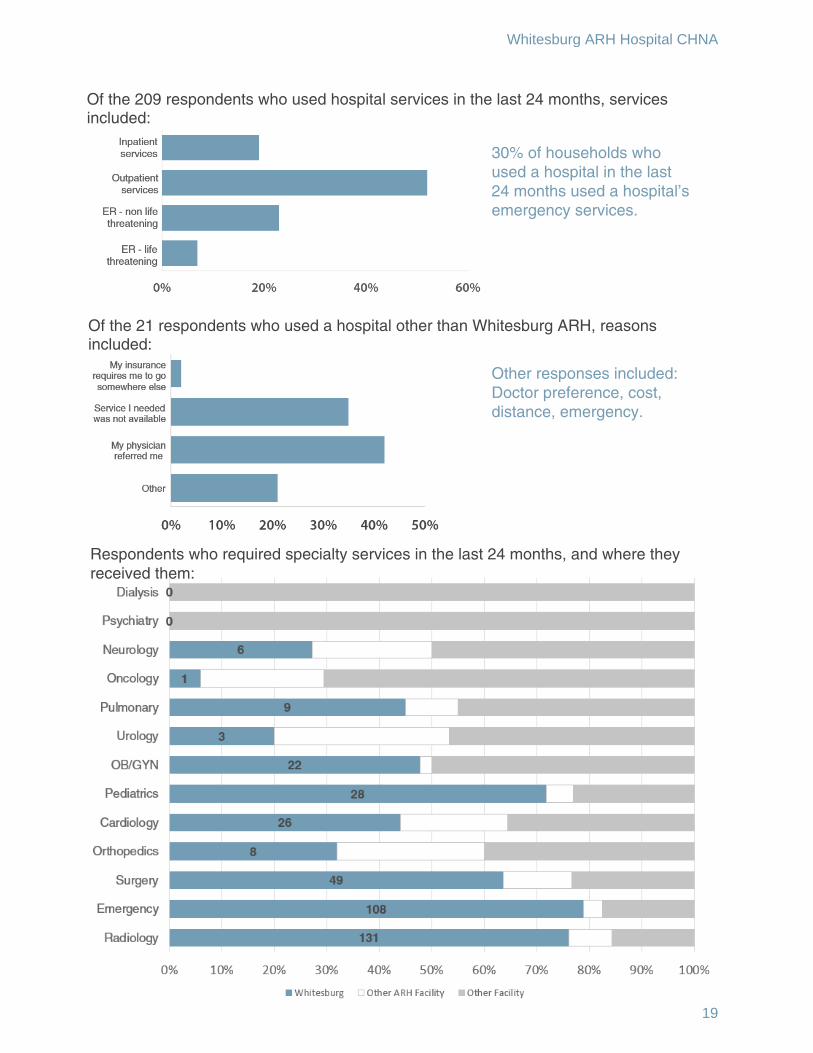
Respondents who required specialty services in the last 24 months, and where they received them:
Other responses included:Doctor preference, cost, distance, emergency.
30% of households who used a hospital in the last 24 months used a hospital’s emergency services.
Of the 209 respondents who used hospital services in the last 24 months, services included:
Of the 21 respondents who used a hospital other than Whitesburg ARH, reasons included:
Whitesburg ARH Hospital CHNA
19

Prioritization of Identified Health NeedsTo facilitate prioritization of identified health needs, a ranking process was used.
Health needs were ranked based on five factors:
1) The ability of Appalachian Regional Healthcare to evaluate and measure
outcomes.
2) The number of people affected by the issue or size of the issue.
3) The consequences of not addressing this problem.
4) Prevalence of common themes.
5) The existence of hospital programs which respond to the identified need.
Health needs were then prioritized taking into account their overall ranking, the degree
to which Appalachian Regional Healthcare can influence long-term change, and the
impact of the identified health needs on overall health.
Appalachian Regional Healthcare convened as a system and within each individual
facility to develop the implementation strategy after priorities were discussed.
Appalachian Regional Healthcare will continue to work with the community to execute
the implementation plan and realize the goals that have been positioned to build a
healthier community – a healthier Kentucky and West Virginia.
Whitesburg ARH Hospital CHNA
20

Implementation Strategy
Smoking Cessation
Goal: Decrease smoking in the community.
• Provide a Smoking Cessation Program for the community.
• Have an employee who is trained in the Cooper Clayton Program.
Social Media Presence
Goal: Expand social media as a part of our marketing and public relations plan.
• Daily Facebook update on activities, services and healthcare.
Nutrition and Exercise
Goal: Provide community programs, special events, health fairs.
• Plan educational programs for the community that focus on diet and exercise.
• Designate a special section in the Gift Shop of Healthy Snack Choices.
Community Partners: Letcher County Health Department, MCHC, UK Extension Office
Whitesburg ARH Hospital CHNA
21

Implementation Strategy, continuedExplanation of priorities that will not be addressed at this time
• Diabetes care is currently offered at the hospital.
• Parenting classes and support is handled through the Cabinet for Families and
Children.
• Drug Prevention Programs for family with drug abuse in homes is supported by
KRCC. AA is active in the community as well.
• Psychiatry, psychology, mental health and suicide prevention is supported by
KRCC.
• Stress Management is beyond our current resources but other community agencies
and organizations provide information and programs on this issue.
• Caring for family members is already strongly supported and advocated for on a
daily basis.
• Support Groups for Families for Alzheimer’s and Coronary Disease have been
offered in the past.
• After-hours access for labs, pharmacy non-emergent care/urgent care treatment
already exist through Whitesburg ARH and MCHC.
• Endocrinologist is only available through referral.
• Cancer Center is available at this time.
• A Dermatologist is available in Hazard and within a reasonable drive.
• Drug Treatment is supported through KRCC, AA and the Drug Court program.
• Orthopedics, optometrist and dental services are currently available and out of the
scope of the services we can offer.
• Bariatric Services and Neurology are referred out to another facility within
reasonable driving distance.
• Mobile Clinic is financially unfeasible at this time.
• Whitesburg ARH Campus is smoke-free and does not provide a smoking section.
Whitesburg ARH Hospital CHNA
22

Next StepsThis Implementation Strategy will be rolled out over the next three years, from Fiscal
Year 2016 through the end of Fiscal Year 2018.
Appalachian Regional Healthcare will kick off the Implementation Strategy by initiating
collaborative efforts with community leaders to address each health priority identified
through the assessment process.
Periodic evaluation of goals/objectives for each identified priority will be conducted to
assure that we are on track to complete our plan as described.
At the end of Fiscal Year 2018, Appalachian Regional Healthcare will review the
Implementation Strategy and report on the success experienced through the
collaborative efforts of improving the health of the community.
Whitesburg ARH Hospital CHNA
23

Appendix
Demographics*
Social and Economic Factors
Sources for all secondary data used in this report:
Indicator (2013) Original Source Year
Total Population Census Population Estimates 2013
Percent of Population under 18 years Census Population Estimates 2013
Percent of Population 65 year and older Census Population Estimates 2013
Percent of Population Non-Hispanic White Census Population Estimates 2013
Percent of Population Non-Hispanic African American
Census Population Estimates 2013
Percent of Population Hispanic Census Population Estimates 2013
Percent of Population other Race Census Population Estimates 2013
Percent of the Population not Proficient in English
American Community Survey 5-year Estimates
2009- 2013
Percent of the Population that are Female Census Population Estimates 2013
Percent of the Population that are Rural Census Population Estimates 2010
All "National Level" Demographics* U.S. Census QuickFacts 2011
Indicator Original Source Year
Median Household IncomeSmall Area Income and
Poverty Estimates 2013
High School Graduation RateState sources and the National Center for Education Statistics
2011-2012 KY & WV
Percent of Population with Some College EducationAmerican Community Survey
5-year Estimates 2009-2013
Unemployment Rate Bureau of Labor Statistics 2013
Percent of Children in PovertySmall Area Income and
Poverty Estimates 2013
Whitesburg ARH Hospital CHNA
24

Health Behaviors
Social and Economic Factors, continuedIndicator Original Source Year
Percent of Children Eligible for Free Lunch
National Center for Education Statistics 2012
Percent of Children Living in a Single Parent Household
American Community Survey 5-yr est.
2009- 2013
Percent of Adults without Adequate Social Support
Behavioral Risk Factor Surveillance System
2005- 2010
Percent of the Population Spending More Than 30% of Income on Housing Costs
American Community Survey 5-year Estimates
2007- 2011
Violent Crime Rate (per 100,000 population)Uniform Crime Reporting,
Federal Bureau of Investigation2010- 2012
Indicator Original Source Year
Percent of Adults who Smoke Regularly
Behavioral Risk Factor Surveillance System
2006- 2012
Percent of Adults who are Obese (BMI>=30)
National Center for Chronic Disease Prevention and Health Promotion, Division of Diabetes Translation 2011
Percent of Adults who are Physically Inactive
National Center for Chronic Disease Prevention and Health Promotion, Division of Diabetes Translation 2011
Percent of Adults who Drink Excessively (Heavy or Binge)
Behavioral Risk Factor Surveillance System
2006- 2012
Motor Vehicle Crash Deaths (per 100,000 population)
National Center for Health Statistics
2006- 2012
STDs: Chlamydia rate (per 100,000 population)
National Center for HIV/AIDS, Viral Hepatitis, STD, and TB Prevention 2012
Teen Birth Rate (per 1,000 females ages 15-19)
National Center for Health Statistics
2006-2012
Whitesburg ARH Hospital CHNA
25

Health Outcomes
Indicator Original Source Year
Premature Death (Years of Potential Life Lost per 100,000 population)
National Center for Health Statistics
2010- 2012
Percent of Adults Reporting Poor or Fair Health
Behavioral Risk Factor Surveillance System
2006- 2012
Average Poor Physical Health Days in Past 30 Days
Behavioral Risk Factor Surveillance System
2006- 2012
Average Poor Mental Health Days in Past 30 Days
Behavioral Risk Factor Surveillance System
2006- 2012
Percent of Babies Born with Low Birthweight (<2500 grams)
National Center for Health Statistics
2006- 2012
Percent of Adults with DiabetesNational Center for Chronic Disease Prevention and Health Promotion, Division of Diabetes Translation 2011
HIV Prevalence Rate (per 100,000 population)
National Center for HIV/AIDS, Viral Hepatitis, STD, and TB Prevention 2010
Premature Age-adjusted Mortality CDC WONDER mortality data2010- 2012
Child Mortality (per 100,000 population) CDC WONDER mortality data
2009- 2012
Infant Mortality (per 100,000 population) CDC WONDER mortality data
2004- 2010
Whitesburg ARH Hospital CHNA
26

Access to CareIndicator Original Source Year
Percent Uninsured (< age 65 without health insurance)
Small Area Health Insurance Estimates 2012
Percent of Uninsured AdultsSmall Area Health
Insurance Estimates 2012
Percent of Uninsured ChildrenSmall Area Health
Insurance Estimates 2012
Ratio of Population to Primary Care Physicians HRSA Area Resource File 2012
Ratio of Population to Dentists HRSA Area Resource File 2013
Ratio of Population to Mental Health Providers HRSA Area Resource File 2014Percent of Adults Reporting that
They Could Not See a Doctor Due to CostBehavioral Risk Factor Surveillance System
2006- 2012
Rate of Preventable Hospital Stays (per 1,000 Medicare Enrollees)
Dartmouth Atlas of Health Care 2012
Percent of Diabetics that Receive HbA1c Screening
Dartmouth Atlas of Health Care 2012
Percent of Women Receiving Mammography Screening
Dartmouth Atlas of Health Care 2012
Whitesburg ARH Hospital CHNA
27

Whitesburg ARH Hospital CHNA
28

Whitesburg ARH Hospital CHNA
29

Whitesburg ARH Hospital CHNA
30

Whitesburg ARH Hospital CHNA
31

Whitesburg ARH Hospital CHNA
32

ApprovalWhitesburg ARH Hospital CHNA
33
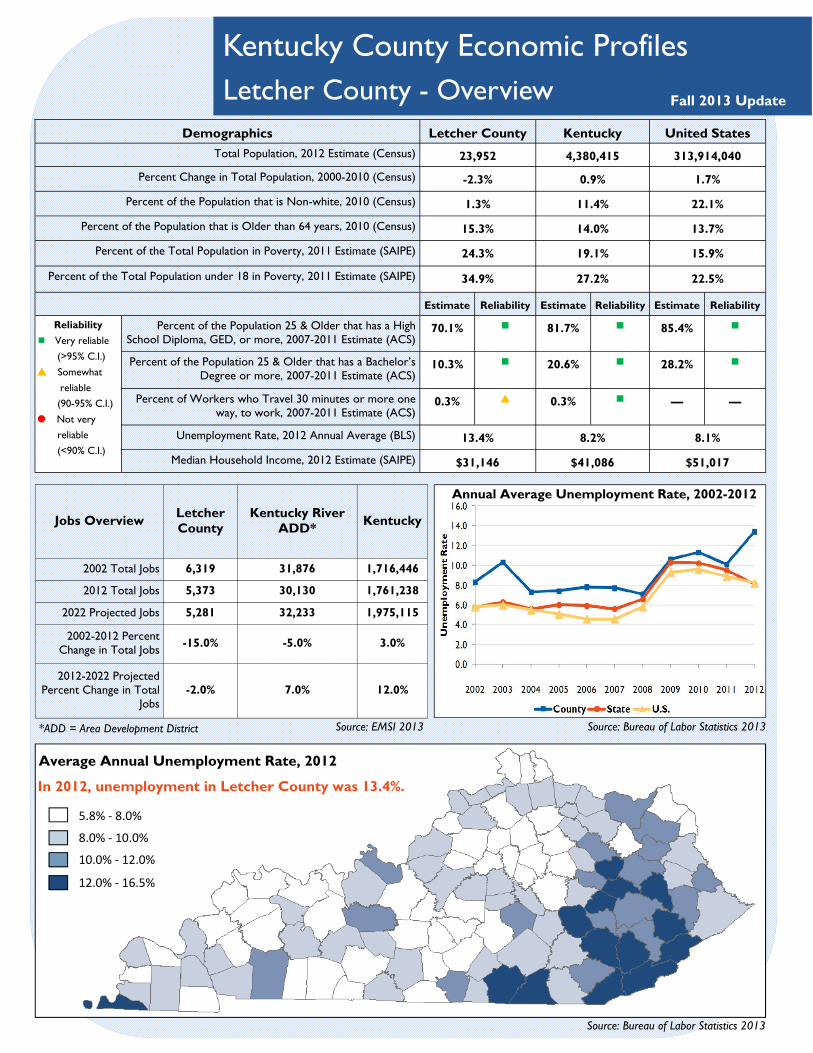
Kentucky County Economic Profiles Letcher County - Overview Fall 2013 Update
Source: Bureau of Labor Statistics 2013
Average Annual Unemployment Rate, 2012
Source: EMSI 2013
In 2012, unemployment in Letcher County was 13.4%.
5.8% ‐ 8.0%
8.0% ‐ 10.0%
10.0% ‐ 12.0%
12.0% ‐ 16.5%
Annual Average Unemployment Rate, 2002-2012
Source: Bureau of Labor Statistics 2013
Jobs Overview Letcher County
Kentucky River ADD* Kentucky
2002 Total Jobs 6,319 31,876 1,716,446
2012 Total Jobs 5,373 30,130 1,761,238
2022 Projected Jobs 5,281 32,233 1,975,115
2002-2012 Percent Change in Total Jobs
-15.0% -5.0% 3.0%
2012-2022 Projected Percent Change in Total
Jobs -2.0% 7.0% 12.0%
Demographics Letcher County Kentucky United States
Total Population, 2012 Estimate (Census) 23,952 4,380,415 313,914,040
Percent Change in Total Population, 2000-2010 (Census) -2.3% 0.9% 1.7%
Percent of the Population that is Non-white, 2010 (Census) 1.3% 11.4% 22.1%
Percent of the Population that is Older than 64 years, 2010 (Census) 15.3% 14.0% 13.7%
Percent of the Total Population in Poverty, 2011 Estimate (SAIPE) 24.3% 19.1% 15.9%
Percent of the Total Population under 18 in Poverty, 2011 Estimate (SAIPE) 34.9% 27.2% 22.5%
Estimate Reliability Estimate Reliability Estimate Reliability
Percent of the Population 25 & Older that has a High School Diploma, GED, or more, 2007-2011 Estimate (ACS)
70.1% 81.7% 85.4%
Percent of the Population 25 & Older that has a Bachelor’s Degree or more, 2007-2011 Estimate (ACS)
10.3% 20.6% 28.2%
Percent of Workers who Travel 30 minutes or more one way, to work, 2007-2011 Estimate (ACS)
0.3% 0.3% — —
Unemployment Rate, 2012 Annual Average (BLS) 13.4% 8.2% 8.1%
Median Household Income, 2012 Estimate (SAIPE) $31,146 $41,086 $51,017
Reliability
Very reliable
(>95% C.I.)
Somewhat
reliable
(90-95% C.I.)
Not very
reliable
(<90% C.I.)
*ADD = Area Development District

Kentucky County Economic Profiles Page 2
Letcher County - Jobs by Industry
http://cedik.ca.uky.edu/
The data for this Profile were prepared by the Community & Economic Development
Initiative of Kentucky (CEDIK) at the University of Kentucky. For questions on the data
contained in this profile, contact James E. Allen IV, Research Director,
at 859.218.4386 or [email protected].
Special thanks to Simona Balazs and Georgette Owusu-Amankwah,
CEDIK Research Assistants, for their work on this profile.
Letcher County Kentucky River ADD*
Kentucky
Percent Share of Total Jobs
2012 Jobs 2012 LQ† 2012 Jobs 2012 LQ† 2012 Jobs 2012 LQ†
Agriculture, Forestry, Fishing & Hunting n/a <10 n/a 19 0.1 7,508 0.5
Mining, Quarrying, & Oil & Gas Extraction 18.8% 1,008 31.0 4,062 22.3 20,309 1.9
Utilities 0.0% 0 n/a 87 0.7 6,559 0.9
Construction 2.0% 108 0.5 544 0.4 67,281 0.9
Manufacturing 1.9% 104 0.2 339 0.1 223,770 1.4
Wholesale Trade 2.2% 117 0.5 721 0.6 72,794 1.0
Retail Trade 12.4% 664 1.1 3,883 1.1 202,862 1.0
Transportation & Warehousing 3.5% 188 1.1 840 0.9 82.331 1.5
Information 1.3% 69 0.6 334 0.6 26,526 0.7
Finance & Insurance 2.2% 119 0.5 695 0.6 68,331 0.9
Real Estate & Rental & Leasing 0.4% 23 0.3 175 0.4 17,868 0.7
Professional, Scientific, & Technical Services 3.0% 161 0.5 709 0.4 67,533 0.6
Management of Companies & Enterprises 1.8% 96 1.2 251 0.6 20,055 0.8
Administrative & Waste Management Services 1.6% 87 0.3 1,000 0.6 104,557 1.0
Educational Services 0.0% 0 0.0 223 0.4 17,463 0.5
Health Care & Social Assistance 18.1% 973 1.4 6,093 1.6 226,618 1.0
Arts, Entertainment, & Recreation 0.6% 32 0.4 59 0.1 19,540 0.7
Accommodation & Food Services 6.3% 339 0.7 1,893 0.7 155,420 1.0
Other Services (except Public Administration) 1.7% 91 0.5 747 0.7 48,628 0.8
Public Administration 21.9% 1,177 1.4 7,457 1.6 305,286 1.1
Industry Sector (by 2-digit NAICS codes)
This page divides the county’s jobs into different industries, as defined by the North American Industry Classification System (NAICS).
Source: EMSI 2013
Industry Name (by 3-digit NAICS codes)
County Jobs
Local Government 973
Mining (except Oil & Gas) 920
Ambulatory Health Care Services 408
Food Services & Drinking Places 337
Hospitals (Private) 249
Food & Beverage Stores 215
Nursing & Residential Care Facilities 184
General Merchandise Stores 181
Professional, Scientific, & Technical Services 161
Truck Transportation 157
Total Top 10 industries 3,785
Top 10 Industries by Employment (2012)
Source: EMSI 2013
County Jobs by Kentucky’s Top 5 Industries (2012)
Source: EMSI 2013
*ADD = Area Development District †LQ= National Location Quotient (see Insights for description)

Kentucky County Economic Profiles Insights for Data Interpretation
Prepared by: Simona Balazs, CEDIK Research Assistant
CEDIK’s Economic Profile is comprised of two parts. The first page contains an overview of demographics and employment in the county, while the second page offers a closer look at jobs by industry. In an effort to provide as much data as possible on two pages, precise definitions of some measures were not included. Thus, questions may arise including: What does this number represent exactly? How can I interpret this? This short overview provides additional clarification to the meaning of the selected measures in the profile.
Demographics and Employment Page one of the profile starts with data on selected demographic variables, such as “percent change in total population”, “percent of the total population in poverty”, “unemployment rate”, and “median household income”. Numbers in the first table are provided for the county, Kentucky and the United States, allowing for comparison between the regions. In the second-part of the first table, estimates are provided along with a measure of “reliability”. The “reliability” refers to the Margin of Error (MOE) for the estimates. The MOE relates to uncertainty associated with an estimate based on the fact that there might be differences between the population included in the survey (sample population) versus the entire population. Thus, a small MOE suggests that the estimates are more likely to reflect what is actually happening in the county (i.e., higher reliability), while a large MOE suggests that the estimate is potentially not reflecting reality. To indicate the reliability of the estimate we used three confidence intervals (C.I.): >95%, between 90-95% and <90%. In our table, the three C.I. are coded as for C.I. >95%, for C.I. between 90-95% and for C.I. <90%. If an estimate in the table has a for example, then the MOE is small and the estimate is very reliable. If the symbol is , then the MOE is higher and the estimate might not be very representative of the full population. Data on this table come from different sources, mainly the U.S. Census Bureau and the U.S. Bureau of Labor Statistics (BLS). The American Community Survey (ACS) is a survey administered by the Census Bureau that collects data on age, sex, education, income, etc. The Small Area Income and Poverty Estimates (SAIPE) is a program developed by the Census Bureau that provides “more current estimates of selected income and poverty statistics than those from the most recent decennial census” (Census/SAIPE description).
On the middle section of the page, there is a table that provides an overview of jobs (total jobs, percent change in jobs, projected number of jobs) for the county, the Area Development District (ADD) and the state. An ADD consists of a network of planning and development organizations from neighboring counties that work towards the development of that area. There are 15 ADDs in Kentucky and each county is part of one. This section also contains a graph with unemployment rates over time (2002-2012) by county, Kentucky and the United States. In general, if the county’s unemployment rate is below that of Kentucky and the United States, the county is performing well economically. Note that Kentucky, the United States, and most counties saw a spike in unemployment between 2008 and 2009 as a result of the economic recession. Sources of data for this part are from Economic Modeling Specialist Inc. (EMSI) and the BLS.
On the bottom of the first page is a Kentucky map of the average annual unemployment rate for 2012 by county. As the unemployment rate increases, the color of a county becomes a darker shade of blue. A legend for the range of unemployment represented by each color and the county’s actual unemployment rate is also provided in the figure. The data source for the unemployment rate is the BLS.
Jobs by Industry Data on the second page provide more detailed information on number of jobs by industry, as categorized by the Northern American Industry Classification System (NAICS). NAICS is a standard used to classify the business establishments into various industries. Each firm is assigned a 6-digit number, and each digit after the first describes the firm in an increasing level of detail. For example, the code “11” describes jobs in jobs in “Agriculture, Forestry, Fishing, and Hunting”, the code “112” (an extra digit) describes jobs within agriculture, forestry, fishing, and hunting that fall under “Animal Production”, and the code “1123” (again, one more digit) describes jobs within animal production that belong to “Poultry and Egg Production.” All of the tables on this page use NAICS to categorize employment by industry in the county. The source of data for this entire page is EMSI.
To start, the top-left table lists the number of county level jobs for the top 10 industries in that county, by 3-digit NAICS codes. To create this table, employment was examined for all 3-digit NAICS
Kentucky County Economic Profiles online: www.cedik.ca.uky.edu/data_profiles/economic
December 2013

www.cedik.ca.uky.edu
industries in the county, and then sorted highest to lowest. These top 10 industries represent the major sources of employment in the county. One can easily compare total employment from these top 10 industries with Total Jobs from the previous page to learn what share of county employment comes from these top 10 industries. For many counties, over 50% of total county jobs come from these top 10 industries.
A second method of looking at jobs in the county is illustrated in the pie chart in the upper-right corner. For this chart, we look at county employment in Kentucky’s five largest 2-digit NAICS industries, which are Public Administration, Healthcare, Manufacturing, Retail Trade and Accommodation and Food Services. For space, all the other 2-digit NAICS industries were aggregated as one. The data in the chart represent county employment for Kentucky’s 5 largest industries. Because these are Kentucky’s top 5 industries (and not necessarily the county’s), employment numbers for the county can be very low, or in some cases, one of these 5 major industries might not be present in a county at all.
The large table on the remainder of the page is an overview of all industry groups by 2-digit NAICS codes for the county, ADD and Kentucky. This table contains data for the percent share of a particular industry in that county, the total number of jobs for an industry, and the national Location Quotient (LQ) value. The LQ is an indicator of how concentrated a particular estimate (in this case, employment by industry), is in the region (county, ADD or state) as compared with the nation. If the LQ is higher than 1.0, then employment in that industry is a larger share of total employment in the region than the national average. In other words, regional employment is more concentrated in that the industry than at the national average. is the larger the LQ,, the higher the concentration. For example, Kentucky’s LQ of 1.9 in the Mining industry suggests that more people are employed by the mining industry in Kentucky than across the country. Conversely, if the LQ is less than 1.0, then employment in this industry is less concentrated than it is nationally. For example, Kentucky’s LQ of 0.5 in the Agriculture industry suggests that fewer people are employed by the agriculture industry than elsewhere in the United States. Data is provided for the county, the ADD, and Kentucky in order to allow for comparison of jobs and LQs.
References: Bureau of Labor Statistics (BLS) for Unemployment Rate,
retrieved from http://www.bls.gov/home.htm
Census for Population Estimates, retrieved from http://www.census.gov/popest/data/index.html
Census/ American Community Survey (ACS) for Education estimates, retrieved from https://www.census.gov/acs/www/about_the_survey/american_community_survey/
Census/Small Area Income and Poverty Estimates (SAIPE) for Population in Poverty estimates, retrieved from http://www.census.gov/did/www/saipe/
Economic Modeling Specialists Inc. (EMSI) for Employment Data, retrieved from http://www.economicmodeling.com/
Kentucky County Economic Profile Insights, continued
If you have further questions regarding the data in this profile, please contact CEDIK Research Director James Allen at (859) 218-4386.
Kentucky County Economic Profiles online: www.cedik.ca.uky.edu/data_profiles/economic

Kentucky County Education Profiles
Letcher County - Education Overview
Source: US Census/5-yr ACS, 2009-2013
In Letcher County, in 2013, the percent of kids ready for kindergarten was 48.1%,
the average high school GPA was 2.8, and the junior year ACT score was 18.0.
Letcher County Kentucky River ADD* Kentucky Education Demographics
Estimate Percent Estimate Percent Estimate Percent
SCHOOL ENROLLMENT
Population Enrolled in School, 3 years and older 4,965 100.0% 24,599 100.0% 1,094,621 100.0%
Nursery School and Preschool 168 3.4% 1,275 5.2% 65,893 6.0%
Kindergarten 351 7.1% 1,613 6.6% 59,096 5.4%
Grades 1-8 2,304 46.4% 10,820 44.0% 454,133 41.5%
Grades 9-12 1,196 24.1% 5,673 23.1% 229,226 20.9%
College or Graduate School 946 19.1% 5,218 21.2% 361,888 26.2%
EDUCATIONAL ATTAINMENT
Population, 25 years and older 16,997 100.0% 79,151 100.0% 2,902,296 100.0%
Less than High School 4,283 25.2% 24,660 31.2% 510,196 17.6%
High School Degree (includes equivalency) 6,221 36.6% 27,660 34.9% 988,008 34.0%
Some College or Associate's Degree 4,538 26.7% 17,914 22.6% 795,165 27.4%
Bachelor's Degree 1,241 7.3% 4,905 6.2% 361,888 12.5%
Graduate or Professional Degree 714 4.2% 4,020 5.1% 247,039 8.5%
High School Degree or More 12,714 74.8% 54,497 68.9% 2,392,100 82.4%
Bachelor's Degree or More 1,955 11.5% 8,925 11.3% 608,927 21.0%
Source: US Census/5-yr ACS, 2009-2013
For more information on test scores
or school readiness go to KY Center
for Education and Workforce
Statistics (KCEWS) at https://
kcews.ky.gov/. For more information
on postsecondary education, go to
KY Council on Postsecondary
Education at http://cpe.ky.gov/info/.
Source: KCEWS/County Profile Data, 2014-2015
Educational Performance Measures County Kentucky
Percent of Kids Ready for Kindergarten, 2013 48.1% 49.0%
Average Junior Year ACT Composite Score (out of 36 points), 2013 18.0 19.4
Average High School GPA (out of 4.0), 2013 2.8 2.9
Percent of High School Graduates Enrolled in College, 2011-2012 60.8% 60.2%
Percent of High School Graduates Enrolled in In-State College 59.5% 55.4%
6-year College Graduation Rate, 2007 cohort 50.8% 54.2%
Percent of Working Population (ages 18-64) with Bachelor’s Degree or Higher
*Area Development District (ADD)

Kentucky County Education Profiles
Page 2Letcher County - Industry Indicators
cedik.ca.uky.edu
The data for this profile were prepared by the Community and Economic Development
Initiative of Kentucky (CEDIK) at the University of Kentucky.
For questions on the data contained in this profile, contact James E. Allen IV, Research Director,
at 859.218.4386 or [email protected].
Special thanks to Simona Balazs, CEDIK Research Associate, for her work on this profile.
County Employment and Earnings by Type of Educational Institution
In 2014, Letcher County had 733 jobs in the education industry.
The fastest growing educational occupation in the county was Substitute Teachers.
Source: EMSI, 2014 County Employment by Educational Occupation
Source: EMSI, 2014
Percent of County Employment by Gender
Educational Institution 2009 Jobs 2014 Jobs 5-yr Change
2009-2014
Average Annual
Earnings
Elementary and Secondary Schools 772 681 -11.8% n/a
Public 762 671 -11.9% $47,301
Private <10 <10 n/a n/a
Colleges, Universities, and Professional Schools n/a n/a n/a n/a
Public n/a n/a n/a n/a
Private n/a n/a n/a n/a
All Other Schools and Educational Support Services 54 52 -3.7% n/a
Public 44 42 -4.5% $60,051
Private <10 <10 n/a n/a
Educational Occupation 2014 Jobs Occupational
Mix Effect
National
Growth Effect
Competitive
Effect
Median
Hourly
Earnings
Pre-K and Kindergarten Teachers 22 -2 2 -1 $16.99
Elementary School Teachers 127 -10 11 -13 $24.77
Middle School Teachers 30 -2 3 -4 $24.41
High School Teachers 66 -8 6 -8 $24.68
Postsecondary Education Teachers 28 -1 2 -3 $29.87
Special Education Teachers 39 -4 3 -5 $24.75
Teacher Assistants 100 -9 9 -11 $10.07
School Counselors 12 -1 1 -1 $27.61
Self-Enrichment Education Teachers <10 n/a 1 n/a n/a
Educational Institutions Administrators 30 -3 3 -3 $34.79
Education, Training and Library Occupations 26 -1 2 -2 $17.74
Other Education Occupations 27 -1 2 -4 $23.06
Source: EMSI, 2014
Statewide Spending on Education
K-12 Education KY Amounts
Total Revenues $443,314,000
State and local sources $398,688,000
Federal sources $44,626,000
Total Expenditures $492,400,000
4-year Public Universities KY Averages
Average Annual In-State Tuition & Fees $8,543
Average Debt per Student $22,384
Source: TRF Policy Map, 2012
Kentucky County Education Profiles
Insights for Data Interpretation
Prepared by: Simona Balazs, CEDIK Research Associate and James E. Allen IV, Research Director
CEDIK’s Education Profile is comprised of two major parts.
The first page is an overview of selected education
indicators, while the second page offers a closer economic
look at the education industry. In an effort to provide as
much data as possible on two pages, precise definitions of
some measures were not included. Thus, questions may
arise including: What does this number represent exactly?
How can I interpret this? This short overview provides
additional clarification to the meaning of the selected
measures in the profile.
Education Overview
The first page begins by highlighting three indicators of
educational achievement in the county: the percent of kids
ready for kindergarten, the average high school GPA and the
junior year ACT score. The first indicator is important
because the educational and environmental background in
children pre-kindergarten differ widely. This allows schools
to assess and understand how kids are prepared to start
school. The high school GPA and the junior year ACT are
two of the most important factors for acceptance into
college. The high school GPA is out of 4.0 and the junior
year ACT is out of 36 points. The average junior year ACT
score for Kentucky is 19.4; the values at county level range
between 16.5 and 22.7. For the average high school GPA,
the state value is 2.9, while the counties range between 2.6
and 3.3 for an average GPA.
The table on the first page provides data on selected
education indicators grouped into two categories: School
Enrollment and Educational Attainment. Numbers are
provided for the county, Area Development District (ADD),
and Kentucky. School Enrollment data looks at population
enrolled in school (3 years and over) and provides estimate
and percent for variables such as kindergarten, grades 9-12
(high school) and college or graduate school. Educational
Attainment data give an overview of population 25 years and
over that graduated high school or has a bachelor’s degree,
for example. The source of data and description for these
indicators is the US Census, 5-year ACS.
The midsection of the first page maps the percent of
working population (ages 18-64) with bachelor’s degree or
higher for each Kentucky county. The darker the shade of
blue, the higher the percent of that county’s working
population that has attained least a bachelor’s degree. The
location of the eight public universities in Kentucky is also
mapped. It can be observed that there is a link between
where the universities are located and the educational
attainment of the working population. Data for this map also
come from the US Census, 5-year ACS.
The page ends with a comparative table for some of the
educational performance measures at the county and state
level. Aside from the three indicators highlighted at the top
of the page, this table also provides information on the
percent of high school graduates enrolled in college and the
6-year college graduation rate. The college graduation rate
for the county is the rate of students from that county that
attended college, regardless of where they went to college.
The source of data is Kentucky Center for Education and
Workforce Statistics (KCEWS).
Industry Indicators
Data on the second page provide more detailed information
on the employment in the education industry by type of
educational institution and occupations. This page starts with
a statement on the total number of jobs in the education
industry for the county and the fastest growing educational
occupation in 2014. One important note here is that the
fastest growing occupation in the county is not necessarily
the one with the highest employment; it is the occupation
with the highest percent change from 2013.
The table on the top of the page looks at employment and
earning for different types of educational institutions in the
county. It features the number of jobs for 2009 and 2014,
the 5-year change, and the average annual earnings for
employees working at that institution. The total average
annual earnings for a category (e.g., elementary and
secondary schools) are an average of public and private
annual earnings weighted by employment in each
Kentucky County Economic Profiles online: www.cedik.ca.uky.edu/data_profiles/education
June 2015

www.cedik.ca.uky.edu
subcategory. Thus, some categories report average annual
earnings that are much closer to the average for the public
educational institutions, while for other categories the
average is closer to the private annual average earnings.
Data in this table come from the Economic Modeling
Specialists Inc. (EMSI).
The second table on this page looks at several county-level
economic indicators for various education occupations, such
as elementary or high school teachers, special education
teachers, school counselor and educational institutions
administrators. The table provides the number of jobs for
that occupation, the occupational mix effect, the national
growth effect, the competitive effect, the number of job
postings and the median hourly earnings for 2014. The
occupational mix effect represents the share of that
education occupation’s growth that is explained by the
growth of this occupation at national level; in other words,
the national growth rate for the entire economy is
subtracted from the national growth rate of the occupation
and then applied to the number of occupational jobs in the
county. The national growth effect describes how much of
the occupation’s growth at the county level is explained by
the overall growth of the national economy (i.e., if the
nation’s economy is growing, then there should be some
positive change in the county’s education occupation). Both
of these indicators rely on the national growth. The
occupational mix effect depends on national growth in that
particular industry, whereas the national growth effect
depends on the growth in the nation’s economy as a whole.
Of particular importance is the competitive effect because it
explains how much of the change in the education
occupation is due to a competitive advantage that the
county has. Unlike the previously mentioned indicators, the
competitive effect cannot be explained by the national
trends, and it can be positive even if the county employment
for the occupation declines. The competitive effect gives the
difference between the expected change and the actual
change for the education occupation in the county. A
positive value indicates that the county’s education
occupation is outperforming national trends, while a
negative effect means that the occupation is
underperforming compared to the national trends.
The source of data for this table is Economic Modeling
Specialists Inc. (EMSI).
The graph on the bottom-left section is a snapshot of the
gender distribution for some education occupations. For
most counties, the graph looks at gender for five or six
occupations for the education industry. However, for some
counties certain occupations are not represented or there
was insufficient data; in these cases, the chart includes fewer
than five categories. Again, the source for this data is
Economic Modeling Specialists Inc. (EMSI).
In the bottom-right section of the page, the profile ends
with an overview of some financial indicators for the
education industry in the state. The table shows, in 2012,
that almost 90% of the Kindergarten-12th Grade educational
institutions’ revenue came from state and local sources and
only 10% from federal sources. It also shows that the
average debt for a student from a 4-year public university is
over $22,000. These data were sourced from The
Reinvestment Fund (TRF) Policy Map and are not available at
the county level.
References:
1. Economic Modeling Specialists Inc. (EMSI), 2014,
http://www.economicmodeling.com/;
2. KY Center for Education and Workforce Statistics
(KCEWS)/ County Profile Reports, 2014,
https://kcews.ky.gov/#;
3. U.S. Census/5-year ACS, retrieved from http://
factfinder.census.gov/faces/nav/jsf/pages/index.xhtml;
4. The Reinvestment Fund (TRF) Policy Map, 2012 data,
http://www.policymap.com/.
Still have questions?
If you have further questions regarding the data in this
profile, please contact CEDIK Research Director James
Allen IV at 859-218-4386.
Kentucky County Education Profile Insights, continued
Kentucky County Education Profiles online:
www.cedik.ca.uky.edu/data_profiles/education

Kentucky County Healthcare Profiles
Letcher County—Health Indicators Winter 2014 Update
In 2012, the employment share of the healthcare industry in Letcher County was 18.1%.
Healthcare was the third largest industry employer in the county with 973 workers. Also in
2012, the healthcare industry brought in 10.0% ($55,571,666) of the county’s gross product.
Health Outcomes
Letcher
County
Kentucky River
ADD*
Kentucky
Premature death (years of potential life lost per 100,000 population) 12,028 14,024 8,768
Percent of adults reporting poor or fair health 32.0% 32.3% 21.4%
Average number of poor physical health days in the past 30 days 7 7 5
Average number of poor mental health days in the past 30 days 6 6 4
Percent of babies born with low birth weight (less than 2,500 grams) 10.6% 10.5% 9.1%
Percent of adults with Diabetes 16.9% 14.7% 11.6%
HIV prevalence rate (per 100,000 population) 65 26 140
Age-adjusted mortality (per 100,000 population, if under age 75) 598 667 445
Child mortality (per 100,000 population) 46 75 65
Infant mortality (per 100,000 population) n/a 209 710
Health Behaviors
Percent of adults who smoke regularly 29.8% 33.6% 26.4%
Percent of adults who are obese (BMI greater than or equal to 30) 38.9% 37.0% 32.9%
Percent of adults who are physically inactive 37.2% 37.4% 31.5%
Percent of adults who drink excessively (heavy or binge) 7.3% 7.7% 11.5%
Motor vehicle crash deaths (per 100,000 population) 41 41 20
STDs: Chlamydia rate (per 100,000 population) 86 101 377
Teen birth rate (per 1,000 females ages 15-19) 62 62 50
Access to Care
Percent uninsured (under age 65 without health insurance) 18.0% 18.0% 17.5%
Percent of uninsured adults 22.0% 22.0% 21.8%
Percent of uninsured children 6.7% 6.5% 6.7%
Percent of adults reporting they could not see a doctor due to cost 23.3% 24% 17.0%
Rate of preventable hospital stays (per 1,000 Medicare enrollees) 221 211 103
Percent of diabetics that receive HbA1c screenings 84.6% 82.4% 83.8%
Percent of women receiving mammography screenings 57.0% 50.1% 61.7%
Physical Environment
Pollution: Average daily measure of fine particulate matter
(micrograms per cubic meter)
13 12 13
Drinking water safety: Percent of the population exposed
to water exceeding a violation limit in the past year
27.4% 36.7% 10.9%
Rate of recreational facilities (per 100,000 population) 0 1 8
Percent of the population that lives within half a mile of a park 1.0% 0.8% 24.0%
In your
county:
16.9%
of adults
have
diabetes
____________
29.8%
of adults
are
regular
smokers
____________
38.9%of adults
are obese
____________
22.0%
of adults &
6.7% of children
are
without
health
insurance *Area Development District Source: County Health Rankings, 2013. See Insights for specific years of each indicator.

The data for this Profile were prepared by the Community & Economic Development
Initiative of Kentucky (CEDIK) at the University of Kentucky. For questions on the data
contained in this profile, contact James E. Allen IV, Research Director,
at 859-218-4386 or [email protected].
Special thanks to Simona Balazs and Georgette Owusu-Amankwah,
CEDIK Research Assistants, for their work on this profile.
Kentucky County Healthcare Profiles
Page 2 Letcher County - Industry Indicators
Source: KY Health Benefit Exchange & Deloitte, 2012
http://cedik.ca.uky.edu/
Access to Primary Care Physicians (PCPs) by Population
Source: EMSI, 2013
Low Access (less than 1 PCP per 2,000 population)
Intermediate Access (less than 1 PCP per 1,000 population)
High Access (more than 1 PCP per 1,000 population)
In 2012, Kentucky had .93
primary care physicians
per 1,000 population.
NAICS Health Sector 2008
Jobs
2013
Jobs
2023
Projected
Jobs
2013
Establish-
ments
Offices of Physicians 52 80 125 13
Offices of Dentists 20 16 17 3
Offices of Other Health Practitioners 65 63 112 5
Outpatient Care Centers 192 210 236 12
Medical & Diagnostic Laboratories 0 0 <10 0
Home Health Care Services 28 36 50 1
General Medical & Surgical Hospitals 401 237 62 2
Psychiatric & Substance Abuse Hospitals 0 0 0 0
Specialty Hospitals (not Psychiatric & Substance Abuse) 0 0 0 0
Average Earnings Per Worker (2013) $48,247
Number of providers per 1,000 population:
Primary Care Physicians: 0.94
Dentists: 0.17
Mental Health Providers: 1.25
Supply of Physicians 35
Primary Care Physicians (PCP) 23
Specialist Physicians 12
Percent Physicians over 65 14.5%
Percent Kentucky trained 34.3%
Percent Foreign trained 37.1%
PCP who Accept Medicaid 13
Healthcare
Providers
2012 2017
Supply Need Gap Need Gap
Physicians 35 69 34 69 34
Physician Assistants 3 5 2 5 2
Nurse Practitioners 12 10 -2 10 -2
Registered Nurses 174 210 36 210 36
Licensed Practical Nurses 86 56 -30 56 -30
Nurse Aides 449 109 -340 109 -340
Dentists 4 13 9 13 9
Mental Health Providers 30 48 18 48 18
Optometrists 3 5 2 5 2
Source: KY Health Benefit Exchange & Deloitte, 2012 Source: KY Health Benefit Exchange & Deloitte, 2012
2013 Medicaid Recipients
by Age Group
Source: KY Cabinet for Health
and Family Services, 2013

Kentucky County Healthcare Profiles
Insights for Data Interpretation Prepared by: Simona Balazs, CEDIK Research Assistant
CEDIK’s Healthcare Profile is comprised of three major
parts. The first page is an overview of selected Health
Indicators, while the second page offers a closer look at
the Healthcare Industry and Healthcare Access. This
short overview provides additional clarification to the
selected measures in the profile.
Health Indicators
The first page begins with a statement on the status of the
Healthcare Industry in the county, based on three criteria:
the share of total county employment share in the
healthcare industry, the rank of the healthcare industry
relative to all other industries in county based on
employment, and the percent (and dollar amount) that
the healthcare industry brings to the county’s gross
product. For most counties, the healthcare industry ranks
in top five industries in that county. The source of data is
Economic Modeling Specialists Inc. (EMSI).
The table on the first page provides data on selected
health indicators grouped into four categories: Health
Outcomes, Health Behaviors, Access to Care, and
Physical Environment. Numbers are provided for the
county, Area Development District (ADD), and
Kentucky. The source of the data and description for the
Health Indicators is County Health Rankings for the year
2013. However, individual indicators themselves come
from different years (see County Health Rankings Sources
table below).
First, the Health Outcomes indicators include variables
such as premature death, age-adjusted mortality, and
percent of adults with diabetes. The premature death is
measured in the number of years of potential life lost
before the age of 75. For example, if a person died at age
50, then that person contributes 25 years to a county’s
premature death number. Next, the age-adjusted
mortality rate (for residents under 75 years old) is a
standard way of reporting the mortality rate so that
counties with a younger population can be compared to
those with an older population more fairly. The age-
adjusted mortality rate reports the average mortality rate
if all Kentucky counties had the same age distribution in
their populations. Please note that premature death, HIV
prevalence rate, age-adjusted mortality, child mortality
and infant mortality are reported as a rate per 100,000
population. Of course, most counties have far less than
100,000 residents, but the data are reported this way
because the amounts are very small.
Second, the measures under Health Behavior are
important markers of risky health behaviors that affect
the community and the healthcare system in a county,
ADD, or the state. Each one of these indicators increases
the risk of various diseases and of premature death.
Third, Access to Care indicators include the percent of
people, adults, and children that are uninsured, and the
percent of adults that could not see a doctor due to cost.
These measures indicate a barrier in accessing needed
health care. Finally, the table reports indicators of the
county’s Physical Environment, which are important for
promoting public health.
Industry Indicators
The top of the second page reports the number of
healthcare providers in the county, including physicians,
dentists, mental health providers, and six other
professions. The data show the supply, need, and gap for
2012, and the projected need and gap for 2017. The gap
of healthcare providers is calculated as the difference
between need and supply. If for a given occupation the
need is greater than the supply, then the gap is positive—
the county requires more providers for that occupation
than it currently has. Likewise, if the supply is greater than
the need for a given occupations, then the gap is negative;
in this case, the county has an excess of providers for that
occupation given the size of its population.
To the left of the primary table, the 2012 supply of
physicians is unpacked into number of primary care
physicians (PCP) and specialist physicians. The percent of
physicians over 65 and percent of physicians that are
trained in Kentucky or abroad are also reported. The
upper-left corner reports the number of providers for
1,000 people for PCPs, dentists, and mental health
Kentucky County Healthcare Profiles online: www.cedik.ca.uky.edu/data_profiles/healthcare
February 2014

www.cedik.ca.uky.edu
providers. These three healthcare occupations are used
to designate Health Professional Shortage Areas (HPSA)
and medically underserved populations (MUPs) by the
U.S. Department of Health and Human Resources. In
2013, there were approximately 5,800 PCP HPSAs, 4,600
Dental HPSA, and 3,700 Mental Health HPSAs in the
United States. For both of these tables at the top of the
second page, the data source is a study implemented by
the Kentucky Health Benefit Exchange and Deloitte in
2012 called the “Kentucky Health Care Workforce
Capacity Report,” which painstakingly verified data from
the Kentucky Board of Medical Licensure and similar
boards to ensure accuracy.
The left table in the middle section of the second page
reports the total number of jobs for 2008, 2013, and
projections for 2023. It also includes the number of
health sector establishments and average earnings per
worker in 2013 for the main healthcare subsectors.
These subsectors are based on 4-digit codes of the North
American Industry Classification System (NAICS) for the
county. For information on NAICS, please see the
Insights for CEDIK’s Economic Profile. The data source
for this section is EMSI.
Healthcare Access
The bar graph on the right provides information about
Medicaid recipients by age group for the county. Data
come from the Kentucky Cabinet for Health and Family
Services/Department of Medicaid Services as of July 2013.
Whereas Medicare is a federally run insurance program
for people over 65 and younger disabled and dialysis
patients, Medicaid is a federal-state assistance program in
which medical bills are paid from federal, state and local
tax funds. In Kentucky as of 2014, children aged 0-1 are
eligible for Medicaid if they live in a household below
195% of the federal poverty level (FPL), and other
children aged 1-18 are eligible if below 159% of the FPL.
Additionally, pregnant women are eligible for Medicaid if
in a household below 195% of the FPL, while parents and
other adults are eligible if below 133% of the FPL.
However, keep in mind that this figure shows Medicaid
recipients in the county, and that there are likely others
who are eligible but are not recipients.
Finally, the profile ends with a Kentucky map of Access to
Primary Care Physicians (PCP) by population. The map
was constructed using the same ratio provided in the
upper-left corner of the number of PCPs per 1,000
population. A darker color on the map indicates higher
access to PCPs. The 2012 rate of PCP per 1,000 people
for the state of Kentucky is also provided on the map. All
of the High Access counties have higher than average
access to PCPs for the state, while all of the Low Access
and most of the Intermediate Access have lower than
average access to PCPs for the state.
References:
County Health Rankings for Health Indicators, retrieved
from http://www.countyhealthrankings.org/app/
kentucky/2013/rankings/outcomes/overall/by-rank
Economic Modeling Specialists Inc. (EMSI) for
Employment Data, retrieved from http://
www.economicmodeling.com/
KY Cabinet for Health and Family Services/Department of
Medicaid Services for Medicaid Data, retrieved from
http://chfs.ky.gov/dms/stats.htm
KY Health Benefit Exchange and Deloitte 2012 Report
for Provider Data, retrieved from http://
healthbenefitexchange.ky.gov/Pages/Kentucky-Health-
Care-Workforce-Capacity-Report.aspx
“What is the difference between Medicare and Medicaid?”
US Department of Health & Human Services,
retrieved from http://answers.hhs.gov/questions/3094
“Medicaid and CHIP Eligibility Levels”, Center for
Medicare & Medicaid Services, retrieved from http://
www.medicaid.gov/AffordableCareAct/Medicaid-
Moving-Forward-2014/Medicaid-and-CHIP-Eligibility-
Levels/medicaid-chip-eligibility-levels.html
Data Sources:
(see table on next page)
Kentucky County Healthcare Profile Insights, continued
If you have further questions regarding the data in this profile, please
contact CEDIK Research Director James Allen at (859) 218-4386.
Kentucky County Healthcare Profiles online:
www.cedik.ca.uky.edu/data_profiles/healthcare

Data retrieved from County Health Rankings at www.countyhealthrankings.org, a collaboration between
Robert Wood Johnson Foundation and University of Wisconsin Population Health Institute
Health Outcomes Original Source Year
Premature death (years of potential life lost per 100,000 population) National Center for Health Statistics 2008-2010
Percent of adults reporting poor or fair health Behavioral Risk Factor Surveillance System 2005-2011
Average number of poor physical health days in the past 30 days Behavioral Risk Factor Surveillance System 2005-2011
Average number of poor mental health days in the past 30 days Behavioral Risk Factor Surveillance System 2005-2011
Percent of babies born w/ low birth weight ( less than 2,500 grams) National Center for Health Statistics 2004-2010
Percent of adults with diabetes
National Center for Chronic Disease
Prevention and Health Promotion,
Division of Diabetes Translation 2009
HIV prevalence rate (per 100,000 population)
National Center for HIV/AIDS, Viral
Hepatitis, STD, and TB Prevention 2009
Age-adjusted mortality (per 100,000 population, if under age 75) CDC WONDER mortality data 2008-2010
Child mortality (per 100,000 population) CDC WONDER mortality data 2007-2010
Infant mortality (per 100,000 population) CDC WONDER mortality data 2006-2010
Health Behaviors Original Source Year
Percent of adults who smoke regularly Behavioral Risk Factor Surveillance System 2005-2011
Percent of adults who are obese
(BMI greater than or equal to 30)
National Center for Chronic Disease
Prevention and Health Promotion,
Division of Diabetes Translation 2009
Percent of adults who are physically inactive
National Center for Chronic Disease
Prevention and Health Promotion,
Division of Diabetes Translation 2009
Percent of adults who drink excessively (heavy or binge) Behavioral Risk Factor Surveillance System 2005-2011
Motor vehicle crash deaths (per 100,000 population) National Center for Health Statistics 2004-2010
STDs: Chlamydia rate (per 100,000 population)
National Center for HIV/AIDS, Viral
Hepatitis, STD, and TB Prevention 2010
Teen birth rate (per 1,000 females ages 15-19) National Center for Health Statistics 2004-2010
Access to Care Original Source Year
Percent uninsured (under age 65 without health insurance) Small Area Health Insurance Estimates 2010
Percent of uninsured adults Small Area Health Insurance Estimates 2010
Percent of uninsured children Small Area Health Insurance Estimates 2010
Percent of adults that could not see a doctor due to cost Behavioral Risk Factor Surveillance System 2005-2011
Rate of preventable hospital stays (per 1,000 Medicare enrollees) Dartmouth Atlas of Health Care 2010
Percent of diabetics that receive HbA1c screenings Dartmouth Atlas of Health Care 2010
Percent of women receiving mammography screenings Dartmouth Atlas of Health Care 2010
Physical Environment Original Source Year
Pollution: Average daily measure of fine particulate matter (micrograms per cubic meter) CDC WONDER Environmental data 2008
Drinking water safety: Percent of the population exposed to water exceeding violation limit in the past year Safe Drinking Water Information System 2012
Rate of recreational facilities (per 100,000 population) County Business Patterns 2010
Percent of the population that lives within half a mile of a park
Environmental Public Health
Tracking Network 2010


![COLLEYVILLE STAMPEDE€¦ · Come join Ideal Dental, Jersey Mikes, Pure Barre and Tune Up The Manly Salon. CENTER SIZE: 12,763 SF AVAILABILITY: 2,283 SF [FORMER TEDDY'S BURGERS] NNN:](https://img.dokumen.tips/doc/110x75/5fef3a873029ea3306359667/colleyville-stampede-come-join-ideal-dental-jersey-mikes-pure-barre-and-tune-up.jpg)