Embed Size (px)
Citation preview

WHITE YOUNG GREEN PLANNING REGATTA HOUSE CLIPPERS QUAY SALFORD QUAYS
MANCHESTER M50 3XP
TEL 0161 872 3223 FAX 0161 872 3193
ST HELENS RETAIL CAPACITY STUDY
Final Report
Prepared by
WHITE YOUNG GREEN PLANNING
On behalf of
ST HELENS COUNCIL
MAY 2005

CONTENTS __________________________________________________________________________ Page
1 INTRODUCTION 1 2 BACKGROUND TO RETAIL AND LEISURE 4 3 PLANNING POLICY FRAMEWORK 18 4 ASSESSMENT OF VITALITY AND VIABILITY 24 5 ORIGINAL MARKET RESEARCH 47
6 POPULATION AND EXPENDITURE 57 7 RETAIL CAPACITY ASSESSMENT 73 8 SUMMARY 85
Appendix A - Defined Catchment
Appendix B - MapInfo methodology
Appendix C - Household Survey Results
Appendix D - In Street Survey
Appendix E - WYG Convenience Model
Appendix F - WYG Comparison Model
Appendix G - Business Survey Results – St Helens
Appendix H - Business Survey Results - Earlestown
Appendix I - GOAD Town Centre Map
Technical Appendices are bound under separate cover.
1 INTRODUCTION Objectives of the Study 1.01 White Young Green Planning was commissioned by St Helens Metropolitan Borough
Council in 2004, to undertake a retail study for the Borough (2005 to 2015). The
study seeks to up-date the findings of 2001 Retail & Leisure (2000-2016) Study
undertaken by MVM Planning and provide new evidence on the need for further retail
development.
1.02 The aim of this study is to provide baseline evidence that will inform the development
of future plan strategy including the emerging Local Development Framework.
Therefore, this report specifically focuses on the ‘need’ for future retail and leisure
uses rather than seeking to review local policy at this stage. In response to the
requirements of Consultant’s Brief, the report considers the following.
(1) To provide an of Update of the need assessment set out in the 2001 Retail and
Leisure Study;
(2) To compare and contrast results between the 2001 and 2005 studies;
(3) To identify capacity to accommodate additional retail growth by sector over the
period to 2015; and
(4) To review sub-regional trends in the retail market and advise on the actions
necessary for St Helens to maintain it’s competitive position.
1.03. The methodology adopted for the study has been informed by the recently published
Planning Policy Statement 6 (PPS6) which deals with town centre and retail
development. The study has also taken into account the findings of key documents
produced by the Local Planning authority, most notably their annual ‘St Helens Town
Centre Health Check’.
Original Market Research
1.04 In order to up date the 2001 study, new empirical research has been completed.
This includes:
A telephone survey of 1,000 households (compared to 750 in 2001) in St
Helens and the surrounding area in order to ascertain general patterns of
shopping and leisure activity in the sub-region. The same catchment was
used as in the 2001 study in order to compare changes in market shares. A
plan showing the extent of the catchment area is provided below;
1

Figure 1.1: The Defined Catchment Area
An on-street survey of 300 visitors to St Helens and Earlestown Town
Centres in order to gauge customer perceptions of each centre and following
the same methodology adopted in the 2001 study.
A postal survey of 600 retail and services businesses within St Helens and
156 within Earlestown town centres in order to assess retailer’s views of the
strengths and weaknesses of each town as a shopping and leisure
destination and to understand their future plans for investment within the
centres.
Report Structure
1.05 The report is set out as follows:
Section 2: considers recent and future trends in the retail market and the
implications on land use planning.
Section 3: provides an overview of the current and emerging planning legislation
in respect of retail development.
Section 4: provides an assessment of the vitality and viability of both St Helens
and Earlestown Town Centres, in line with the guidance set out in
PPS6, comparing these to the results of the 2001 MVM study.
Section 5: reviews the findings of the original market research that underpins the
study, including an examination of the household survey, in street
2

survey and business survey, comparing the results to the previous
2001 study.
Section 6: undertakes an assessment of expenditure growth in convenience and
comparison goods within the defined catchment area and identifies the
market shares for a variety of goods for St Helens.
Section 7: Identifies the retail capacity for additional convenience and comparison
floorspace within St Helens Borough.
Section 8: Sets out the study’s principal findings and recommendations for any
future policy formulation.
3
2 BACKGROUND TO THE RETAIL AND LEISURE INDUSTRY Forecast Changes in Consumer Expenditure
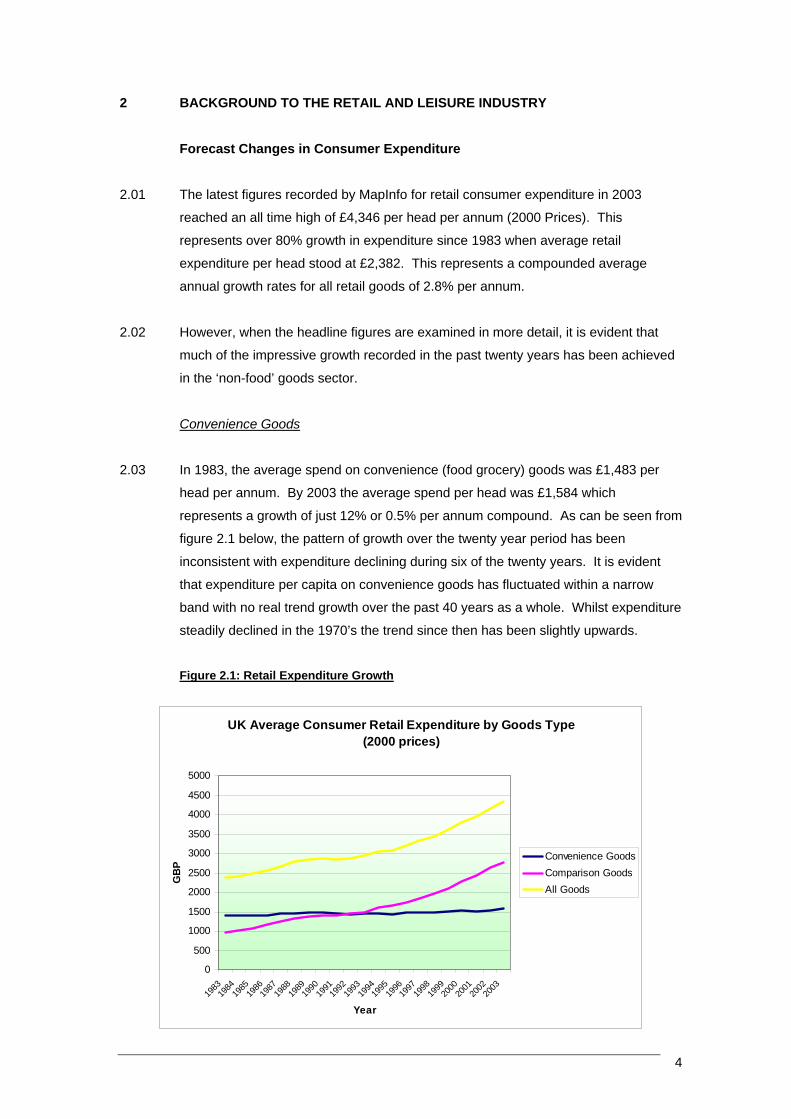
2.01 The latest figures recorded by MapInfo for retail consumer expenditure in 2003
reached an all time high of £4,346 per head per annum (2000 Prices). This
represents over 80% growth in expenditure since 1983 when average retail
expenditure per head stood at £2,382. This represents a compounded average
annual growth rates for all retail goods of 2.8% per annum.
2.02 However, when the headline figures are examined in more detail, it is evident that
much of the impressive growth recorded in the past twenty years has been achieved
in the ‘non-food’ goods sector.
Convenience Goods
2.03 In 1983, the average spend on convenience (food grocery) goods was £1,483 per
head per annum. By 2003 the average spend per head was £1,584 which
represents a growth of just 12% or 0.5% per annum compound. As can be seen from
figure 2.1 below, the pattern of growth over the twenty year period has been
inconsistent with expenditure declining during six of the twenty years. It is evident
that expenditure per capita on convenience goods has fluctuated within a narrow
band with no real trend growth over the past 40 years as a whole. Whilst expenditure
steadily declined in the 1970’s the trend since then has been slightly upwards.
Figure 2.1: Retail Expenditure Growth
UK Average Consumer Retail Expenditure by Goods Type (2000 prices)
0
500
1000
1500
2000
2500
3000
3500
4000
4500
5000
1983
1984
1985
1986
1987
1988
1989
1990
1991
1992
1993
1994
1995
1996
1997
1998
1999
2000
2001
2002
2003
Year
GB
P
Convenience GoodsComparison GoodsAll Goods
4

2.04 There is a widely held theory that consumers will only purchase the convenience
goods that they need to ensure that they eat regularly. Therefore, the likelihood of
witnessing any major growth after inflation is limited. In addition, as society in
general becomes more affluent and our standard of living increases, we will have a
greater tendency to eat out more frequently thereby reducing the need to spend as
much on food goods in the supermarket.
2.05 However, more recent evidence on growth has shown that the opposite is actually
occurring with convenience goods expenditure per capita increasing at 1.0% per
annum between 1998 and 2003. This is double the rate of growth recorded over the
past twenty years. Much of this growth could be attributed to the increase in
popularity of more expensive organic produce and luxury items. The major
supermarket operators have responded to consumer’s increasing demands for high
quality produce with the release of brands such as Sainsbury’s ‘Taste the Difference’,
Tesco’s ‘Finest’ and Asda’s ‘Extra Special’. However, it must be noted that the
increases that have been recorded in the short term are likely to reflect the strong
economic growth over the past five years and general increases in household
disposable income.
.06 If the economy was to enter into a recessionary period in the future then this growth
may not be as significant given that spending on luxury items would be the first to be
hit. In fact between the recession in 1980 and 1984 expenditure on convenience
products fell by 6%. During the next recession in 1991 and 1995 convenience
expenditure also fell by just over 2%. This would appear to suggest that recessionary
periods may have an influence on the overall level of growth recorded in convenience
goods shopping.
.07 MapInfo recognise that it is inaccurate to focus on short term growth which may not
reflect the true periods of growth and decline. They state that at present the most
tatistically robust estimate for growth in this sector is for the period 1993 to 2003
.08 In 1983 the average spend on comparison (non-food) goods was just £913 per capita
nd
2
2
s
when the annual growth rate averaged 0.9%. MapInfo suggest that the strong
growth recorded recently appears to be unsustainable in the longer run similar to the
boom in the 1980’s which was then followed by a period of slower growth.
Comparison Goods
2
per annum. This represented just 38% of total retail expenditure and was well behi
average expenditure on convenience goods. However, there has been significant
5

growth in comparison goods expenditure since 1983 which now means that
comparison goods expenditure represents 64% of retail expenditure.
In 1992, more was spent on comparison goods than convenience goods for the first
time since records began in 1964. By 2003, the average expenditure on compa
goods had reached £2,762 per capita. This represented a growth of over 200% in
just 20 years. This equates to an annual average growth of 5.0% compared to
0.5% recorded in com
2.09
rison
the
parison goods.
h
the
.11 However, despite the peaks and troughs recorded, the most important fact is that in
2.12
tres such
as Cheshire Oaks and The Trafford Centre. In fact, all of the major supermarket
the future growth in retail expenditure will be primarily
focused on non-food goods. Therefore, we have witnessed the shift in emphasis
Asda
Implications of Future Growth
2.14
t
2.10 Similar to convenience goods, the growth recorded over the twenty year period
reflects the general economic performance and growth in disposable income. At the
height of the economic boom in the mid to late 1980’s growth was recorded as hig
as 8.3% in 1986. By 1991 growth had fallen to just 0.1% reflecting the onset of
recession and increasing interest rates. By the mid to late 1990’s growth had
recovered significantly with the latest high recorded in 2000 with 8.2% growth.
2
the last 20 years growth on non-food expenditure has trebled. In fact, spending in
2003 on comparison goods per capita at constant prices was over four times larger
than spending on the same basis in 1964.
With this in mind, it is not surprising to discover that major retail development has
been driven by non-food retail development including regional shopping cen
operators now recognise that
within larger supermarkets seeking to provide more space for the sale of comparison
goods. This has been most successfully achieved within Asda whereby the growth of
the Asda George brand has now resulted in the development of stand alone Asda
George stores selling non-food goods only. One such example is the recent
George store at Manchester Fort Retail Park.
2.13 MapInfo recognise that the strong growth recorded recently will be unsustainable
particularly as the economy begins to slow. Despite this, it is anticipated that the
average rate of growth recorded through to 2016 will still be between 3.9% and 3.4%
per annum.
In order to examine the potential implications of future expenditure growth, MapInfo
have provided forecasts for UK consumer spending which are based partly upon pas
6

trends but also on expected changes on other economic variables. The forecasts
recognise that the short-term growth trends for all goods, especially compariso
goods are unsustainable and that some correction is necessary. However, MapI
n
nfo
expect price falls to continue for products such as electronics and clothing which will
2.15
Figure 2.2: Average Annual Forecast Growth Rates
continue to boost sales.
On this basis, MapInfo have provided forecasts which are set out below.
Convenience Comparison Total 2004-2006 1.1% 3.9% 2.9% 2004-2011 1.2% 3.5% 2.7% 2004-2016 1.2% 3.4% 2.7%
2.16
mparison goods expenditure. In
fact, in the next twenty years, expenditure on comparison goods is set to double
ctual and Forecast Expenditure Per Capita per Annum
If we project these forecast growth rates through to 2021, it is evident that growth will
still be significantly focused on comparison goods. From Figure 2.3 below, it is
evident that by 2021, total expenditure will have increased by 61% to £7,005 per
capita per annum. The anticipated growth recorded for convenience goods will be
24% compared to the 83% growth recorded in co
based on current forecasts. This has important implications for the modelling of
future retail ‘needs’ which is set out in detail later on in this study.
Figure 2.3: A
2003 2011 2016 2021 Convenience £1,584 £1,743 £1,850 £1,963 Comparison £2,762 £3,609 £4,266 £5,042 Total £4,346 £5,352 £6,115 £7,005
The Retail Market
The retail market has been the subject of some profound changes over the recent past. The mix of social and economic conditions which prevailed in the 1980’s and 1990’s triggered the arriv
2.17
al of a much more discerning consumer driven not just by value for money but also increased selectivity and a demand for higher quality
entury where value for money is increasingly important. These conditions continue to
e consumer loyalty has become a ital ingredient in the success to retailers. Increasingly, successful shopping facilities
h ve to fulfil t stination l ge part thi s providing a w f nd leisure fa able to attract and the interest of the entire fam return such schem nefit not only from wider
shopping environments. This trend has continued through the turn of the C
impinge on the nature of today’s retail market wherva he role of a de ocation. In lar s meanide range o shopping a cilities retain
ily. In es be much
7

catchment areas, but also from substa longer shopping trips. Effectively, shopping is fast becoming the nation’s key leisure activity. However, the consumer is
one
2.18 e
n rising
stand alone food superstores, accounted for another 8.9 million sq. m or 15% of the
2.19 Other shopping malls in off-ce ocations ed about 0.8 million sq. m in 2000
c only 0.1 million sq. m in 198 f town reTrafford Centre eshire ompris than 80,the period but incre n sq. m by the end of 199 . Furthermore, with the high rate of residential construction during the 1980’s, local district centres expanded to an estimated 6.6 million sq. m in 1998.
.20 The decline of the traditional high street, however, should not be assumed to mean
town
e in
2.21
r that
2.22
There is increasing evidence that polarisation of centres is occurring across the UK, whereby large, more dominant
ilarly, the more attractive and accessible town centres are likely to
ntially
still keen to experience increases in choice and conveni9nce. This has led to the development of large format stores which seek to offer a wider range of goods inconvenient location supported by free parking.
As a result, over the last twenty-year period, the retail property landscape across thUK has changed dramatically. Since 1980, the rise of out of town retailing was unparalleled, and by 2000, the amount of retail park space had grown to 4.6 milliosq. m, representing 7.5% of all the UK retail stock. Superstores, mainly comp
total retail stock.
ntre l providompared with 0. Out o gional malls such as
and Ch Oaks c ed less 000 sq. m at the start of ased to nearly 1 millio 8
2
the decline of overall town centre trading. New shopping schemes in centres or onthe edge of town centres have brought not only more efficient space into the retail hierarchy, but introduced a quality of managed shopping environments, which couldnot be created within the context of the high street. Managed shopping malls incentres totalled 6.5 million sq. m at the beginning of the 1980’s. In 2000 they comprised over 10.5 million sq. m, a 60% rise. As a result 18% of all retail spacthe country is now to be found in shopping malls located within town centres.
As a whole therefore, the amount of retail space in town centres including both traditional and new space has not declined. On the contrary it has risen from around35 million sq. m in 1980 to nearly 39 million sq. m by 2000, a rise of 11% oveperiod.
However, much of this activity has taken place in higher order centres where largescale redevelopment schemes have been driven by high street national multiples seeking to increase representation and market share.
retail markets (both in terms of town centres and out of town malls) have continued to outperform more average locations in retail growth terms. The reduction in the amount of new floorspace coming through the out of town development pipeline (as more restrictive planning policy bites) is likely to further inflate rents in the best retail parks and prime locations, adding further to the divide between prime and secondaryretail property. Sim
8

perform better than the less attractive centres. Town centre expansion however will allow new opportunities to develop within the heart of towns which could dilute saleand rental performance in some locations, whilst encouraging it in others. The effectsof such development on existing business need to be carefully monitored.
In the next twenty years the retail landscape will cont
s
2.23 inue to evolve. Taking the
anticipated rise in the volume of retail sales, the expected trend in sales productivity, .
2.24
on
names are becoming increasingly vulnerable to takeovers. The merger and
n
d to
2.26
an
increasing number of outlets for specialist or niche goods, rather than rely on
to
space.
2.27 approach to new
investment for many key national retailers. Marginal locations within centres, and
as well as the retail schemes already in the development pipeline, it is reasonable toexpect further increases in total retail floorspace in major retail locations in the future
Certainly, future policy needs to be based on creating a balance between accommodating the dynamism of the market place, its increasing competitiveness and the widening gulf between differing shopping locations.
Trends in Non-food Retailing
2.25 As highlighted above overall, expenditure on non-food goods is increasing year
year, providing a stable platform for the domestic industry to grow. International
market conditions and price deflation in some key sectors mean that many high street
consolidation of companies could lead to fewer national multiple outlets competing i
the market place during the course of the local plan review. It will make those
retailers still in the market increasingly location-sensitive. This will increase demand
from multiples for prime and ‘super-prime’ pitches, but reduce the attractiveness of
other areas. The net result may be an increased occupation of secondary town
centre shopping units by non-retail uses. Planning policy has already responde
this trend by providing more flexible policy stances relating to secondary retail activity
and changes of use.
Key retailers, such as Marks & Spencer and the Arcadia Group, are reducing the
distribution of their operations and others, such as C&A, have left the domestic
marketplace altogether. This is a result not only of price deflation, but also of
changing shopping patterns. Many consumers are now prepared to shop in
household names, as was the case previously. The decision by Asda and Tesco
stock clothing has also had a major impact on this core area of high street trade. As
demand from these major anchor retailers decreases for representation in smaller
town centres, more lower-order retailers and food/drink uses will occupy town centre
Increased sensitivity over future viability will mean a cautious
9

prime locations within smaller town centres, will be increasingly rejected. Many
investment decisions will be influenced by the scale of commitment from other
2.28
. The
of between 2,500 and 5,000 sq. m. Demand is weakest in
the size range where supply is greatest (of about 1,000 sq. m).
2.29
rder to
.30 In addition, the DIY market has grown in strength considerably, in line with the
ween
ed
e
n, at
tlet Centres has subsided considerably, suppressed
by increasing planning restrictions. However, these and other successful regional
se
retailers; developers will increasingly need to promote large town centre
redevelopment schemes if they are to attract high quality retailers.
Retail Warehousing
In terms of retail warehousing, the market is becoming increasingly sensitive to
quality and location. Many retail warehouse operators will now only accept units on
major mixed-use retail parks, leading to a decline in the popularity of free-standing
units and older retail parks that are located away from the regional road network
market is now dominated by the likes of Homebase, Ikea, Big W and B&Q, seeking
units of 10,000-12,000 sq. m; and Matalan, Comet, Currys, Decathlon and Focus
seeking flagship stores
Many retail parks are unable to accommodate this new demand owing to the
configuration of the existing units. In the context of low demand for the smaller ‘bulky
goods’ units, many investors are seeking to create greater flexibility by incorporating
mezzanine levels into existing outlets, and to remove restrictive conditions in o
increase the number of ‘non-bulky’ goods operators able to utilize the space.
Because more fashion wear retailers are experimenting with lower cost warehouse
formats, many developers are seeking to provide fashion-led out-of-centre retail
parks (‘shopping parks’).
2
expanding DIY and home improvement culture. The market grew by 51.2% bet
1996 and 2000 and in 2000 alone consumer spending in the market sector increas
by 2.2%. However, the Keynote Market Review (August 2001) anticipates that
growth in the DIY market is slowing and more gradual growth is predicted for th
period 2001 to 2005. Despite this, spending is forecast to reach £11 billio
current prices, by 2005.
2.31 The demand for new Factory Ou
shopping centres, such as Merry Hill, are under pressure to extend and to increa
their overall attractiveness by introducing complementary non-retail uses.
Growth in Restaurant, Bars and the wider Café Culture
10

2.32 er
over the world.
Japanese sushi, Spanish tapas and Indonesian restaurants have joined the more
t
2.33 y Note found that in 2004 the usage of traditional branded
chains continued to decline despite their high profile in the market. Usage of the
t
r fast
ed
the UK’s and the world’s largest restaurant chain announced
that it would stop offering super size meals to help tackle obesity. Given these
n
• Busier working lifestyles - and the rising number of dual income families are
. As a result, eating out
has become a regular feature rather than a luxury of the working week. In fact,
f
ure
diversification - menu diversification and changes are now almost regular
features of most branded chains. Pub restaurants in particular have started to
In the UK the choice of restaurants is characteristically broad as a result of consum
willingness to adapt to new styles of eating and drinking from all
traditional curry houses. In addition, French, Italian and Greek restaurants can be
found in the majority of British towns. Frequent usage of restaurants is closely
correlated to social grade and income, with 83.6% of As and Bs visiting restaurants in
the evening in the last 12 months. Another important factor is whether both partners
in the household are working, which makes it practical and affordable to eat ou
regularly.
Research conducted by Ke
leading restaurant brand, Pizza Hut, decreased by 6 percentage points like mos
other chains, Brewer’s Fayre, Harvester, Little Chef, Beefeater etc recorded a lower
penetration than three or four years earlier. Since 2001, growth in the restaurant
meals market has been relatively slow as a result of the slow down in demand fo
food. This is due partly to market saturation, the obesity debate and the rise of
healthy eating values. Fast food chains are remedying this problem with improv
menus, and McDonalds,
initiative and rising consumer demand for eating out, Key Note forecasts that
between 2006 and 2008, growth in the restaurant meals market will remain betwee
5% and 5.9%. Key factors impacting upon growth in the future will include:
undoubtedly reducing the time available for hoe cooking
restaurants are targeting these cash rich/time poor customers
• Eating out as a leisure activity - for many customers, eating out is now part o
the leisure experience. The location of restaurant outlets has encouraged this
trend, for example it is common for these outlets to be situated close to leis
venues and cinema complexes. Eating out associated with travel is also on the
increase.
• Menu
introduce broader base menus and more frequent menu changes as a means of
maintaining customer interest in this increasingly competitive market.
11

• Greater choice of restaurants - new types of restaurant emerge regularly in
UK and often profit from the open minded nature of British with regard to food
and drink. Many cities and large towns now offer a wide range of culinary st
Key Note states that in 2004 the total UK restaurant meals market was worth £12.4
billion, a rise of 3.3% on 2003. Overall the market is expected to grow by 23%
between 2004 – 2008 to £15.25 billion. Between 1999 and 2008, Key Note for
that the value of the UK restaurant meals market will have grow by 49.2%. At 23%,
the growth forecast for the 5 years between 2004 – 2008 is faster than the in
the
yles.
2.34
ecast
crease
experienced in the previous five years, 17.4%.
2.35 Ano
alco
hote distinction
between a pub and a restaurant or café is likely to become even more blurred. For
ord e.
Ano
unli
rest US than in the UK, might use a new more liberal licensing regime to
move into the drinks market that is currently dominated by pubs
2.36 For
eati
As f young
adults aged between 18 and 35 have no problem finding employment and both
mor
cha
and eating out concepts such as tapas or sushi bars. This is partly derived from
for the
n
ther profound change taking place in the UK is the licensing of outlets selling
hol. This is likely to change the character of many outlets, such as pubs and
ls, which already play a major role in the eating out market. The
example, a pub could well consider moving into the market for take away food, in
er to provide customers with the option of having a drink and taking a meal hom
ther possibility is that the fast food majors which have traditionally been
censed in the UK, historically being attributable to alcohol being even more
ricted in the
ecasts for continuous growth in the restaurants market is based on the fact that
ng out has become a major element in the lifestyles of the younger generations.
a result of nearly a decade of economic growth in the UK, the majority o
partners are increasingly likely to work full time. This makes the eating out option
e attractive than ever. Restaurants in the UK will also continue to benefit from a
racteristic of the British – a willingness to experiment with new foods and drinks
foreign travel which is also increasing and expanding to new countries, making it
possible to introduce new styles of cuisine. This clearly has major implications
expansion of the restaurant and café industry within St Helens which has witnessed a
dramatic increase in the past five years.
The Growth in Electronic Commerce
2.37 Many consumers who previously shopped in town centres and retail parks are now
using the Internet for some of their purchases. This trend is set to continue, although
the exact impact that e-commerce will have on the high street has yet to be
established accurately. In 2001, total on-line sales in the UK were estimated at £4b
12

(Key Note, ‘E-Commerce’ September, 2002) which could rise by up to £7.5bn by
2005, an increase of 75%.
The most popular on-line purchases are currently books, CD’s, travel, food and
groceries, and computer products (Key Note, 2002). Technology is currently being
developed by companies such as Amazon that will allow on-line b
2.38
rowsing of books
which is likely to result in this sector making further in-roads into the on-line market.
2.39
2.40
etail units than before, as more is directed
to e-commerce. The effect of this will be to reduce spending growth and expenditure
e
2.41
of
tailing.
e
The clothing market has been slow to see the benefits of e-commerce with most
people still preferring to try on clothes prior to purchasing. Security concerns are also
still a major issue affecting all sectors of the market, with recent surveys suggesting
that 24% of people do not feel comfortable giving credit card out details over the
internet (Key Note, 2002).
The food and grocery market is also growing fast and some estimates suggest that
around 25% of the grocery market will be sold on-line by 2008 (The Institute of
Grocery Distribution, 2001).
As access to the Internet increases through digital televisions and mobile telephones,
proportionally less money will be spent in r
capacity. In turn, this will:
• Affect the investment decisions of existing retailers, and over time, further reduc
the demand for retail premises; and
• Lead to the creation of new ‘sui generis’ retail collection centres on the edges of
major conurbations. Experiments with 10,000 – 20,000 sq. m units are already
underway.
National Trends in Retail Trading Formats and Investment Planning policy has reduced out-of-centre development in recent years although
recent trends indicate an upsurge in retail warehouse development. Indeed, the
amount of retail warehouse park floorspace in the development pipeline at the end
2003 reached 2.7 million sq m. This was an increase of some 930,000 sq m the end
of 2000, although is almost 20% below the peak level in the 1990s. However, it is
significant to note that national planning policy (PPS6) intends to challenge the
format driven approach to re
2.42 However, the demand for retail warehouses remains strong although it is considered
that obstacles in obtaining planning permission restricted development in the lat
13

1990’s. Despite this, current completion levels are anticipated to remain at an annual
level of between 300,000 sq m (gross) to 350,000 sq m (gross). Figure 2.4 illustrates
e Parks in the Pipeline 1992-2003
the recent uplift in the amount of retail warehouse park floorspace that has been
coming forward.
Figure 2.4: Retail Warehous
0
0.5
3
3.5
1.5
2
2.5
1
Floo
rspa
ce (m
illio
n sq
m)
Proposed
1992 1993 1994 1995 1996 1997 1998 1999 2000 2001 2002 2003
Year
With Planning ConsentUnder Construction
The total amount of floorspace in the shopping centre development pipeline reac
just over 5.4 million sq m (gross) by th
2.43 hed
e end of 2003. Town centre located schemes,
at 4.1 million sq m (gross), accounted for 75% of this total. This marks a significant
increase on the 1993 proportion, when town centre located schemes accounted for
just 64% of the development pipeline (Figure 2.5).
14

Figure 2.5: Change in Location of New Shopping Centre Floorspace 1992-2003
Figure 2: Change in Location of New Shopping Centre Floorspace, 1992-2003
67.964.2
67.7 70.4 73.382
85.991.8 90.4 90
85.8
75.4
32.135.8
32.3 29.6 26.718
14.18.2 9.6 10
14.2
24.6
0
10
20
30
40
50
60
70
80
90
100
1992 1993 1994 1995 1996 1997 1998 1999 2000 2001 2002 2003
Year
Prop
ortio
n of
Tot
al S
hopp
ing
Cent
re
Deve
lopm
ent P
ipel
ine
(%)
Town CentreOut of Town Centre
However, it is significant to note that the proportion of out of town floorspace at the
end of 2003 (25%) is significantly higher than the low of only 8% at the end of 1999.
Clearly, Figure 2.5 highlights that a greater proporti
2.44
on of shopping centre
development is proposed/constructed at out of town locations, which is similar to the
position prior to 1996.
2.45 Therefore, both Figure 2.4 and Figure 2.5 indicate uplift in out of town development,
after a period where out of town development saw a downturn in development, most
notably between 1997 and 1999.
The St Helens Perspective
2.46 In order to understand the trends that have occurred in St Helens we have reviewed
information provided by Promis who examine retail development performance
throughout the UK. Figure 2.6 below illustrates the type of retail development that
has occurred in St Helen’s since 1993. From this information it is not surprising to
discover that St Helen’s has seen significant development in the retail warehouse
sector particularly since the turn of the century. In fact since the last study was
prepared, there has been significant development primarily focused at the
Ravenhead Retail Park, which is currently being extended.
2.47 In 1993 St Helens Town Centre comprised approximately 80,825 sq m (870,000 sq
ft) of town centre floorspace (according to Promis). However, by 2004 this had
15
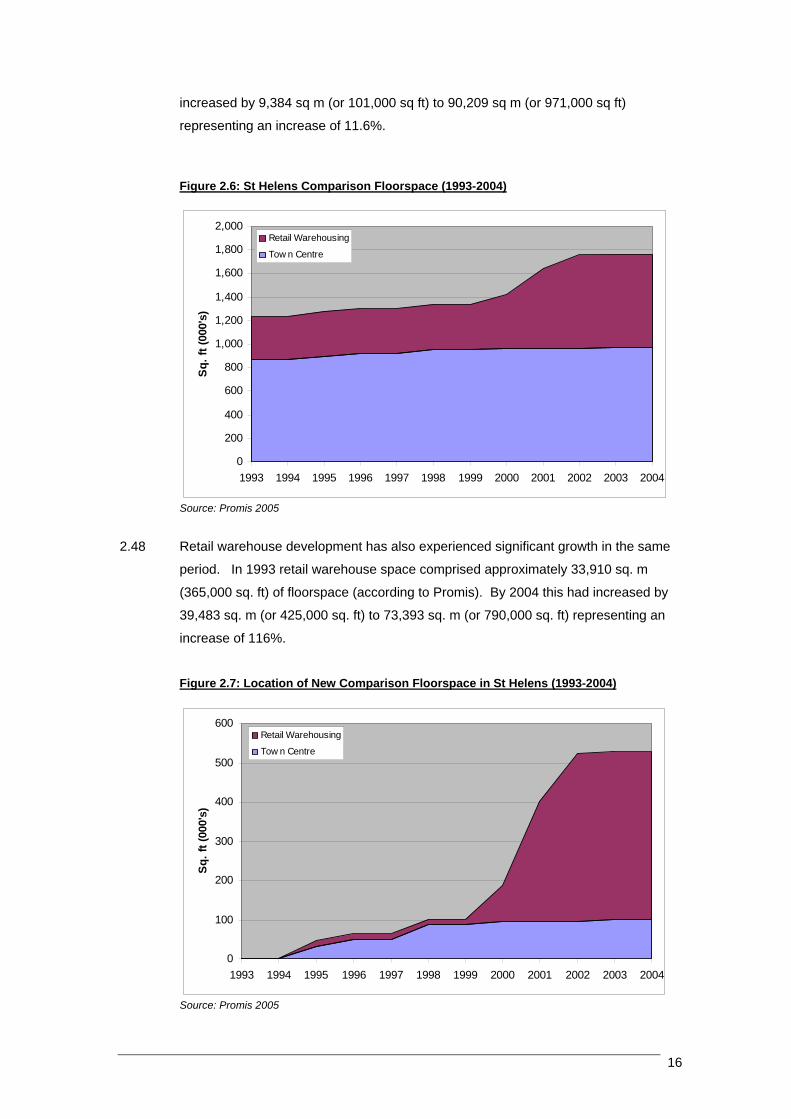
increased by 9,384 sq m (or 101,000 sq ft) to 90,209 sq m (or 971,000 sq ft)
representing an increase of 11.6%.
Figure 2.6: St Helens Comparison Floorspace (1993-2004)
0
200
400
600
800
1,000
1,200
1,400
1,600
1,800
2,000
1993 1994 1995 1996 1997 1998 1999 2000 2001 2002 2003 2004
Sq.
ft (0
00's
)
Retail Warehousing
Tow n Centre
Source: Promis 2005
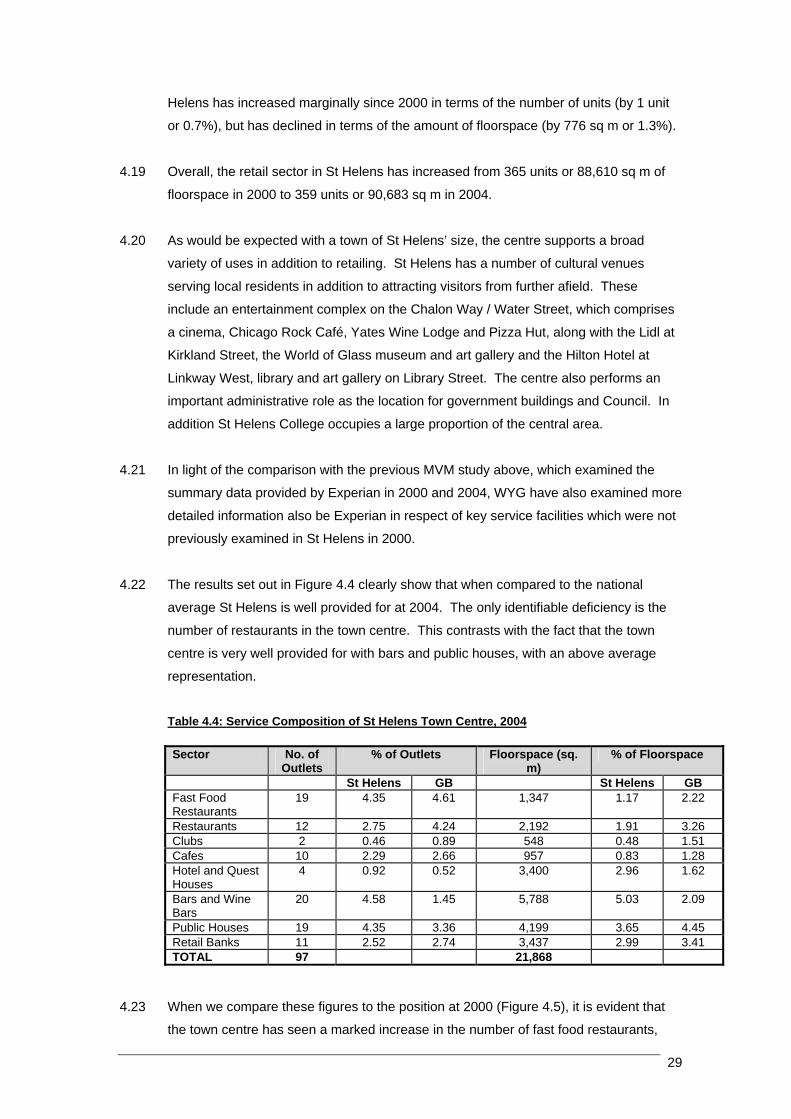
Retail warehouse development has also experienced significant growth in the same
period. In 1993 retail w
2.48
arehouse space comprised approximately 33,910 sq. m
(365,000 sq. ft) of floorspace (according to Promis). By 2004 this had increased by
igure 2.7: Location of New Comparison Floorspace in St Helens (1993-2004)
39,483 sq. m (or 425,000 sq. ft) to 73,393 sq. m (or 790,000 sq. ft) representing an
increase of 116%.
F
0
600Retail Warehousing
Tow n Centre
100
200
300
400
500
Sq. f
t (00
0's)
1993 1994 1995 1996 1997 1998 1999 2000 2001 2002 2003 2004
Source: Promis 2005
16

2.49 of the
ver, by 2004 this had risen to 45%, an increase
of 50%. Therefore, it is not surprising to discover that 81% of all comparison goods
on-food) retail development that has occurred since 1993 has been retail
ionally and nationally.
In 1993 the total provision of retail warehousing in St Helen’s represented 30%
total retail floorspace provision. Howe
(n
warehousing confirming the trends that have occurred reg
17

3 PLANNING POLICY FRAMEWORK Introduction
Given that this study seeks to provide important background evidence that will a
in fu
3.01 ssist
the ture development of the LDF process, it is important at this stage to reflect
upon key policy advice and how the national guidance may impact upon the
development of policies locally. The key texts, which have been considered as part of
our study, include:
• Planning Policy Statement 6 ‘Planning for Town Centres’;
• Existing and emerging Regional Planning Guidance for the North West;
• The St Helens Unitary Development Plan
Planning Policy Statement 6 – Planning for Town Centres (March 2005) 3.02 Paragraph 1.3 of PPS6 notes that the Government’s key objective for town centres is
to promote their vitality and viability by:
• Planning for the growth and development of existing centres; and
• Promoting and enhancing existing centres, by focusing development in such
centres and encouraging a wide range of services in a good environment,
accessible to all.
These other objectives should be taken into account in the context of paragraph 1.3
these include:
• Enhancing customer choice by making provision for a range of shopping, leisure
and local services, which allow genuine choice to meet the needs of the entire
community, particularly social excluded groups
• supporting efficient, competitive and innovative retail, tourism and other sectors,
with improving productivity
• improving accessibility ensuring that existing or new development is or will be
accessible and well served by a choice of means of transport
3.03 In order to deliver the Government’s objectives, paragraph 2.1 notes that
development should be focused in existing centres in order to strengthen and, where
appropriate, regenerate them.
3.04 A positive and proactive approach to planning is encouraged by the guidance, with
paragraph 2.16 noting that local planning authorities should work in conjunction with
18

s ess the need for new floorspace for
re and other main town centre uses, taking into account both quantitative
tions.
ns. In deprived areas which lack access to a range of services will be clear and demonstrable benefits in identifying sites for
appropriate development to serve communities in these areas, additional weight should
3.06 tail development when preparing its
development plan documents, paragraph 2.34 notes that a local planning authority
ses of goods to be sold, within the broad ries of comparison and convenience goods…;
3.07 In tecon al planning department will be to provide for consumer choice by nsuring that:
vitality and viability of town centres and the application of the sequential approach, to improve accessibility for the whole community; and
3.08 The ragraph 2.36 that in addition to the above, other
s
be o
nsure
tion of the centre and its catchment. Appropriate
development should be located in the right type of centre to ensure that it fits and
takeholders and the community to, inter alia, ass
retail, leisu
and qualitative considera
3.05 In assessing the need and capacity for additional retail and leisure development,
paragraph 2.33 notes that: ‘local planning authorities should place greater weight on
quantitative need for additional floorspace for the specific types of retail and leisure developments. However, local planning authorities should also take into account of qualitative consideratioand facilities, and there
be given to meeting these qualitative deficiencies.’
In assessing quantitative need for additional re
should assess the likely future demand having a realistic assessment of:
• Existing and forecast population levels;
• Forecast expenditure for specific clascatego
• Forecast improvements in productivity in the use of floorspace.
rms of qualitative need, the guidance states at paragraph 2.35 that “a key
sideration for a loce
• An appropriate distribution of locations is achieved, subject to the key objective of promoting the
• Provision is made for a range of sites for shopping, leisure and local services, whichallow genuine choice to meet the needs of the whole community, particularly the needs of those living in deprived areas.”
guidance further states at pa
con iderations may be taken into account including the degree to which shops may
vertrading.
3.09 The guidance in paragraph 2.04 states that Local Planning Authorities should e
when selecting suitable sites for development that the scale of opportunities identified
are related to the role and func
compliments its role and function.
19

3.10
o consider a indicative upper limit for the scale of
development likely to be miscible in different types of centres.
3.11
ly
r
opment in
relation to the role and function of the centre; and then
e given to sites that are or will be well
• are or will be well served by
a high
likelihood of performing links with the centre.
3.12
propriate range of sites to allow the accommodation of the
ed, it also recognises that Local Planning Authorities should be flexible
operators. It is also re
term
3.13 n considering potential sites for allocation either in edge of centre or out of
ld
ment. In addition Local Planning Authorities should ensure that
locations are accessible when selecting appropriate sites for allocation. These
of
d
d congestion.
In terms of local centres, given their characteristics the guidance considers that it
would be inappropriate as a location for large scale new development. Therefore
Local Planning Authorities are t
PPS6 adopts the sequential approach to site selection whereby Local Planning
Authorities should select appropriate sites for allocation within identified centres
where identified need is to be met. All options in town centres should be thorough
assessed before less central sites are considered for development for town centre
uses. Paragraph 2.44 sets out the sequential approach required. A development
should be considered in the following order:
• First locations in appropriate existing centres where suitable site or buildings fo
conversion are, or are likely to become, available within the development plan
document period, taking account of an appropriate scale of the devel
• edge of centre locations with preferenc
connected to the centre; and then
out of centre sites with preference given to sites that
a choice of means of transport and which are close to the centre and have
When considering sites Local Planning Authorities should in consultation with
stakeholders identify an ap
identified ne
and realistic when drawing up such sites and should discuss this with developers and
cognised that Local Planning Authorities should have
appreciation for business models and should take into account business models in
s of scale, format, car parking provision and the scope for desegregation.
Whe
centre locations the statement also suggests that Local Planning Authorities shou
assess the impact that that potential development could have on identified centres
within the catch
should be
• Whether the site is or will be accessible or well served by a choice of means
transport, especially public transport, walking and cycling, as well as by car, an
• the impact on car use traffic an
20

Regional Planning Guidance for the North West (March 2003)
Regional Planning Guidance RPG13 (now RSS) for the Nort
3.14 h West provides the
broad development strategy for the period to 2016. Published in March 2003, the
uality
3.15 ich
tre management initiatives and other
strategies should “recognise the continued need to protect, sustain and improve the
io Cen
3.16 Poli within and on the edge of
st
3.17 commerce, residential, retail, helps redu
hemes
3.19 he
Retailing Chapter of the adopted UDP. The overall strategic approach which is
opping centre as shown on the Proposals Map and listed in Schedule 2 will be permitted, subject to there being no conflict with other Plan Proposals and
li
I. eak flows of traffic, including heavy
goods vehicles;
guidance seeks to develop the region in a sustainable way to ensure that the q
of life for residents, the business community and visitors will be maintained and
enhanced.
Policy EC8 relates to town centres, retail, leisure and office development, wh
states that development plans, town cen
reg n’s town and city centres, including the role of Manchester City and Liverpool Citytres as regional shopping centres”.
cy EC8 also notes the need to “encourage new retail…
exi ing defined town and city centre boundaries (primary shopping areas)”.
It is also noted in paragraph 5.40 that “incorporating mixed uses like business and
leisure and culture into developments in central areas to keep them alive both day and night, contributes to urban regeneration and
ces the need to travel”.
3.18 However, it states further that it is important: “that edge-of-centre mixed use sc
with a strong commercial element do not undermine the vitality or viability of nearby centres or the shopping facilities in rural areas”
The St Helens Unitary Development Plan
Policies relating to town centre developments and retailing are contained within t
identified in Policy S5 of part 1 of the UDP seeks to concentrate new retail
development within existing centres, an approach advocated at both the national and
regional level. In dealing with such development, Policy RET1 states that:
Retail development and associated service uses in, or immediately adjacent to, an established sh
Po cies and provided that, in particular, the following criteria are satisfied:
The site enjoys good access to the highway network and is capable of satisfactorily accommodating the estimated p
21

II. the layout provides adequate car parking, cycle parking and servicing tly located in
relation to public transport and pedestrian routes;
II
3.20
and Earlestown Town Centre. Fifteen other local shopping centres are
also identified within Schedule 2.
3.21
Any proposal for large scale retail development outside an existing centre will be
improvement of the urban areas and does not undermine the plan strategy;
the diversion of trade and/or deterrence of investment;
wn centre sites are available, followed by edge-of-centre sites, district and local centres;
nmental effects or undue loss of amenity to neighbouring residential areas and the surrounding locality;
g
.22 Whilst Policy RET2 requires the developer/applicant to apply a sequential approach
ore
recent advice set out in PPS6 highlighted above.
arrangements that comply with Policy GEN9 and is convenien
I. and the scheme will not result in harmful environmental effects or undue of loss of amenity to local residents.
In dealing with Policy RET1, the two main shopping centres identified are St Helens
Town Centre
Whilst the plan seeks to promote further retail and service development within
established centres, Policy RET2 provides a criterion based policy dealing with future
out of centre retail development. The policy states that:
considered against the following criteria:
I. it makes a positive contribution to the economic and environmental
II. it is not located within the Green Belt; III. it will not cause significant harm to the viability and vitality of any shopping
centre identified in Schedule 2 and shown on the Proposals map, or in adjacent authority areas, through
IV. it is readily accessible by both public and private transport; V. evidence that a sequential approach to site selection has been adopted which
demonstrates firstly, that no suitable to
VI. there is no significant harmful enviro
VII. the proposal will have good access to the highway network capable of satisfactorily accommodating the estimated peak flow of traffic, includinheavy goods vehicle, and provide adequate car parking and servicing (GEN9)l and
VIII. the effect on overall traffic patterns
3
to site selection, it is evident that the policy does not specifically require a
demonstration of ‘need’. Therefore, any future update of core policies relating to out
of centre retail development would have to include a criteria which reflects the m
22

3.23 rontages
and s as
they w .
3.24 Policy ps, restaurants and cafes and sets out a number
3.25 and vehicle hire services and again provides
3.26
ment in St Helens
can be improved in the future and that existing features of quality are retained. As
etween the security needs of the industry and the need to protect amenity. The
policy il will
require de
doors
3.27 In summa vel
will have t
importantly, PPS6 now requires local authorities to define a Primary Shopping Area
which is likely
UDP. Ho
reflect the In addition, it will also be
impor is a
clear disti
defin
Policy RET3 deals with amusement centres in the secondary and primary f
tates that whilst such centres are generally accessible in the secondary are
ill not be permitted in the primary shopping areas
RET4 deals with hot food sho
of criteria that have to be satisfied relating to local amenity, hours of opening and
traffic issues.
Policy RET5 deals specifically with taxi
a series of criteria that will need to be satisfied.
Finally Policy RET6 seeks to deal with the design of existing shop fronts and new
developments. The policy seeks to ensure that the built in environ
part of the policy, the Council recognise that there needs to be a balance struck
b
also deals with access for those with special needs whereby the Counc
signs to incorporate appropriate measures such as ramps, automatic
, hand rails etc. to facilitate access.
ry, it is evident that the development of future plan policy at the local le
o be updated to reflect the recent guidance issues in PPS6. More
to reflect the existing defined Central Shopping Area in the adopted
wever it will be important that the boundary of this area is reviewed to
definitions set out in Table 2 of annex A in PPS6.
tant to review the extent of the Prime Shopping Area to ensure that there
nction between the primary frontage and the primary shopping area as
ed in PPS6.
23

4. SSESSMENT OF VITALITY AND VIABILITY
his section of the report assesses the vitality and viability o
A 4.01 T f St Helens and Earlestown
town centres with reference to the indicators in PPS6, chapter 4.
T
.02 Town centres have an important role to play in any Borough. They form a focal point
fo
w ure, education and transport.
P e
im
lo
st
id
T .04 It is important that St Helens and Earlestown remain competitive with their neighbours
a
ce sses
an
m
ef
4.05 T
im
• They help to asses the success of retail policies in the existing St Helens Unitary
Development Plan and will assist in the formulation of appropriate policies in the
Unitary Development Plan when the plan is reviewed.
• They provide a starting point for any retail strategies that may be produced and will
assist with retail planning in St Helens and Earlestown;
• They provide useful base data that will facilitate a process of monitoring that can be
undertaken each year to asses how the town centres are performing over time;
• They allow positive and negative aspects of the town centres to be identified and
appropriate action taken;
he Importance of Town Centres
4
r the community and provide a wide range of services that are accessible to the
hole population including retail, employment, leis
4.03 lanning Policy Statement note 6 “Planning for Town Centres” (2005), emphasises th
portance of maintaining a “healthy” town centre as it helps to foster civic pride and
cal identity and can contribute towards the aims of sustainable development. It also
ates that by monitoring town centres on a regular basis, signs of decline can be
entified early on and remedial action can be taken.
he Purpose of the Health Check
4
nd continue to attract shoppers, visitors and businesses. To achieve this, the town
ntres must continually strive to build on their strengths, alleviate their weakne
d continually improve the facilities they provides to the community. Simply
aintaining the status quo is not an option. Successful town centres must respond
fectively to the changing needs and demands of its users.
he town centre health checks for St Helens and Earlestown serve a number of very
portant functions:
24

• They provide data that can be used to compare the performance of St Helens and
ers’ perception of the towns they allow schemes
and strategies to be drawn up to help improve the town centres for their users.
4.06
information gained on the key indicators that PPS6 ‘Planning for Town Centres’
-
• Retailer representation and intention to change representation;
• Proportion of vacant street level property;
4.07 een informed by a combination of desk top research, ‘on the
town centres and original survey work.
St Helen
4.08 athered as part of this study
riefly examined the findings of the Council’s previous St Helens Town Centre
a
that the town centre wa destination in the sub-
region, both in terms of its function and size. The Council consider its main competitors
b
4.09 The main conclusions of the 2001 report confirm that St Helens town centre shows sign
re
follo 1.
Earlestown town centres to other neighbouring centres in the region and therefore
to ensure that they remain competitive;
• By looking at retailers’ and shopp
These health checks, while focusing specifically on economic factors, also examine
other issues such as transport provision and the environment. They incorporate
suggest should be used to asses the health of town centres. These include:
• Diversity of uses;
• The amount of retail, leisure and office floorspace in edge-of-centre and out-of
centre locations,
• Shopping rents;
• Commercial yields on non-domestic property;
• Pedestrian flows;
• Accessibility;
• Customer views and behaviour;
• Perception of safety and occurrence of crime; and
• State of the town centre environment quality
The assessment has b
ground’ observations of the
s Town Centre Health Check 2001 and 2004
r to compare previous research with the evidence gIn orde
we have b
He lth Check undertaken in 2001 and reviewed in 2004. Overall, the Council found
s an important comparison shopping
to e Wigan and Warrington.
of latively good vitality and viability. In respect of some key indicators we note the
wing conclusions from 200
25

er of vacant units within the Central
Shopping Area, which had been vacant previously for three consecutive
%)
in the number of shops in the town centre, whilst there has been a rise in the
has
• Pedestrian surveys within the town centre indicate a relatively healthy volume
stributed around the town centre similar to patterns in previous
mained constant since 1994;
% since 1996 and
s in Wigan, Widnes, Runcorn and Salford;
eriod 1999/2000 to 2000/20001 by 15%;
hin the town centre by 20% between
espite robbery and violent crime against the person
ng spaces within the town centre has increased;
e has remained constant.
.10 Where possible comparisons have been made with the St Helens Retail and Leisure
.
T HELENS TOWN CENTRE
t Helen’s position within the Regional Hierarchy
4.11
oring system which takes account of each location’s
provision of multiple retailers and anchor store strength.
• Between 1999 and 2001 the Council found there had been a decline in the
number of vacant properties in the town centre by 26%;
• The Council found a fall in the numb
surveys;
• Between 1999 and 2001 the Council found that there has been a decline (-4
financial and professional services, food and drink establishments, private
offices and public buildings;
• The Council found that the number of multiples stores in the town centre
increased from 47 in 1996 to 59 by 2001;
of shoppers di
studies;
• Yields have re
• Zone A rent values for the town centre have increased by 43
outperform rent
• Increased planning application in the p
• Decline in the theft from motor vehicles wit
1999 and 2001, d
increasing;
• The total number of car parki
• The number of bus routes out of the town centr
4
Study 2000-2016 undertaken by WYG (previously MVM Planning Ltd) in March 2001
S
S
Table 4.1 below illustrates St Helens’s position within the hierarchy of town centres in
the surrounding area, by reference to the Management Horizons Europe’s UK
Shopping Index (2003/2004). This rank the top 1,672 shopping venues in the UK,
including town centres, stand alone malls, retail warehouse parks and factory outlet
centres, through a weighted sc
26

Figu 4re .1: The Sub-Regional Shopping Hierarchy
Ce rent Rank 2003-2004 Rank 2000-2001 Change in Rank
Manchester 2 3 +1 Liverp 14 13 -1 ool Southport 62 77 +15 W inarr gton 83 91 +8 St Helens 92 111 +19 Wigan 111 121 +10
Manageme
4.12 It can be se
ranked 92 it within the top 6% of all UK
sho
that the
Genera
4.13 St Hele ot Road), the A570
(Co r
4.14 The cen et,
Hardsh Barrow Street. The prime shopping frontage in addition to the
Chu
of B g y
two department stores, Marks and Spencer and T J Hughes. The Church Square
long Baldwin Street, Claughton Street, Westfield Street and Duke Street. These
st the
in
lpful as comparisons can be
made with other centres as well as national averages.
nt Horizons Europe: UK Shopping Index (2003/2004)
en that out of the 1,672 shopping venues surveyed nationally, St Helens isnd in the 2003-2004 period, which places
pping venues. During the 2000-2001 periods, St Helens was ranked 111th showing
centre has improved over the last two years.
l Description of St Helens Town Centre
ns Town Centre is formed at the junctions of the A58 (Presc
rpo ation Street) and the A571 (College Street/ King Street).
tre is focused on the pedestrianised area of Church Street, Market Stre
aw Street and
rch Square and Hardshaw Centre includes Church Street, Ormskirk Street and part
rid e Street. The Hardshaw Centre consists of a single storey mall anchored b
Shopping Centre comprises four interlinked arcades, which is anchored by Boots and
BHS and also contains a large indoor market. The centre extends further to the south
a
areas perform a more secondary role.
Diversity of Uses
4.15 Tables 4.2 and 4.3 below illustrate the retail composition of St Helens town centre at
2004 and 2000 in terms of outlet numbers and floorspace and compare it again
respective UK national averages for town centres. This is based on GOAD, the
boundary of which is attached in Appendix I. We note that the boundary is different
that previously adopted by Promis and will not also reflect the town centre boundary
the adopted UDP. However, the GOAD information is he
27

ntre, 2004Table 4.2: Retail Composition of St Helens Town Ce xperian Goad (2004)
Sector No. of Outlets
% of Outlets Floorspace (sq. m)
% of Floorspace
GB GB
Source: E
St Helens St Helens Convenience 38 10.6 9.3 21,024 23.2 16.9 Comparison 178 49.6 48.0 48,180 53.1 53.1 Service 110 30.6 31. 14,344 15.8 20.7 1 Miscellaneous 4 1.1 1.4 641 0.7 1.4 Vacant 29 8.1 10.3 6,494 7.2 7.9 TOTAL
Table 4.3: Retail Composition of St Helens Town Centre, 2000
359 100 100 90,683 100 100
Source: Experian Goad (June 2000) updated by MVM Planning (November 2000)
particularly strong. It
resented, with the proportion of
bove the national average (48.0%) and the proportion
ng at the national average. This has, however,
4.18
ared to 31.1% and
service floorspace amounts to 15.8% compared to 20.7%. The service sector in St
Sector No. of Outlets
% of Outlets Floorspace (sq. m)
% of Floorspace
St Helens Change 00-04
St Hele0
ns Change 0-04
Convenience 34 9.3 +1.3 15,190 17.1 +6.1 Comparison 192 52.6 -4.6 51,600 58.2 -5.1 Service 109 29.9 +0.7 15,120 17.1 -1.3 Miscellaneous 2 0.5 +0.6 290 0.3 +0.4 Vacant 28 7.7 +0.4 6,419 7.2 0 TOTAL 365 100 - 88,610 100 -
It can be seen that at 2004 the convenience sector in St Helens is4.16
has an above average number of units having 10.6% compared to the national average
of 9.3%. The proportion of convenience floorspace (23.2%) is also above the national
average (16.9%). Indeed, the centre has two large edge-of-centre foodstores: an Asda
at Kirkland Street and the former Safeway (now Tesco), at Chalon Way West along
with a Lidl which is located on the King Street Retail Park. Table 4.2 shows that the
convenience sector in St Helens has strengthened since 2000 in terms of both the
number of units (by 4 units or 1.3%) and the amount of floorspace (by 5,824 sq m or
6.1%).
The comparison sector at 2004 is also well rep4.17
comparison units (49.6%) being a
of comparison floorspace (53.1%) bei
declined since 2000 in terms of both the number of units (by 14 units or 4.6%) and the
amount of floorspace (by 3,420 sq m or 5.1%). This trend was identified by the Council
in the latest health check, where they found that the town centre had experienced a
decline in the number of shops between 1992 and 2002/03 of 15% (however, this did
not differentiate between food and non-food).
In contrast to the above, the proportion of service units and floorspace in St Helens is
below the national average. Service units amount to 30.6% comp
28
Helens has increased marginally since 2000 in terms of the number of units (by 1 unit
ce (by 776 sq m or 1.3%).
.19 erall, the retail t incr d from 365 units or 88,6 f
000 to units or 90,683 sq m in 2004.
.20 pected with a town of St Helen ze, the cen upports a b
s in add to retai St Hel as a num ultural ve
s rs from further afield. These
r Street, which comprises
a cinema, Chicago Ro ge and Pizza
Kirkland Street, the f Glass museum and art gallery a he Hilton Hotel at
art ib t. The centre also p
inistrat le as th cation for governmen gs and C l. In
s C occup large rtion of the central area.
.21 In light of the compa ith the ious MVM dy abo h examin e
s lso examined more
detailed information also be Experian in respect of key service facilities which were not
4.22
4: Service Composition of St Helens Town Centre, 2004
or 0.7%), but has declined in terms of the amount of floorspa
4 Ov sector in S Helens has ease 10 sq m o
floorspace in 2 359
4 As would be ex s’ si tre s road
variety of use ition ling. ens h ber of c nues
erving local residents in addition to attracting visito
include an entertainment complex on the Chalon Way / Wate
ck Café, Yates Wi
World o
ne Lod Hut, along with the
nd t
Lidl at
Linkway West, library and gallery on L rary Stree erforms an
important adm ive ro e lo t buildin ounci
addition St Helen ollege ies a propo
4 rison w prev stu ve, whic ed th
ummary data provided by Experian in 2000 and 2004, WYG have a
previously examined in St Helens in 2000.
The results set out in Figure 4.4 clearly show that when compared to the national
average St Helens is well provided for at 2004. The only identifiable deficiency is the
number of restaurants in the town centre. This contrasts with the fact that the town
centre is very well provided for with bars and public houses, with an above average
representation.
Table 4.
4.23
Sector No. of % of Outlets Floorspace (sq. Outlets m)
% of Floorspace
St Helens GB St Helens GB Fast Food Restaurants
19 4.35 4.61 1,347 1.17 2.22
Restaurants 12 2.75 4.24 2,192 1.91 3.26 Clubs 2 0.46 0.89 548 0.48 1.51 Cafes 10 2.29 2.66 957 0.83 1.28 Hotel and Quest Houses
4 0.92 0.52 3,400 2.96 1.62
Bars and Wine Bars
20 4.58 1.45 5,788 5.03 2.09
Public Houses 19 4.35 3.36 4,199 3.65 4.45 Retail Banks 11 2.52 2.74 3,437 2.99 3.41 TOTAL 97 21,868
When we compare these figures to the position at 2000 (Figure 4.5), it is evident that
the town centre has seen a marked increase in the number of fast food restaurants,
29

bars and wines bars and public houses.
Table 4.5: Service Composition of St Helens Town Centre, 2000
.24 This appears to support the conclusion reached by the Council whereby between 1992
other
4
and 2002/03 there was considerable growth in the number of food and drinking
establishments.
Retailer Representation
4.25 Table 4.6 illustrates the scale of St Helens retail offer at 2004 relative to
competing centres. Table 4.6: Scale of Retail Offer
Centre Convenience Floorspace (sq m gross)
Comparison Floorspace (sq m gross)
Service (sq m gross)
Total
Manchester 13,025 139,085 77,193 229,303 Liverpool 13,081 3 1108,61 29,840 51,534 Southport 22,548 70,318 27 120,830 ,964 Warrington 16,044 49,1 17,6 9 92 8 82,925 St Helens 21,024 48, 1 8180 4,344 3,548 Wigan 10,461 57,888 12,876 81,225
Source: Experian Goad (2 ). Notes: Total floorspa tes to con compariso servicee only, and exclud iscellane orspace cies and oth s.
4.26 tes that the size e retai or as a w St Helen reate
t and an, but han M ster, Live uth It can
b ver, t the co nce s in St Helens is particul strong
h rop n of floorspace tha st centre only exce being
Southport.
al
the
004 ce rela venience, n and floorspac es m ous flo , vacan er use
This table indica of th l sect hole in s is g r
han Warrington Wig less t anche rpool and So port.
e seen, howe hat nvenie ector arly
aving a higher p ortio n mo s, the ption
4.27 The presence of multiple retailers can greatly enhance the appeal of a centre to loc
consumers and investors. Other retailers in a centre can also benefit from
Sector No. of Outlets
% of Outlets Floorspace (sq. m)
% of Floorspace
St Helens Change 00-04
St Helens Change 00-04
Fast Food Restaurants
15 3.06 +1.29 1,208 0.9 +0.27
Restaurants 20 4.08 -1.33 2,796 2.09 -0.18 Clubs 0 0 +0.46 0 0 +0.48 Cafes 4 0.82 +1.47 836 0.62 -0.14 Hotel and Quest Houses
0 0 +0.92 0 0 +2.96
Bars and Wine Bars
8 1.63 +2.95 1,830 1.37 +3.66
Public Houses 16 3.27 +1.08 4,162 3.11 +0.54 Retail Banks 11 2.24 +0.28 3,948 2.95 0.04 TOTAL 74 100 14,780
30
increased pedestrian traffic generated by the presence of national multiples. However,
multiples also provide strong competition for rivals and over concentration may threaten
and local identity. An
approp alance bet en multiple ependents i e
national average fi the proportion of national multip n town centres is 34%
which is a useful benchmark in However, it should th
l are ex ed to c n a h than ave ortion ultipl
r lower o centres acteris lower lev footfall an ch ar
therefo e less attractive to ‘footloose’ multiple retailers.
.28 ere 1 multiple retailers (d as being f a netwo ine o
m outlets) in St Helens, occupying 46% of the total number of units in the centre
( d, 200 This inc 18 ‘k actors’ i. e retailers t likely
to improve the cons al of a cen cause strong br ding or
comprehensive product mix. These include: BhS, Boot the Chemist, Marks and
4.29 St Hele also has a good representation of independent units. The majority of these
ndary areas.
ness survey of St Helens found that 68.2% of retailers had plans to make
ithin the next year. Of those who were looking to make
changes, 7.5% noted that they were looking to relocate within the town centre, 12.5%
noted that they were lo te o 2.5 ooking to extend
floorspace, 15.2% were urbis rsp roportion
( that they were looking to clo noted t had no to
m ges to their .
4.31 T iness survey also indicated that most retailers in St Helens were tr ell
and just 7.7% felt that they were trading poorly. The survey further revealed that 52.2%
4.32
day/ tourist visitors (16.4%), high rents/ overheads (15.5%), lack of footfall
outside premises and poor security (9.5%), competition from other traders in St Helens
the independent sector in a town, undermining diversity
riate b we
gure for
s and ind s therefore d
les i
sirable. The
for compar g centres. be noted at
arger centre pect ontai igher rage prop of m e
etailers than rder char ed by els of d whi e
r
4 In 2004, there w
ore
66 efined part o rk of n r
Experian Goa 4). ludes ey attr e. thos mos
umer appe tre be of their an
Spencer, WH Smith, Woolworths, Mothercare, Next, New Look, McDonalds and
Superdrug.
ns
are located within the seco
Intentions to change Representation
4.30 The busi
changes to their businesses w
oking to reloca ut-of-centre, 1
h existing floo
% were l
looking to ref ace, and a small p
2.5%) noted se. 45% hat they intentions
ake chan business
he bus ading w
(41%) or moderately (41%). 10.3% of respondents felt that they were trading very well
of retailers felt that the performance of their businesses had improved over the last 5
years (52.2%), 17.5% had stayed the same, and 27.5% had declined.
The main threats felt by businesses were noted to be inadequate customer car parking
and lack of
(6.9%), poor quality of town centre shopping environment (6.0%), inadequacies of
31

current pitches and competition from other town centres (5.2%) and poor location of
premises (4.3%).
Retailer Requirements
Table 4.7 sets out retailer requirements within St Helens town centre as derived from
the Focus Database (October 2004).
4.33
lens Town Centre, 2004Table 4.7: Summary of Retailer Requirements within St He
Number of Minimum Maximum
Requirements Floorspace (sq. m)
Floorspace (sq. m)
Convenience 4 385 627 Comparison 21 5,605 11,436 Service 11 2,095 4,171 TOTAL 36 8,085 16,234
4.34
n in St Helens, with a total of 36 requirements listed. Retailers with
r simply not being actively marketed. Conversely a
Source: Focus Report (October 2004) - uses falling within specific retail trade categories from Experian Goad definitions It can be seen that there is a healthy level of demand from businesses seeking
representatio
current requirements include La Senza, Carphone Warehouse, Hobbycraft, Peacocks
stores.
Street Level Vacancies
4.35 The number of vacant units within a town centre can provide a good indication of how
the town centre is performing. However, care should be taken when interpreting
figures. Vacancies can occur for positive as well as negative reasons e.g. the opening
of a new retail centre elsewhere in a town may draw retailers from older properties or
more peripheral areas of the town. Vacant units will be found in even the strongest
town centre and are simply an indicator of the level of demand in a centre. For
example some properties may lay vacant because they are poorly maintained, unsuited
to modern retailing requirements o
low vacancy rate does not necessarily mean that a centre is performing well. For
example, if there is a proliferation of charity shops and other uses nor usually
associated with a town centre it may be a sign of decline, particularly where these uses
are located in prime locations. Despite these issues, it is still a useful indictor of
performance.
4.36 In 2004 there are 29 vacant units or 8.1% in St Helens town centre, which is
significantly below the national average of 11.3%. As a proportion of total floorspace,
vacancies account for 6,494 sq m or 7.2% which is also below the national average of
7.9%. Vacant units have increased marginally by 0.4% since 2000 when there were 28
vacancies amounting to 7.7%. Vacant floorspace has, however, increased only
32

moderately between 2000 and 2004. This is especially notable in the context of
previous reports undertaken by the City Council (2004), where the Council found that
during the period between 1992 to 2002/03 the number of vacant buildings increased
uld be noted that the Council’s definition of the town centre is
wider than that defined by Goad, as in 2002/03 the Council identified 69 vacant units,
.37 Table 4.6 below compares the vacancy count in St Helens town centre with other
tion of
s within the su
cancies in St Helens and other n y centres
by 188%. However, it sho
compared to Goad’s 29 in 2004.
4
nearby centres. It can be seen that St Helens town centre has the lowest propor
vacant unit b region.
Table 4.8: Va earb
Centre Vacant Units % Units Manchester 200 17.1 Liverpool 71 10.4 Southport 60 8.8 Warrington 46 11.6 St Helens 29 8.1 Wigan 80 18.0
Commercial Rents and Yields
.38 Zone A rents (the rental value of the first six metres depth of floorspace in retail units
4.39 town
Source: Experian Goad (2004).
4
from the shop window) reflect retailers’ perception of the town centre. As retailers
consider rent to reflect the margin between turnover and operational costs (plus
profit), the better the trading prospects the higher the rent that the operator will be
willing to pay.
Table 4.9 below records the changes in prime pitch Zone A rents in St Helens
centre over the period relative to other centres in the sub-region.
Table 4.9: Prime Pitch Zone A Rents (£/ sq m)
Centre June ‘96
June ‘97
June ‘98
June ‘99
June ‘00
June ‘01
June ‘02
June ‘03
June ‘04
Manchester 1,938 2,153 2,960 3,231 3,231 3,014 3,014 3,231 3,231 Liverpool 1,668 1,884 2,045 2,691 2,691 2,691 2,853 2,960 2,960 Southport 1,023 1,023 1,076 1,184 1,184 1,076 969 915 861 Warrington 1,023 1,130 1,130 1,184 1,399 1,507 1,560 1,560 1,560 St Helens 753 807 914 969 1,076 1,076 1,076 1,076 1,076 Wigan 753 753 753 753 807 915 915 969 969
e
4.40
s a
Source: Focus Town Centre Reports, October 2004 based on Colliers CRE’s opinion of open market ZonA rents
It can be seen that Zone A rents in St Helens have increased steadily between June
1996 and June 2000 increasing from £753/ sq m to £1,076/ sq m. This indicate
33

strengthening of the perceived trading prospects of the centre. Since this time,
levels have remained static reflecting the relatively stable position in terms of the
town centre.
Rental levels in St Helens at June 2004 are higher than Southport and Wigan, but
lower than Manchester, Liverpoo
rental
4.41
l and Warrington.
likely
sessment of the risk attached to investing in a
particular centre; the higher the yield, the greater the risk involved in investment.
es to asses the
comparative attractiveness of different shopping centres. Many considerations
will r rticu ng: the
dition of the building; the ential for renta th; the certainty of
se arrangement; and the ge of uses to w uilding can be put.
4.43 n Office Property Marke nuary 2004) indicates that yields in
around the 7.0% mark since October 1994, indicating
centre. These figures are comparable to those
ort. In 2004 yields were comparable with
St Helens lies between the regional cities of Liverpool and Manchester, to the west of
l
ol to Manchester,
is located 8.5km to the south of St Helens town centre. In the north of the Borough,
to the M6 corridor. The M6
east of St Helens town centre, and
the M57 runs beyond the Borough boundary to the west, some 8km from St Helens
town centre.
4.45 nal roa w r p s th atio
system e r t li
ol to Man ter; A57 hic n centre with the M
Liverpool with the M6 and Ashton-in-Makerfield.
4.42 A ‘yield’ represents the relationship between the rental income that a property is
to command and it capital value, expressed as a percentage. Town centre yields
broadly represent the market’s as
Yields provide a simple bench mark which the property market us
determine the yield an investor equire for a pa lar property, includi
physical con pot l grow
income; lea ran hich the b
The Valuatio t Report (Ja
St Helens have remained
consistent investor confidence in the
highlighted in the Council’s 2002/03 rep
those at Southport and Wigan and higher than in Manchester (5.5%), Warrington
(6.5%) and Liverpool (5.25%).
Accessibility
4.44
the M6 Motorway. The Borough benefits from excellent access onto the nationa
road network. Junction 7 of the M62 Motorway, which links Liverpo
the M58 Motorway runs east-west, linking Sefton
Motorway runs through the Borough 13km to the
The regio d net ork of the Bo ough rovides acces onto e n nal
motorway . Th se inte connec ing routes include: the A580, which nks
Liverpo ches the 0, w h links St Helens tow 62
(south) and M58 (north); and the A57/A58, which runs through the Borough linking
34

4.46
tre shopping centres (820). Other car parks are located to the north of
North John Street and Baldwin Street. In addition, the former Safeway car park is well
tal
ng spaces.
91
ing
4.48 :
f
respondents rated the centre as being ‘good’, 23.5% rated it as ‘average’ and
ed
9%
r, 37% by bus and 12% by foot.
ar parks are the Chalon Way long stay car park, used by
15.7% of respondents, the Hardshaw Centre car park used by 14.7% of
2000 when 24% of respondents cited this response.
ntre as ‘easy’ and 31.6% rated it as
‘moderate’. None of the respondents thought that access was difficult.
The town is well served by car parks. The town’s main ‘pay and display’ car parks are
located to the south of Chalon Way (727 spaces), and within the Church Square and
Hardshaw Cen
used by shoppers. This is, however, closed following the recent take-over. In to
the town centre provides in the region of 3,000 parki
4.47 The main bus station and shoppers taxi rank are located to the north of the Hardshaw
Centre on Hall Street. The number of bus services out of the town centre is still
services. The main railway station is located 250m to the east of the town centre on
Shaw Street. All public transport facilities are well related to the main shopp
areas.
In respect of accessibility issues, the on-street visitor survey indicated the following
• In comparing the accessibility of St Helens to other shopping centres, 42% o
only 2% rated it as ‘poor’.
• 50% of shoppers had travelled into the centre by private car. The second most
popular choice of transport was the bus, used by 34.5% of respondents, follow
by walking (11.5%). This is comparable to the position in 2000, where 4
travelled to the centre by ca
• The most popular c
respondents and the North John car park used by 11.8% of respondents. In
comparing St Helens to other shopping centres, respondents rated the amount of
car parking as follows: 42% ‘good’, 20% ‘average’ and 5% ‘poor’.
• With regard to parking fees in St Helens, 24.5% of respondents rated them as
‘good’ and only 35% rated them as ‘average’. Only 2% of respondents felt that
the parking fees in St Helens were ‘poor’, which compares favourably to the
position at
• Public transport was rated as ‘good’ by the majority of respondents (45.5%). 13%
rated it as ‘average’ and 3% rated it as ‘poor’.
• 9.5% of respondents are registered disabled. Of those, 68.4% rated access to
shops and services within St Helens town ce
35

ago, with 49.5% consider that there has been no improvement.
,
the following responses were given:
•
n the town centre, with 15.5% stating that this would
lead to no change.
•
61% of respondents noted that they thought that improved lighting would improve
•
uld lead to no
change and 8.5% stating that this would make things worse.
•
hings worse.
% stating that this would lead to no
change.
•
stating
• Of the 9.5% registered disabled respondents, only 21% had used the Chalon Way
car park shop mobility scheme, of which 100% said that this improved the
accessibility of the town centre for them.
Perception and Occurrence of Crime
4.49 The on-street survey of visitors to St Helens indicated that the vast majority of visitors
(94.5%) of shoppers feel safe walking though the centre during the day (compared
with 97% in 2000). At night time, this figure reduced to 53% (compared with 41% in
2000). 50.5% of respondents stated that they felt safer in the town now than 12
months
4.50 When asked about measures that would lead to improved safety of the town centre
81.5% of respondents noted that they thought that increased police patrolling
would improve safety withi
78% of respondents noted that they thought that extra CCTV would improve
safety within the town centre, with 20% stating that this would lead to no change.
•
safety within the town centre, with 23.5% stating that this would lead to no
change.
32.5% of respondents noted that they thought that fewer pubs/ clubs etc would
improve safety within the town centre, with 43% stating that this wo
15% of respondents noted that they thought that more people living in the town
centre would improve safety within the town centre, with 44.5% stating that this
would lead to no change and 15% stating that this would make t
• 49.5% of respondents noted that they thought that more secure car parks would
improve safety within the town centre, with 34
Only 3% of respondents noted that they thought that the removal of shrubs and
street furniture would improve safety within the town centre, with 59.5%
36

that this would lead to no change and 20% noting that there removal would
4.51 When improve safety within the town centre,
87% responded ‘no’ and 13% responded ‘yes’. Of those who said yes, reference was
m
•
•
•
•
•
• Removal of random shopping trolleys (2%)
•
Customer Views and Behaviour
4.52 The
shopp he town centre:
and grocery shopping (24%), work/ school or college (13%), and bank/ building
• 20.5% of respondents would combine a trip to the town centre with a visit to either
• s
within St Helens is good, with 45% noting that they were average and 4% noting
worsen the safety.
asked whether any other measure would
ade to the following measures:
Improved walkways and footpaths (8%)
Pubs closing earlier (3%)
Additional handrails (2%)
Fewer youngsters on the streets (3%)
More pedestrian crossings (2%)
Improved road signs (2%)
on-street survey indicated the following in respect of shopping habits and
ers’ perceptions of t
• The most popular reason cited by shopper as being their main purpose for visiting
St Helens town centre was clothes and shoe shopping (27%), followed by food
society or post office (10%). 69.6% of respondents noted that they would not
carry out any other activity in addition to the main activity in the centre on that
day.
• Most shoppers visit the town centre on a regular basis, with 46% of respondents
visiting once a week or more.
the Ravenhead or St Helens retail parks.
41.5% of respondents noted that the range of superstores and supermarket
that they were poor. This is comparable to the position in 2000, when 94-96% of
respondents noted that supermarket provision with St Helens was good or
average.
• 29% of respondents felt that the range of retail warehousing and retail parks
within St Helens is good, with 40% noting that they are average and 2% noting
37
that they are poor. This position has improved since 2000, when 13% of
shoppers noted that provision was poor.
This position has improved since 2000 when just 79-
81% of respondents noted that provision was either good or average and 18%
ted that the market in St Helen is good, with 34% noting
is poor.
t Helens is average (27%) with 20.5%
1.5% noting that it is poor. Looking specifically at the
theatre and cinema provision in St Helens, 33% of respondents noted that it is
is good and 1% noted that it is poor. This position
has improved considerably since 2000, when 71% felt that theatre and cinema
• When asked which measures would encourage respondents to visit St Helens
Env
4.53 is clear that a lot of investment has taken place within St Helens town centre. There
lan provided throughout.
4.54
env nce of graffiti and litter.
4.55
goo
of t
sai
wa
• Overall, the quality of shops within St Helens town centre were ranked by
respondents as good (57.5%), with 35% noting that they were average and 3%
noting that they were poor.
stated that this was poor.
• 29.5% of respondents no
that it is average and 2% noting that it
• Most respondents felt that the nightlife in S
noting it to be good and
average, 24.5% noted that it
provision in St Helens was poor.
town centre more frequently, the following responses were given: more high
street shops (19.5%), improved street cleaning (15%), more department stores
(7%), more quality clothes shops (6.5%) and more street furniture/ seating (5%).
ironmental Quality
It
is new street paving throughout the pedestrianised areas. In addition, soft
dscaping and street furniture is
The centre is clean and inviting, with the pedestrianised streets providing a safe
ironment for shoppers. There is little evide
The on-street shoppers’ survey has identified the shopping environment as being
d (47%) to average (46.5%) and 1% noting that it is poor. Shoppers’ perceptions
he shopping environment have improved since 2000 where 40-51% of shoppers
d that it was good, 40-41% stated that it was average, and 8-15% stated that it
s poor.
38

Co
4.56 From the above analysis, the following strengths can be attributed to St Helens town
•
• A strong convenience and comparison sector, both of which are above national
• A good choice of shops, with an above average representation by national
•
• king representation within the town and a
strong requirement from existing retailers to relocate, extend or refurbish
•
• An attractive shopping environment which has seen recent investment.
.57 Against these strengths, the following weaknesses have been identified:
within
at
nd
t
4.58 Helens is considered to be a vital and viable town centre, which has
shown signs of improvement since the previous Health Checks undertaken in 2001.
nclusions on Vitality and Viability
centre:
A broad diversity of uses, including a number of cultural attractions, tourist
attractions, civic, community and educational uses;
average levels;
multiple retailers, including a large number of ‘key attractors’, in addition to a
diverse range of independent retailers;
A below average vacancy rate;
A healthy demand from retailers see
premises;
A good accessibility by car and other forms of transport; and
4
• A growing service sector, albeit from a below average base, especially
food and drink sectors;
• A fear of crime within only 53% of visitors feel safe in St Helens town centre
night in the town centre (although this has improved since 2000); a
• Shoppers identified a need for more high street shops (particularly departmen
stores and clothing shops), improved street cleaning, and more street furniture in
order to make them shop within the town centre more frequently.
Overall, St
39
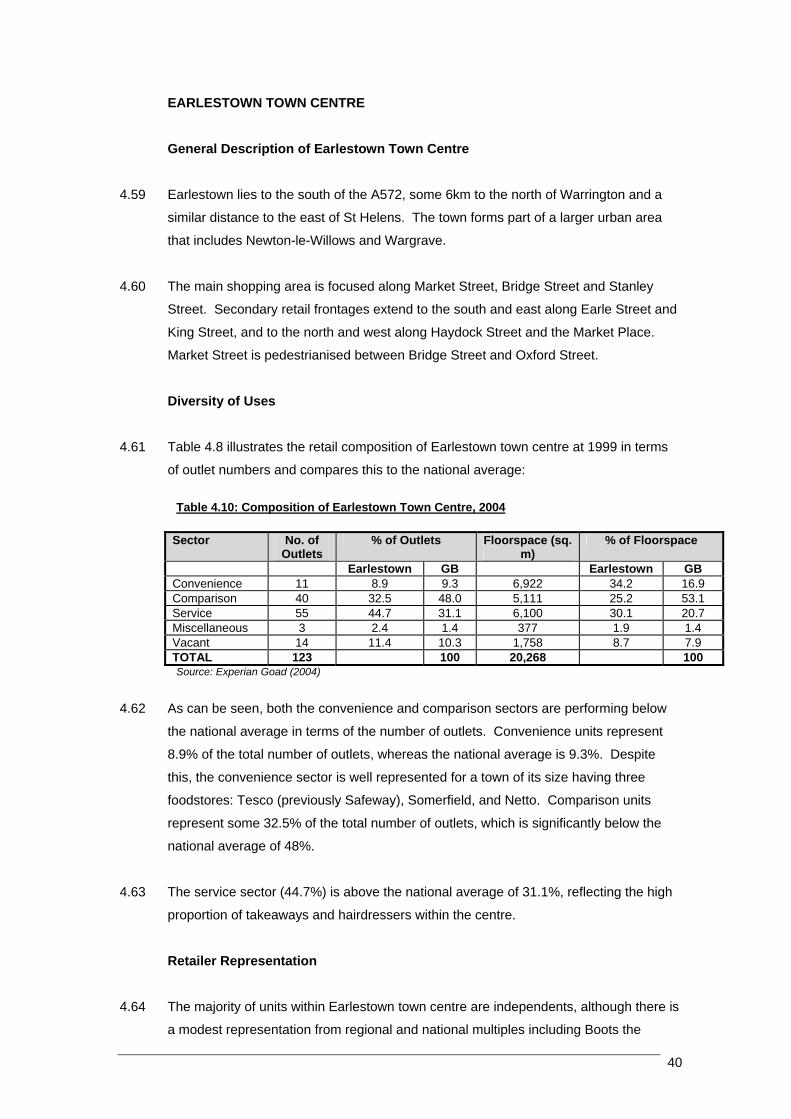
E
G .59 Earlestown lies to the south of the A572, some 6km to the north of Warrington and a
simila ea
that in
4.60 T m
Stree il frontages extend to the south and east along Earle Street and
King Street, and to the north and west along Haydock Street and the Market Place.
M e
Diver
4.61 T e ion of Earlestown town centre at 1999 in terms
of outlet numbers and compares this to the national average:
T ble 4.10: Co
ARLESTOWN TOWN CENTRE
eneral Description of Earlestown Town Centre
4
r distance to the east of St Helens. The town forms part of a larger urban ar
cludes Newton-le-Willows and Wargrave.
he ain shopping area is focused along Market Street, Bridge Street and Stanley
t. Secondary reta
ark t Street is pedestrianised between Bridge Street and Oxford Street.
sity of Uses
abl 4.8 illustrates the retail composit
a mposition of Earlestown Town Centre, 2004
Source: Experian
.62 As can be seen, both the convenience and comparison sectors are performing below
th a
8.9% tlets, whereas the national average is 9.3%. Despite
this, the convenience sector is well represented for a town of its size having three
fo s
repres low the
national average of 48%.
4.63 The s
propo
R
.64 The majority of units within Earlestown town centre are independents, although there is
a modest representation from regional and national multiples including Boots the
Sector No. of Outlets
% of Outlets Floorspace (sq. m)
% of Floorspace
Earlestown GB Earlestown GB Conv 34.2 16.9 enience 11 8.9 9.3 6,922 Comp 25.2 53.1 arison 40 32.5 48.0 5,111 Service 55 44.7 31.1 6,100 30.1 20.7 M e 1.4 isc llaneous 3 2.4 1.4 377 1.9V a 7.9 ac nt 14 11.4 10.3 1,758 8.7
Goad (2004)
TOTAL 123 100 20,268 100
4
e n tional average in terms of the number of outlets. Convenience units represent
of the total number of ou
od tores: Tesco (previously Safeway), Somerfield, and Netto. Comparison units
ent some 32.5% of the total number of outlets, which is significantly be
ervice sector (44.7%) is above the national average of 31.1%, reflecting the high
rtion of takeaways and hairdressers within the centre.
etailer Representation
4
40

Chemist, Woolworths, Savers, Shoe Fayre, and Max Speilman which are focused
along the pedestrianised area of Market Street.
.65 A number of high street banks and building societies are also represented in the town
4.66 n centre and this clearly acts as the
main attractor for shoppers.
4.67 to alter their
businesses within the next year. Of those who were looking to make changes, 3.0%
e looking to relocate within the town centre, 9.1% noted that they
were looking to relocate out-of-centre, 6.1% were looking to extend floorspace, 15.2%
s to their business.
.68 T rlestown were trading
m ely (40.6%). 28.1% of resp hat th ell
they were trading ju tha were tra very w
.69 In terms of the performance of bu es, th ey revealed that the ma
b declined over the last 5 years %), 33.3% had stayed the same,
and 6.1% had improv
e
or
town
rom
Retailer Requirements
4.71 ses seeking representation
in Earlestown.
4
including Barclays, Halifax and Nat West.
A large market is situated in the centre of the tow
Intentions to Change Representation
The business survey of Earlestown found that 33.4% of retailers had plans
noted that they wer
were looking to refurbish existing floorspace, and 9.1% noted that they were looking to
close. 45.5% noted that they had no intentions to make change
4 he business survey also indicated that most retailers in Ea
oderat ondents felt t ey were trading w
d ng
, 25% felt that
poorly and st 6.3% felt t they i ell.
4 siness e surv jority of
usinesses had (36.4
e.
4.70 The main threats to the continued success of businesses in Earlestown are noted to b
a lack of day/ tourist visitors (14.9%), competition from other town centres and po
town centre shopping environment (13.5%), high rents and overheads (12.1%),
inadequate customer car parking and competition from other traders in Earles
(10.6%), poor security (9.2%), inadequacies of current pitches and competition f
other town centres (3.5%) and poor location of premises (2.1%).
The focus database does not contain any records of busines
41

Street Level Vacancies .72 There are currently 14 vacant units in Earlestown. This represents 11.4% of the total
.73 Although vacancies in Earlestown are distributed throughout the centre, there are a
t Street. This is clearly a deficiency of the town.
Furthermore, some of the vacant units, particularly the vacant cinema on Railway
are in a bad state of repair.
4.74
ar
e Tesco
and Netto developments also have large car parks, which are used by visitors to the
4.76 accessible by public transport. It has a railway station on
Railway Street, providing links to Liverpool and Manchester and a bus station on Legh
4.77
.78 In respect of accessibility issues, the on-street visitor survey indicated the following:
• In comparing the accessibility of Earlestown town centre to other shopping
and only 4% rated it as ‘poor’.
• Public transport was rated as ‘average’ by the majority of respondents (76%), with
20% rating it as ‘good’.
4
number of outlets, which is above the national average (10.3%).
4
surprisingly high number of vacant units within the prime pitches, particularly along the
pedestrianised area of Marke
Street and a vacant unit on Earle Street,
Accessibility
Earlestown lies some 6km to the north of Warrington and a similar distance to the east
of St Helens. It is easily accessible via the A579 and A49 and is located in close
proximity to junction 23 of the M6. A one-way system operates within the centre, with
some roads being accessible by buses and cycles only.
4.75 The town is well served by car parks. There are two free surface-level shoppers’ c
parks at St Johns Street and Fairclough Street. In addition to this there are numerous
on-street spaces throughout the centre, which are popular with shoppers. Th
town centre.
Earlestown is also highly
Street providing linkages between the town centre and its hinterland. Both are well
related to the main shopping streets, being located on the edge of the town centre.
Access on foot is aided by the pedestrianisation of part of Market Street and some
traffic claming throughout the rest of the centre.
4
centres, 8% of respondents rated the centre as being ‘good’, 68% rated it as
‘average’
42
• 96% of shoppers had travelled into the centre by bus. This is almost too high to
be believable, especially given that this survey did not pick up any respondents
in
centre it is likely that
this would still apply.
.79 The on-street survey of visitors to Earlestown town centre indicated that the vast
sitors (82%) of shoppers feel safe walking though the centre during the
day. However, at night time this figure reduced to 42%, with 58% of respondents
en no
.80 When asked about measures that would lead to improved safety of the town centre,
g
• 96% of respondents noted that they thought that extra CCTV would improve
ve
e.
ould
66% stating that this would lead to no
change and 20% stating that this would make things worse.
• 60% of respondents noted more people living in the town centre would not lead to
62% of respondents noted that more secure car parks would not lead to improved
66% of respondents noted that the removal of shrubs and street furniture would
arriving at the centre on foot. Indeed, the 2000 survey found 37% to arrive
Earlestown by foot and from recent observations of the town
• All of those surveyed who drove to Earlestown were found to park on the street.
Perception and Occurrence of Crime
4
majority of vi
saying that they would actually feel unsafe. 14% of respondents stated that they felt
safer in the town now than 12 months ago, with 86% consider that there has be
improvement.
4
the following responses were given:
• 100% of respondents noted that they thought that increased police patrollin
would improve safety within the town centre.
safety within the town centre, with 4% stating that this would lead to no change.
• 34% of respondents noted that they thought that improved lighting would impro
safety within the town centre, with 66% stating that this would lead to no chang
• 14% of respondents noted that they thought that fewer pubs/ clubs etc w
improve safety within the town centre, with
improved safety within the town centre and 40% noted that this would make
things worse.
•
safety within the town centre, with 6% stating that this would improve safety.
•
43
not lead to improved safety within the town centre.
ved walkways and footpaths were identified as the only other measure for
ving safety.
4.81 Impro
impro
Customer Views and Behaviour
.82 The on-street survey indicated the following in respect of shopping habits and
s
•
• Most shoppers visit the town centre on a regular basis, with 42% of respondents
• 94% of respondents considered the non-food shops in Earlestown to be ‘average’.
3
4
• T
r y
shops to be ‘average’, with 31% rating the centre as ‘good’.
• In
nsidered provision to be ‘average’, with 12% considering this to be ‘poor’. In
2
‘a
• he market in Earlestown is well thought of with 96% of respondents ranking it as
‘g
• 3 ents noted the nightlife in Earlestown to be ‘average’, with 10%
nking it as ‘poor’ and 56% stating that they ‘don’t know’. In 2000, 79% considered
th
• When asked whether there are any measures that would encourage the
r
4
hoppers’ perceptions of the town centre:
Given that the surveys were carried out on two market days (Friday and Saturday),
if was unsurprising to find that 100% of respondents cited the market as being their
main purpose for visiting Earlestown town centre. Of those 45% noted that they
carried out ‘no other activities’ during their visit and 5% noted that they also
undertook ‘social and leisure activities’ as part of the trip.
visiting once a week or more.
1% of shoppers considered the range of non-food shops to be ‘poor’ in 2000, with
2% considering them to be ‘average’.
he quality of shops within Earlestown was noted to be ‘average’ by 96% of
espondents. The 2000 survey identified that 52% of respondents found the qualit
of
terms of foodstores, the survey has identified that 88% of respondents
co
000, 75% had considered provision to be ‘good’, with 19% considering it to be
verage’.
T
ood’ and the remaining 4% ranking it as ‘average’.
4% of respond
ra
is to be ‘poor’ and 14% felt that this was ‘average’.
espondent to visit the town centre more, 28% cited ‘cheaper public transport’, 10%
44

c blic transport’ and 6% cited
‘more high street shops’.
ality
4.83 tment in the environmental quality of Earlestown,
including the pedestrianisation of part of Market Street and the provision of street
ces. In
re are in a bad state of repair, having
been vacant for some time, and these appear to have become hot-spots for vandalism
4.84 The
sho
Conclusions on Vitality and Viability
4.85 Fro ing strengths can be attributed to Earlestown town
centre:
•
• A proportion of retailers looking to invest in their businesses including relocation
ises;
• A good accessibility by car and other forms of transport.
4.86 Aga
• rage convenience and comparison sector, both of which have declined
since the 1999 survey.
•
• n;
ularly
ited ‘more pedestrianisation’, 8% cited ‘increased pu
Environmental Qu
There has clearly been some inves
furniture. However, despite this, the centre does appear to be quite tired in pla
particular, some of the vacant units within the cent
and the accumulation of litter.
environmental quality of Earlestown was noted to be ‘average’ by 64% of
ppers, with just 24% noting it to be ‘good’ and 6% noting it is ‘poor’.
m the above analysis, the follow
An above average level of service units;
within the town centre, extension to floorspace and the refurbishment of prem
and
inst these strengths, the following weaknesses have been identified:
A below ave
An above average vacancy rate;
• A limited representation within the town from national and regional multiples;
A lack of retailers seeking representation within the tow
• The environmental quality of the town centre is poor in some areas, partic
around some of the long standing vacant units;
45

• 58% of visitors saying that they would actually feel
unsafe in Earlestown town centre at night time.
.87 Overall, Earlestown is considered to be of limited vitality and viability and appears to
A fear of crime within only
4
have declined since the 2000 surveys.
46
5 ORIGINAL MARKET RESEARCH
In
’s
g shopping patterns that exist within it and to
compare this with the results of the 2001 study to analyse whether there has been
any significant changes since that period. One of the most accurate ways of
understanding where people shop and why they visit particular centres/retail facilities
is through original market research. As highlighted within our overall methodology in
Section 1, the original market research undertaken as part of this study involved the
completion of three separate yet inter-related surveys. They include:
• A household telephone survey – which interviewed 1,000 households within
the defined catchment (Appendix C);
• A town centre shopper survey – which interviewed 200 shoppers within the
centre of St Helens and 50 in Earlestown over three days including a Saturday
(the results are summarised in section 4) (Appendix D); and
• A town centre traders’ survey which was distributed to over 600 St Helens town
centre (Appendix G) premises and a further 156 to premises in Earlestown
(Appendix H).
5.02 Key findings from each of the surveys have been highlighted below:
Household Telephone Survey
5.03 In September 2004 a survey of 1,000 households was undertaken within the defined
catchment set out in Section 6. The catchment defined is the same as the previous
catchment which was adopted for the September 2000 household survey which was
completed by MVM Planning. Although the sample achieved in the September 2000
survey was 750 households, it is possible to compare and contrast the results
collected as the defined catchment mirrors the post codes previously adopted. The
extent of the household survey catchment is shown below in Figure 5.1.
troduction 5.01 A key element of our study was to obtain a detailed understanding of St Helen
potential catchment and the surroundin
47

Catchment Area Figure 5.1: The Defined
5.04 On thi 00 and 2005 to
patter
ain Food Shopping Patterns
s basis, this study has reviewed both the results gathered in 20
examine (where possible) potential changes in market shares and shifts in shopping
ns have occurred.
M
5.05 hen reviewing the results of where people undertake their main food shopping it is
he Borough of St Helens have witnessed a
reduction in their overall market share. Since September 2000 the overall market
W
evident that convenience stores within t
share for St Helens has fallen from 40% to just under 33%. The comparisons within
each of the seven zones are set out below.
Table 5.1: Main Food Market Share Analysis – 2000 and 2005
Year Zone 1 Zone 2 Zone 3 Zone 4 Zone 5 Zone 6 Zone 7 Total
2000 95% 45% 70% 12% 8% 29% 81% 40%
2005 93% 29% 60% 4% 5% 15% 59% 33%
5.06 s can be seen from the table above, the market share within Zone 1 which
represents St Helens Central Area has remained fairly static. However, the market
share within Zone 2 which represents the geographical area between the North East
of St Helens and the South West of Wigan has fallen to just under one third.
ignificant factors influencing this reduction primarily relate to the strengthening of
provision within Wigan.
A
S
48

5.07 r example the Asda at Soho Street in Wigan (which has recently been significantly
tended) has improved its market share within Zone 2 from 5% in 2000 to 12% in
een significantly extended has improved its
share from 5% to 6% in 2004. This increase in market share achieved by facilities
within Wigan has resulted in the sixteen percentage point drop that has been
recorded in Zone 2 over the past four years.
5.08 The same is also the case for Zones 6 and 7 where the strengthening of provision
elsewhere has result in a loss of market share. For example, at the time the previous
survey was undertaken in September 2000, the Tesco store at Cables Retail Park in
Prescot had just opened. Therefore, the store’s market share in the previous study
was very low. Since then the store is now successfully trading and has been
subsequently extended to become a Tesco Extra format. Four years on the Store has
increased its market share in Zone 6 from 12% to 30% and 1% to 13% in Zone 7.
Unsurprisingly, this has had a dramatic impact upon the market share achieved by
stores in St Helens particularly along the western fringe of the Borough.
e overall market share achieved.
5.10 t has occurred within St Helens since the previous
survey was undertaken has been the redevelopment of the former Morrisons at
gh.
5.11 ny significant gains
in market sh th the Asda store at Kirkla
existing Morri market sha
(St Helens Central ce th ng of the Morrisons store at Baxters
Lane the market sh r Asda and the ry Road Morrisons has fallen to 34%.
The actual market share for Asda in Zone 1 has fallen from 25% to 16% whereas the
halved
5.12
04. In fact the two most popular stores for main food
Fo
ex
2004. The Asda in Leigh which has also b
5.09 The market shares achieved within Zones 4 & 5 have also fallen slightly albeit from a
low base. Clearly the strengthening of provision within both Warrington and Widnes
will have impacted upon th
The only significant change tha
Baxters Lane. The new store opened in October 2002 and has established a strong
trading position since then. For example, within Zone 1 the market share of the
previous stores was just 1%. The new store has now recorded a market share of
36% within the same zone. Overall the store is now the most popular main food
shopping destination within the whole of the Borou
However, the success of the Morrisons stores has not resulted in a
are. For exam
sons at Boun
ple, in 2000 b
dary Ro
o
ad had a combi
nd Street and
re of 59% in Zone 1
the
ned
). However, sin e openi
are fo Bounda
market share achieved by the Morrisons at Boundary Road has almost been
falling from 34% to 18%.
However, when you examine the market share of the two Morrisons stores it is
evident that Morrisons market share within St Helens (Zone 1) has increased from
35% in 2000 to 54% in 20
49

shopping within St Helens are both the Morrisons stores. This is an important fact
when considering the trade that has been lost to improved Tesco and Asda stores
outside the Borough.
In 2000, the most popular store was the Asda just ahead of the Morrisons at
Boundary Road. The evidence now gathered
5.13
demonstrates that Asda’s market share
has fallen from 25% to 16% and Safeway from 9% to 5%. In fact the demise of the
isons
Safeway brand has seen a significant fall in the stores overall market share. Within
the whole catchment, the market share of the store at Chalon Way has been halved
from 6% to 3%. (It must be noted that at the time of the household survey both
Safeway stores in St Helens and Earlestown were still trading under the Safeway brand despite the imminent change to Tesco following the Morr
take-over)
Top Up Food Shopping
.14 When asked if people undertake top-up shopping between their main food shop, over
.15 In terms of top-up shopping trips, it would appear that the overall market share
is
nient
p
elsewhere most notably
Prescot, Wigan and Warrington. However, more people are undertaking top-up
5
63% confirmed that they did visit convenience facilities during their between main
food shopping visits.
5
achieved by facilities within the Borough of St Helens has also declined slightly. Th
is not surprising given that fact the majority of people tend to use the most conve
facilities for top-up shopping rather than travel further distances where there may be
greater choice or a preferred brand. In fact the market shares achieved for top-u
shopping would appear to reflect the market share now achieved for main food
shopping. This suggests that less people are travelling into the Borough to undertake
main food shopping due to the improvements in facilities
shopping in Zone 1 (St Helens Central).
Table 5.2: Top-up Market Share Analysis – 2000 and 2005
Year Zone 1 Zone 2 Zone 3 Zone 4 Zone 5 Zone 6 Zone 7 Total
2000 66% 54% 85% 0% 3% 23% 68% 35%
2005 79% 35% 50% 6% 1% 23% 27% 31%
5.16 or top-up shopping include both the major supermarkets
and important stores such as the Kwik Save at Four Acre Lane, the Co-op in the
The most popular stores f
Hardshaw Centre and the Lidl at King Street.
50

Non-food (Non Bulky) Shopping
When asked where people
5.17 went to undertake their main shopping trips for clothes,
shoes, small household items, etc it was evident that facilities within St Helens Town
Centre have witnessed a slight reduction in their overall market share. Since
September 2000, the overall market share for St Helens Town Centre has fallen from
29.6% to 27.0%. The comparisons with each of the seven zones are set out below.
Table 5.4: St Helens Non Bulky Goods Market Share Analysis – 2000 and 2005
Year Zone 1 Zone 2 Zone 3 Zone 4 Zone 5 Zone 6 Zone 7 Total
2000 69% 25% 46% 3% 13% 34% 48% 29.6%
2005 69% 23% 37% 12% 10% 24% 36% 27.0%
2005
out-of-
72% 24% 37% 12% 13% 25% 38% 28.5%(including
centre) Focus Market Research 2004.
5.18 As can be seen from the table above, the market share within Zones 1, 2, and 5
sed
rsey
such as M&S, Next, Next Home, Boots,
tc benefiting from free parking. There is also evidence of leakage from this Zone to
pear that the slight
development ng t
New Mersey Retail Park.
.19 However, there is also evidence of shopping patterns moving from the town centre to
to
overall market share for ‘non-bulky’
facilities in St Helens has still reduced slightly since 2000.
which represent St Helens Central, Billinge and the rural area to the south east of St
Helens, all appear to have remained relatively static. However, the market share in
Zones 3 and 6 have fallen most significantly since 2000. Zone 3 which represents the
area around Newton Le Willows has witnessed increase leakage to the Trafford
Centre (which has increased its market share from 2% in 2000 to 12.5% in 2004.
Warrington has also strengthened its market share although this has only increa
from 22% to 25% in this zone. Within Zone 6, which is the area on the fringe of the
Liverpool conurbation, it is evident that there has been a slight strengthening of the
market share of Liverpool as well as non-bulky shopping visits to Speke (New Me
Retail Park) which includes major operators
e
the Trafford Centre although this is only 3%. On this it would ap
redu s Town Centre’s m as oction in St Helen
s outside the
arket sha
cludi
re h
he Trafford Ce
ccurred a
ntre,
s a result of major
Liverpool acatchment in nd the
5
existing ‘non-bulky’ out of centre facilities in St Helens primarily at St Helens Retail
Park (including Matalan). However, even if we include the market share attributed
such facilities out-of-centre, it is evident that the
51

Bulky Goods Shopping
it
to
f the seven zones are set out below:
Table 5.3: B d e C a e s n
5.20 When reviewing the results of where people undertake their ‘bulky goods’ shopping
is evident that the market share has improved significantly since September 2000. As
outlined below, the overall market share for St Helens has increased from 29%
36%. This increase is not surprising given the level of new facilities that have since
been developed, particularly at Ravenhead Retail Park. The comparisons within each
o
ulky Goo s (includ s Town entre) M rket Shar Analysi – 2000 a d 2005
Year Zone 1 Zone 2 Zone 3 Zone 4 Zone 5 Zone 6 Zone 7 Total
2000 75% 26% 53% 2% 1% 34% 51% 28.8%
2005 87% 37% 45% 11% 14% 36% 47% 36.0%F rket Research 2004.
5.21 A en from Table 5.3 above, the market share in all but two zones (Zones 3
an s increased from 2000.
d to
ular
5.23
5.24
in Warrington (18%). In addition 11% of the
respondents visited facilities at St Helens Retail Park. The results found that 52% of
5.25
r, this is significantly above
the food shopping (63%). 15% used local bus services.
ocus Ma
s can be se
d 7) ha
5.22 The introduction of Ravenhead Retail Park (including the B&Q warehouse) has le
the increase market share in 5 out of the seven zones. On closer scrutiny of the
results, St Helens Retail Park was also a popular destination when purchasing
furniture and carpets with over 20% of the wider catchments population visiting the
Retail Park for such goods. Gemini Park in Warrington was the second most pop
main destination with 7.5% (which include Ikea).
For electrical items, the survey found that St Helens Retail park was again the most
popular (15.1%) destination in the catchment. St Helens town centre was the second
most popular (14.3%) destination, followed by Albans Retail Park in Warrington
(7.95).
In terms of DIY goods, the household survey found that the most popular destination
was Ravenhead Retail Park (which includes the B&Q Warehouse) with 21.5% of
respondents shopping at its facilities. The second most popular destination was the
B&Q Warehouse at Delph Lane
the respondents actually visited B&Q facilities in and around the catchment,
demonstrating the strong branding of the operator in the area.
In terms of modes of transport when undertaking non-food shopping trips,
approximately 74% of people travelled by private motor ca
52

se of Leisure FacilitiesU
5.26
5.27 f the 41% who use sport and fitness facilities, most (25%) visit facilities within
5.28 When undertaking entertai t acti 8% vis faciliti ithin St Helens
B with other popula inatio cludin rring 2%), ool (
acilities in Liverpool and a further 10% visiting
Wigan.
5.30
nt by
The most popular leisure activities identified by respondents within the defined
catchment was entertainment (69%) (including visiting the cinema, theatre and
restaurants), nightlife (48%) (including pubs, bars and nightclubs) and 41% of
respondents visited sports and leisure (41%) facilities.
O
Warrington, whereas 24% use facilities with St Helens.
nmen vity, 2 ited es w
orough r dest ns in g Wa ton (2 Liverp 19%)
and Wigan (8%).
5.29 24% of people using pubs, bars and nightclubs did so in St Helens Borough, with 18%
visiting Warrington, 13% travel to f
Interestingly when people where asked what improvements could be made to St
Helens town centre, new improved leisure facilities were not considered significa
respondents.
Internet Shopping
5.32 respondents using the internet for shopping purposes, most (32%)
respondents stated that they spent less than £10 per month on goods with 22%
5.33 mportant
portant to consider
the views of businesses which contribute significantly to the town centre’s economy
ers, White
nse of 6% and 21% was
5.31 When asked if people used the internet or TV Shopping, 20% said yes with the
remaining 80% said no.
Of those
stating that they spent over £51 per month. The remaining 45% spend between £11
and £50 per month.
Business Survey
Whilst both the Household Survey and On Street Survey provided i
information on peoples shopping habits and likes, dislikes, it is im
and future performance. In order to canvas views of the town centre trad
Young Green distributed a postal questionnaire to over 600 businesses within St
Helens and 156 in Earlestown town centres. A respo
53

achieved respectively. The low response rate in St Helens could be explained by the
s were distributed before the Christmas period, which is the
est time in the town centre’s business calendar.
5.34 in St
year.
been established for over 5
years and only 3% of businesses had been trading for less than a year.
5.35 n Centre, the most positive
response related to the foodstore provision which 45% of all business identified as
nsport
fied by 80% of businesses, security/CCTV (40%) and cleanliness
(38.5%).
5.36 itive
e related again to the strength of the foodstore provision with 61% of all
business identifying it as being good, other notable positive responses related to price
4%).
isure facilities which was identified by 86% of all businesses, lack of
organised event (78%), cleanliness (78%) and the state of the shopping environment
opular
s: new and improved public toilets (92%), an increase to the
choice and range of shops (78%). 73% sought greater promotion and marketing of
5.38
t a new large foodstore would be harmful to the town centre
compared to 31% who thought it would improve the centre and 24% felt that new
nt facilities would be harmful again compared to 51% who thought
it would improve the centre. A further 24% felt that more restaurants/cafes would
5.39
fact that the questionnaire
busi
Of those who responded, over 80% of the businesses had been established
Helens for over 5 years, with only 5% having been established for less than one
In contrast only 41% of businesses in Earlestown had
When asked about certain aspects of St Helens Tow
being good, closely followed by security/CCTV (43%) and access to public tra
(30%). The issues that the traders felt were poor related to lack of public toilets,
which were identi
The same question was asked to businesses in Earlestown, where the most pos
respons
of car parking pricing (51%), access to public transport (34%) and security (3
The issues that Earlestown traders felt were poor related to lack of
entertainment/le
(77%).
5.37 When asked what measures would improve St Helens town centre, the most p
response were as follow
the town centre, more car parking (66%) and a new department store (62%).
Conversely, when asked about what measures they consider would harm the town
centre, 28% felt tha
leisure/entertainme
harm the town centre, compared to 55% who thought it would improve the centre.
Businesses in Earlestown also identified a number of measures to improve the town
centre, these were namely: an increase in the choice and range of shops (100%),
greater promotion/marketing of centre (100%), new and improved public toilets (91%)
and improvements to personal safety (87%).
54

5.40
whilst only 2% thought it would
improve. In addition 33% of businesses felt that more national multiples would harm
5.41
ng that there
were too many non-retail uses. In contrast only 27% of traders in Earlestown felt that
5.42
of the current car parking (16%) and the lack of day/tourist visitors to the
St Helens town centre (16%). These were followed by high rents and overheads
5.43
5.44 sked about the future plans for their business, 35% of St Helens businesses
stated that they would be refurbishing, extending or relocating to premises within the
oment
compared to only 8% who felt that they were trading poorly.
5.45
5.46
6%
of respondents considering refurbishment, extending or relocating to premises in the
When asked about what would harm the Earlestown town centre, 56% of businesses
felt that a new foodstore would harm the town centre,
the town centre compared to 35% who thought it would improve the town centre.
When asked about the balance of retail and non-retail uses, the majority of St Helens
traders (62%) felt that at present the balance was good, with 30% stati
current balance was good, instead, 42% of traders thought there were too many non-
retail uses, 30% felt that there were not enough non retail uses.
When asked about what were the main issues constraining current trading
performance in St Helens, the two most popular constraints identified were the
inadequacy
identified by 15.5% of all businesses.
Similarly 15% of businesses in Earlestown also stated that the lack of visitors/tourists
constrained their current performance. The poor quality shopping environment was
also identified by 13.5% of the respondents. Respondents (13.5%) also identified
competition as one of their main concerns to their future performance.
When a
town centre over the next 5 years. This would appear to show positive signs about
the future trading patterns in St Helens and that businesses are willing to invest and
expand in the centre. In fact this was supported by responses to current trading
performance where 51% felt that they were trading well or very well at the m
More importantly, 52% of St Helens businesses said that their performance had
improved over the last 5 years, with 27% suggesting that it had declined.
The results for Earlestown were slightly less optimistic, where 18% of businesses
stated that would either close of relocate to another centre in the next five years. 3
town centre. This reduced optimism was supported by the fact that only 34% of
businesses felt that they were trading well or very well at the moment with 25%
stating that they were trading poorly.
55

Summary
5.47
r St
Helens and Earlestown.
5.48
y. However, in terms
of Earlestown it would appear that traders and shoppers believe the centre is showing
Despite the three different forms of survey research that have been utilised for this
study, it is evident that there are a series of clear and consistent messages which
must be taken on board as part of the development of a future retail strategy fo
The survey research would appear to confirm the conclusions reached in the health
check in Chapter 4 of this report. It would appear that both shoppers and traders
alike believe that St Helens is an attractive and vibrant town centre which, despite
certain weaknesses, demonstrates significant vitality and viabilit
signs of vulnerability in terms of its vitality and viability, where a number of
weaknesses may need to be addressed.
56
6 N AND EXPENDITURE
6.01
ons. However, for such an approach, the definition of a
centre’s true catchment or sphere of influence is very difficult to accurately assess
6.02
consumer preferences in relation to where
people live and shop. This enables analysis of a particular area, which helps to
evaluate the actual draw of major centres and how they impact upon the market share
of smaller centres. Therefore, the threat of competing centres (and out-of-centre
development) can be highlighted more easily.
6.03 Therefore, the use of specifically commissioned survey research is fundamental in
informing a study that will effectively identify the likely capacity for future floorspace
within St Helens Town Centre.
Catchment Definition 6.04 In defining the catchment area for this study, it is important to consider the nature of
convenience and comparison shopping trips. Trips made to food stores are generally
undertaken within a limited distance whereas comparison goods may involve longer
trips to access a broad range of products and to compare prices. Often the extent of a
centre’s catchment is determined by a combination of its current retail ‘offer’ and the
proximity of other large centres.
6.05 In this respect, Table 6.1 illustrates the distance and drive time of the main competing
centres from St Helens Town Centre.
POPULATIO Introduction
In assessing the future ‘needs’ of a particular centre, it is possible to use a ‘desk top
approach’ based on experience of similar market conditions and professional
judgement and assumpti
even when relying on local knowledge. Therefore, any future modelling of ‘need’
undertaken on this basis will rely on quite a ‘leap of faith’ and the robustness of the
results is always uncertain.
We acknowledge that there are limitations to survey research, particularly in relation
to the samples that can be achieved in a larger catchment. However, the results
provide important broad indicators as to
57
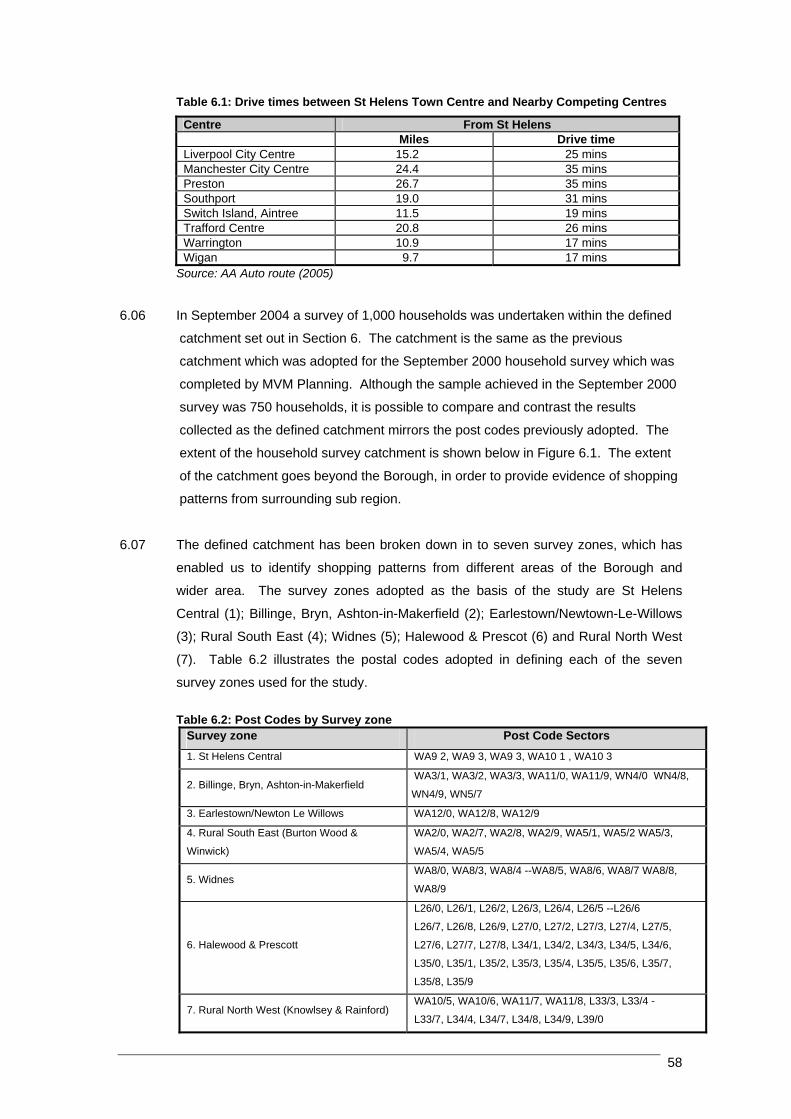
Table 6.1: Drive times between St Helens Town Centre and Nearby Competing Centres
Centre From St Helens Miles Drive time Liverpool City Centre 15.2 25 mins Manchester City Centre 24.4 35 mins Preston 26.7 35 mins Southport 19.0 31 mins Switch Island, Aintree 11.5 19 mins Trafford Centre 20.8 26 mins Warrington 10.9 17 mins Wigan 9.7 17 mins
6.06 households was undertaken within the defined
catchment set out in Section 6. The catchment is the same as the previous
s adopted as the basis of the study are St Helens
Central (1); Billinge, Bryn, Ashton-in-Makerfield (2); Earlestown/Newtown-Le-Willows
); Widnes (5); Halewood & Prescot (6) and Rural North West
(7). Table 6.2 illustrates the postal codes adopted in defining each of the seven
Source: AA Auto route (2005)
In September 2004 a survey of 1,000
catchment which was adopted for the September 2000 household survey which was
completed by MVM Planning. Although the sample achieved in the September 2000
survey was 750 households, it is possible to compare and contrast the results
collected as the defined catchment mirrors the post codes previously adopted. The
extent of the household survey catchment is shown below in Figure 6.1. The extent
of the catchment goes beyond the Borough, in order to provide evidence of shopping
patterns from surrounding sub region.
6.07 The defined catchment has been broken down in to seven survey zones, which has
enabled us to identify shopping patterns from different areas of the Borough and
wider area. The survey zone
(3); Rural South East (4
survey zones used for the study.
Table 6.2: Post Codes by Survey zone
Survey zone Post Code Sectors 1. St Helens Central WA9 2, WA9 3, WA9 3, WA10 1 , WA10 3
2. Billinge, Bryn, Ashton-in-Makerfield WA3/1, WA3/2, WA3/3, WA11/0, WA11/9, WN4/0 WN4/8,
WN4/9, WN5/7
3. Earlestown/Newton Le Willows WA12/0, WA12/8, WA12/9
4. Rural South East (Burton Wood &
Winwick)
WA2/0, WA2/7, WA2/8, WA2/9, WA5/1, WA5/2 WA5/3,
WA5/4, WA5/5
5. Widnes WA8/0, WA8/3, WA8/4 --WA8/5, WA8/6, WA8/7 WA8/8,
WA8/9
6. Halewood & Prescott
L26/0, L26/1, L26/2, L26/3, L26/4, L26/5 --L26/6
L26/7, L26/8, L26/9, L27/0, L27/2, L27/3, L27/4, L27/5,
L27/6, L27/7, L27/8, L34/1, L34/2, L34/3, L34/5, L34/6,
L35/0, L35/1, L35/2, L35/3, L35/4, L35/5, L35/6, L35/7,
L35/8, L35/9
7. Rural North West (Knowlsey & Rainford) WA10/5, WA10/6, WA11/7, WA11/8, L33/3, L33/4 -
L33/7, L34/4, L34/7, L34/8, L34/9, L39/0
58
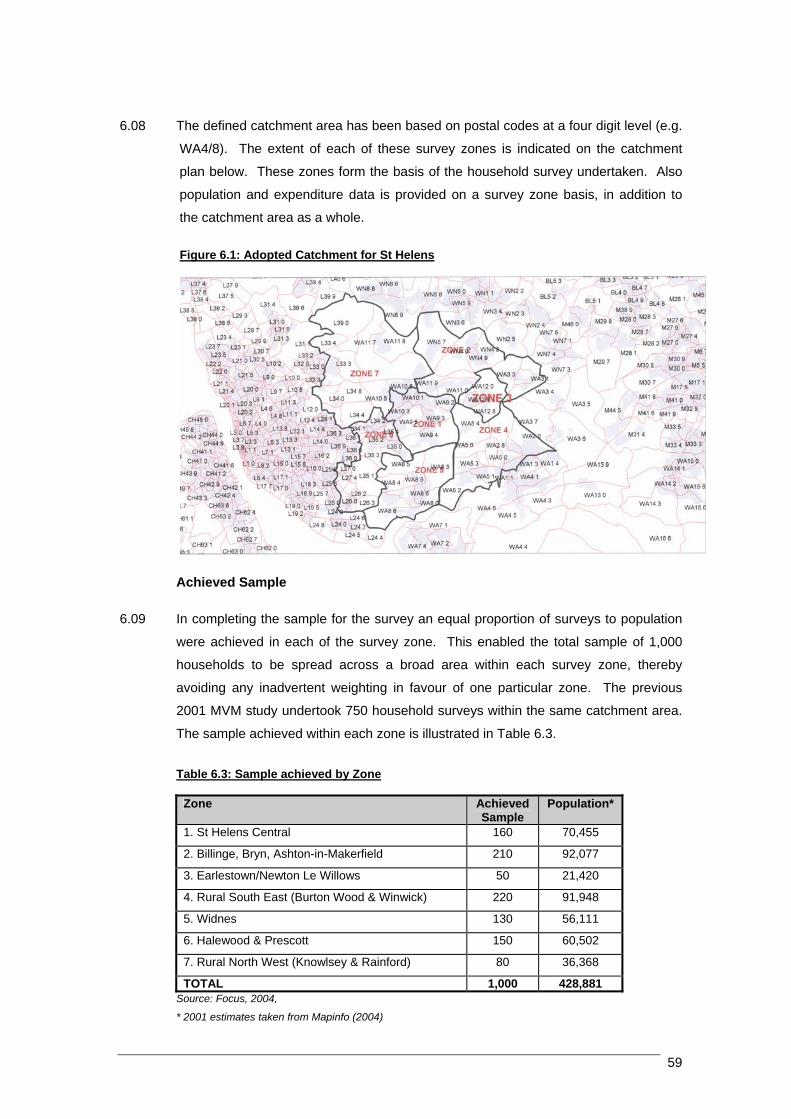
6.08 The defined catchment area has been based on a four digit level (e.g.
of each of the vey zones is indicat catchment
s form the of the household surve aken. Also
and expenditure data is n a survey zone addition to
a whole.
.1: Adopted Catchment for St H
postal codes at
WA4/8). The extent se sur e d on the
plan below. These zone basis y undert
population provided o basis, in
the catchment area as
Figure 6 elens
6.09
g in favour of one particular zone. The previous
hold surveys within the same catchment area.
The sample achieved within each zone is illustrated in T
Table 6.3: Sample achieved by Zone
Achieved Sample
In completing the sample for the survey an equal proportion of surveys to population
were achieved in each of the survey zone. This enabled the total sample of 1,000
households to be spread across a broad area within each survey zone, thereby
avoiding any inadvertent weightin
2001 MVM study undertook 750 house
able 6.3.
Zone Achieved Sample
Population*
1. St Helens Central 160 70,455
2. Billinge, Bryn, Ashton-in-Makerfield 210 92,077
3. Earlestown/Newton Le Willows 50 21,420
4. Rural South East (Burton Wood & Winwic 220 91,948 k)
5. Widnes 130 56,111
6. Halewood & Prescott 150 60,502
7. Rural North West (Knowlsey & Rainford) 80 36,368
TOTAL 1,000 428,881 Source: Focus, 2004,
*
2001 estimates taken from Mapinfo (2004)
59

6.10 A copy of the questionnaire and the full tabulations of the St Helens Shopping Survey
a
C
6.11 T l code zone has been calculated using MapInfo
Target-Pro Base data. Mapinfo provide forecasts for each year up to 2016. These
po Output area and extend the figures from
the 2001 Census through to 2016 utilising 2002 ONS mid-year estimates. A full
explanation of the MapInfo methodology on population projections is provided in
Appendix B.
6.12 The adopted catchment area (for this study) contains a resident population of 427,180
(2005 estimate), which is set to decrease by -1.8% (or 7,631) to 419,549 by 2015.
Population is anticipated to decline relatively equally throughout each of the survey
zones. We note from Table 5.5 below that survey Zone 3 (Earlestown and Newtown-
Le-Willows) will experience the highest decline by 2015. Survey Zone 4 (Rural South
East) is the only zone that will experience an increase in the population through to
2015.
Table 6.4: Resident Population of the adopted Catchment Area, 2005-2015
re provided at Appendix C.
atchment Population
he population within each posta
pulation projections are produced at Census
2005 2010 2015 Change % (2005-2015)
Catchment Area 427,180 422,814 419,549 7,631 Source: Mapinfo TargetPro Database 2004 (2000 based)
opulation figures (derived from Mapinfo Target-Pro database) are provided for each of
e seven survey zones. For the purpose of this study we have forecast population and
xpenditure growth based on five year periods. Therefore, forecasts have been
rovided for 2005, 2010 and 2015. Table 6.5 provides a detailed breakdown
stimated/forecast population growth within each zone through to 20
6.13 P
th
e
p
e 15.
Ta 005-2015)
ble 6.5: Population by Survey Zone (2
Surv ey Zone 2005 2010 2015 Change % (2005-2015)
1 St Helens C 69,460 67,67 66,13 -4.8 entral 1 7 2M
,142 89,77 88, -2.8 Billinge, Bryn, Ashton-in- 91akerfield
8 567
3 Earlesto 21,025 20,471 20,00 -4.9 wn/Newton le Willows 3 4W ick)
96,40 98, 4.0 Rural South East (Burton 94,420 ood & Winw
3 242
5 W 55,471 54,57 53,88 -2.9 idnes 9 2 6 59,839 58,65 57, -3.8 Halewood & Prescot 3 588 7Rainf
35,259 34, -3.1 Rural North West (Knowsley & ord)
35,823 712
T 427,180 422,8 419 -1.8 otal 14 ,549 Source: Mapinfo TargetPro Database 2004 (2000 based)
60

Retail Expenditure
.14 In order to calculate convenience and comparison expenditure per head, we have
ro Base Reports (previously referred to as Illumine Reports),
6.15 the ‘goods based’ approach adopted for this study, the consumer retail
casts are derived from URPI Brief 04/02. Taking into account the
up to 2003 and then applied the forecast growth rate for the Ultra Long Term
rate of 3.7% per annum.
6.16 ng these forecasts we have pro expend stimate ach
in 2005, 2010, 2015 in line with the guidance prescribed in PPS6. T
w opul wth. T 6.6
and 6.7 provide a summary of the estimated growth in retail expenditure per capita
6
used Mapinfo Target-P
which provide detailed information on local consumer expenditure and which take into
account the socio-economic characteristics of the local resident population. For the
forecasting of this expenditure through to 2015, we have used URPI’s ‘goods based’
forecasts at 2000 prices.
In respect of
expenditure fore
time horizon of this study we have adopted URPI’s ultra long-term figures as our
basis. These growth rates have been applied to the population projection model
outlined above for each survey zone. Actual growth rates have been used for the
period 2001 to 2003. Thereafter, the forecast rates for convenience expenditure
growth are 1.1% per annum up until 2006 and then 1.2% per annum onwards. In
terms of forecast growth rates for comparison expenditure, we have applied actual
growth
Usi duced iture e s for e survey zone
he evidence
takes into account both retail expenditure gro th and p ation gro ables
within the catchment survey areas.
Table 6.6: Convenience Expenditure Estimates per Capita per Annum, 2005-2015
2005 2010 2015 1 St Helens Central £1,837 £1,948 £2,067 2 Billinge, Bryn, Ashton-in-Makerfield
£2,030 £2,152 £2,284
3 Earlestown/Newton le Willows £1,905 £2,020 £2,144 4 Rural South East (Burton
ick) £1,964 £2,082 £2,210
Wood & Winw5 Widnes £2,019 £2,141 £2,273 6 Halewood & Prescot 4 2,009 £2,132£1,89 £ 7 Rural North West (KnowRainford)
sley &
4 £2,072 £2,199 £1,95
ort (2 PI Brie
Source: Mapinfo TargetPro Base Rep 004) & UR f 04/2
61
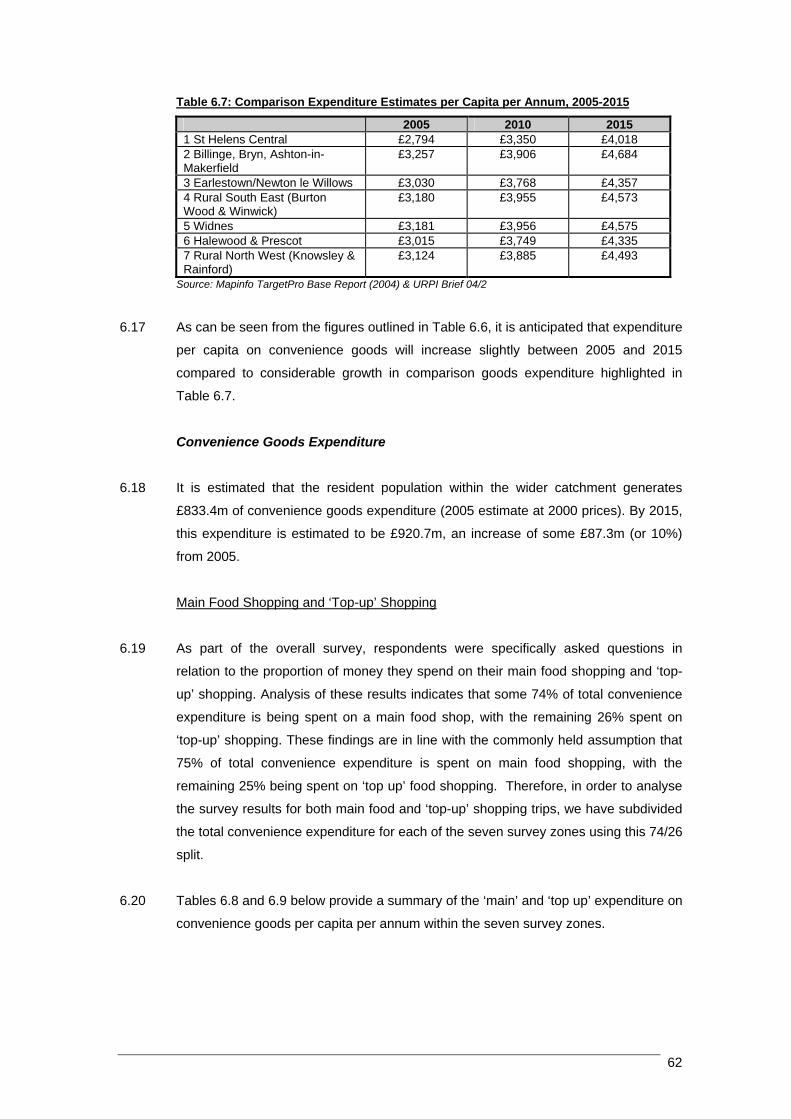
Table 6.7: Comparison Expenditure Estimates per Capita per Annum, 2005-2015
2005 2010 2015 1 St Helens Central £2,794 £3,350 £4,018 2 Billinge, Bryn, Ashton-in-Makerfield
£3,257 £3,906 £4,684
3 Earlestown/Newton le Willows £3,030 £3,768 £4,357 4 Rural South East (Burton Wood & Winwick)
£3,180 £3,955 £4,573
5 Widnes £3,181 £3,956 £4,575 6 Halewood & Prescot £3,015 £3,749 £4,335 7 Rural North West (Knowsley & Rainford)
£3,124 £3,885 £4,493
Source: Mapinfo TargetPro Base Report (2004) & URPI Brief 04/2
6.17
6.18
oods expenditure (2005 estimate at 2000 prices). By 2015,
this expenditure is estimated to be £920.7m, an increase of some £87.3m (or 10%)
As can be seen from the figures outlined in Table 6.6, it is anticipated that expenditure
per capita on convenience goods will increase slightly between 2005 and 2015
compared to considerable growth in comparison goods expenditure highlighted in
Table 6.7.
Convenience Goods Expenditure
It is estimated that the resident population within the wider catchment generates
£833.4m of convenience g
from 2005.
Main Food Shopping and ‘Top-up’ Shopping
As part of the overall survey, res
6.19 pondents were specifically asked questions in
relation to the proportion of money they spend on their main food shopping and ‘top-
nience
expenditure is being spent on a main shop, with the remaining 2 ent on
‘ hese findings are with the c ly held as n that
75% of total conveni ent on main food shopping, with the
r ‘top u opping. ore, in or nalyse
t for both main food and ‘top-up’ shopping trips, we have subdivided
t nditure for the seve zones us 74/26
s
.20 ables .8 and 6.9 below provide a summary of the ‘main’ and ‘top up’ expenditure on
convenience goods per capita per annum within the seven survey zones.
up’ shopping. Analysis of these results indicates that some 74% of total conve
food 6% sp
top-up’ shopping. T in line ommon sumptio
ence expenditure is sp
emaining 25% being spent on p’ food sh Theref der to a
he survey results
he total convenience expe each of n survey ing this
plit.
6 T 6
62

Table 6.8: Main Convenience Expenditure in the wider catchment - Growth per Capita per A num, 2005-2015n
Year 2005 2010 2015 1 St Helens Central £1,359 42 0 £1,4 £1,532 Billinge, Bryn, Ashton-in-Makerfield £1,502 92 0 £1,5 £1,693 Earlestown/Newton le Willows £1,410 95 7 £1,4 £1,584 Rural South East (Burton Wood & Win £1,453 41 5 wick) £1,5 £1,635 Widnes £1,494 84 2 £1,5 £1,686 Halewood & Prescot £1,402 87 8 £1,4 £1,577 Rural North West (Knowsley & Rainfor £1,446 33 7 d) £1,5 £1,62
S etPro 4)
Table 6.9: Top Up Convenience Expenditure in the wider catchment - Growth per Capita
ource: URPI Brief 99/2 & Mapinfo Targ Base (200
per Annum, 2005-2015Year 2005 2010 2015 1 St Helens Central £477 £506 £537 2 Billinge, Bryn, Ashton-in-Makerfield £528 £560 £594 3 Earlestown/Newton le Willows £495 £525 £557 4 Rural South East (Burton Wood & Winwick) £511 £541 £575 5 Widnes £525 £557 £591 6 Halewood & Prescot £492 £522 £554 7 Rural North West (Knowsley & Rainford) £508 £539 £572
Source: URPI Brief 99/2 & Mapinfo TargetPro Base (2004)
m £616.7m to £681.3m. With regard to ‘top-up’ shopping, in 2005 the
wider catchment population is estimated to generate £216.7m, increasing to £239.4m
6.21 By applying these expenditure estimates per capita to the identified population of the
wider catchment convenience expenditure on main food shopping is estimated to be
some £616.7m in 2005. This expenditure is set to increase by 10% between 2005
and 2015 fro
by 2015 (an increase of £22.7m).
6.22 Tables 6.9 and 6.10 below provide a breakdown of expenditure on main and top up
convenience goods within the defined catchment area.
Table 6.10: Convenience Expenditure within the Catchment Area, 2005-2015Year Main Food Shop
(£m) ‘Top-up’ Shop (£m) Total (£m)
2005 616.7 216.7 833.4 2010 647.4 227.5 874.8 2015 681.3 239.4 920.7
Growth (2005-2015) 64.6 22.7 87.3
arison Goods Expenditure
in 2005.
This represents an increase (or £527.2m) of more than 41% from 2005.
6.24 In addition, the comparison goods expenditure generated has also been divided into
four categories: Electrical; Furniture; DIY; and what is referred to as non-bulky goods
(clothing, shoes, books, etc). However, the new URPI Brief 04/2 (2004) does not
WYG, Table 8, Appendix 8, 2005
Comp 6.23 By 2015 the population within the wider catchment is estimated to generate
£1,806.4m of comparison goods expenditure, increasing from £1,279.2m
63

distinguish between comparison good types. The approach adopted by URPI in
04/02 is the same approach advocated in PPS6, which stipulates that when
a ed for additional d ment iture lev ould
r sold withi oad c s of ‘c nce’
a rea y ‘bu ‘non-b ods
have been examined is to provide a qualitati iew o rforma etail
w tions n the old surv
oods
ssessing quantitative ne evelop e dxpen els sh
elate to the class of goods to be n the br ategorie onvenie
nd ‘comparison’ goods. However, the son wh lky’ and ulky’ go
ve overv f the pe nce of r
arehousing provision linked to the ques asked i househ ey.
Electrical G
6.25 By utilising expenditure information derived from Mapinfo t-Pro ba
g URPI 4/2, it i ated tha n the
w 3 per capita p num w spent o trical
p 18. ll comp goods e iture
w
.26 Furthermore, it is estimated that by 2015 expenditure on electrical items will increase
6.27 By applying these pe
estimated
risin
DIY Goods
Targe se and the
rowth rates for comparison goods from Brief 0 s estim t withi
ider catchment currently £55 er an ill be n elec
roducts (2005 estimate). This represents % of a arison xpend
ithin the identified catchment area.
6
to £796 per capita, representing growth of 44% between 2005 and 2015.
r capita expenditure figures to the catchment population, it is
that the total expenditure on electrical goods will be some £236.2m in 2005,
g to £333.5m by 2015 (an increase of £97.3m or 41%).
By utilising th n Mapinfo Target-Pro
f 04/2, it is
estimated that within the nt per c num
will be s n DIY Goods . This repres 0% of all com goods
expendit thin the area. By 2015 it is estima t the average on DIY
G hment area will be £422 per capita per annum, representing a
g these expenditure figures to the catchment population, it
d that the total expenditure on DIY goods will be some £125.3m in 2005,
se of £51.6m or 41%).
6.28 e 2000 price estimates for DIY Goods identified i
database and the comparison goods growth rates stated in URPI Brie
defined catchme approximately £293 apita per an
pent o in 2005 ents 1 parison
ure wi ted tha spend
oods within the catc
growth of 44%. By applyin
is estimate
rising to £176.9m by 2015 (an increa
64
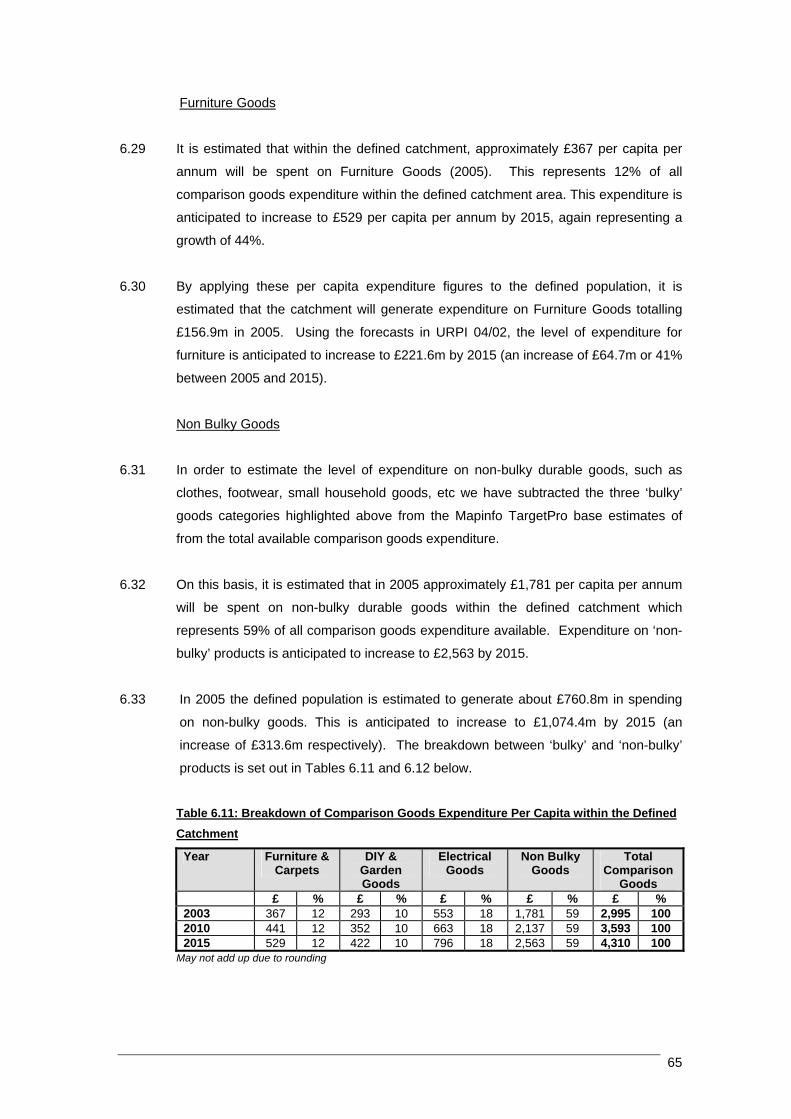
Furniture Goods
It is estimated that within the defined catchment, approximately £367 per capita per
annum will be spent on Furniture Goods (2005). This represents 12% of all
comparison goods expenditure within the defined catchment area. This expenditure is
anticipated to increase to £529 per capita per annum by 2015, again representing a
growth of 44%.
6.29
.30 e per capita expenditure figures to the defined population, it is
estimated that the catchment will generate expenditure on Furniture Goods totalling
6 By applying thes
£156.9m in 2005. Using the forecasts in URPI 04/02, the level of expenditure for
furniture is anticipated to increase to £221.6m by 2015 (an increase of £64.7m or 41%
between 2005 and 2015).
Non Bulky Goods
6.31 In order to estimate the level of expenditure on non-bulky durable goods, such as
clothes, footwear, small household goods, etc we have subtracted the three ‘bulky’
goods categories highlighted above from the Mapinfo TargetPro base estimates of
6.32 81 per capita per annum
will be spent on non-bulky durable goods within the defined catchment which
9% of all comparison goods expenditure available. Expenditure on ‘non-
bulky’ products is anticipated to increase to £2,563 by 2015.
6.33
from the total available comparison goods expenditure.
On this basis, it is estimated that in 2005 approximately £1,7
represents 5
In 2005 the defined population is estimated to generate about £760.8m in spending
on non-bulky goods. This is anticipated to increase to £1,074.4m by 2015 (an
increase of £313.6m respectively). The breakdown between ‘bulky’ and ‘non-bulky’
products is set out in Tables 6.11 and 6.12 below.
Table 6.11: Breakdown of Comparison Goods Expenditure Per Capita within the Defined Catchment
Year Furniture & Carpets
DIY & Garden Goods
Electrical Goods
Non Bulky Goods
Total Comparison
Goods £ % £ % £ % £ % £ % 2003 367 12 293 10 553 18 1,781 59 2,995 100 2010 441 12 352 10 663 18 2,137 59 3,593 100 2015 529 12 422 10 796 18 2,563 59 4,310 100
May not add up due to rounding
65

rison of Retail Expenditure in ‘Bulky’ and Non-Bulky Goods (2005-Table 6.12: Compa2015)
Year Bulky Goods (£m) Non Bulky Goods (£m)
Total Comparison Goods (£m)
Furniture DIY Electrical 2005 156.9 125.3 236.2 518.4 (41%) 760.8 (59%) 1,279.6 2010 186.3 148.8 280.5 599.9 (41%) 903.4 (59%) 1,519.0 2015 221.6 176.9 333.5 732.0 (41%) 1,074.4 (59%) 1,806.4
Source: White Young Green Planning (2005) May not total due to rounding
St Helens Market Share Having calculated the li
kely levels of expenditure that are generated by the
e defined catchment area it is also important to understand
what proportion of this expenditure is currently attracted to retail facilities within St
6.35
rket shares can be estimated
s and then applying this to
6.36
ke market research to
ghlighted below:
6.34
population living within th
Helens as a whole.
The amount of trade that is captured by a particular area or centre within a defined
catchment is often referred to as its ‘market share’. Ma
by calculating the likely turnover of existing retail propertie
the money available within the catchment. However, this method relies on a number
of assumptions including the likely trading performance of local stores.
Therefore, the most accurate way to estimate the potential market share of a
particular centre within a defined catchment is to underta
understand where people within that catchment actually shop. A critical element of
this overall study has involved the completion of 1,000 household interviews within
the defined catchment mentioned above. By analysing the results from the survey it
has been possible to understand the likely levels of expenditure that is captured by
facilities in the Borough. The estimated market shares are hi
66
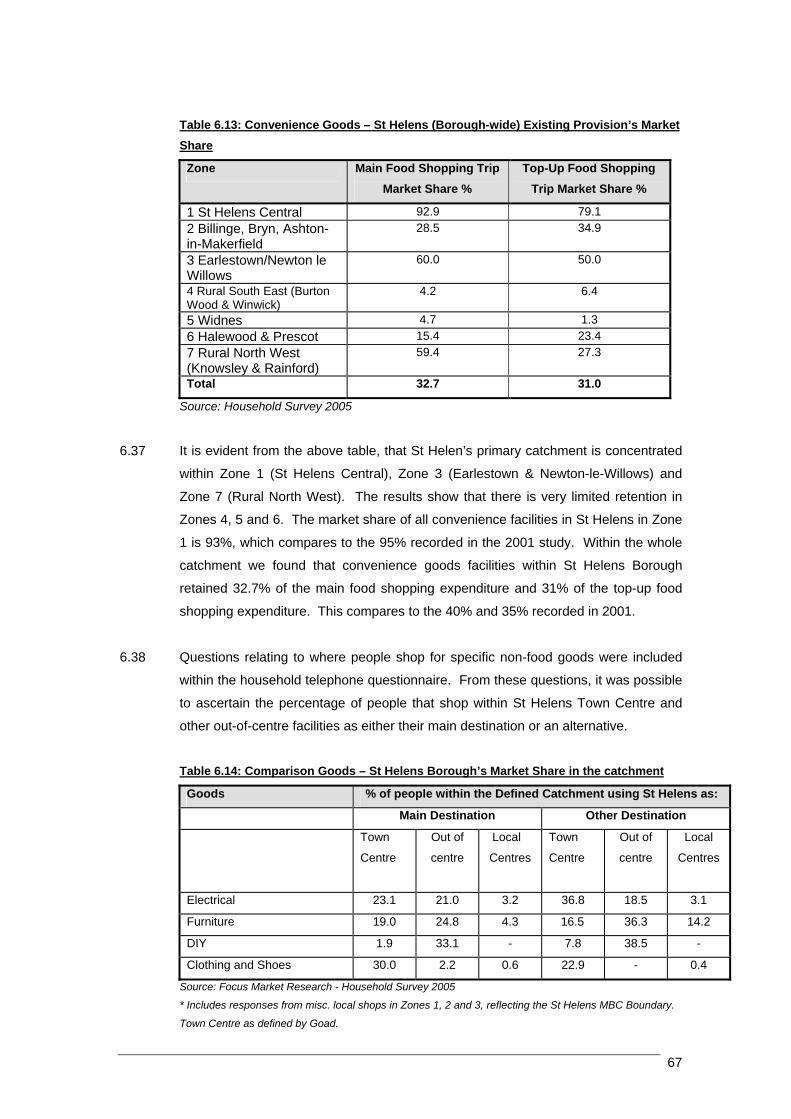
Table 6.13: Convenience Goods – St Helens (Borough-wide) Existing Provision’s Market Share
Zone Main Food Shopping Trip M re arket Sha %
Top-Up Food Shopping Trip Market Share %
1 St Helens Central 92.9 79.1 2 Bill
-Makinge, shton
erfie 34.9Bryn, A
ld -
in28.5
3 Earlesto ton le 50.0 wn/New Willows
60.0
4 Rural South East (Burton 4.2 6.4 Wood & Winwick) 5 Widnes 4.7 1.3 6 Halewood & Prescot 15.4 23.4 7 Rural North West (Knowsley & Rainford)
59.4 27.3
Total 32.7 31.0
Source: Household Survey 2005
It is evident from the ab
6.37 ove table, that St Helen’s primary catchment is concentrated
ithin Zone 1 (St Helens Central), Zone 3 (Earlestown & Newton-le-Willows) and
top-up food
shopping expenditure. This compares to the 40% and 35% recorded in 2001.
6.38
ent
w
Zone 7 (Rural North West). The results show that there is very limited retention in
Zones 4, 5 and 6. The market share of all convenience facilities in St Helens in Zone
1 is 93%, which compares to the 95% recorded in the 2001 study. Within the whole
catchment we found that convenience goods facilities within St Helens Borough
retained 32.7% of the main food shopping expenditure and 31% of the
Questions relating to where people shop for specific non-food goods were included
within the household telephone questionnaire. From these questions, it was possible
to ascertain the percentage of people that shop within St Helens Town Centre and
other out-of-centre facilities as either their main destination or an alternative.
Table 6.14: Comparison Goods – St Helens Borough’s Market Share in the catchm
Goods % of people within the Defined Catchment using St Helens as:
Main Destination Other Destination
Town
Centre
Out of
centre
Local
Centres Town
Centre
Out of
centre
Local
Centres
Electrical 23.1 21.0 3.2 36.8 18.5 3.1
Furniture 19.0 24.8 4.3 16.5 36.3 14.2
DIY 1.9 33.1 - 7.8 38.5 -
Clothing and Shoes 30.0 2.2 0.6 22.9 - 0.4
Source: Focus Market Research - Household Survey 2005
* Includes responses from misc. local shops in Zones 1, 2 and 3, reflecting the St Helens MBC Boundary.
Town Centre as defined by Goad.
67

6.39
it is interesting to note that St Helen’s is still a popular destination for non-food
s g. However, the su th tail
facilities in and around St Helens a ttract sh ge of
n ‘bulky goods’ in particular DIY and furniture.
6.40 F have assum at the proportional split of expenditure
b er’ comparis goods expenditure is 70% and 30%
r
6.41 B ption, it is possib estimate the likely market shares for
s oportion of expenditure spent in relation to the respondents
his is summarised in the table below.
Despite the influence of competing centres including Warrington, Liverpool and
Wigan
hoppin rvey evidence indicates
lso manage to a
at the out-of-centre re
oppers for a wide ran
on-food goods, especially and
rom past experience we ed th
etween ‘main’ and ‘oth
espectively.
on
ased on this assum
goods and the pr
le to
pecific
'main' and 'other' destination. T
Table 6.15: Comparison Goods Expenditure – Estimated Market Shares for St Helens Town Centre in the catchment
Goods Estimated Market Shares Expenditure Split
Main Other Main Other
Electrical 14.6 24.3 70 30
Furniture 5.0 2.5 70 30
DIY 1.7 7.8 70 30
Clothing and Shoes 30.0 22.9 70 30
Table 6.16: Expenditure Drawn From the Catchment to St Helens Town Centre
Goods Expenditure £m
Main Other Total
Electrical 24.1 17.2 41.3
Furniture 5.0 1.1 6.1
DIY 1.5 2.9 4.4
Clothing and Shoes 159.8 52.2 212.0
Total 190.4 73.4 263.8
6.42 From the results of the hous ey and the que dellin uld
appear that existing town centre facilitie t r ting l o
£266.3m of comparison goods expenditu m the defined catchment.
ehold surv subse
Helens a
nt mo g, it wo
f s in S e attrac a tota
re fro
68
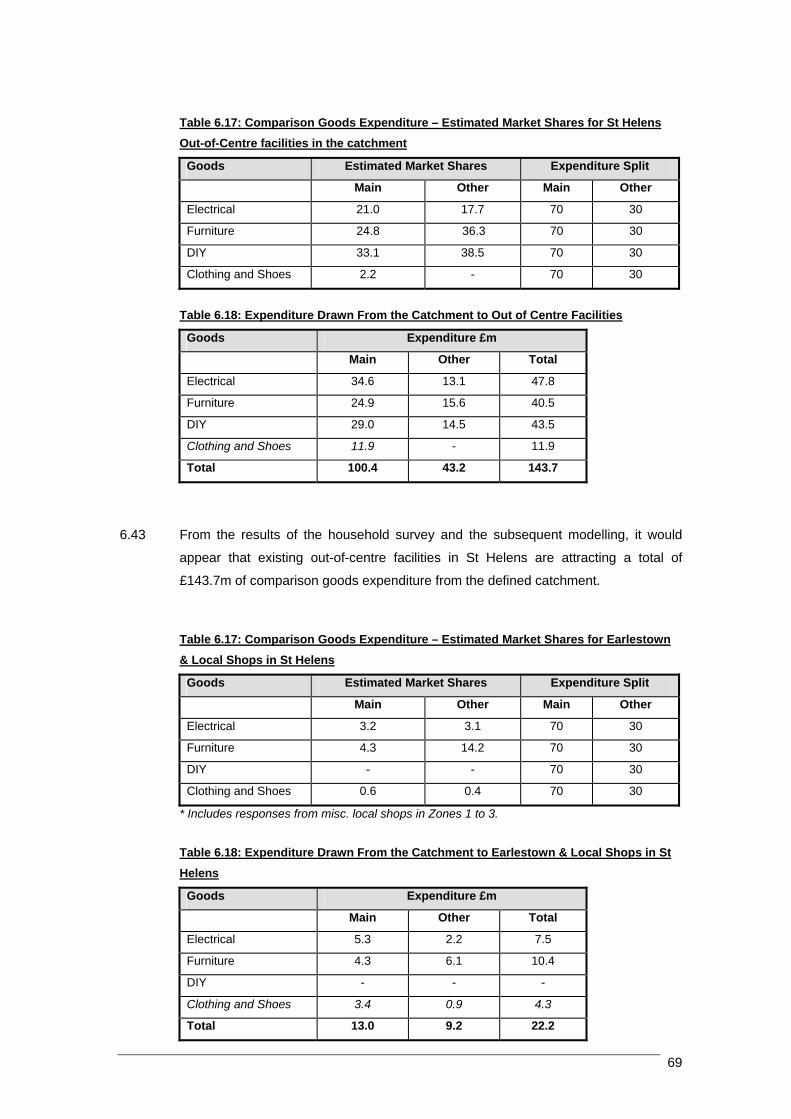
Table 6.17: Comparison Goods Expenditure – Estimated Market Shares for St Helens Out-of-Centre facilities in the catchment
Goods Estimated Market Shares Expenditure Split
Main Other Main Other
Electrical 21.0 17.7 70 30
Furniture 24.8 36.3 70 30
DIY 33.1 38.5 70 30
Clothing and Shoes 2.2 - 70 30
enditure Drawn From the Catchment to Out of Centre FacilitiesTable 6.18: Exp
Goods Expenditure £m
Main Other Total
Electrical 34.6 13.1 47.8
Furniture 24.9 15.6 40.5
DIY 29.0 14.5 43.5
Clothing and Shoes 11.9 - 11.9
Total 100.4 43.2 143.7
6.43 F sults of the hous survey and subseque modelling, d
a t existing out-of-c facilit Helens are attracting a total of
£143.7m of comparison goods expenditure from defined ca ent.
estown
rom the re ehold the nt it woul
ppear tha entre ies in St
the tchm
Table 6.17: Comparison Goods Expenditure – Estimated Market Shares for Earl& Local Shops in St Helens
Goods Estimated Market Shares Expenditure Split
Main er n Other Oth Mai
Electrical 3.2 3.1 70 30
Furniture .2 30 4.3 14 70
DIY - - 70 30
Clothing and Shoes .4 30 0.6 0 70
* Includes responses from misc. local shops in Zones 1 to 3.
Table 6.18: Expenditure Drawn From the Catchment to Earlestown & Local Shops in St Helens
Goods Expenditure £m
Main Other Total
Electrical 5.3 2.2 7.5
Furniture 4.3 6.1 10.4
DIY - - -
Clothing and Shoes 3.4 0.9 4.3
Total 13.0 9.2 22.2
69

excludes turnover derived from misc. local shops in Zones 4 to 7.
*
Table 6.19: Summary of Expenditure
Goods Expenditure £m
M Oth Toain er tal
Electrical 6 32. 96.4.0 5 5
Furniture 3 57.0 4.2 22.8
DIY 3 17.4 47.9 0.5
Clothing and Shoes 175.1 53.1 228.2
Total 303.8 125.8 429.6
6.44 In total, it is estimated that the existing c ison goo ns
( own centre, out-of-centre and l entre sp roximately
£ arison go xpenditure in the defin tchment. If this is
c ared with the £1,279.6m omparison expendit at is available within
t 05, it w appear that all comparis cilities in St Helens
g te a market share of 33.5%.
.45 In addition to the above analysis, WYG have found that of the £429.6m retained,
These result
shows that a third of the expenditure being spent in St Helens is at the town’s out-of-
F t Growth in Expen lens.
6.46 W st growth in convenience shopping cted at 1.1% per ann up to
2 hen 1.2% thereafter, it is estimated that St Helens B ugh will ex
an increase in convenience goo nditure of £28.1m in between 2005 a
6.47 on comparison goods would
suggest that St Helens market share would witness an increase of £185.6m between
e
future.
* excludes turnover derived from misc. local shops in Zones 4 to 7.
ompar ds facilities in St Hele
including t ocal c ace) retain app
429.6m of comp ods e ed ca
omp of c good ure th
he catchment at 20 ould on fa
enera
6
approximately 20.6% (or £263.8m) is spent at St Helens town centre with the other
11.2% (or £142.9m) being spent at out-of-centre facilities and the remaining 1.7% (or
£22.2m) being spent at smaller local centres (including Earlestown).
centre facilities.
orecas diture Attracted to St He
ith foreca predi um
006 and t oro perience
ds expe nd 2015.
By comparison, the significant increase in expenditure
2005 and 2015, which would be available for all new comparison retail facilities in th
70

Ta in St Helens
ble 6.20: Convenience Expenditure Available to Retail Facilities
Market Share
Expenditure Available to St Helens - £M
2010 2015 2005
C venience on
Main 4 .4 222.5 32.6% 201. 211
Top 2 .5 74.2up 31.0% 67. 70
A venience 268.7 282.0 296.8ll Con 32.2%
Total Convenience £ 268.7m £282.0m £296.8m
Ma up due to rounding
Table 6.21: Comparison Expenditure Available to Retail Facilities in St Helens
y not add
Market Share
Expenditure Available to St Helens - £M
Town Centre
Clothing, shoes, etc 16.6% 212.1 251.9 299.5
Electrical 3.2% 41.3 49.0 58.3
Furniture 0.5% 6.1 7.2 8.6
DIY 0.3% 4.4 5.2 6.2
Total Town Centre 20.6% £263.8m £313.3m £372.6m
Retail Warehousing
Electrical 3.7% 47.8 56.6 67.4
Furniture 3.2% 40.5 48.1 57.2
DIY 3.4% 43.5 51.5 61.3
Clothing 0.9% 11.9 14.1 16.8
Total Out of Centre 11.2% £143.7m £170.3m £202.7m
Local Centres (Including Earlestown)
Electrical 0.6% 7.5 8.9 10.6
Furniture 0.8% 10.4 12.3 14.7
DIY - - - -
Clothing 0.3% 4.3 5.1 6.1
Total Local Centres 1.7% £22.2m £26.4m £31.4m
Total Bulky Goods (inc
Town Centre)
15.7% £200.7 £238.3 £284.3
Total Non Bulky Goods 17.8% £228.9 £271.1 £322.4
Sub-total 33.5% £429.6 £510.0 £606.7
Inflow 5% £21.5 £25.5 £30.3
Total Comparison £451.1m £535.5m £637.0m
6.48 In order for St Helens to capture this significant growth in comparison goods
expenditure it is likely that there will be a need to enhance future retail provision,
thereby ensuring that this growth is not lost to competing centres and St Helen’s
future market share does not decline.
71

6.49 wever, if an excess of c on e fined
catchment area, this does not translate directly into a requirement for additional
cessary to take account of:
xisting development pro
anges in shop (incl g E-commerce ;
• the current capacity and efficiency of retail floorspace within the Town Centre,
• future changes in busin ductivity and current development commitments.
Ho omparis xpenditure manifests itself within the de
floorspace. It will also be ne
• e posals;
• expected ch ping patterns udin )
and;
ess pro
72

7.01 mportant pre-requisite to any proposed retail
development strategy as they provide invaluable information on the levels of demand
t will have on
established stores within the catchment of the centre under consideration. Capacity
development within Unitary Development Plans, Local Development Frameworks or
even Development Briefs.
7.02 However, it must be stressed that, although capacity assessments are based on
commonly used data and forecasts, the conclusions must only be treated as a
guide/indicator rather than providing unchallengeable evidence. This caveat reflects
the complexity of the modelling exercise and the dependence upon a high number of
assumptions, which consequently can be interpreted in a number of different ways.
7.03 The modelling for the capacity assessments set out in this report has been
undertaken for two different categories of expenditure. Typically, these categories
reflect the differences in patterns for food shopping (often referred to as
‘convenience’ shopping) and non-food shopping (often referred to as ‘comparison’
shopping). This approach is advocated in the emerging PPS6 which clearly states in
para 2.28:
‘in assessing quantitative need for additional development in its development plan, a
local planning authority should assess the likely future demand for additional retail and
leisure floorspace, based on existing and forecast population levels and expenditure in
relation to the classes of goods to be sold, with the broad categories of ‘convenience’
and ‘comparison’ goods.
7.04 Therefore for the purpose of this capacity exercise we have solely examined the
need for new convenience and comparison goods floorspace.
Capacity Formula
7.05 For all types of capacity assessment, the conceptual approach is identical, although
the data sources and assumptions may differ. The key relationship is: Expenditure
(£m) less Turnover (£m) equals Surplus/Deficit (£m)
7 RETAIL CAPACITY ASSESSMENT Methodology
Retail capacity assessments are an i
for additional retail facilities and the likely impact this developmen
assessments are also now an accepted method for guiding future allocations for retail
73

Expenditure (£m) - the expenditure element of the above equation is calculated by
ment and then multiplying this figure by
verage annual expenditure levels for various forms of retail spending per annum.
subject to a number of factors, which need to be considered to help
provide the most accurate figure for that particular local catchment. These include:
the catchment that has been adopted to calculate the
population figure. The turnover of existing facilities is calculated using Retail
r
provision’ of retail facilities within the catchment (which, other things being equal,
7.06
n of aggregate floorspace, using the turnover per square metre figures
sed to calculate the turnover part of the equation.
7.07 likely need for additional convenience goods floorspace
within St Helens Borough, it is important to understand the true nature of the existing
ted in the retail health check presented within this report, it is evident that
ience facilities within St Helens Town Centre is restricted to two
superstores, Safeway (now Tesco) and Asda, with the main food shop facilities
taking the population within the defined catch
a
The formula is
• growth in population;
• growth in expenditure per head per annum, and;
• special forms of trading (e.g. catalogue shopping).
Turnover (£m) - the turnover figure relates to the annual turnover generated by
existing retail facilities within
Rankings, an independent analysis which lists turnovers per square metre for all
major retail multiples.
Surplus/Deficit (£m) - this represents the difference between the expenditure and
turnover figures outlined above. Clearly, a surplus figure will represent an ‘unde
would suggest that additional floorspace is required), whereas a deficit would
represent an over provision of retail facilities (and in these circumstances it would
prove difficult to justify additional floorspace).
Although a surplus figure is generated in £m, it is possible to convert this figure into
an indicatio
u
Capacity for Future Convenience Goods
In order to ascertain the
supply.
7.08 As highligh
the supply of conven
primarily located in out-of-centre locations. In fact, the household survey identifies
the Asda and former Safeway store are the only facilities that are used for main food
shopping trips within the town centre.
74
7.09
y
appears to be least popular store attracting only £21.1m of expenditure.
7.10 rough also appears to be
at Boundary Road and Four
Acre Lane and Aldi on St Helens Retail Park all performing well.
7.11
Current Provision
7.12
GOAD report.
old goods. To account for this,
we have taken the approximate net convenience floorspace figures for the identified
ave and Morrisons) and then applied the
ratio for convenience/comparison goods sales area from Verdict (2004) to estimate
7.14 enchmark company turnover to floorspace ratios are applied to the net
floorspace figures for the existing retail facilities within St Helens, this provides a
In terms of individual foodstores within St Helens Borough, it would appear from the
survey results that Morrisons at Baxter Lane is the most popular store attracting
£59.4m of convenience expenditure generated within the catchment. The next most
popular store is Asda at Kirkland Street (£39.1m) which is closely followed by
Morrisons at its Boundary Road (£39.0m). The former Safeway on Chalon Wa
The provision of discount foodstores within St Helens Bo
strong with key stores such as the Kwik Save stores
The convenience provision in Earlestown also appears to be performing well. The
results from the household survey found that the Somerfield attracts £8.4m whilst the
former Safeway (now Tesco) attracts £8.3m.
Although robust up to data is available for all floorspace within St Helens Town
Centre it is more difficult to qualify the extent of the local convenience provision as
there is no consistent database to rely upon. Therefore, assumptions with regard to
the provision of local shops have been based on the floorspace figures adopted in
the 2001 MVM study and from the town centre’s
7.13 Given that the approach adopted is a ‘goods based’ approach, it is important to
recognise that certain major foodstore operators sell an element of non-food goods
such as books, compact discs, clothing and househ
foodstores (Safeway, Asda, Iceland, Kwik S
the likely sales area devoted to sale of convenience items.
When b
benchmark estimate of the current convenience goods turnover generated for each
store. We have calculated the expected turnover of these facilities by applying
figures relating to company benchmark floorspace to turnover ratios as shown below
in Table 7.1.
75

Table 7.1: Trading Performance of Current Foodstores in St Helens
Store Net Convenience Floorspace –
SQM (1)
Turnover per SQM (2)
Benchmark Turnover -
£M (2000) (1 x 2)
Survey Estimate -
£M (4)
St Helens Town Centre
Asda, Kirkland Street 1,832 13,472 24.7 39.1
Co-op, Hardshaw Centre 3,134 5,221 16.4 8.8
Kwiksave, Ormskirk Street 393 4,340 1.7 2.0
Lidl, Lowe Street 1,176 6,738 * 7.9 2.9
Safeway, Chalon Way 2,975 8,378 24.9 21.1
Marks & Spencer 423 10,063 4.3 3.4
Sub Total £79.9m £77.3m
Earlestown Town Centre
Safeway, Earle Street 1,309 8,378 11.0 8.3
Somerfield, Prescot Centre 1,055 5,876 6.2 8.4
Netto, Haydock Street 750 **** 4,165 * 3.1 0.7
Sub Total £20.3m £17.4m
Local Centres
Iceland, Boundary Road 358 4,324 1.5 1.0
Kwik Save, Boundary Road 811 4,340 3.5 3.0
Morrisons, Boundary Road 2,192 10,553 23.1 39.0
Iceland, Branchway, Haydock 1,658 4,324 7.2 1.0
Kwik Save, Haydock 1,630 4,340 7.1 5.1
Kwik Save, Four Acre Lane 904 * 4,340 3.9 15.4
Co-Op, Eccleston 160 **** 5,221 0.8 1.3
Sub total £47.2m £65.8m
Out-of-Centre
Iceland, St Helens Retail Park 869 4,364 3.8 4.5
Aldi, St Helens Retail Park 630 3,100 * 2.0 4.0
Morrisons, Baxter Lane 2,471 10,553 26.1 59.4
Sub Total £31.8m £67.9m
Other
- Town Centre (inc. market) 8,106** 3,500 28.4 10.5
- Local centres 10,162*** 3,000 30.4 29.9
Other sub total £58.8m £40.4m
Total £238.0m £268.7m
1. Net convenience floorspace figures taken from St Helens MBC where known; or IGD *; figures for the
St Helens town centre were derived by excluding the identified stores from the GOAD convenience
figure; floorspace figures for local centres taken from previous MVM study (2000). Figures for Co-op,
Eccleston and Netto, Earlestown – WYG estimate.
2. Turnover per sq. m at 2000 prices, taken from Verdict Grocers 2004, although figures for Aldi, Lidl
and Netto taken from Mintel Retail Rankings 2004 and adjusted to 2000 prices.
3. We should note that the Safeway store on Chalon Way is being converted into a Tesco store.
76
7.15 A ultiple convenience
ret ave been taken from Verd Gro 4) ver
Aldi, Lidl and Netto, turnover f ee fro et s
(2004) as the level of comparis in these stores is ed. The over
figures have then been adjusted t AT, petrol sale 0 P Base
us model.
7.16 As ben not available for indepen rs, we have applied a
broa net fo centres and £3,500 fo wn centres) of
likely turnove professional ent, base erience an
the quality of the facilities available, as th s no a dged so of information
for ndent retailers.
Fu oorspace Req nts
7.17 Ou ns Borough’s share enience s expenditure
wit ined catchment (identified in the previous section) s that
ap 68.7m will be available to convenience goods stores within the
de
7.18 Wh with tal tu enerated by existing retail
fac erages (£238m), there would appear to be a potential
un nience retail faci f approximately £30.7m when comp
to 'ben rs. T nal diture will er be passin
throug s which in aggre uld be above co average
or the other nience stores (whi t publish turn s) may be
perfo ed.
7.19 Th erated by our d ana pears to support the above
ass some existing stores are over-trading. From the e it is c t
the two Morrisons stores are trading signific ve their benchmark. Other stores
tha ing are at Kir treet an Somerfi
Ea ntrast the eviden hat the afeway in St H
an hich are now both being re-branded s Tes de
whi lects their declining image and market share natio ally
7.20 For e r
Lane, then i
ap o
only £ trading by 126%.
ccurate figures as to the 'benchmark' turnover (2) of the national m
ailers h ict’s
igures have b
on goods with
o reflect V
cers Retailers
n taken
Report (200
m Mintel R
limit
. Howe
ail Ranking
turn
s and the 200 rice
ed throughout the retail
chmark figures are dent retaile
d estimate (£3,000 per sq. m r local r to
r. This is a judgem d on previous exp d
ere i cknowle urce
smaller indepe
ture Convenience Fl uireme
r analysis of St Hele market of conv good
hin the def indicate in 2005
proximately £2
fined catchment.
en we compare this estimate the to rnover g
ilities based on company av
der-supply of conve lities o ared
chmark' anticipated turnove his additio expen eith g
h existing shop gate co trading mpany s
smaller conve ch do no over figure
rming better than we have estimat
e surplus capacity gen detaile lysis ap
ertion that vidence lear tha
antly abo
t are significantly over-trad the Asda kland S d the eld in
rlestown. In co ce found t two S stores elens
d Earlestown (w a co) are un r-trading
ch ref n .
xample, if we were to use the survey evidence for the Morrisons store at Baxte
ts current market share would suggest that the store is generating
pr ximately £59.4m per annum. This compares to the company benchmark figure of
26.1m. This would appear to demonstrate that the store is over-
77

7.21 In addition, to Baxter Lane, the Morrisons at Boundary Road (based on its current
7.22 results of shopper surveys should only be used with
caution to estimate the turnovers of individual stores (rather than their comparative
7.23 enditure, it is now important to estimate the likely
quantitative need for additional convenience facilities within the town through to 2015.
ould be made available to new
onvenience floorspace.
market share) is generating approximately £39m per annum. This compares to the
company benchmark figure of just £23.1m, thus demonstrating that the store is
overtrading by 68%. This trend is also found at the Asda store, which is estimated to
over-trading by as much as 58%.
It must be noted, however; that the
market shares). Nevertheless, the results appear to confirm our impressions of over-
trading gained on our visits to Morrisons, which appears to be a well-used store
throughout the week.
Having identified this surplus exp
It is assumed that the surplus expenditure w
c
Table 7.2: Estimated Need for Convenience Facilities
Turnover - £M Increased
Productivity £m
Expenditure Available - £M
Surplus Expenditure - £M
2005 238.0 268.7 30.7
2010 238.0 282.0 44.0
2015 238.0 296.8 58.8
Source: WYG 2005 at 2000 Prices
It must be noted that the above surplus expenditu7.24 re is a cumulative total applicable to
the whole of the Borough and does not necessarily presume that the 'excess'
7.25
ator was specified at
the time of the application, if we assume a major operator (such as Tesco) occupies the
expenditure identified can be drawn to a single new retail location within the Borough.
In addition, it is also important to account for existing commitments within the area
which will clearly absorb a certain proportion of the surplus capacity available. At
present, there are two outstanding planning consents. The first relates to the foodstore
element of the Central Works in Haydock (P/2003/0045), which comprises 3,250 sq. m
gross (2,113 sq. m net, assuming a 65:35 ratio). Although no oper
proposed store the turnover could be up to £25m. The second commitment
(P/2001/1160) is in respect of extension for the Safeway at Chalon Way, which
comprised 727 sq. m (net). The extension could amount to an increase in turnover of
approximately £6m (based on Safeway sales densities).
78

7.26 If we assume that the turnover of the proposed store at Central Works amounts is
approximately £25m when this is combined with the potential turnover of the Safeway
extension the commitments could amount to £31m. However, it is also important to
note that the Safeway at Chalon Way has now been re-branded as a Tesco store.
Given that Tesco achieve a greater sales density compared to Safeway it is important
to allow for a potential ‘uplift’ in the turnover that will be achieved when the store is
chieved as part of the re-branding of the former Safeway store.
This also applies to the Safeway in Earlestown which is now also operating as a Tesco
7.27
is already potential for £38.5m to be generated within St
elens.
7.28 When this is comp timated s diture ) it
would appear that d’ identif be satisfied by existing
commitments and e two Safeway stores. However, based on the
forecast growth in exp ture through to 2010 it is evident that there will be further
quantitative capacity available by 2010 of approximately £5.5m (£38. 4m). This
coul se further to £ 38.5m - £58.8m
7.29 addition, this analysis assumes that the market share now recorded for convenience
of this expenditure may have been flowing into the catchment from other centres where
established. If we apply Tesco’s average sales density to the net floorspace (including
the extension) then the turnover could be approximately £41m (3,702 sq m x £11,075
per sqm). This compares to Safeway which would have generated approximately
£31m (3,702 sq m x £8,378 per sqm). This would suggest that there is a potential uplift
of £10m that could be a
store. On this basis, the uplift achieved in the turnover of this store could be £3.5m.
If this £13.5m potential uplift is then added to the commitment at Central Works, this
would suggest that there
H
ared to the es
the ‘nee
the re-branding of th
urplus expen of £30.7m (as at 2005
ied at 2005 can
endi
5 - £4
d increa 20.3m (£ ) by 2015.
In
goods facilities within St Helens will remain static through to 2015. However, as
highlighted in Section 5 of this report, St Helens has experienced a dramatic fall in its
convenience goods market share in the space of just four years. Although a proportion
provision needed to be strengthened (such as Prescot), it is evident that the extension
of key facilities both in Wigan and to some extent Warrington have impacted upon the
market share of St Helens. Therefore, as part of any future strategy, it will be important
for the Council to consider potential qualitative improvements in the convenience goods
offer to ensure that the market share can be stabilised if not improved. Clearly the
introduction of two new Tesco stores through the re-branding of the former Safeway
stores should provide certain qualitative gains although this position will need to be
carefully monitored in the future.
79

Capacity for Future Comparison Goods
As our general standard of living increases, our ability to spend more money on non-
food goods (such as clothing and footwear) will also increase. The current ultra-long
term growth rate provided by URPI suggests that this growth is likely to be 3.7% per
annum (after 2004). Clearly, over any plan period this represents a significant
cumulative increase in total non-food expenditure.
However, although non-food shopping is often seen as a leisure/social activity, there
are increasing pressures being placed upon the traditional high street function, not only
from major out-of-centre retail facilities.
7.30
7.31
Although we have accounted for special forms of trading within our expenditure
emerging form of retailing the likely impact of such technology is still somewhat
7.33
e the St Helen’s current
share of non-food retail expenditure by the current level of facilities within the town.
7.34
7.35
7.36 Drawing upon the results of the modelling outlined in the previous section, we have
forecast that between 2005 and 2015, an additional £186.5m will be available for
comparison goods shopping within St Helens Borough. PPS6 advocates that this
7.32
analysis, we feel that because we are forecasting up to 2015 it is important that we do
not ignore the rapidly expanding opportunities of retailing on the World Wide Web,
currently known as ‘e-commerce’ or ‘e-tailing’. As this is still very much a new and
unknown.
With such a diverse range of retail warehousing, high street multiples and independent
comparison goods retailers that trade in St Helens, it is more difficult to estimate the
likely ‘benchmark’ turnover of each facility. Therefore, the most accurate way to
estimate the turnover of the existing retail facilities is to divid
From our analysis of the market share of facilities in St Helens, we estimate that the
current level of trade passing through non-food facilities from the defined catchment
(which includes both non-bulky and bulky goods) is £429.6m. This represents 33.5% of
the total comparison goods expenditure generated within the defined catchment. In
addition, the retail model has allowed for a 5% inflow of expenditure from outside the
defined catchment. Given the size of the catchment adopted it is estimated that this
5% inflow is realistic and should not be increased.
On this basis, we have 'rolled forward' St Helen’s current market share to examine the
likely comparison floorspace required maintaining its current position within the
hierarchy, namely at a level of approximately 34% of all comparison goods expenditure
in the defined catchment area.
80

should be focused within St Helens Town Centre as a first preference, subject to
te the level of potential floorspace. Clearly,
expense of the future vitality and
viability of the Town Centre. Furthermore, with significant new development planned
that St Helens seeks to at least maintain its
current market share during the plan period if not enhance it.
7.37
igh quality fashion and department store sector that appears to be under
represented in St Helens.
7.38
suitable sites being available to accommoda
if no additional comparison goods floorspace was developed within the period up to
2015 then, regardless of improved ‘productivity’ by existing facilities, the majority of this
surplus would be lost to competing centres identified previously. In addition, St
Helens’s market share of all comparison expenditure could then fall from its current
34% to 24% - such a decrease could significantly change the future shopping and
trading patterns within the defined catchment at the
for Liverpool City Centre (Paradise Street redevelopment), Warrington Town Centre
(Golden Square extension) and Wigan Town Centre (extension to the Grand Arcade
Shopping Centre), it will be imperative
From our assessment of the current vitality and viability of the existing town centre it is
evident that St Helens is well represented by multiple high street retailers, but the
centre could benefit from additional investment to provide more attractive premises to
accommodate modern retailer’s requirements. This especially relates to the rapidly
expanding h
By allowing for increased productivity (1.5% per annum) we have estimated below the
likely expenditure that will be available for new comparison goods floorspace by 2015. Table 7.5: Estimated Available Comparison Expenditure
Turnover + Expenditure Surplus for Increased
Productivity £m
Available £m
Additional Floorspace
£m
2005 450.5 450.5 -
2010 485.3 535.5 50.2
2015 522.8 637.0 114.2
7.39 The results show that by 2010 there will be £50.2m of comparison good expenditure
.40 In terms of town centre space, if we were to apply the derived average existing sales
available for new retail development, based on current market shares. This level of
expenditure will increase to £114.2m by 2015. This amount of the expenditure will be
available to all comparison floorspace.
7
density of £5,000 per sq. m to the surplus expenditure, we estimate that by the year
2010 there will be a requirement for approximately 9,320 sq. m net (approximately
81

13,314 sq. m gross) to retain its current market share. In addition we estimate that
this capacity would increase to 19,679 sq. m net by 2015 (28,113 sq. m gross).
Table 7.6: Estimated Comparison (Town Centre) Floorspace Requirement
Surplus Expenditure
£m
Average Sales Density + increases
in productivity £ per m2
Net floorspace
Requirement m2
Gross floorspace
Requirement m2
2005 - £5,000 - -
2010 50.2 £5,386 9,320 13,314
2015 114.2 £5,803 19,679 28,113
Gross to net = 70%
.41 Clearly, the above analysis assumes that the expenditure growth generated will be
tudy, it is acknowledged that the current provision of retail
warehousing within St Helens is very strong. This position will be further reinforced
ssumed that the majority of future comparison goods provision will be focused on
the market share of the town
centre wh ch appe slipped’ sl st four ye
Future Proposals for ce
7.42 In terms of future commitments, there are currently a number of outstanding ning
pe ions relating to com n goods retailin in St Helens. are
detailed in Table 7.7 below.
7
directed towards the established town centre of St Helens. Therefore, an appropriate
sales density of approximately £5,000 per sq. m has been applied to the estimated
surplus expenditure. If further comparison goods development was to occur that was
contained within an extension to a supermarket or the development of a retail
warehouse then the sales density applied would differ. However, from the research
undertaken within this s
by the commitments (set out below) which would further reinforce St Helens ‘bulky
goods’ market share. On this basis, the analysis undertaken for this study has
a
town centre redevelopment to help assist in recovering
i ars to have ‘ ightly in the pa ars.
Comparison Floorspa
plan
rmiss pariso g with These
82

Table 7.7: Comparison Planning Commitments 2005
Development Date Gross Permitted Floorspace
Net Floorspace
(sq. m) (sq. m)
Estimated Turnover
£m
St Helens
West Point, St H 04 2.4elens 19/10/20 1,180 944
Ravenhead Retail Park * 4/10/2004 6,271 377 13.45,
St Helens Retail Park 2/07/2002 2,787 2,230 5.6
Unit 14, Milvern Way 5/2001 0.5 11/0 256 205
Former Abba Site, B ood Roa /2004 1,840 4.6urtonw d 1/10 2,300
Clock Face Road, Sutton Leach 18/6/2004 361 189 0.5
Central Works, Haydock 26/03/2003 1,394 1,152 2.9
Mainsway, Burtonhead Road * * 12/04/2005 5,806 4,645 11.1
Total 20,355 16,582 41.0
7.43
7.44
which are
redominantly retail warehousing schemes. However, for the purpose of this study it
ity of £2,500 per sq. m should be
applied where appropriate.
7.45 It is unlikely that the market share for St Helens can be dramatically increased in the
future. Although increases have been recorded since the 2001 study was prepared,
we believe that it would be unrealistic to predict significant increases given the
strength of competing centres elsewhere. It is evident that the implementation of the
commitments outlined above will have an impact on future market shares for
comparison goods. However, it must be noted that these scheme are predominantly
for retail warehousing facilities which will also compete with existing supply within St
Helens. Given the qualitative deficiencies identified within the town centre
Source: St Helens MBC (2005) Gross to net = 80% (unless stated) * reserved matters * * Turnover taken from WYG Appraisal of Planning Application (Feb 2005)
Table 7.7 above indicates the significant amount of outstanding comparison goods
retail planning commitments within the Borough. In terms of facilities within St
Helens, it would appear that there are currently commitments in place which would
absorb £41m of the £50.2m through to 2010.
Without details on the end occupiers of the outstanding planning permissions, we
cannot accurately estimate the potential turnover of existing commitments
p
has been assumed that an average sales dens
Improving Future Markets Shares
83

particularly linked to the lack of a quality large department store and larger units that
icipated that greater opportunities
r increasing market share could be delivered through a comprehensive town centre
redevelopm
7.46 However, in order to deliver just a small increase market share there will be a
signifi ality comp goods floorspace. For exa ple at
the mome appear to be s capacity of £ 3.3m by 20 after
allowin mmitments. If this expen was ta d towards the town
ce e oximately 0 sq. m net (17,945
sq result o a departm tore and uality
fa arket share lightly from 34% to 37% (a 9%
in y qua d would increase to 100m
(a for existing commitments at £41m). This would e into a requirement
q. m net (24,480 sq. m gross).
will appeal to high street national multiples, it is ant
fo
ent scheme.
in
cant requirement for high qu arison m
nt there would a surplu 7 15
g for existing co diture rgete
ntre then this could generate the n ed for appr 12,60
. m gross). However, if as a f securing ent s high q
shion retailers, the m increased s
crease overall) then the likel ntitative nee over £
llowing translat
for approximately 17,250 s
84

8
8.01
rch and the review of the vitality and viability of the two
main established centres within the Borough which are St Helens and Earlestown. It
is evident that Earlestown performs a district centre role primarily providing for
8.02
t St Helens Town Centre
is also showing strong signs of vitality and viability. However the analysis set out in
this report appears to demonstrate that the centre’s overall market share for non-food
goods (clothing, shoes etc) has declined slightly since 2000. By scrutinising the
changes in shopping patterns that have occurred since 2000, it would appear that the
draw of the Trafford Centre and improved facilities in both Liverpool and the New
Mersey Retail Park have had an impact on retention levels within St Helens.
8.03 In the same period, it would appear that the development of significant retail
warehousing within the St Helens area has assisted in significantly increasing the
market share particularly for bulky goods. Whilst this development has had some
impact on the market share of the Town Centre, its addition to the retail offer within
the St Helens area has helped support an overall increase in market share for
comparison goods.
8.04 If the existing market share achieved to date is rolled forward through to 2015, it is
evident that there is significant need for further comparison good floorspace within St
Helens. As highlighted above, the growth alone in comparison goods expenditure
will exceed over £114m available to St Helens by 2015. Although there are
significant commitments which would absorb £41m of this capacity it is evident that
there will still be a need for future comparison goods floorspace beyond 2010. Given
that the existing commitments are primarily concentrated in the retail warehouse
sector, it would appear that any future strategy perused by the Council must focus on
opportunities within or on the edge of the established centre of St Helens. By
pursuing such an opportunity, it may be possible to accommodate a department store
and high quality retail units that would appeal to high street national multiple retailers
which in turn could increase future market shares. White Young Green do not
SUMMARY The research undertaken as part of the St Helens Retail Capacity Study has involved
both original market resea
convenience shopping needs of its immediate community. The vitality and viability
assessment appears to suggest that the centre is performing well and has recently
benefited from investment from Tesco in the re-branding of the former Safeway store.
Beyond improvements to the overall quality of the environment and trade mix, it is not
anticipated that Earlestown should be expanded significantly in the future.
On this basis, it is anticipated that the majority of future growth, particularly in
comparison goods retailing, should be targeted towards the established centre of St
Helens. From the research outlined above, it is evident tha
85

anticipate that a dramatic increase in market share could be achieved. However just
y increasing the share from 34% to 37%, it would appear that there could be a need
8.05
ases in
turnover achieved at the two former Safeway stores which have now been re-
large
8.06 s
fallen dramatically in the past 4 years. Whilst this has been brought about by
may be
s.
Anticipated Growth in Cafes, Restaurants and Bars
8.07
n centre
. This
b
for approximately 25,000m gross of comparison goods floorspace. Given the
significant scale of such development, it will be important now for the Council to
explore opportunities to accommodate the identified need which is likely to occur
between 2010 and 2015.
Future Foodstore Development
As highlighted in Chapter 7, it is evident that once the analysis has allowed for the
outstanding foodstore commitment at Central Works, Haydock and the incre
branded to Tesco, there is unlikely to be sufficient capacity to support another
foodstore within St Helens. However, the study does identified that further
quantitative capacity will be available to support new foodstore development through
to 2015. From our analysis, this would amount to approximately £20m which as
highlighted above is insufficient to support the development of a new large foodstore
but would support further extensions to existing provision or any remodelling that may
increase the net floorspace available to the sale of convenience goods.
In addition, it must also be noted that the market share for convenience goods ha
improvements to the provision in locations such as Prescott and Wigan there
opportunities in the future to reinforce and strengthen the market share for St Helen
However, we do not anticipate that a market share could be achieved similar to the
levels recorded in 2000 whereby there appeared to be unsustainable patterns of in-
flow from the Prescott area into St Helens.
As highlighted in Section 4 of this report, St Helens Town centre has witnessed a
significant growth in food and drinking establishments between 2000 and 2004.
However, from detailed analysis of this provision, it would appear that the tow
has a slight deficiency in terms of restaurants when compared to the national
average. Whilst the provision of restaurants in the future will be driven by cultural
attractions and redevelopment opportunities, it is evident that as part of any future
strategy, the Council should seek to encourage restaurant uses either in a
designated area of the town centre or as part of future redevelopment schemes
strategy should be developed as part of any future review of the Primary frontage
policy to ensure that there is sufficient flexibility to enable such uses to penetrate the
traditional retail core.
86
8.08
n,
sh –
ch
is partly derived from foreign travel which is also
increasing and expanding to new countries, making it possible to introduce new
ajor implications for the expansion of the
restaurant and café industry within St Helens which has witnessed a dramatic
8.09 undertake
6,
l have to be
given to out of centre locations that can forge strong links with the established Town
Continuous growth is forecast in the restaurant sector given that eating out has
become a major element in the lifestyles of the younger generations. In additio
restaurants in the UK will also continue to benefit from a characteristic of the Briti
a willingness to experiment with new foods and drinks and eating out concepts su
as tapas or sushi bars. This
styles of cuisine. This clearly has m
increase in the past four years and should be actively encouraged in the future.
Conclusions
In summary, this study demonstrates that there is a need for the Council to
a review of potential site based opportunities to accommodate the need identified
within this study. To reflect the aims and objectives of the recently published PPS
the Council should seek to take a pro-active approach to identifying redevelopment
opportunities where available within and adjoining the established centre of St
Helens. If no opportunities can be identified then further consideration wil
Centre.
87