Embed Size (px)
Citation preview

WHITE STORKCiconia ciconiaOrder: CiconiformesFamily: Ciconiidae
by PASQUA ROSA PONZIANI
INTRODUCTION

General informationThe age of first-breeding varies between 3 and 6 years (rarely 2 or 7)
Europe is their breeding area
Males arrive about one week before females, take up possession of a nest and defend it
The first female to arrive at the nest is usually accepted and a monogamous relationship is formed
The same pair may nest together over more than one season

Nests are constructed in sunny and elevated positions, like the top of electricity poles, church towers and roofs
Clutch size varies from 2 to 6 eggs, with 4 eggs being the most usual number
Incubation period is 33-34 days, with sitting shared by both sexes
Eggs hatch asynchronuously and both parents care for and feed the young

The number of young successfully fledged is usually between 2 and 3
Sometimes an adult may kill and eat a nestling or throw it out of the nest, if it appears weak
The young leave the nest at 58-64 days of age and become independent 7-20 days thereafter, when they leave the nesting area

Diet of White Storks in lake Kerkini (Goutner V., Furness W., 1997): Examination of pellets showed that diet was mainly composed of Orthoptera (61.9%), then Coleoptera (30.5%), Hemiptera (5.6%), Insect larvae partly aquatic (1.0%)
Fish was not found in pellets, but scales were found on the bill of chicks, probably because the fish bones are entirely digested.
Diet of White Stork
The White Stork feeds exclusively on animal matter. It takes a very wide variety of food, including small mammals, eggs, fledglings and small birds, reptiles, amphibians, fish and invertebrates
Migration
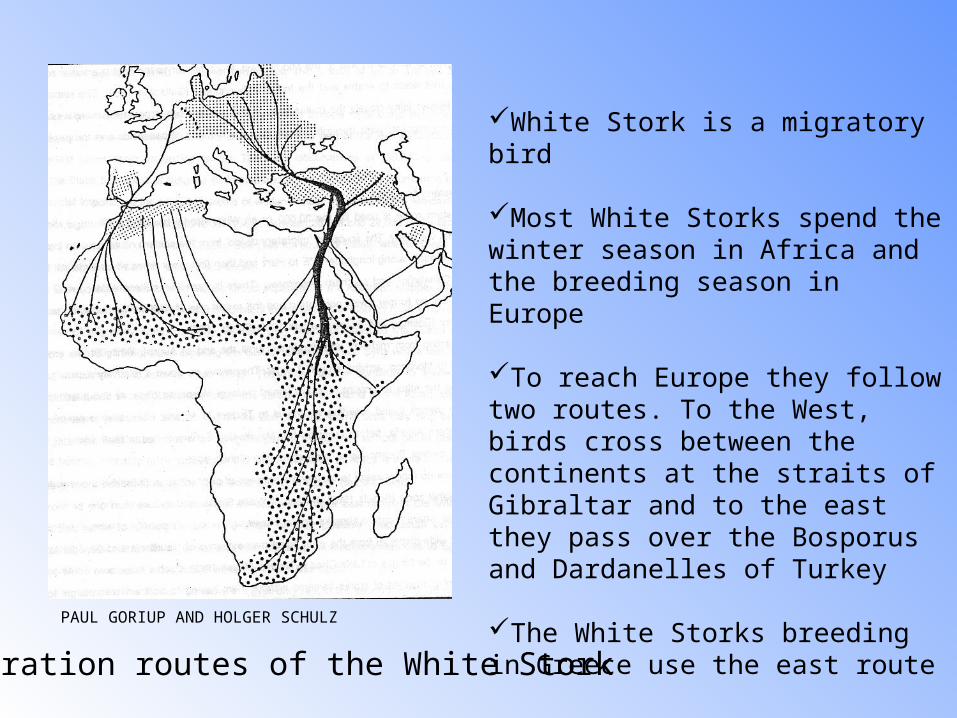
Migration routes of the White Stork
White Stork is a migratory bird
Most White Storks spend the winter season in Africa and the breeding season in Europe
To reach Europe they follow two routes. To the West, birds cross between the continents at the straits of Gibraltar and to the east they pass over the Bosporus and Dardanelles of Turkey
The White Storks breeding in Greece use the east route
PAUL GORIUP AND HOLGER SCHULZ
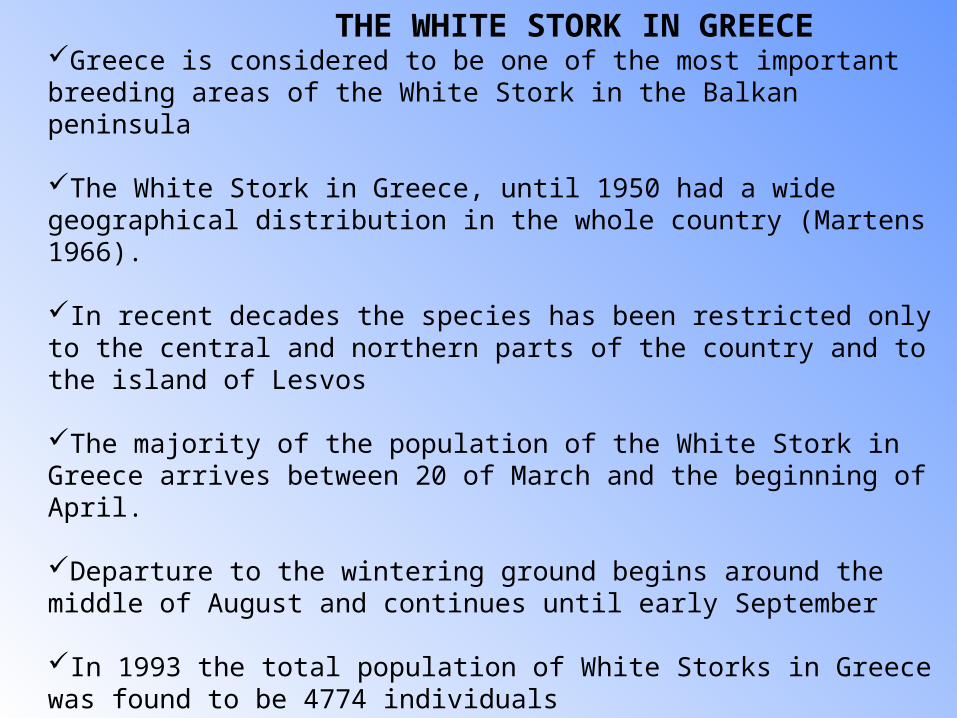
THE WHITE STORK IN GREECEGreece is considered to be one of the most important breeding areas of the White Stork in the Balkan peninsula
The White Stork in Greece, until 1950 had a wide geographical distribution in the whole country (Martens 1966).
In recent decades the species has been restricted only to the central and northern parts of the country and to the island of Lesvos
The majority of the population of the White Stork in Greece arrives between 20 of March and the beginning of April.
Departure to the wintering ground begins around the middle of August and continues until early September
In 1993 the total population of White Storks in Greece was found to be 4774 individuals
The higher portion is located in central and northern districts. Macedonia was found to have the highest number of nests, about 1382.(all data from Tsacalidis and Papageorgiou)

The area of behaviour observation was Kerkini
Wetland seems to be the most important ecological factor affecting the distribution and population abundance of the White Storks. Macedonia districts where the most wetland areas in Greece are located showed the highest population density.
Wetland: is a particular environment where the predominant element is water, and it is permanently or periodically covered by water.
http://students.ceid.upatras.gr/`pirot/serres/3p_nofr.html

OBJECTIVES OF BEHAVIOUR STUDY
FEEDING BEHAVIOUR:General activity of feeding behaviourMean feeding time per feed for each nestMean feeding effort in relation to the number of chicks in nestMean time between two feeding
SHADING BEHAVIOUR:How shading behaviour changes throughout the day influenced by the change of temperatureIf shading behaviour is influenced by number of chicksHow much time both parents are absent from the nest

METHOD
Sampling area:
The observations were carried out on 9 nests (numbered 1 to 9) in the village of Kerkini (Macedonia region).
-Nests no.1 to 5 are build on artificial platforms set on electricity poles along a road.
-Nests no. 6, 7 and 8 are build on the towers of the church, away from the road. They are in close proximity and nest no.8 was shadowed by nest number 7 from approximately 12.30 to 19.00
-Nest no.9 is build on the roof of an elementary school.

Example of a nest near the road
Nests no. 6, 7 and 8, on the church.
Nest no.5
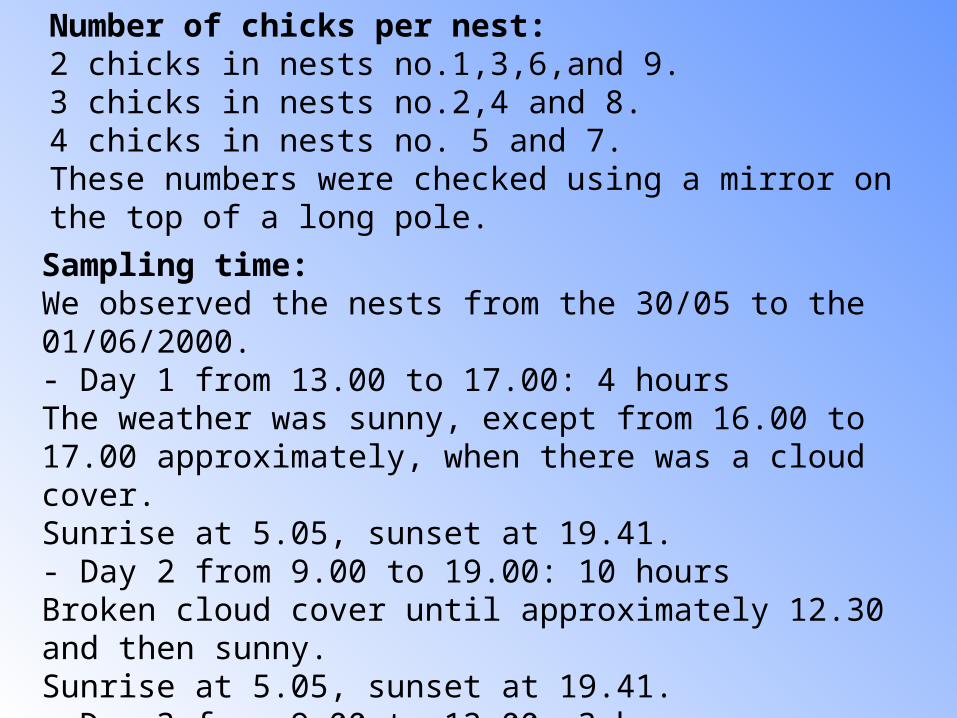
Sampling time:We observed the nests from the 30/05 to the 01/06/2000.- Day 1 from 13.00 to 17.00: 4 hoursThe weather was sunny, except from 16.00 to 17.00 approximately, when there was a cloud cover.Sunrise at 5.05, sunset at 19.41.- Day 2 from 9.00 to 19.00: 10 hoursBroken cloud cover until approximately 12.30 and then sunny.Sunrise at 5.05, sunset at 19.41.- Day 3 from 9.00 to 12.00: 3 hoursClouds and storm until approximately 11.00, then sunny.Sunrise at 5.04, sunset at 19.42.
Number of chicks per nest:2 chicks in nests no.1,3,6,and 9.3 chicks in nests no.2,4 and 8.4 chicks in nests no. 5 and 7.These numbers were checked using a mirror on the top of a long pole.

Behaviours observed:
Feeding behaviour:When parents regurgitate food in their nest to feed their young.The regurgitation of water was not counted as feeding behaviour since it is both to water and wet the chicks.
During the feeding behaviour the parents take a characteristic position: they lean over the nest and regurgitate food into the center.
The chicks can stimulate their parents by pecking at their bills.
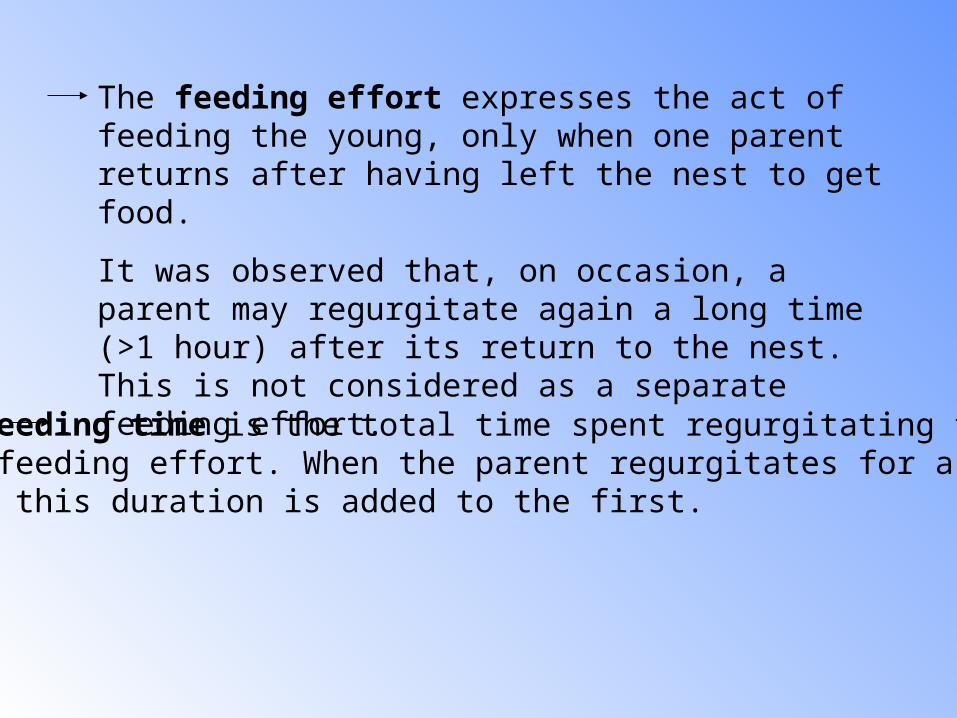
The feeding effort expresses the act of feeding the young, only when one parent returns after having left the nest to get food.
It was observed that, on occasion, a parent may regurgitate again a long time (>1 hour) after its return to the nest. This is not considered as a separate feeding effort.
The feeding time is the total time spent regurgitating for each feeding effort. When the parent regurgitates for a second time, this duration is added to the first.

Shading behaviour:When parents shade their young with their back oriented to the sun.On the first day, no gradation was defined in the shading behaviour.From the second day we defined 2 grades :
Shading1: with body only, wings not open.
Shading2: with body and wings partially open.
Shading 1 Shading 2

Observation method:Observations were made with binoculars.Start and finish times are recorded for each behaviour. The times given in the results are Central European Times, they are one hour behind the sun time.
Other parameters:
The temperature was taken in the sun each hour from 14.30 the 1st day.
The presence of clouds was also noted
The interactions with other individuals were also taken into account (e.g. Intruders disturbing nests,…).
feeding effort during the day
0123456789
1011
time
fee
din
g e
ffo
rt
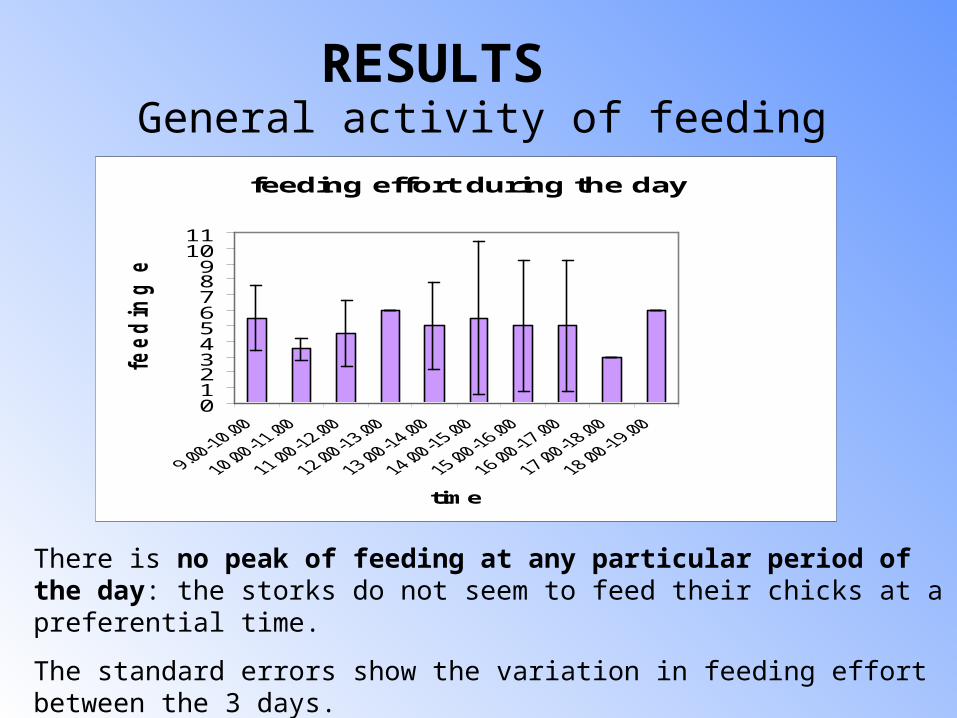
General activity of feeding
There is no peak of feeding at any particular period of the day: the storks do not seem to feed their chicks at a preferential time.
The standard errors show the variation in feeding effort between the 3 days.
RESULTS

mean interval between feeds for each nest
0
50
100
150
200
0 5 10Nest number
Min
utes Mean time
between 2 feeding
Does the feeding effort change between the nests?
Total mean=113.62mn
Sdt error=24.67
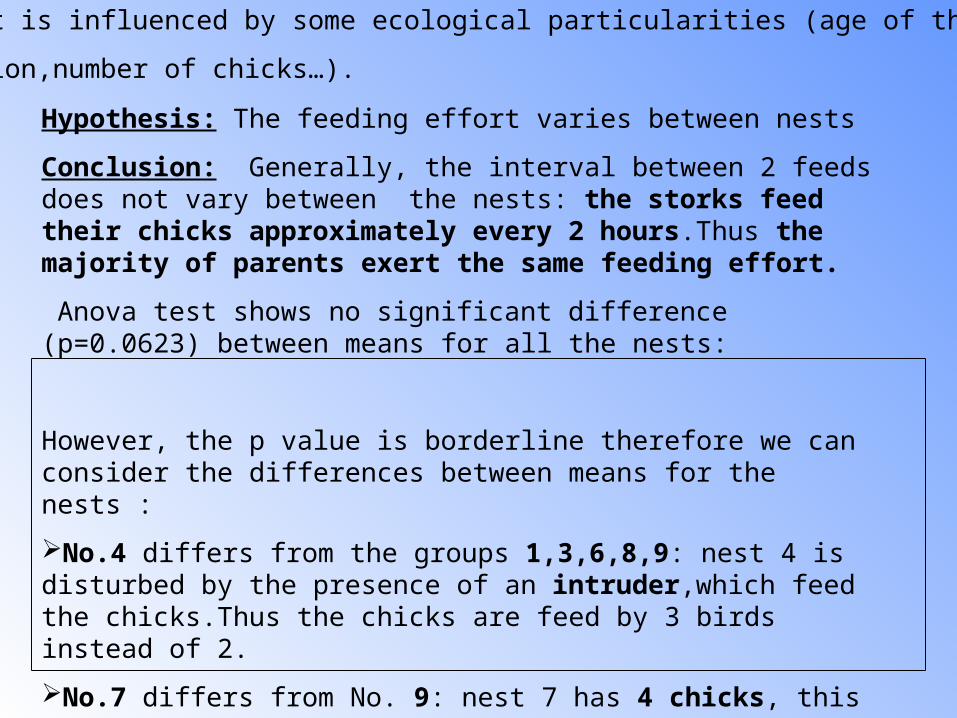
Hypothesis: The feeding effort varies between nests
Conclusion: Generally, the interval between 2 feeds does not vary between the nests: the storks feed their chicks approximately every 2 hours.Thus the majority of parents exert the same feeding effort.
Anova test shows no significant difference (p=0.0623) between means for all the nests:
However, the p value is borderline therefore we can consider the differences between means for the nests :
No.4 differs from the groups 1,3,6,8,9: nest 4 is disturbed by the presence of an intruder,which feed the chicks.Thus the chicks are feed by 3 birds instead of 2.
No.7 differs from No. 9: nest 7 has 4 chicks, this may increase the feeding effort, and decrease the interval between 2 feeding.
Each nest is influenced by some ecological particularities (age of the parents,
competition,number of chicks…).

Does the feeding effort increase with the number of chicks?
Mean feeding effort per nest per day
0
5
10
15
2 3 4
number of chicks per nest
nu
mb
er o
f fe
edin
g
effo
rts

Hypothesis:More chicks in the nest increase the stimulation for parents to get food. Thus the feeding effort should increase with the number of chicks.
Conclusion:The nests with 4 chicks are significantly different from the nests with 2 and 3 chicks (p=0.0128): thus parents with 2 or 3 chicks feed their chicks less than parents with 4 chicks .
The feeding effort seems to increase with the number of chicks but the lack of data prevents us from drawing conclusions.
Nest 4 has a specific feeding behaviour: 3 birds feed 3 chicks whereas usually the chicks have only 2 parents.Thus we decided to exclude it from the test.

Do some parents feed for a longer time than others?
Mean feeding time in minutes per nest
0
2
4
6
8
10
12
14
8 9 2 5 1 3 6 7 4
nest number
feed
ing
tim
e (m
in)

Hypothesis:The feeding time varies between nests
Conclusion:
With the Anova test (p=0.1373) we have made the comparison of the mean feeding time between the nests.This shows that either the data is unreliable or there is no significant difference between the means and therefore all the birds regurgitate for approximately the same duration.
The time of feeding ranges between 4 and 7 minutes.
There is no relationship between the feeding time and the number of chicks.
The poor number of data prevent us drawing conclusion and
the statistic tests are at the limit to be acceptable.
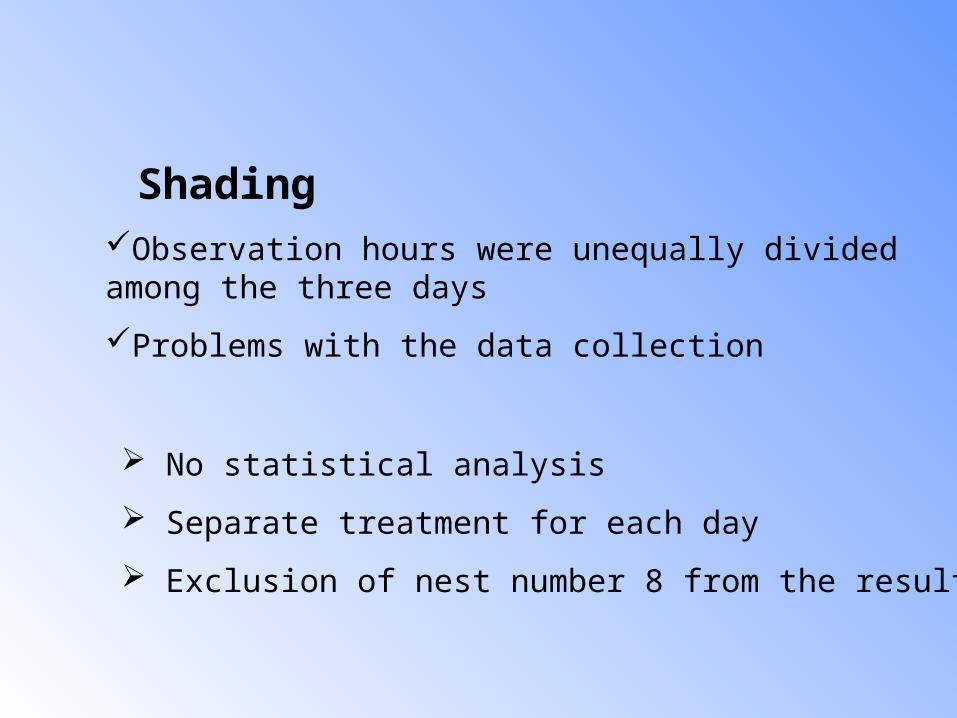
ShadingObservation hours were unequally divided among the three days
Problems with the data collection
No statistical analysis
Separate treatment for each day
Exclusion of nest number 8 from the results

DAY ONE
Mean Shading Time for Day One
0204060
Time of Day
Sha
ding
(min
s)
0204060
Tem
p. (o
C)
Shading
Temperature
• Relation between temperature and shading time

DAY TWO
Mean Shading Time for Day Two
0102030405060
Time of Day
Sh
adin
g (
min
s)
01020304050
Tem
p.
(o C
) Shading 2
Shading 1
Temperature
• As the temperature increases, shading 2 increases and shading 1 decreases (total shading increases)
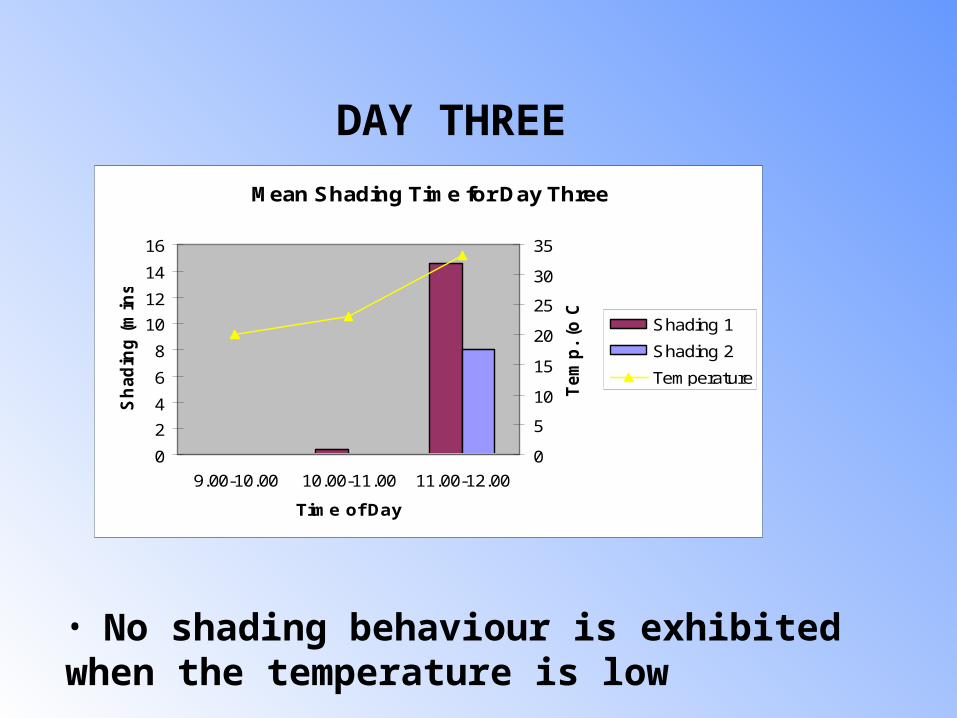
DAY THREE
Mean Shading Time for Day Three
0
2
4
6
8
10
12
14
16
9.00-10.00 10.00-11.00 11.00-12.00
Time of Day
Sh
ad
ing
(m
ins)
0
5
10
15
20
25
30
35
Tem
p.
(o C
)
Shading 1
Shading 2
Temperature
• No shading behaviour is exhibited when the temperature is low

Groups of nest with 2, 3 and 4 chicks
Table . Mean shading time for nests with 2,3 and 4 chicks per hour for each day
No. chicks per nest
Day 1 Day 2 Day 3
2 (n=4) 46.5 9.5 49.0 11.5 11.0 3.0
3 (n=2) 40.0 9.0 38.0 15.0
8.5 4.5
4 (n=2) 30.5 11.0 17.0 6.0 3.5 2.5
• When more chicks are present the amount of shading time decreases.

nest 1 2 3 4 5 6 7 8 9Day 1 0 0 0 4 15 0 4 1 0Day 2 0 1 0 3 83 2 187 0 4Day 3 0 36 1 0 0 0 6 0 0
Duration of parents absence
Table 2. Absence Time (min) of both parents from nests for each day. In bold are the nests with 4 chicks.
• When more chicks are present parents seem to leave the nest for longer periods

DISCUSSION• Our data, although very limited, illustrates some general parental behaviour of storks.
Feeding activity• Our observations show no change of feeding activity throughout the day.
• Past studies have shown two peaks in feeding activity: 4 – 5 hours after sunrise and 3 – 4 hours before sunset. [Pedro de Barros & Daniel Moura]

The mean interval between feeds.• The mean interval between feeds was approximately 2 hours.
• It has been mentioned that chicks of less than 15 days are fed every one hour. And chicks of more than 15 days are fed every 2 hours. [Oxford University Press, 1977]
• Differences that were observed between nest 4 and the other nests may be attributed to the presence of an intruder in this nest.

Mean feeding time• The mean feeding time per feed was between 4 and 7 minutes.
Feeding effort• From the results feeding effort is greater for larger brood size. This result contradicts previous studies.
•Schadd and Ritchison (1998) found that, in Yellow-Breasted Chats (Icteria virens) the feeding rate does not increase with more chicks in the nest.
• In fact chicks in larger broods receive less food.
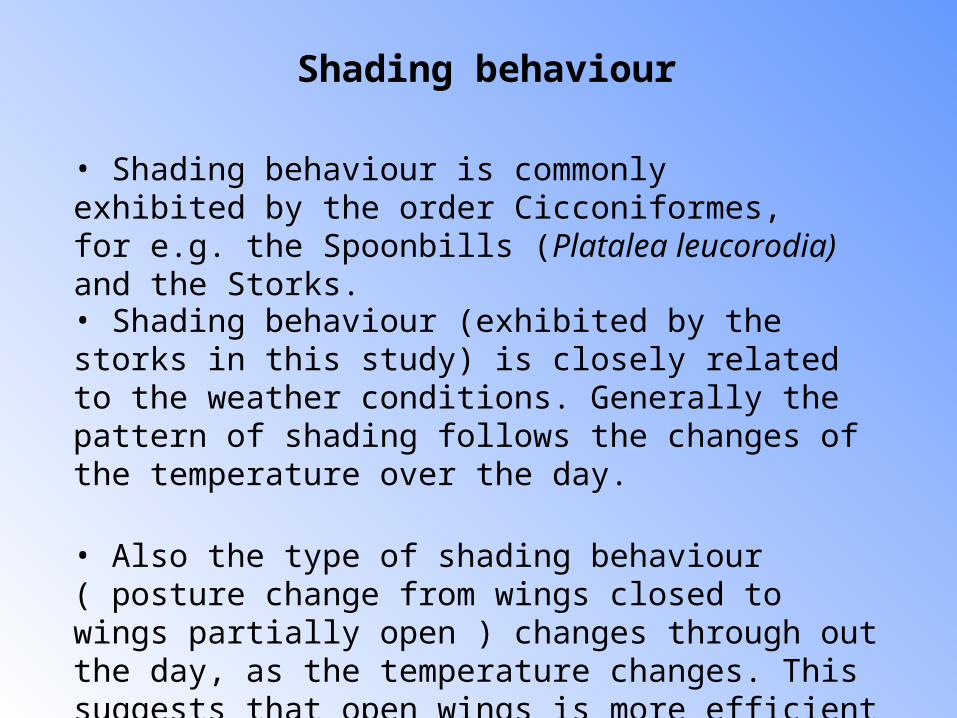
• Shading behaviour is commonly exhibited by the order Cicconiformes, for e.g. the Spoonbills (Platalea leucorodia) and the Storks.
• Shading behaviour (exhibited by the storks in this study) is closely related to the weather conditions. Generally the pattern of shading follows the changes of the temperature over the day.
• Also the type of shading behaviour ( posture change from wings closed to wings partially open ) changes through out the day, as the temperature changes. This suggests that open wings is more efficient for shading.
Shading behaviour

• Also the position of the sun in the sky, may influence the shading posture. Shading 2 posture increases and the shading 1 posture decreases as the sun moves higher in the sky.
• No observation was carried out on a nest without chicks and therefore we do not know if the shading behaviour was originally a behaviour for the birds to cool themselves and secondarily developed for shading to protect the chicks from the sun.
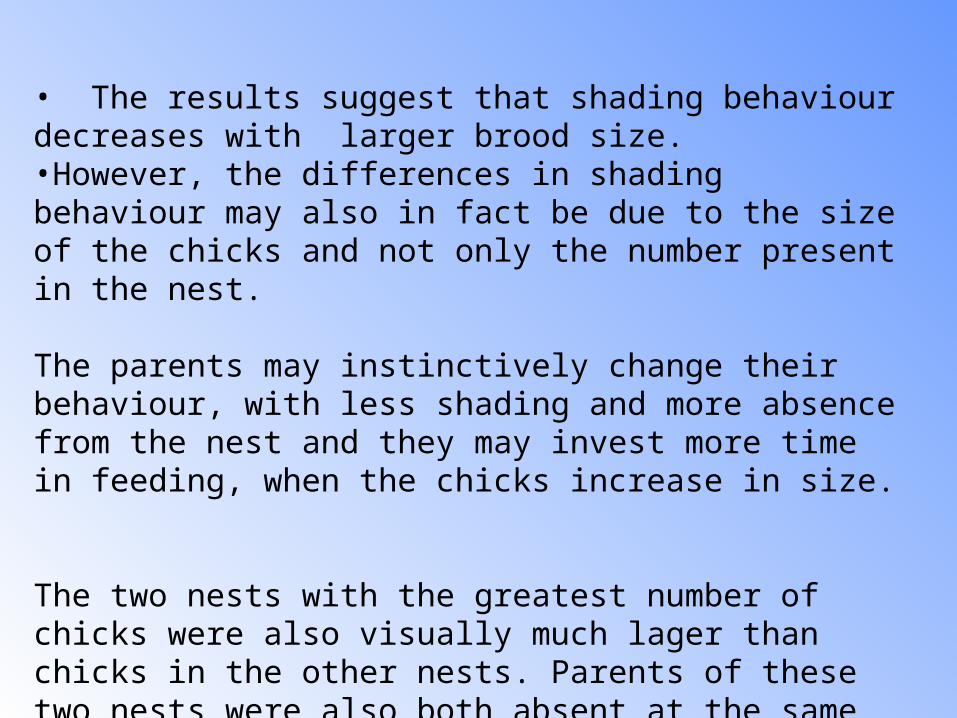
• The results suggest that shading behaviour decreases with larger brood size.•However, the differences in shading behaviour may also in fact be due to the size of the chicks and not only the number present in the nest.
The parents may instinctively change their behaviour, with less shading and more absence from the nest and they may invest more time in feeding, when the chicks increase in size.
The two nests with the greatest number of chicks were also visually much lager than chicks in the other nests. Parents of these two nests were also both absent at the same time for a longer duration throughout the day than the parents in any other nest. The time spent on shading is therefore reduced.
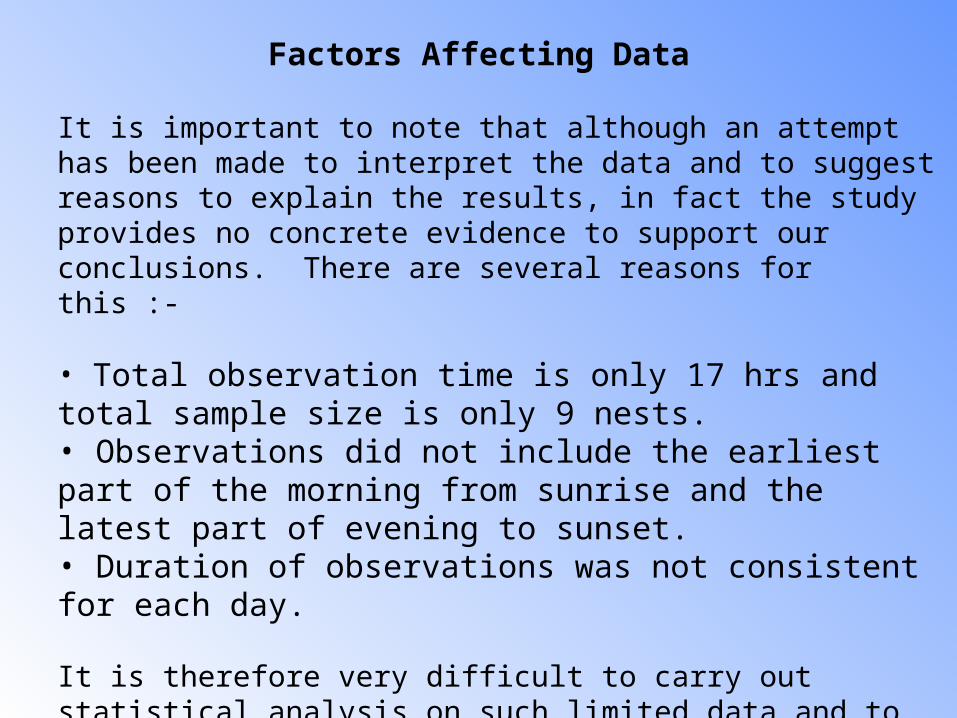
Factors Affecting Data
It is important to note that although an attempt has been made to interpret the data and to suggest reasons to explain the results, in fact the study provides no concrete evidence to support our conclusions. There are several reasons for this :-
• Total observation time is only 17 hrs and total sample size is only 9 nests.• Observations did not include the earliest part of the morning from sunrise and the latest part of evening to sunset.• Duration of observations was not consistent for each day.
It is therefore very difficult to carry out statistical analysis on such limited data and to have confidence in the results obtained.
Furthermore,
• identifying each behaviour during observations without prior experience was subjective, especially in relation to shading behaviour.
• no measurements were taken to determine the age of the chicks

The study group feel that we have benefited in several ways from this exercise. Not only did we learn about, and stimulate our interest in the behaviour of the white stork, but also we have been made more aware of the problems and complexities associated with behavioural study.
•Familarity with bibliography and observation prior to recording data are essential for identifying, understanding and defining the behaviour being examined.
• Sample size and observation duration must be sufficient to allow accurate and dependable statistical analysis of representative data.
We also recognize the benefits of working in a group. Communication is fundamental and every person in the group contributes his/her ideas to support and improve our understanding of the subject

BIBLIOGRAPHY• De Barros, P & Moura D. 1985 Breeding, feeding and mortality factors in white stork Ciconia ciconia populations nesting in Portugal in 1985.
• Goutner, V & Furness, R. 1997 Feathers of white stork ciconia ciconia chicks in north-eastern Greece, as indicators of geographical variation in mercury contamination.
• Tsachalidis, E & Papageorgiou, N. 1996 Distribution status and breeding of the white stork.
• Goriup, P & Schulz H. 1990 Conservation management of the white stork: an international opportunity.
•Muzinic, J & Rasajsk J. 1992 On Food and Feeding habitats of The White Stork Ciconia Ciconia in The Central Balkan.
•Oxford University Press 1977
• Schadd, C & Ritchison G. 1998 Provisioning of nestlings by male and female yellow-breasted chats.

ACKNOWLEDGMENTS
The ornithology group is grateful to V. Goutner and A. Pålsson for their help in collecting and interpreting the data.
Also, we would like to thank E. Lekka for her help with the statistical analysis.

Clothilde PATOUX
Pasqua Rosa PONZIANI
Styliani TZIMIRI
Joan STEVENSON
Jessica SVENSSON
Kerstin NORDSTRÖM
Joan OUDRY
THE ORNITHOLOGY GROUP

Anova:comparison of the mean feeding effort between the number of chick
ANOVA TESTAnalyse of variance parameter: Multicomparison significance level for:One factor Anova:95 Experiment type:factorial Tablesources deviation factor sum square mean square f-testbetween groups 2 24.75 12.375 11.786within groups 5 5.25 1.05 p=0.0128total 7 30
comparison mean difference Fisher PLSDgroup count mean std dev std error 1 vs 2 0.75 2.281
1 4 8.25 0.957 0.479 1 vs 3 -3.75 2.281*2 2 7.5 0.707 0.5 2 vs 3 -4.5 2.634*3 2 12 1.414 1
*significant at 95%
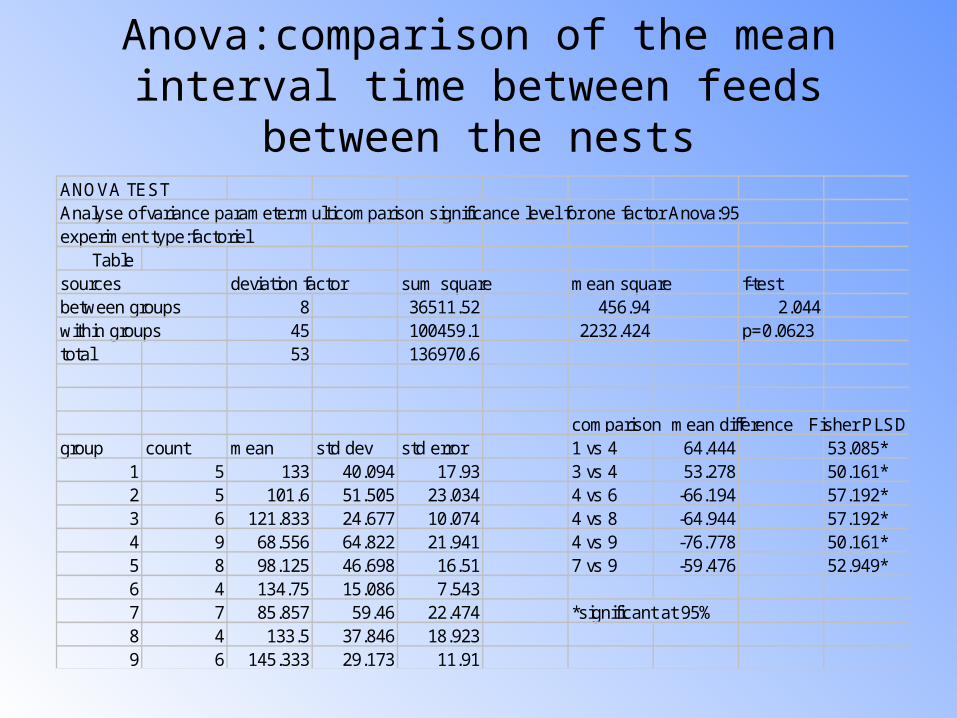
Anova:comparison of the mean interval time between feeds between the nests
ANOVA TESTAnalyse of variance parameter:multicomparison significance level for one factor Anova:95 experiment type:factoriel Tablesources deviation factor sum square mean square f-testbetween groups 8 36511.52 456.94 2.044within groups 45 100459.1 2232.424 p=0.0623total 53 136970.6
comparison mean difference Fisher PLSDgroup count mean std dev std error 1 vs 4 64.444 53.085*
1 5 133 40.094 17.93 3 vs 4 53.278 50.161*2 5 101.6 51.505 23.034 4 vs 6 -66.194 57.192*3 6 121.833 24.677 10.074 4 vs 8 -64.944 57.192*4 9 68.556 64.822 21.941 4 vs 9 -76.778 50.161*5 8 98.125 46.698 16.51 7 vs 9 -59.476 52.949*6 4 134.75 15.086 7.5437 7 85.857 59.46 22.474 *significant at 95%8 4 133.5 37.846 18.9239 6 145.333 29.173 11.91
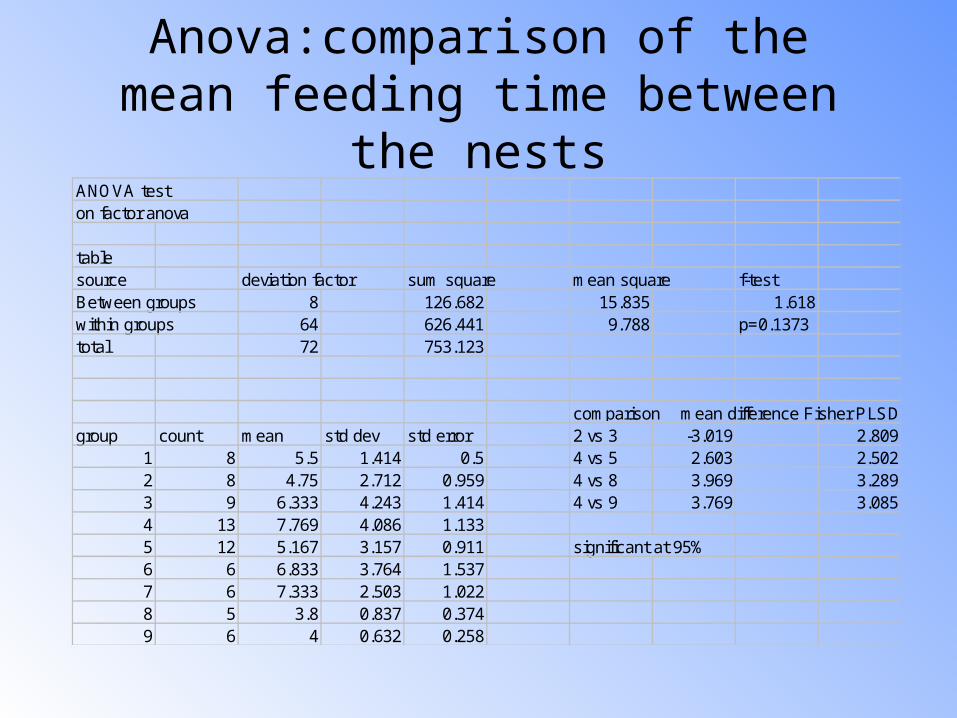
ANOVA teston factor anova
tablesource deviation factor sum square mean square f-testBetween groups 8 126.682 15.835 1.618within groups 64 626.441 9.788 p=0.1373total 72 753.123
comparison mean difference Fisher PLSDgroup count mean std dev std error 2 vs 3 -3.019 2.809
1 8 5.5 1.414 0.5 4 vs 5 2.603 2.5022 8 4.75 2.712 0.959 4 vs 8 3.969 3.2893 9 6.333 4.243 1.414 4 vs 9 3.769 3.0854 13 7.769 4.086 1.1335 12 5.167 3.157 0.911 significant at 95%6 6 6.833 3.764 1.5377 6 7.333 2.503 1.0228 5 3.8 0.837 0.3749 6 4 0.632 0.258
Anova:comparison of the mean feeding time between the nests

Annex


