Embed Size (px)
Citation preview

White Paper on Natural Gas Interchangeability and Non-Combustion End Use
NGC+ Interchangeability Work Group February 28, 2005∗
∗ Including appendices added to document June 7, 2004

White Paper on Natural Gas Interchangeability And Non-Combustion End Use
2

White Paper on Natural Gas Interchangeability And Non-Combustion End Use
i
1.0 Introduction
1.0.1 The Federal Energy Regulatory Commission (FERC) has undertaken an initiative to examine and update natural gas interchangeability standards. FERC’s initiative results from the confluence of several events and issues. Liquefied natural gas (LNG) imports have begun to rise, and forecasts are for future imports to be a significant percentage of total North American supply. Regasification terminals have regained active status and are expanding. The National Petroleum Council’s 2003 report “Balancing Natural Gas Policy – Fueling the Demands of a Growing Economy” presented projections for LNG imports to increase from 1 percent of our natural gas supply in 2003 to as much as 14 percent by 2025. This report also recommended that FERC and DOE “update natural gas interchangeability standards.”1 The characteristics of natural gas supply in North America have evolved over time as conventional sources are depleted, and new sources in the Rockies, Appalachians and the Gulf of Mexico are developed. Direct receipt of unprocessed gas by transmission pipelines has grown and also contributed to the change in the natural gas composition. Finally, the United States has also experienced prolonged periods of pricing economics that make it more profitable to leave some natural gas liquids (NGL’s) in the natural gas stream as Btu’s rather than process the gas and extract the NGL’s for petrochemical feedstock and other traditional markets. These issues are exacerbated by North American natural gas supply being unable to meet current or projected demand.
1.0.2 The transition from historical gas compositions to the evolving gas supply profile presents specific technical challenges throughout the stakeholder value chain. Consequently, FERC undertook the challenge to begin addressing these issues in its annual Natural Gas Markets Conference (PL03-6-000) on October 14, 2003 and a technical conference on gas quality issues (PL04-3-000) on February 18, 2004. There are also several proceedings before FERC that highlight these issues on an individual basis. As part of their process, FERC recognizes and has encouraged the industry to develop a process to identify the issues in a comprehensive fashion and wherever possible, to recommend courses of action developed by consensus. A group of stakeholders, under the leadership of the Natural Gas Council, hereafter known as the NGC+, formed a technical work group to address the hydrocarbon liquid dropout issues specific to domestic supply and another technical work group to address the interchangeability issues associated with high Btu LNG imports.
1.0.3 Interchangeability is defined as:
The ability to substitute one gaseous fuel for another in a combustion application without materially changing operational safety, efficiency, performance or materially increasing a r pollutant emissions. Interchangeability is described in technically based quantitative measures, such as indices, that have demonstrated broad application to end-uses and can be applied without discrimination of either end-users or individual suppliers.
1 Executive Summary, Page 64
3

White Paper on Natural Gas Interchangeability And Non-Combustion End Use
2.0 Objective 2.1 The objective of this white paper is to define acceptable ranges of natural gas characteristics that can be consumed by end users while maintaining safety, reliability, and environmental performance.2 It is important to recognize that this objective applies equally to imported LNG and domestic supply.
2.2 The NGC+ commissioned the Work Group on Interchangeability to examine the issues related to maintaining adequate and reliable gas supplies for consumers in a manner that will enable system integrity, operational reliability and environmental performance. 3.0 Background 3.1 Development of North American Natural Gas Industry
3.1.1 Interchangeability has been an issue since the 1930s and 1940s when natural gas began to replace manufactured gas (gas derived from coal and oil) in street lighting and other applications. In the traditional sense, gas interchangeability is simply defined as the ability to substitute one gaseous fuel for another without impacting combustion performance. However, the term interchangeability in the NGC+ effort has taken on a more general definition that includes the ability to substitute one gas for another without materially impacting historical utilization, including utilization in the industrial sector as “feedstock.”
3.1.2 Interchangeability remained an issue throughout the twentieth century, but
mostly on a regional basis as new domestic supplies became available. In the areas where the gas supply changed significantly with time or by region, gas utilities managed the interchangeability issues in various ways, including Btu stabilization (nitrogen or air blending) and appliance readjustment. In addition, several LDC’s studied regional impacts of interchangeability extensively as new LNG imports containing varying levels of higher hydrocarbons were planned and/or introduced into the North American supply infrastructure. Now, interchangeability has risen as a national issue as more non-traditional domestic supplies coupled with increases in global LNG imports that are planned to play a more significant role in meeting demand.
3.2 Development of Natural Gas End Use
3.2.1 Natural gas and NGLs found a ready market in the burgeoning petrochemical industry that began its rapid growth as part of the war effort associated with WWII and accelerated even faster after 1952. The regional growth of the interstate pipeline system in the 1950’s and 1960’s coupled with relatively low cost natural gas encouraged the installation of gas burning equipment (furnaces, hot water heaters, stoves, etc.) in residential and
2 Performance applies to material increases in air pollutants from gas-fired equipment that cannot be addressed cost effectively with additional emissions control technology.
4

White Paper on Natural Gas Interchangeability And Non-Combustion End Use
commercial settings. In general, gas-burning equipment from this period through the 1980s was designed to optimize combustion by creating near stoichiometric conditions, i.e.- chemically equivalent amounts of air and natural gas.3 As a result, properly installed and maintained equipment from that period is tolerant of fluctuations in the underlying gas quality related to seasonal demand patterns. Generally, inter- or intrastate pipeline supply meets the majority of non-peak natural gas demand and is supplemented with storage and propane-air mixtures during the peak usage periods. A number of appliance studies from the 1920s to the 1980s evaluated the limits of interchangeability for a number of types of natural gas and other fuel gases. 3.3 Changes in Natural Gas Supply
3.3.1 There are limited historical data on the precise composition of natural gas during the period of rapid growth described above, but contaminants (water, inerts, etc) were clearly being controlled while the variability in hydrocarbon composition was not as well documented. Up until the late 1990’s, the presence of a growing NGL market and relatively low cost supply had created a consistent incentive to maximize the removal of higher hydrocarbons from the domestic gas supply, particularly in the Gulf Coast and Mid-continent supply areas. Domestic gas supplies appeared to be bountiful, and the only stimulus needed to increase production were high pricing levels that resulted in more drilling. The 2001-2004 steep run-up in gas prices has indeed increased drilling, but the production from these new wells has not offset declines in the historic supply basins. Discovery and development of new supply basins is barely keeping pace with the decline of older existing supply basins. As regions like the Appalachian Basin, Rocky Mountains, and Canada began producing more substantial quantities of gas with their own specific gas composition, distinct variability in gas compositions between regions began to develop, and this situation is likely to persist and further evolve as supply continues to change. Most notable has been the increase in coal-seam production in the Rocky Mountains and Appalachian basin. This gas is composed almost entirely of methane and inerts (nitrogen and CO2) that yields a heating value significantly lower than traditional domestic production.
3.3.2 Direct receipt of small amounts of unprocessed gas by transmission pipelines has historically contributed to the difference of delivered natural gas in certain areas and continues to be a practice.
3.3.4 Finally, with three of the four existing regasification terminals regaining active status (the fourth remains in service), LNG imports have begun to rise, and future imports are forecasted to account for a more significant percentage of total North American supply. The economics of LNG transportation are such that LNG marketers prefer to have the ability to purchase LNG from a wide range of supply sources, most of which contain almost no inerts (such as CO2 and N2) and more non-methane hydrocarbons, such as ethane, propane and butanes, than historical US supplies. Non-methane hydrocarbons have a higher energy density; that is to say, they contain more Btu’s per cubic foot. Higher energy density results in a more efficient production, storage and transportation of LNG, thereby increasing
3 The design basis was generally done to provide for an excess of air to ensure for more complete combustion conditions.
5

White Paper on Natural Gas Interchangeability And Non-Combustion End Use the overall capacity of the LNG supply chain. In addition, LNG is almost free of inerts (nitrogen and carbon dioxide) as those are removed in the process of boil off during transportation. As a consequence, the worldwide LNG market evolved as a high Btu marketplace, thus potentially placing North America at a competitive disadvantage relative to other existing and growing markets.
3.4 Changes in End Use Equipment
3.4.1 Combustion burner designs vary widely among end uses. In addition, burner system designs in some equipment, such as gas turbines, have been changed substantially since the early 1990s. The shift was initiated by and has been intensified by ever increasing requirements to reduce emissions and increase fuel efficiency. This shift impacts combustion equipment ranging from reciprocating engines and commercial space heating equipment to the newest combustion turbine technology in electric power generation. The new burner technology is often referred to as “lean premix combustion”. Other low emission technologies are also being used in home appliances as states work to meet Clean Air Act requirements. The net effect of these new designs is a greater sensitivity to gas composition characteristics and less tolerance of fluctuations in gas composition after the equipment has been set for a specified quality of natural gas. Equipment using these new designs is becoming widespread and as older equipment is replaced over time, the new designs will become pervasive throughout a broad number of end user segments. If these burners become a common trend in residential and light commercial end user markets, change will occur over a relatively long time period; particularly in the residential segment, since tens of millions of households have one or more gas consuming appliance.
3.4.2 Varying natural gas composition beyond acceptable limits can have the following effects in combustion equipment:
a. In appliances, it can result in soot formation, elevated levels of carbon monoxide and pollutant emissions, and yellow tipping. It can also shorten heat exchanger life, and cause nuisance shutdowns from extinguished pilots or tripping of safety switches.
b. In reciprocating engines, it can result in engine knock, negatively affect
engine performance and decreased parts life. c. In combustion turbines, it can result in an increase in emissions, reduced
reliability/availability, and decreased parts life.
d. In appliances, flame stability issues including lifting are also a concern.
e. In industrial boilers, furnaces and heaters, it can result in degraded performance, damage to heat transfer equipment and noncompliance with emission requirements.
6

White Paper on Natural Gas Interchangeability And Non-Combustion End Use
3.4.3 Varying gas compositions beyond acceptable limits can be problematic in non-combustion-related applications in which natural gas is used as a manufacturing feedstock or in peak shaving liquefaction plants, because historical gas compositions were used as the basis for process design and optimization of operating units. More specifically, domestic LNG peak shaving liquefaction plants will most likely require retrofits to continue operations utilizing regasified LNG as feedstock. Propane-air peak shaving operations will also likely require retrofits and/or additional controls to continue operations. 3.5 Changes in Natural Gas Transportation 3.5.1 Before the passage of FERC Order 636 in 1985, wholesale natural gas was purchased by LDCs from interstate natural gas pipelines that purchased and amalgamated the supply from producers. During this period the interstate pipeline companies managed quality of the delivered gas by blending. The quality specifications were incorporated into the gas purchase and sale contracts. In general, these gas quality specifications in purchase contracts were designed to allow the acceptance of a wide variation of gas supply in small increments to a large portfolio of supply gas that was already flowing. As a result, the overall quality level of the delivered gas stream did not reflect the extremes of the receipt purchase specifications. Order 636 separated the gas transportation and ownership responsibilities, canceling those contracts, which then allowed suppliers, marketers and end users to purchase and ship their own gas on those pipelines. During this restructuring of the business systems, quality specifications for natural gas transported on the pipelines were incorporated in tariffs.
3. 5.2 This restructuring of the interstate pipeline industry encouraged the building of competing pipelines into marketplaces and interconnects between pipelines, greatly increasing the probability of delivering natural gas to end use customers from different production basins and processing regimes. Further regulatory restructuring of the pipeline business has increasingly limited the operational capability of interstate pipelines to adjust the flow of the pipeline unless requested by the shippers.
4.0 Overview of Interchangeability Indices
4.0.1 A variety of calculation methods have been developed to define the interchangeability of fuel gases for traditional end use equipment including:
• Single index methods • Multiple index methods
4.0.2 These methods are generally based on empirical parameters developed to fit the
results of interchangeability experiments. The single index methods are based on energy input while the multiple index methods incorporate fundamental combustion phenomena. Science Applications, Inc., (SAI), published a comprehensive review of these and other
7

White Paper on Natural Gas Interchangeability And Non-Combustion End Use
interchangeability techniques in 1981 under sponsorship of the former Gas Research Institute (GRI), “Catalogue of Existing Interchangeability Prediction Methods.”4
4.0.3 A range of heating values5 is specified in many pipeline tariffs, however, heating
value alone is not a sufficient indicator of the interchangeability of gases.
4.0.4 The most common single index parameter is the Wobbe Index sometimes referred to as the Interchangeability Factor. The definition of the Wobbe Number is based on the heating value and specific gravity of a gas, and it is related to the thermal input to a burner (Btu per hour). It should be noted that while Wobbe is an effective, easy to use screening tool for interchangeability, the industry historically recognizes that the Wobbe Number alone is also not sufficient to completely predict gas interchangeability because it does not adequately predict all combustion phenomena.
4.0.5 Multiple index methods date back to the late 1940’s and include the AGA Bulletin 36 Indices and the Weaver Indices. The multiple index techniques have a history of widespread and satisfactory use in the industry; however, as empirical models, the multiple index methods also have limitations based on the burner designs and fuel gases tested in the development research. In general, the new gas supply, called “substitute gas” is evaluated for behavior of specific combustion phenomena, including flame lifting, flashback, yellow tipping and incomplete combustion, relative to an “adjustment gas” or the gas normally used in the past with properly adjusted equipment.
4.0.6 A great deal of research has been performed to develop and assess interchangeability indices. However this work is continuing as appliances and other end use combustion devices become more sophisticated to meet current efficiency and emission requirements. Access to some of these valuable data has not been possible because the research was performed on a proprietary basis. The most reliable method for assessing the interchangeability of a substitute gas is to examine performance of various combustion devices in the laboratory after initial adjustment to a reference gas. This is obviously time consuming and can be impractical. The alternative to extensive laboratory testing is the use of prediction methods such as those highlighted above. However, it must be recognized that all of these methods are empirical and as such, may be their application may be restricted to the combustion phenomena, fuel gases and burner types for which they were derived. 5.0 Effects of Changing Natural Gas Composition on End Use Equipment
5.0.1 The Work Group recognized the need to examine the effects of changing composition for each type of end use equipment and combustion technology. As described in section 3.4.1, there are older combustion technologies, current technologies and newer combustion technologies within each end use equipment category. The categories of equipment considered were
4 Performance Modeling Of Advanced Burner Systems- Catalogue Of Existing Interchangeability Methods, Final Report Phase II, GRI – 80/0021, 1980. 5 Higher heating value, also referred to as Gross Heating Value by ISO, traditionally measured in British Thermal Units (BTU).
8

White Paper on Natural Gas Interchangeability And Non-Combustion End Use
• Appliances, • Industrial boilers, furnaces and process heaters, • Reciprocating engines including Natural Gas Vehicles • Combustion turbines, and • Non-combustion uses including LNG peak shaving liquefaction and
chemical and consumer product manufacturing.
5.0.2 The effects of changing composition in combustion applications can be described by a set of combustion specific phenomena and emission characteristics. The combustion specific phenomena include:
• Auto-ignition (also referred to as “knock” in engine applications) • Combustion dynamics (pressure fluctuations and vibration) • Flashback • Lifting • Blowout • Incomplete combustion (carbon monoxide production), and • Yellow tipping.
The major emission characteristics considered were:
• Nitrogen oxides (NOx), • Unburned hydrocarbons, and • Carbon monoxide, and • The response of supplemental emission control technology.
5.0.3 The Work Group examined each of these effects and in general found that
there is a good theoretical understanding of the onset and management of these effects. However, in general, there are limited documented operational data that can be used to relate these effects consistently and reliably to compositional limits in natural gas covering the range of end use applications considered.
5.0.4 The Work Group also found that historical composition of natural gas plays a key role in assessing and managing interchangeability of gas supplies. This is best exemplified when considering home appliances. These units are initially installed and placed into operation using the natural gas as received, in a given region or market area. Appliance performance degrades when the appliance is operated with gas that is not interchangeable with the gas used to tune the appliance when it was first installed. Although the safety certification of appliances ensures that they perform safely when operated well above and below their design firing rates, much of that margin has historically been used to accommodate fluctuations in air temperature and humidity that also affect appliance performance. Marginal, improperly tuned or maintained equipment, and some newer low emission appliances are not as tolerant to changes in gas composition. Thus, ensuring that
9

White Paper on Natural Gas Interchangeability And Non-Combustion End Use
gas supplies are interchangeable with historical local supplies used to tune “legacy” equipment is an important consideration in addressing interchangeability.
5.0.5 In addition, it has been documented through field testing that a small but
significant fraction of residential appliances are performing marginally or poorly on domestic natural gas due to improper installation or lack of maintenance. These units can be especially sensitive to natural gas composition changes.6
5.0.6 One of the major concerns of varying natural gas composition in reciprocating
engines is engine knock. The anti-knock property of a natural gas fuel can be expressed as a methane number and is analogous to the octane rating of gasoline. In addition to the anti-knock quality, the operating performance of an engine on a low methane number fuel may be important. Low methane number is usually a result of the presence of high hydrocarbons in the fuel. In addition to the methane number, the Wobbe number is also an important parameter for gas engines as it determines both the power and equivalence ratio and changes that might result in poor operational and environmental performance.
5.0.7 Non-combustion end uses include feedstock applications in various chemical
and manufacturing processes such as ammonia fertilizers, reforming, fuel cells and LNG peak shaving liquefaction plants. Varying feedstock gas compositions can also negatively impact the efficiency and even the safety of these processes. In general, specific process design requirements are specified around a relatively tight range of feedstock compositions.
5.0.8 Of particular concern is the impact to LDC peak shaving liquefaction
operations as these facilities have evolved into a critical part of the supply infrastructure of some LDCs. There are a smaller number of peak shaving plants operated by transmission pipeline companies. Shifts in feedstock composition resulting from unprocessed domestic supplies include increased concentrations of heavy hydrocarbons (C6+) that can freeze out and plug heat exchangers, significantly impacting the efficiency and reliability of the liquefaction process. In addition, feedstock containing high concentrations of C2/C3 fractions as well as nitrogen from Btu stabilized regasified LNG can also significantly impact the efficiency and reliability of plant operations. LNG peak shaving liquefaction plants in general do not have the internal capacity or an “outlet” for these non-methane components that are traditionally removed from the gas by the liquefaction process. Depending on the liquefaction process, excessive inert concentrations pose additional problems with LNG storage systems because of increased tank boil-off. In summary, changes in feedstock composition beyond the original plant may require many facilities to retrofit cold box components (heat exchangers and flash vessels) as well as tank storage system components (cold blowers), and these retrofits may be necessary to accommodate unprocessed domestic supplies and regasified LNG imports. The inability to effectively and efficiently re-fill peak shaving storage during off-peak periods due to liquefaction system constraints caused by varying feedstock compositions beyond design could significantly compromise the pipeline or LDC’s ability to meet peak day/peak hour demands.
6 TIAX – Cove Point Summary & Commonwealth Studies
10

White Paper on Natural Gas Interchangeability And Non-Combustion End Use
5.0.9 Additional LDC peak shaving concerns include the impact of higher hydrocarbon gases on propane-air peak shaving operations. As with the liquefaction plants, these facilities were designed with specific blending capabilities and limitations based on historical pipeline gas compositions. Existing systems may not have the necessary capacity to adequately blend peak shaving supplies with higher hydrocarbon pipeline supplies while maintaining interchangeability criteria. As a result, retrofit of these facilities may also be required to accommodate variations in pipeline supply compositions.
5.0.10 The rate of change in gas composition appears to be an important parameter
for some end uses. Fluctuations in composition beyond the limits that the equipment was tuned to receive, particularly if the changes occur over a short period of time, are likely to reduce the ability of some equipment to perform as designed by the manufacturer. 6.0 Application of Interchangeability Parameters
6.0.1 The Work Group considered the range of effects above and sought to define an approach to apply interchangeability parameters that addressed the full range of effects and that could ultimately achieve the objective, that is, to “Define acceptable ranges of natural gas that can be consumed by end users while maintaining safety, reliability, and environmental performance.”
6.0.2 For traditional end use equipment, evaluation of acceptable gas quality
variations begins with the actual adjustment gas. The actual adjustment gas is the first gas that is supplied to an appliance, that is, the gas used during the moments of appliance installation to adjust the equipment and set it “on rate.” This concept is, of course, the basis for both single and multiple index calculations methods, which define mathematical indices based on a specified “Adjustment Gas” with known properties such as heating value and specific gravity and/or composition. In practice, development of the adjustment gas composition must be based on the history of gas supplies to the region and on the operations of the utility. Three situations may pertain:
1) The actual adjustment gas is identical to a consistent and known historical average gas. In this case, the delivered gas composition has been constant over long periods of time, and all appliances in the region have been installed with the same actual adjustment gas. This situation is experienced by those regions, such as parts of the Northeast and Midwest, which have historically received consistently processed pipeline supplies from producing regions such as the Gulf Coast and Mid-Continent supplies.
2) The utility establishes a specified or “target” gas based on the historical gas supplies. In this situation, the company effectively targets a single heating value and possibly other specifications (e.g., Wobbe, gas composition, orifice sizing tables) and provides these values to the installers of gas appliances, municipal building departments, gas suppliers, system operators, etc. The company may develop different target values for different zones or districts within its delivery system, depending on the gas source, the history of the gas supply, and other factors, such as elevation. This specification is currently used by companies that have managed interchangeability issues, such as companies that distribute gas at high altitudes, that have completed appliance readjustment programs within their system, or that use Btu stabilization for
11

White Paper on Natural Gas Interchangeability And Non-Combustion End Use
interchangeability control. The utility typically monitors and provides necessary information to installers upon request to ensure the adjustment gas at the time of appliance installation is consistent with the stated target gas values.
3) There is no specified target value, and the composition of the delivered gas has varied over time. In this case, there is no single actual adjustment gas that can be defined for the delivery system, and the appliances within the system may have different and possibly unknown set points, depending on the variability of the gas supply. If evaluation of interchangeability is required, an estimate for the adjustment gas will be necessary. Alternatives may include the average historical composition, the minimum or maximum extremes, or a combination. This situation may exist in producing regions where the degree of gas processing may vary depending upon where the supply is obtained relative to processing facilities and to the extent contractual blending is available.
6.0.3 The Work Group drew upon the European experience and adopted the concept of developing an operating regime to define the acceptable limits. This approach entails selecting parameters that address the end use effects described above, such as auto-ignition, incomplete combustion, yellow tipping, lifting, and others. Indices such as those found in AGA Bulletin 36 and Weaver target specific end use effects while the Wobbe number is a more generic metric. For example, both the AGA Bulletin 36 and Weaver methods define indices to specifically address yellow tipping phenomena.
6.0.4 A purely scientific approach might lead one to applying many of the Weaver and AGA Bulletin 36 indices for every end use application. However, limited testing data on low emission combustion equipment indicate that these indices may not consistently account for the observed combustion related behavior. In addition, the Work Group was concerned about specifying overly restrictive limits and sought to define a more practical approach. The group built upon the idea of developing an operating regime.
12

White Paper on Natural Gas Interchangeability And Non-Combustion End Use
Figure 1. INTERCHANGEABILITY
OPERATING REGIME
WOBBE NUMBE
Upper Wobbe
Lower Wobbe
CO, NOx, Yellow Tipping
Auto Ignition KnockFlame Dynamics
Lift Off, CO, Blow Out
OperatingRange
Weaver IncompleteCombustion
COMPLIMENTARY INDEX SUCH AS BTU, C4+, ETC.
6.0.5 As shown in Figure 1, the basis for constructing the operating regime was to propose a parameter and identify which end use effects were addressed by that parameter, either in specifying a minimum or a maximum limit. The Wobbe Number was considered first because it was recognized as the most robust single parameter. In general, establishing a maximum Wobbe Number can address certain combustion phenomena such as yellow tipping, incomplete combustion and potential for increased emissions of NOx and CO. Establishing a minimum Wobbe Number can be used to address lifting, blowout and CO. Laboratory testing and combustion theory has shown that simply selecting a maximum Wobbe is not sufficient to address incomplete combustion over a range of gas compositions (especially for natural gas with heating values in excess of about 1,100 Btu/scf. However, this limitation can be overcome by selecting a more conservative maximum Wobbe Number coupled with an additional parameter such as heating value.
6.0.6 The “art” is in selecting additional parameters to address the remaining end use
effects. Experience has shown that specifying a maximum Heating Value can address auto-ignition (or knock), flashback, combustion dynamics, and when coupled with the Wobbe Number, incomplete combustion and sooting. Alternatively, the Work Group found that a maximum value for a specified fraction of hydrocarbons, such as butanes plus can address these same parameters. 7.0 Options for Managing Interchangeability
7.0.1 There are three options for managing interchangeability:
• Management at the production source • Management prior to introduction into the transmission pipeline system, and
13

White Paper on Natural Gas Interchangeability And Non-Combustion End Use
• Management at the point of end use Each of these options is described below and placed in context with the existing infrastructure. 7.1 Management at the Production Source
7.1.1 Natural gas interchangeability can be managed near the source of production. For domestic supply, this generally entails treating and processing gas to reduce concentrations of inerts, contaminants such as corrosive compounds and hydrocarbons other than methane. Gas is treated to reduce inerts and corrosive compounds such as water, hydrogen sulfide, carbon dioxide and nitrogen. Gas is processed through refrigeration, lean oil absorption, or cryogenic extraction to reduce various levels of natural gas liquids (NGLs) such as ethane, propane, butanes, pentanes and hexanes plus. The level of NGL extraction is dependent upon the technology, existing NGL infrastructure, economics and known gas specification requirements. Some existing and future domestic supply sources do not have access to processing plants and may not be sufficient in volume to justify the cost of processing. In this case, pipeline blending (contract) may be the preferred option as to not limit supplies which otherwise cannot be processed. The gas delivered into a pipeline will have distinct composition and characteristics depending on the extent of any treatment or processing as well as the original gas source and composition. The gas quality and interchangeability characteristics of treated/processed “conventional” natural gas and coal-bed methane, for example, can vary significantly, and gases of these two types may not be interchangeable with each other.
7.1.2 Imported LNG is processed at the production source primarily for the removal
of NGL components, such as pentanes and hexanes plus, that would freeze during the liquefaction process. This means LNG generally does not contain the heavier hydrocarbons but does contain appreciable concentrations of ethane and propane with some butane(s). Many LNG-importing countries have developed their gas distribution infrastructure based on regasified LNG and have set minimum heating value standards, which are relatively high compared to the North American market. It is important to note that Japan, Korea and Taiwan import over 70% of globally traded LNG, and their gas specification of relatively high heating value has served as the basis of many current and future LNG supplies. LNG suppliers could add equipment to remove additional NGLs from their gas stream but have elected to produce a higher Btu content LNG more compatible with world markets. Also, many LNG supply regions lack infrastructure and markets for extracted ethane and propane products. In addition, economics favor leaving some NGLs in the gas as transportation and sales are executed on an energy (Dekatherm) basis. Reducing the NGL content reduces the energy value of the LNG and reduces the economic value of each cargo for the supplier. 7.2 Management Prior to Introduction Into the Transmission Pipeline System
7.2.1 Imported LNG can be processed to reduce the NGL content at the LNG receiving terminal. LNG terminal operators or shippers contracting with terminal operators or third parties can use NGL separation technology to achieve the desired interchangeability indices. The feasibility of this option is dependent upon the economics of NGL extraction
14

White Paper on Natural Gas Interchangeability And Non-Combustion End Use
and the proximity of local markets and/or available infrastructure to transport the NGL to market. Given these facts, this option is viable only in the Gulf Coast (Texas and Louisiana) or other coastal locations where there is sufficient NGL demand and infrastructure. NGL extraction economics in the Gulf Coast have weakened in more recent years due to the impact of escalating natural gas prices. There are no NGL extraction plants associated with the three existing LNG terminals along the East Coast. There is a small third party slipstream NGL extraction facility processing a portion of the regasified LNG from the Gulf Coast LNG terminal.
7.2.2 In theory, LNG terminal operators have the option of using an extracted NGL product stream as a fuel source, for example, to generate power; however, this option is generally not viable because the NGL supply would likely exceed the energy consumed and varies in volume and composition with changing LNG supplies.
7.2.3 Injection of an inert gas is an option at the LNG terminal. There are three types of inerts that can be used:
• Nitrogen • Air, and • Flue gas
7.2.4 Inert gas injection reduces the heating value, increases the specific gravity of the
gas, and as a consequence reduces the Wobbe Number and changes other interchangeability indices. For example, injection of one (1) percent by volume of nitrogen or air reduces the Wobbe Number of natural gas by approximately 1.3 percent.7
7.2.5 The costs of air injection are significantly lower than nitrogen injection. Air injection has been historically used for managing interchangeability. It is common in propane/air peak shaving and is also used at city gate stations in some regions of the US where the base natural gas supplies currently contain less inerts than the historical appliance adjustment gases.
7.2.6 There is one drawback with air injection, as it introduces oxygen into the natural gas; for example, injection of 3 percent air by volume results in an oxygen level to approximately 0.6 mol%. These oxygen levels may not be acceptable because of current tariff restrictions, concerns about pipeline integrity, underground gas storage, and impact on feedstock plants and other end uses, such as peak shaving.
7.2.7 Injection of flue gas is an option; however, it requires that a source of flue gas
be in immediate proximity of the terminal. None of the domestic terminals use flue gas injection. In addition, the presence of oxygen, other combustion products such as CO2 and moisture in the flue gas pose a more severe risk to pipeline integrity as these components can all contribute to corrosion of steel. Special care may need to be taken for LNG sources that use this technology and are upstream of underground storage fields or other locations
7 The reduction in a parameter such as Wobbe Number will be greater than the simple reduction in heating value alone as the specific gravity is also increased.
15

White Paper on Natural Gas Interchangeability And Non-Combustion End Use that may operate as a wet gas system, since corrosion at those locations could occur as a result of the formation of carbonic acid.
7.2.8 Blending within an LNG receiving terminal is conceivably an option. An LNG terminal operator may have the option to blend two LNG sources to achieve an overall specification; however, this may create operational issues and to rely on this option for all but a small portion of the supply would reduce overall terminal capacity. As such, blending is not a viable option for terminal operators.
7.2.9 Blending applied by the pipeline operator is also technically feasible. However,
widespread use of blending is out of the direct control of the pipeline operator. The transportation of natural gas is governed by daily and sometimes more frequent nomination of volumes and specification of receipt and delivery points by shippers. Consequently, any pipeline blending that occurs is coincidental and historically has not been planned to achieve a specific end point or specification. Even in pipelines where blending currently occurs, this practice is thus not a consistently reliable method of interchangeability management.
7.2.10 It is important to note that following implementation of FERC Order 636,
significant numbers of producers have entered into contracts with pipelines to transport their gas without prior NGL removal. This situation resulted as the production sources developed near the existing pipeline infrastructure and producers determined that it was either infeasible or not economically attractive to extract NGLs. The volume of any one source tended to be small, approximately less than 10 Mmscfd, and pipelines were often able to take advantage of incidental blending to achieve a delivered gas that was acceptable.
7.2.11 In summary, of all the options described above, inert injection is the most
widely investigated and implemented option to date for North America LNG imports. NGL separation may be a viable option in particular situations. Both of these solutions increase the cost of the natural gas supply because of the additional costs of conditioning the LNG stream. .
7.3 Management at the Point of End Use 7.3.1 Some gas utilities in the Rocky Mountain Region use air injection at the city gate stations. This inert gas injection serves to condition their mid-continent supply gas from a Wobbe Number of 1330 to 1200; appliances in this region were originally adjusted for high nitrogen (low Wobbe Number) natural gas, and the higher Wobbe Number supplies were shown to result in interchangeability problems. This management process is similar to that described in section 7.2 Management Prior to Introduction Into the Transmission Pipeline System. It should be noted that this gas quality management practice in the Rocky Mountain Region is the exception in the current national LDC infrastructure. For some large industrial natural gas customers in France, such as several glass manufacturing factories, air injection equipment has been used to stabilize the quality of their fuel gas. 7.3.2 Another option is to inspect end use equipment such as gas appliances and if necessary, to adjust improperly operating equipment for changing gas quality. To be
16

White Paper on Natural Gas Interchangeability And Non-Combustion End Use effective, this option requires a high percentage of installed equipment to be inspected and adjusted by trained personnel. This approach is expensive and requires multiple years for complete implementation. Although difficult when large numbers of customers are involved, this approach has been effective in different parts of the country.
7.3.3 There are also options that can provide greater clarity for equipment manufacturers and aid in development of North American interchangeability standards. The options include
• Addition of specificity to design and installation standards • Development and implementation of a limit-gas testing regime
Each of these is described in greater detail below.
7.3.4 In general, end use equipment is designed presuming that a gas stream of an unchanging known composition will be the sole and continued fuel source. However, as described above, the composition of the domestic natural gas has evolved over time, and in addition, the composition of natural gas varies from region to region within the country. Manufacturers could adjust the design basis for particular end use applications, especially for low emission equipment. Also manufacturers could adjust combustion equipment at the factory and seal the equipment to ensure that it arrives for installation in a configuration consistent with the design basis.
7.3.5 End use equipment manufacturers do provide instructions for installing and
placing equipment into service. Manufacturers and even the organizations that publish national consensus standards could develop installation and adjustment standards that ensure that the equipment is installed and placed into service according to the equipment design. The standards could also provide guidance for installers in the event that factory settings are found to be out of spec.
7.3.6 Much of the end use equipment in place today is placed into service using one
test gas, usually whatever gas is delivered at the time the testing in undertaken. National consensus standards developing organizations or manufacturers working together could define a multiple test-gas testing regime. This is the approach that is used in the European Community for appliances. A benefit of this approach is that it defines the working range for end use equipment. The working range can then be factored into broader interchangeability standards.
7.3.7 In summary, the options in 7.3.3 are of value for equipment that will be
manufactured, installed and placed into operation in the future. Applying these options for end use applications with large fleets in place, such as appliances will be extremely costly.
8.0 Findings
1. The heating value specification alone, as used in some tariffs today, is not an adequate measure for gas interchangeability. However, it may be an appropriate
17

White Paper on Natural Gas Interchangeability And Non-Combustion End Use
parameter to assure interchangeability if used in conjunction with other specifications.8
2. Most pipeline tariffs do not contain adequate specifications to define or set
interchangeability limits. Most gas distribution company tariffs do not contain them either.
3. There is a large body of work that has been conducted by the American Gas
Association and other research bodies on interchangeability and interchangeability indices. In addition, a number of pipeline and distribution companies have amassed first-hand operating experience in managing interchangeability. Other parts of the world including Europe have also successfully instituted programs to manage interchangeability. However, it is not known to what extent this research and experience applies to low emissions combustion technology.
4. Gas interchangeability indices represent the best starting point for developing
guidelines for natural gas interchangeability.
5. The Wobbe Number provides the most efficient and robust single index and measure of gas interchangeability. There are limitations to the applicability of the Wobbe Number, and additional specifications are required to address combustion performance, emissions and non-combustion requirements.
6. Gas interchangeability guidelines must consider historical regional gas compositional
variability as well as future gas supply trends. Interchangeability is an issue for both domestic gas supply and LNG imports.
7. European experience suggests that understanding the historical range of gases
distributed in the U.S. is critical in establishing future interchangeability guidelines.
8. Presently, there are limited data characterizing the changes that have occurred over time in natural gas composition on a regional basis.
9. Combustion equipment in use today is characterized by two major categories of
technology, conventional and low emissions. Low emissions combustion technology, developed primarily in response to Federal and State emissions requirements, is relatively new. Current low emissions combustion technology utilizes various control systems, exhaust treatments, designs to achieve lower emissions and can vary by application. In some applications, the newer technology improves fuel efficiency and reduces cost.
10. Varying natural gas composition beyond acceptable limits can have the following
effects in combustion equipment:
8 The Work Group agreed to standardize on a set of terms to use in defining interchangeability. “Indices” are defined in AGA Bulletin 36 and Weaver (e.g. - incomplete combustion index, yellow tipping, etc.). “Parameters” are used to define ranges or limits for components expressed as composition. “Specifications” encompass both indices and parameters.
18

White Paper on Natural Gas Interchangeability And Non-Combustion End Use
a. In appliances, it can result in soot formation, elevated levels of carbon monoxide and pollutant emissions, and yellow tipping. It can also shorten heat exchanger life, and cause nuisance shutdowns from extinguished pilots or tripping of safety switches.
b. In reciprocating engines, it can result in engine knock, negative changes in
engine performance, and decreased parts life.
c. In combustion turbines, it can result in increased emissions, reduced reliability/availability, and decreased parts life.
d. In industrial boilers, furnaces and heaters, it can result in degraded
performance, damage to heat transfer equipment and noncompliance with emission requirements.
e. In all end use equipment, it can result in flame instability, including lifting
and blowout in appliances.
11. For traditional end use equipment, evaluation of interchangeability begins with the
concept of adjustment gas. The adjustment gas may be specified as the average of a consistent historical supply or as target values established by the utility. In cases where the historical supply has varied and there is no established target, the adjustment gas concept is more difficult to develop and quantify.
12. Varying gas composition beyond acceptable limits can be problematic in non-
combustion-related applications where natural gas is used as a manufacturing feedstock or in peak shaving liquefaction plants, because historical gas compositions were used as the basis for process design and optimization of operating units. More specifically, domestic LNG peak shaving liquefaction plants will most likely require retrofits to continue operations with regasified LNG as feedstock. Propane-air peak shaving operations will also likely require retrofits and/or additional controls to continue operations.
13. Gas interchangeability guidelines must consider the full range of requirements for all
end use equipment. 14. Fluctuations in composition beyond the limits equipment is tuned to receive,
particularly if it occurs over a short period of time, is likely to reduce the ability of some equipment to perform as intended by the manufacturer.
15. Combustion turbine operation with fuel gas supplies near or above 1400 Wobbe
occurs at world-wide locations; however proper operation, including meeting emission limits, of some existing equipment may require installation of additional equipment and control systems, including fuel pre-heat requirements. Additional constituent limits may be necessary (such as butanes+, propane etc) to address
19

White Paper on Natural Gas Interchangeability And Non-Combustion End Use
manufacturer concerns until research/data are available to better understand the impact on operability of this equipment.
16. The time rate of change of fuel composition changes is problematic for some end
use applications, including combustion turbines. As a practical matter, in general, the work group found that gas composition variability rate of change should not be a significant issue and should meet existing turbine manufacturers’ requirements.
17. Modern gas internal combustion engines can operate safely and efficiently over a
reasonable range of Wobbe and Heating Value numbers with closed loop controls. However, as indicated earlier in the paper, excessive concentrations of higher hydrocarbon constituents such as propane and ethane results in low Methane Numbers and damaging engine knock. Limits on these constituent limits in addition to Wobbe and Heating Value ranges may be necessary to satisfy manufacturer’ fuel specifications.
18. Presently, there are limited publicly and readily available data for the full range of end
use equipment and gas supplies.
19. Historical interchangeability indices have been widely used for conventional combustion appliances and are recognized default specifications when actual operating data are unavailable.
20. Limited testing and research conducted by distribution companies, equipment
manufacturers and researchers indicate that historical indices may not adequately account for the full range of effects with low emissions technology.
21. The European experience in gas interchangeability highlights important issues for
establishing U. S. interchangeability guidelines and demonstrates significant differences from the U. S. situation.
22. Interchangeability specifications can be used to define an operating regime that addresses end use effects, such as auto-ignition, stability, incomplete combustion and pollutant formation among others. The Work Group found that based on current and projected available gas supply, at least two interchangeability specifications are required to adequately address the end use effects.
22. Gas system infrastructure impacts must be considered when supply compositions
change for extended periods of time. The impacts when shifting to a dry, leaner supply source may include failure of certain gas transmission and distribution piping component seals and gaskets in valves, pipe clamps, joint sealants and other mechanical components. Additional infrastructure issues include impacts to custody transfer gas measurement techniques (thermal vs. volumetric billing) and related gas accounting issues.
20

White Paper on Natural Gas Interchangeability And Non-Combustion End Use
23. In the majority of cases, interchangeability is best managed at two key points along the value chain, at the origin of supply or prior to delivery into the existing pipeline infrastructure.
24. Overly broad limits in the interchangeability specifications may result in reduced
reliability, increased emissions, and decreased safety on end use equipment, and consequently higher costs to consumers. On the other hand, unduly conservative restrictions on the interchangeability specifications due to lack of data may result in both limited supply options and higher costs to the consumers.
25. Interstate transmission pipelines transport 80 percent of the natural gas.
Approximately, 20 percent of the natural gas consumed is produced and consumed within the same state. The FERC has jurisdiction over interstate transmission pipelines while State agencies have jurisdiction over intrastate transmission.
26. Gas supply compositions within the US vary by region depending on demand,
available supply, the degree of processing and pipeline blending. The 1992 GRI survey of gas supplies included gas composition data for over 6,800 samples from 26 cities in the United States. The absolute minimum and maximum Wobbe numbers in the data were 1201 and 1418, respectively. Most of the data showed a narrower range of Wobbe numbers, with tenth and ninetieth percentile levels of 1331 and 1357, respectively. The team found that the historical range of gas compositions reported in the 1992 survey has been successfully utilized; more recent gas composition data is currently being collected. However, it is critical to recognize that not all gases within the absolute range are interchangeable with each other. The range of interchangeability for a given region is considerably tighter than the variation between regions of the country.
27. Complete management of gas interchangeability requires specification of both
minimum and maximum limits for Wobbe numbers. The issue of supplies with increasing Wobbe numbers is currently more widespread than the issue of supplies with decreasing Wobbe numbers. Furthermore, a number of utilities with low Wobbe supplies have implemented interchangeability management practices in the past, while many utilities already receiving or anticipating receipts of higher Wobbe number supplies have little to no experience in interchangeability management. The Team’s focus was therefore evaluation of maximum Wobbe limits. The Team recognized the equal importance of a minimum Wobbe limit and the need for inclusion in the proposed research program.
28. It has become apparent through the work of the NGC+ Interchangeability Technical
Team that significant data gaps exist that inhibit non-traditional supplies from entering the North American market. There is general recognition that a collaborative effort will be necessary to conduct research and obtain essential information necessary to maximize supplies into the marketplace including D.O.E., equipment manufacturers, suppliers, pipelines, LDC’s and other industry trade groups. As a result, to meet the recommendations of the NPC Report, it is proposed that the abovementioned research be accomplished within a two-year time frame
21
White Paper on Natural Gas Interchangeability And Non-Combustion End Use
beginning in 2005. This aggressive schedule is necessary to minimize risks associated with any interim guidelines adopted while awaiting the additional information needed to allow LNG imports and additional domestic supplies maximum penetration into the North American market.
9.0 Recommendations
1. The Work Group recommends the completion of work started by this group to gather and analyze historical composition data that will better characterize the change in natural gas supply on a region-by-region and market-by-market basis. This data gathering process must be standardized so that on-going data collection can be used to develop a better understanding of shifts to the historical compositions.
2. The Work Group recommends the completion of work started by this group on the
effects of changing supply on particular end use equipment.
3. The Work Group recommends that appliance manufacturers and equipment certifying organizations for gas burning equipment consider adopting limit gases testing that is representative of current and future supplies. Such testing as part of the design certification process will help ensure that new appliances and equipment can deliver safe and reliable performance under varying and changing gas supply conditions. In addition, an education process is recommended promoting appliance inspections and adjustment during a period of transition to new gas supplies.
4. Additional research must be conducted to define the compositional limits of natural
gas to support development of longer-term interchangeability guidelines for low emission and high efficiency combustion designs.
5. The Work Group recognized the value in adopting a national range for key
parameters such as the Wobbe Number to provide certainty for producers and suppliers. This specification is equally important for domestic supply and for imported LNG. However, the Work Group also recognized the need for flexibility since certain areas may be able to utilize a wider range of gas compositions than other areas.
6. While adopting a wide national range for key specifications such as the Wobbe
Number is important for supply flexibility, acceptable interchangeability ranges for specific regions or market areas may be more restrictive as a consequence of historical compositions and corresponding end use settings.
7. The Work Group supports the use of processes for development of
interchangeability specifications based on the Wobbe Number and supplemental parameters that can be applied regionally, locally, and nationally. These processes have been used in a number of local and regional interchangeability studies over the past three decades. Appropriate processes incorporate the following elements:
22

White Paper on Natural Gas Interchangeability And Non-Combustion End Use
a. Historical gas supply characteristics to accommodate current end users and equipment requirements,
b. End use equipment gas interchangeability requirements based on published
end use equipment test data and to the extent required, additional testing over the range of gases representative of current and future supplies,
c. Consideration of interchangeability management options and costs, and
d. Development of numerical specifications.
8. The NGC+ Interchangeability Work Group has identified several “information
gaps” that must be addressed to better understand the overall impacts of gas interchangeability in North America. These gaps must be addressed to provide the maximum level of supply flexibility considering current global LNG import composition profiles as well as evolving domestic supply compositions. More importantly, reaching consensus among major stakeholders in the gas supply, transportation and end use value chain is predicated on filling these gaps in a timely fashion. Consensus on interim guidelines relies upon establishing a process and timeframe for filling the technical gaps based on sound scientific analysis and testing.
9. The Work Group recommends that a transition plan be adopted given the lack of
readily available historical data to characterize both the change in natural gas supply and in end use equipment. The transition plan is based on adoption of recommendations described above and adoption of interim interchangeability guidelines given below. The purpose of the transition period is to maximize supply while gaining additional experience and knowledge.
10. The work group recognizes that compositional limits for specific gas constituents
may be needed (in addition to the proposed Interim Guidelines to address non-combustion feedstock issues including but not limited to domestic LNG peak shaving liquefaction plants. The work group also recognizes that imposing general constituent limits would be inappropriate because the design bases for these facilities vary with the historical supplies delivered at the time of the facilities’ construction. These constituents include:
Non-methane Hydrocarbons
• Ethane • Propane • Butane(s) • Pentane(s) • Hexanes+
Inerts
• Nitrogen • Carbon Dioxide
23

White Paper on Natural Gas Interchangeability And Non-Combustion End Use
Furthermore, the work group recommends that each facility/process impacted by changing supply composition be evaluated on an individual basis. Facilities that will receive supplies exceeding design feedstock constituent limits will require retrofit to maintain design capacity and efficiency of operation. Retrofits will likely vary from facility to facility and will incur new and unplanned operating and capital expenditures. Evaluation of these retrofits and associated cost burdens must be considered during the Regulatory approval process.
11. The Work Group recommends that interim interchangeability guidelines be applied
during a transition period of no more than three years so that the data gaps can be closed and interchangeability guidelines/standards can be formally developed. Alternative language was suggested as well, and long-term guidelines will be developed within a timeframe to be defined.
24

White Paper on Natural Gas Interchangeability And Non-Combustion End Use
Recommendations for Interim Guidelines for Gas Interchangeability
Background The Work Group recognizes that there is a need to maximize the available supply and at the same time meet the specifications of end use equipment. As stated above, the Work Group found that there are gaps in the data regarding regional characteristics as well as the specific limitations and tolerances for end use equipment. The Work Group recommended the adoption of a transition period to gather and analyze additional data and conduct more testing to provide a basis for establishing more definitive guidelines. Specific gaps that must be addressed during this transition period form an integral part of this recommendation. Ultimately, the desire is to create as much flexibility in supply with which end use equipment can operate, in a manner that does not materially change operational safety, efficiency, performance or materially increase air pollutant emissions.
The Work Group discussed at length development of numerical guidelines for gas interchangeability. At this time, the Work Group recommends interim guidelines for gas interchangeability based on: (1) extensive data and analysis for traditional gas appliances and combustion behavior in appliances, and (2) the lack of data on gas interchangeability for a broad range of other end use applications. The interim period for use of these guidelines depends upon the filling of major data gaps for end uses (see Table 1 and Table 2) and consensus needed for interchangeability requirements of these end uses, which is forecasted to require 2 to 3 years. After that time period, it is envisioned that development of more complete and longer-term guidelines can be pursued. The interim guidelines are for gases delivered to points in the gas transportation system most closely associated with end users: gases delivered to local distribution companies (LDCs). The guidelines do not necessarily apply directly to points upstream in the transportation system where blending, gas processing, and other factors may suggest that gases outside the ranges of the guidelines will still satisfy the guidelines at LDC city gates. The Work Group is continuing to investigate development of guidelines for points upstream. Field installation and adjustment represent a set of initial conditions under which interchangeability must be considered. Therefore, the interim guidelines focus on consistency with historical gases (also referred to as “adjustment gases”) since locally, historical gases represent the basis for field installation and adjustment of appliances. The Work Group used the 1992 GRI report on natural gas composition in 26 major US cities9 as the historical baseline for gases nationally and regionally. The use of these data is the basis for establishing interim guidelines for the ranges of interchangeability. At this time, it is conservative to limit the boundaries for interchangeability ranges to gases seen historically in the U. S. gas system.
9 “Variability of Natural Gas Composition in Select Major Metropolitan Areas of the United States,” Gas Research Institute, March 1992, GRI-92/0123.
25

White Paper on Natural Gas Interchangeability And Non-Combustion End Use
The interim guideline limits proposed in this document have been developed for new gas supplies to those market areas without extended experience with gas supplies characterized by Wobbe Numbers higher than 1,400 or gross heating values higher than 1,110 Btu/scf.10 The limiting values were developed using conventional interchangeability index calculations based on an adjustment gas corresponding to the mean of the annual average composition data in the 1992 GRI composition report.11 The 1992 “average” gas was characterized by a Wobbe Number of 1345 and gross Heating Value of 1035 Btu/scf. This “average” gas is assumed to be a reasonable estimate for an average adjustment gas in the US. It is important to note that the limiting values in the interim guidelines simply serve to establish boundaries for market areas that have received historical gas supplies with gas quality close to the 1992 reported national mean and that have experienced successful end use with these gas supplies. These boundaries should be applicable until additional research and/or experience has clearly demonstrated that supplies above the caps do not negatively impact end users in these market areas.
10 Based on gross or higher heating value (HHV) at standard conditions of 14.73 psia, 60°F, dry, real basis. 11 Details of these calculations are given in Appendix G.
26

White Paper on Natural Gas Interchangeability And Non-Combustion End Use
Interim Guidelines
A. A range of plus and minus 4% Wobbe Number Variation from Local Historical Average Gas or, alternatively, Established Adjustment or Target Gas for the service territory. 1
Subject to:
Maximum Wobbe Number Limit: 1,400 2 Maximum Heating Value Limit: 1,110 Btu/scf 2
B. Additional Composition maximum limits: 1
Maximum Butanes+: 1.5 mole percent Maximum Total Inerts: 4 mole percent
C. EXCEPTION: Service territories with demonstrated experience3 with supplies
exceeding these Wobbe, Heating Value and/or Composition Limits may continue to use supplies conforming to this experience as long as it does not unduly contribute to safety and utilization problems of end use equipment.
Notes:
1 Experience has shown that using this plus/minus four percent formula in combination with the compositional limits will result in a local Wobbe range that is above 1,200.
2 Based on gross or higher heating value (HHV) at standard conditions of 14.73 psia, 60°F, dry, real basis.
3 Demonstrated experience refers to actual end use experience established by end-use testing and monitoring programs.
27
White Paper on Natural Gas Interchangeability And Non-Combustion End Use
28
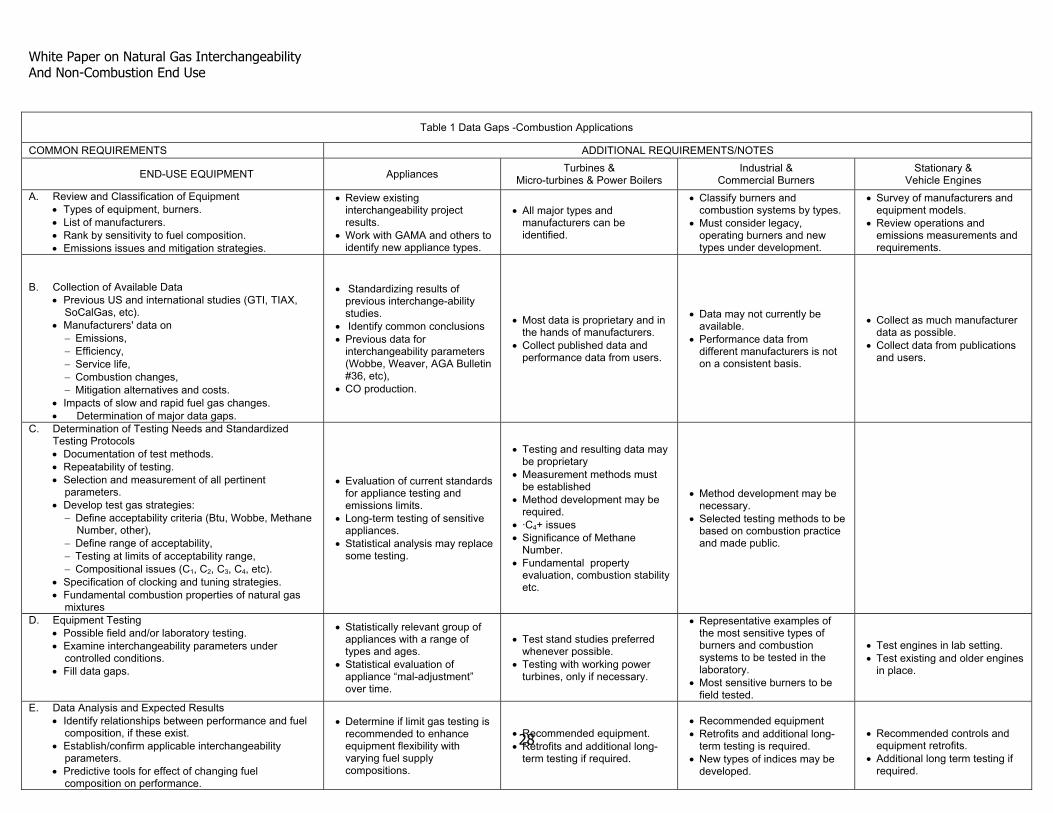
Table 1 Data Gaps -Combustion Applications
COMMON REQUIREMENTS ADDITIONAL REQUIREMENTS/NOTES
END-USE EQUIPMENT Appliances Turbines & Micro-turbines & Power Boilers
Industrial & Commercial Burners
Stationary & Vehicle Engines
A. Review and Classification of Equipment • Types of equipment, burners. • List of manufacturers. • Rank by sensitivity to fuel composition. • Emissions issues and mitigation strategies.
• Review existing interchangeability project results.
• Work with GAMA and others to identify new appliance types.
• All major types and manufacturers can be identified.
• Classify burners and combustion systems by types.
• Must consider legacy, operating burners and new types under development.
• Survey of manufacturers and equipment models.
• Review operations and emissions measurements and requirements.
B. Collection of Available Data • Previous US and international studies (GTI, TIAX,
SoCalGas, etc). • Manufacturers' data on
− Emissions, − Efficiency, − Service life, − Combustion changes, − Mitigation alternatives and costs.
• Impacts of slow and rapid fuel gas changes. • Determination of major data gaps.
• Standardizing results of previous interchange-ability studies.
• Identify common conclusions • Previous data for
interchangeability parameters (Wobbe, Weaver, AGA Bulletin #36, etc),
• CO production.
• Most data is proprietary and in the hands of manufacturers.
• Collect published data and performance data from users.
• Data may not currently be available.
• Performance data from different manufacturers is not on a consistent basis.
• Collect as much manufacturer data as possible.
• Collect data from publications and users.
C. Determination of Testing Needs and Standardized Testing Protocols • Documentation of test methods. • Repeatability of testing. • Selection and measurement of all pertinent
parameters. • Develop test gas strategies:
− Define acceptability criteria (Btu, Wobbe, Methane Number, other),
− Define range of acceptability, − Testing at limits of acceptability range, − Compositional issues (C1, C2, C3, C4, etc).
• Specification of clocking and tuning strategies. • Fundamental combustion properties of natural gas
mixtures
• Evaluation of current standards for appliance testing and emissions limits.
• Long-term testing of sensitive appliances.
• Statistical analysis may replace some testing.
• Testing and resulting data may be proprietary
• Measurement methods must be established
• Method development may be required.
• ·C4+ issues • Significance of Methane
Number. • Fundamental property
evaluation, combustion stability etc.
• Method development may be necessary.
• Selected testing methods to be based on combustion practice and made public.
D. Equipment Testing • Possible field and/or laboratory testing. • Examine interchangeability parameters under
controlled conditions. • Fill data gaps.
• Statistically relevant group of appliances with a range of types and ages.
• Statistical evaluation of appliance “mal-adjustment” over time.
• Test stand studies preferred whenever possible.
• Testing with working power turbines, only if necessary.
• Representative examples of the most sensitive types of burners and combustion systems to be tested in the laboratory.
• Most sensitive burners to be field tested.
• Test engines in lab setting. • Test existing and older engines
in place.
E. Data Analysis and Expected Results • Identify relationships between performance and fuel
composition, if these exist. • Establish/confirm applicable interchangeability
parameters. • Predictive tools for effect of changing fuel
composition on performance.
• Determine if limit gas testing is recommended to enhance equipment flexibility with varying fuel supply compositions.
• Recommended equipment. • Retrofits and additional long-
term testing if required.
• Recommended equipment • Retrofits and additional long-
term testing is required. • New types of indices may be
developed.
• Recommended controls and
equipment retrofits. • Additional long term testing if
required.

White Paper on Natural Gas Interchangeability And Non-Combustion End Use
29
Table 1 Data Gaps -Combustion Applications
COMMON REQUIREMENTS ADDITIONAL REQUIREMENTS/NOTES
END-USE EQUIPMENT Appliances Turbines & Micro-turbines & Power Boilers
Industrial & Commercial Burners
Stationary & Vehicle Engines
F. Review and Classification of Equipment • Types of equipment, burners. • List of manufacturers. • Rank by sensitivity to fuel composition. • Emissions issues and mitigation strategies.
• Review existing interchangeability project results.
• Work with GAMA and others to identify new appliance types.
• All major types and manufacturers can be identified.
• Classify burners and combustion systems by types.
• Must consider legacy, operating burners and new types under development.
• Survey of manufacturers and equipment models.
• Review operations and emissions measurements and requirements.
G. Collection of Available Data • Previous US and international studies (GTI, TIAX,
SoCalGas, etc). • Manufacturers' data on
− Emissions, − Efficiency, − Service life, − Combustion changes, − Mitigation alternatives and costs.
• Impacts of slow and rapid fuel gas changes. • Determination of major data gaps.
• Standardizing results of previous interchange-ability studies.
• Identify common conclusions • Previous data for
interchangeability parameters (Wobbe, Weaver, AGA Bulletin #36, etc),
• CO production.
• Most data is proprietary and in the hands of manufacturers.
• Collect published data and performance data from users.
• Data may not currently be available.
• Performance data from different manufacturers is not on a consistent basis.
• Collect as much manufacturer data as possible.
• Collect data from publications and users.
H. Determination of Testing Needs and Standardized Testing Protocols • Documentation of test methods. • Repeatability of testing. • Selection and measurement of all pertinent
parameters. • Develop test gas strategies:
− Define acceptability criteria (Btu, Wobbe, Methane Number, other),
− Define range of acceptability, − Testing at limits of acceptability range, − Compositional issues (C1, C2, C3, C4, etc).
• Specification of clocking and tuning strategies. • Fundamental combustion properties of natural gas
mixtures
• Evaluation of current standards for appliance testing and emissions limits.
• Long-term testing of sensitive appliances.
• Statistical analysis may replace some testing.
• Testing and resulting data may be proprietary
• Measurement methods must be established
• Method development may be required.
• ·C4+ issues • Significance of Methane
Number. • Fundamental property
evaluation, combustion stability etc.
• Method development may be necessary.
• Selected testing methods to be based on combustion practice and made public.

White Paper on Natural Gas Interchangeability And Non-Combustion End Use
30
Table 1 Data Gaps -Combustion Applications
COMMON REQUIREMENTS ADDITIONAL REQUIREMENTS/NOTES
END-USE EQUIPMENT Appliances Turbines & Micro-turbines & Power Boilers
Industrial & Commercial Burners
Stationary & Vehicle Engines
I. Review and Classification of Equipment • Types of equipment, burners. • List of manufacturers. • Rank by sensitivity to fuel composition. • Emissions issues and mitigation strategies.
• Review existing interchangeability project results.
• Work with GAMA and others to identify new appliance types.
• All major types and manufacturers can be identified.
• Classify burners and combustion systems by types.
• Must consider legacy, operating burners and new types under development.
• Survey of manufacturers and equipment models.
• Review operations and emissions measurements and requirements.
J. Collection of Available Data • Previous US and international studies (GTI, TIAX,
SoCalGas, etc). • Manufacturers' data on
− Emissions, − Efficiency, − Service life, − Combustion changes, − Mitigation alternatives and costs.
• Impacts of slow and rapid fuel gas changes. • Determination of major data gaps.
• Standardizing results of previous interchange-ability studies.
• Identify common conclusions • Previous data for
interchangeability parameters (Wobbe, Weaver, AGA Bulletin #36, etc),
• CO production.
• Most data is proprietary and in the hands of manufacturers.
• Collect published data and performance data from users.
• Data may not currently be available.
• Performance data from different manufacturers is not on a consistent basis.
• Collect as much manufacturer data as possible.
• Collect data from publications and users.
K. Determination of Testing Needs and Standardized Testing Protocols • Documentation of test methods. • Repeatability of testing. • Selection and measurement of all pertinent
parameters. • Develop test gas strategies:
− Define acceptability criteria (Btu, Wobbe, Methane Number, other),
− Define range of acceptability, − Testing at limits of acceptability range, − Compositional issues (C1, C2, C3, C4, etc).
• Specification of clocking and tuning strategies. • Fundamental combustion properties of natural gas
mixtures
• Evaluation of current standards for appliance testing and emissions limits.
• Long-term testing of sensitive appliances.
• Statistical analysis may replace some testing.
• Testing and resulting data may be proprietary
• Measurement methods must be established
• Method development may be required.
• ·C4+ issues • Significance of Methane
Number. • Fundamental property
evaluation, combustion stability etc.
• Method development may be necessary.
• Selected testing methods to be based on combustion practice and made public.

White Paper on Natural Gas Interchangeability And Non-Combustion End Use
31
Table 1 Data Gaps -Combustion Applications
COMMON REQUIREMENTS ADDITIONAL REQUIREMENTS/NOTES
END-USE EQUIPMENT Appliances Turbines & Micro-turbines & Power Boilers
Industrial & Commercial Burners
Stationary & Vehicle Engines
L. Review and Classification of Equipment • Types of equipment, burners. • List of manufacturers. • Rank by sensitivity to fuel composition. • Emissions issues and mitigation strategies.
• Review existing interchangeability project results.
• Work with GAMA and others to identify new appliance types.
• All major types and manufacturers can be identified.
• Classify burners and combustion systems by types.
• Must consider legacy, operating burners and new types under development.
• Survey of manufacturers and equipment models.
• Review operations and emissions measurements and requirements.
M. Collection of Available Data • Previous US and international studies (GTI, TIAX,
SoCalGas, etc). • Manufacturers' data on
− Emissions, − Efficiency, − Service life, − Combustion changes, − Mitigation alternatives and costs.
• Impacts of slow and rapid fuel gas changes. • Determination of major data gaps.
• Standardizing results of previous interchange-ability studies.
• Identify common conclusions • Previous data for
interchangeability parameters (Wobbe, Weaver, AGA Bulletin #36, etc),
• CO production.
• Most data is proprietary and in the hands of manufacturers.
• Collect published data and performance data from users.
• Data may not currently be available.
• Performance data from different manufacturers is not on a consistent basis.
• Collect as much manufacturer data as possible.
• Collect data from publications and users.
N. Determination of Testing Needs and Standardized Testing Protocols • Documentation of test methods. • Repeatability of testing. • Selection and measurement of all pertinent
parameters. • Develop test gas strategies:
− Define acceptability criteria (Btu, Wobbe, Methane Number, other),
− Define range of acceptability, − Testing at limits of acceptability range, − Compositional issues (C1, C2, C3, C4, etc).
• Specification of clocking and tuning strategies. • Fundamental combustion properties of natural gas
mixtures
• Evaluation of current standards for appliance testing and emissions limits.
• Long-term testing of sensitive appliances.
• Statistical analysis may replace some testing.
• Testing and resulting data may be proprietary
• Measurement methods must be established
• Method development may be required.
• ·C4+ issues • Significance of Methane
Number. • Fundamental property
evaluation, combustion stability etc.
• Method development may be necessary.
• Selected testing methods to be based on combustion practice and made public.


White Paper on Natural Gas Interchangeability And Non-Combustion End Use
33
Table 2 Data Gaps Non-Combustion & Feedstock Applications
• Categories: o Chemical feedstock (ammonia, fertilizer,
reforming, LNG peak shaving liquefaction, etc) o Fuel cells.
• Identify and survey users/developers. • Determine sensitivity to changes in fuel composition. • Summaries of ranges of acceptable fuel composition and
impact of changes • Document necessary process retrofits (if any) & estimate
cost impacts.
White Paper on Natural Gas Interchangeability And Non-Combustion End Use
Natural Gas Council Plus
Work Group on Natural Gas Interchangeability and Non-Combustion End Use Participation
Rosemarie Halchuk, Xcel Energy Ted Williams, American Gas
Association, Chair Peter Collette, Public Service Electric and Gas John Erickson, American Public Gas Association
Mark Hereth, P-PIC, Facilitator
Kevin Shea, Southern California Gas Company
LNG Suppliers Edgar Kuipers, Shell
Lee Stewart, Southern California Gas Company
Mike Milliet, ChevronTexaco Les Bamburg, Sempra
Joe Bonner, Pacific Gas and Electric Ben Ho, BP Mark Satkamp, Louisville Gas and Electric Mark Bentley, ExxonMobil Robert Trumbower, Peoples Gas Pat Outtrim, Cheniere Glen Schwalbach, Wisconsin Public Service Ed Lehotsky, Cheniere Michael Gerdes, BSH Phil Redding, BG North America Michael Farmer, Peoples Gas Hubert Loussouarn, Total Pieter Ouwerkerk, Exelon Frank Katulak, Tractebel Robert Kemper, Southern California Gas Company
John Hritcko, Shell Randy Mills, ChevronTexaco
Frank Strauss, Consolidated Edison Al Fatica, BP Ali Quraishi, American Gas Association Rudy Adamiak, Tractebel Steven Zavodnick, Baltimore Gas and Electric Greg Bartholomew, Sempra Lori Traweek, American Gas Association Ed Anderson, RJRudden Pipelines Regis Klingler, CMS Energy Terry Boss, Interstate Natural Gas
Association of America Jack Zerega, Public Service Electric and Gas Richard Rudden, RJ Rudden and Associates Grant McCracken Panhandle Energy Joseph Santaro, Niagara Mohawk Todd Dustman, Questar Hank Poellnitz, El Paso Power Generation Dennis Alters, Cross Country Energy Chuck Linderman, Edison Electric Institute Scott Zersen, El Paso Jack Cashin, Electric Power Supply Association
Reji George, El Paso Ian Morris, Cross Country Energy
Bruce Rising, Siemens Thanh Phan, Duke Energy Craig Chancellor, Calpine Jeryl Mohn, Panhandle Energy Colin Wilkes, General Electric Power Generation
David Noss, Dominion Energy Bruce Hedman, Energy and Environmental Analysis Keith Barnett, American Electric Power
Dona Gussow, Florida Power and Light Mike Klassen, Combustion Science & Engineering, Inc.
Utilities (LDCs and in some instances Power Generation) Robert Wilson, Keyspan Energy Richard Roby, Combustion Science &
Engineering, Inc. Larry Sasadeusz, Southern California Gas Company Nicole Prudencio, Calpine
34

White Paper on Natural Gas Interchangeability And Non-Combustion End Use
Jim Downs, Calpine
Feedstock Tom Carville, The Fertilizer Institute George Valadez, Alcoa. Dena Wiggins, Process Gas Consumers Dave Schalles, Bloom Engineering (for Alcoa) Kirsten Gibbs, Process Gas Consumers
Appliances Mark Kendall, Gas Appliance Manufacturers Association Frank Stanonik, Gas Appliance Manufacturers Association Richard Cripps, Association of Home Appliance Manufacturers Jack Goldman, Hearth, Patio and Barbecue Association
Research David Rue, GTI State Official Eric Orton, State of Utah Gas Processing Mark Sutton, Gas Processors Association
Meetings and Conference Calls of the Main Work Group
April 2 -- conference call May 13-14 - meeting (Houston) June 6 - conference call July 1 - conference call July 22-23 - meeting (Washington) September 10 - conference call September 13-14 - meeting (Houston) October 18-19 - meeting (New Orleans) October 25 - conference call October 27 - conference call October 29 - conference call December 7-8 - meeting (Washington) December 14 - conference call December 16 - conference call February 2-3 – meeting (Houston) February 11 – conference call February 14 – conference call February 23 – conference call February 25 – conference call
35

White Paper on Natural Gas Interchangeability And Non-Combustion End Use
36

White Paper on Natural Gas Interchangeability And Non-Combustion End Use
White Paper on Natural Gas Interchangeability and Non-Combustion End Use
Appendices12
A. Overview of Natural Gas Supply and Historical Characterization Data, Mike Millet,
Chevron Corporation and Bruce Hedman, EEA B. Impact of Changing Supply on Natural Gas Infrastructure, Terry Boss, INGAA and
Bob Wilson, Keyspan C. Changing Supply Impacts on End-Use (Burner Tip Combustion Issues), Ted Willams, AGA and
Bob Wilson, Keyspan, Coordinators Overview of End Use – Bruce Hedman, EEA Appliances – Mark Kendall, GAMA and Ted Williams, AGA Power Generation – Mike Klassen, Combustion Science and Engineering Reciprocating Engines – Bruce Hedman, EEA Industrial Heating – [Section not provided]
D. Monitoring Interchangeability and Combustion Fundamentals, Edgar Kuipers, Shell
Trading E. Managing Interchangeability, Grant McCracken, Cheniere LNG F. Changing Supply Impacts on End Use (Non-Combustion Issues) [Appendix
materials not provided] G. Derivation of Interim Guideline Calculations – Rosemarie Halchuk, Xcel Energy and
Bob Wilson, Keyspan H. Research Recommendations – Bob Wilson, Keyspan, Rosemarie Halchuk, Xcel
Energy, David Rue, GTI, and Ted Williams, AGA
12 Appendices are the contributions of the listed authors and have not been subjected to the consensus review of the Work Group. As such, the appendices do not necessarily represent the views of the Work Group.
37

White Paper on Natural Gas Interchangeability And Non-Combustion End Use
38
White Paper on Natural Gas Interchangeability And Non-Combustion End Use
Appendix A Overview of Natural Gas Supply and Historical Characterization Data
Mike Milliet Chevron Corporation
Bruce Hedman
Energy and Environmental Analysis
A.1 Introduction - Natural Gas Supply and Demand Balance From 1998 through 2003, gas consumption as reported by U. S. Energy Information Administration (EIA) and industry analysts has been essentially flat at 22 to 23 Tcf. Natural gas consumption in the United States for the year 2003 was 22.4 trillion cubic feet.1 Over this period, natural gas supplies available to the United States has not grown in a manner that would allow for increases in gas consumption. At the same time, the underlying drivers for gas consumption – including a rapidly increasing need for gas fired electricity generation – have continued. Extended periods of high gas prices and increases in price volatility have been a direct result of the lack of development of new sources of gas supply sufficient to meet the market’s desire for more natural gas. A recent study conducted by Energy and Environmental Analysis, Inc for the INGAA Foundation anticipates that U.S. natural gas consumption could approach 30 Tcf by the end of the next decade if the supply of gas is developed2. But if this growth in consumption is to occur, large amounts of infrastructure including pipeline capacity, storage capacity, and LNG terminal capacity must be built in the United States and Canada. While gas produced in traditional basins such as the mid-continent, onshore Louisiana and the shallow waters of the Gulf of Mexico will continue to be important sources of supply, by themselves they will not be sufficient to satisfy growing demand over the next two decades. To meet a growing demand, gas from “frontier regions” will also need to be developed. These frontier supplies include the deepwater offshore in the Gulf of Mexico, unconventional gas in the U.S. and Canadian Rockies, Arctic gas, Eastern Canadian gas and large volumes 1 EIA Natural Gas Annual 2 This supply summary is based on an INGAA Foundation report developed by Energy and Environmental Analysis, Inc (EEA) entitled “An Updated Assessment of Pipeline and Storage Infrastructure for the North American Market”, July 2004. EEA has updated its baseline energy supply and demand projection since the issue of this report. However, the conclusions on supply needs and potential future resource mix has not materially changed from those summarized in this section.
1

White Paper on Natural Gas Interchangeability And Non-Combustion End Use
of LNG. The development of these resources will require large capital commitments and the construction of major infrastructure projects. If the infrastructure required that is to provide growing supplies of natural gas from frontier regions is not constructed, tremendous price pressure leading to prices well above today’s levels would develop in order to restrict demand growth. The EEA Base Case used for the INGAA Foundation study assumes that natural gas supply and infrastructure that is economic is developed. If, however, government policy and public opposition to the construction of the required infrastructure prevent the facilities from being built, gas supplies will be unable to grow to meet market demand. As a result, there could be tremendous pressure on gas prices that could hinder economic growth and the competitiveness of U.S. industry. A.2 Natural Gas Supply Summary (EEA)
Natural gas supply from multiple sources will have to grow to meet the projected 30 Tcf U.S. market by the end of the next decade. Most industry analysts, including EEA, believe that U.S. and Canadian natural gas production from traditional basins is in decline. Production from Western Canada, West Texas and Oklahoma, the Onshore Gulf of Mexico, the Gulf of Mexico Shelf, and the San Juan Basin is approximately 19.3 Tcf per year and currently accounts for 80% of the production in United States and Canada. While production from these regions will still be an important part of the supply portfolio through the next decade, production is forecast to decline in both absolute terms and market share. By 2020, volumes from traditional basins are anticipated to decline over 3 Tcf per year to 16.2 Tcf per year, which will only be 61% of North American production. Hence, much of the growth of the gas market over the next 20 years must be sustained by development of currently untapped supplies from areas that are generally more remote from the consuming markets in North America. Frontier basins in the arctic, such as Alaska and the Mackenzie Delta, new offshore regions, such as the Gulf of Mexico Slope and Offshore Eastern Canada, and underdeveloped domestic areas such as the Northern Rockies all will be needed to serve U.S. Demand by 2020. LNG imports must also play a key role. U.S. LNG imports for 2002 totaled 229 Bcf. Imports for 2003 doubled the previous year at 475 Bcf. By 2020, U.S. LNG imports could be over 6,600 Bcf per year, nearly a thirty-fold increase from 2002. LNG is competitive with North American production at prices ranging from $3.50 to $4.00 per Mcf depending upon the distance that the LNG travels from the liquefaction plant to the import terminal. Imported LNG, in large part, becomes
2

White Paper on Natural Gas Interchangeability And Non-Combustion End Use
an economically viable energy supply because of the low cost of developing and producing abundant stranded gas resource located throughout the world. A.2.1 North American Resource Development and Production (EEA) North American natural gas supply is diverse, with gas originating from many different sources and areas. Historically, North America has been self-reliant, and most of its gas supply has come from the U.S. Gulf Coast producing area and from the Western Canadian Sedimentary Basin. Recently, both areas have shown signs of resource depletion, shifting the focus of gas producers to different formations (generally deeper sediments) and to other areas. For example, there has been increased focus on developing gas resource located in the deeper waters of the Gulf of Mexico3, with less emphasis on developing shallow water gas resource where most historical activity has been concentrated. LNG imports are also high on the list of potential new gas supplies for the North American gas market. In short, gas suppliers are looking to new frontiers for future supplies. Given the maturity of the North American gas resource, it is expected that this new focus will continue well into the future. To date, over 1,300 trillion cubic feet (Tcf) of gas resource has been developed in North America (Table A.1). Cumulative historical production currently stands at almost 1,100 Tcf, or over 80 percent of the total gas resource developed to date. The remainder of developed gas resource that has not yet been produced (otherwise known as proven reserves) is currently 244 Tcf. The Gulf Coast producing area (both onshore and offshore), the Western Canadian Sedimentary Basin, and the Rockies (Figure A.1) are all net exporters of natural gas within North America. Collectively, these areas account for 71 percent of the proven gas reserves and 77 percent of the current gas production in North America. The Gulf Coast producing area (both onshore and offshore) accounts for almost 70 Tcf, or about 25 percent of the proven gas reserves in North America. Not surprisingly, the area is also the most prolific production area in North America, accounting for almost 10 Tcf or 40 percent of the current gas production. The Western Canadian Sedimentary Basin has almost 60 Tcf of proven gas reserves, accounting for slightly over 20 percent of the proven gas reserves in North America. The Western Canadian Sedimentary Basin also accounts for about one-quarter of current North American gas production.
3 Activity has shifted out to water depths greater than 200 meters.
3

White Paper on Natural Gas Interchangeability And Non-Combustion End Use
The Rocky Mountain producing area, which includes many different producing formations and basins, has almost 50 Tcf of proven gas reserves, accounting for just under 20 percent of the proven gas reserves in North America. However, at present, the Rocky Mountains only account for 13 percent of the North American gas production. A significant amount of gas resource developed in the Rocky Mountains has been unconventional4 gas that is produced at relatively high R/P ratios5. Conversely, Gulf Coast gas resource is mostly conventional gas with much lower R/P ratios and higher decline rates. In contrast to the areas discussed above, the Eastern Interior is a net importer of gas within North America. The Eastern Interior accounts for only 14 Tcf of gas reserves or 5 percent of the proven reserves in North America. In addition, the region only accounts for just over 3 percent of the current North American gas production. We expect that the Eastern Interior gas markets will continue to rely on gas from other North American regions, primarily the Gulf Coast and Eastern Canada, or LNG imports for future gas supply. Table A.1 indicates that a significant and widespread resource remains to be developed. In total, the remaining resource could sustain today’s level of North American gas production for almost 70 years. However, only the cost-effective portion of this resource base is likely to be developed in the foreseeable future. EEA supply analysis indicates about 700 Tcf of gas6 that is economic to develop at Henry Hub gas prices below $5 per MMBtu7. This would indicate that there is an additional 600 Tcf of non-Arctic gas that is uneconomic to develop at sustained gas prices of $5 per MMBtu.
4 Includes coalbed methane, very low permeability formations, and shales. 5 R/P ratio – Natural gas reserves / annual production. The average R/P ratio for all North
American gas production is just under 10. In contrast, the R/P ratio for Rocky Mountain gas is about 15. The U.S. Energy Information Administration is currently investigating why the R/P ratio for Rocky Mountain gas production is so high. The number may reflect pre-booking of resource that is thought to exist but has not yet been developed, for example, pre-booking of the extensive coalbed methane resource located in Powder River Basin.
6 Does not include Canada Arctic and Alaska gas resource. 7 The supply curves indicate the amount of gas resource that is economic to develop through
2020 at different gas prices. In reality, it is unlikely that total amounts indicated will be developed because of constraints on drilling activity and capital constraints, among other factors. Hence, the supply curves indicate the maximum amount of resource that is likely to be developed at different gas prices.
4

White Paper on Natural Gas Interchangeability And Non-Combustion End Use
Table A.1 Natural Gas Resource, Reserves, and Production (Tcf)8
Source: Energy and Environmental Analysis, Inc.
Region Cumulative Historical
Production
(Plus) Proven
Reserves
(Equals) Developed Resource
(Plus) Estimated Remaining Resource
(Equals) Total
Resource
Estimated Production
in 2002
Alaska 10.8 8.8 19.6 321.8 341.4 0.4
West Coast Onshore 31.9 2.6 34.5 32.6 67.1 0.3
Great Basin 1.4 1.0 2.4 4.0 6.4 0.1
Rockies 67.1 49.7 116.8 213.3 330.2 3.4
West Texas 105.4 16.4 121.8 54.2 176.0 1.7
Gulf Coast Onshore 321.5 37.5 359.0 176.5 535.5 4.9
Mid-continent 179.9 24.0 203.9 72.6 276.5 2.2
Eastern Interior 54.9 13.7 68.6 122.1 190.7 0.9
Gulf of Mexico 163.1 29.2 192.3 316.0 508.3 4.9
U.S. Pacific Offshore 2.6 0.6 3.2 1.2 4.4 0.0
WCSB 126.0 57.5 183.5 206.5 390.0 6.4
Arctic Canada 0.1 0.0 0.1 73.9 74.0 0.0
Eastern Canada Onshore
1.1 0.4 1.5 7.2 8.7 0.0
Eastern Canada Offshore
0.3 2.2 2.5 96.1 98.6 0.2
Western British Columbia
0.0 0.0 0.0 11.5 11.5 0.0
North America Total 1,066.0 243.5 1,309.7 1,709.5 3,019.1 25.4
8 Unless otherwise stated, values are dry gas at the end of 2001. Resource values represent
accessible and technically recoverable resource through 2020 with advancement of E&P technologies consistent with recent improvements. Does not include an estimated 180 Tcf of resource not currently accessible.
5
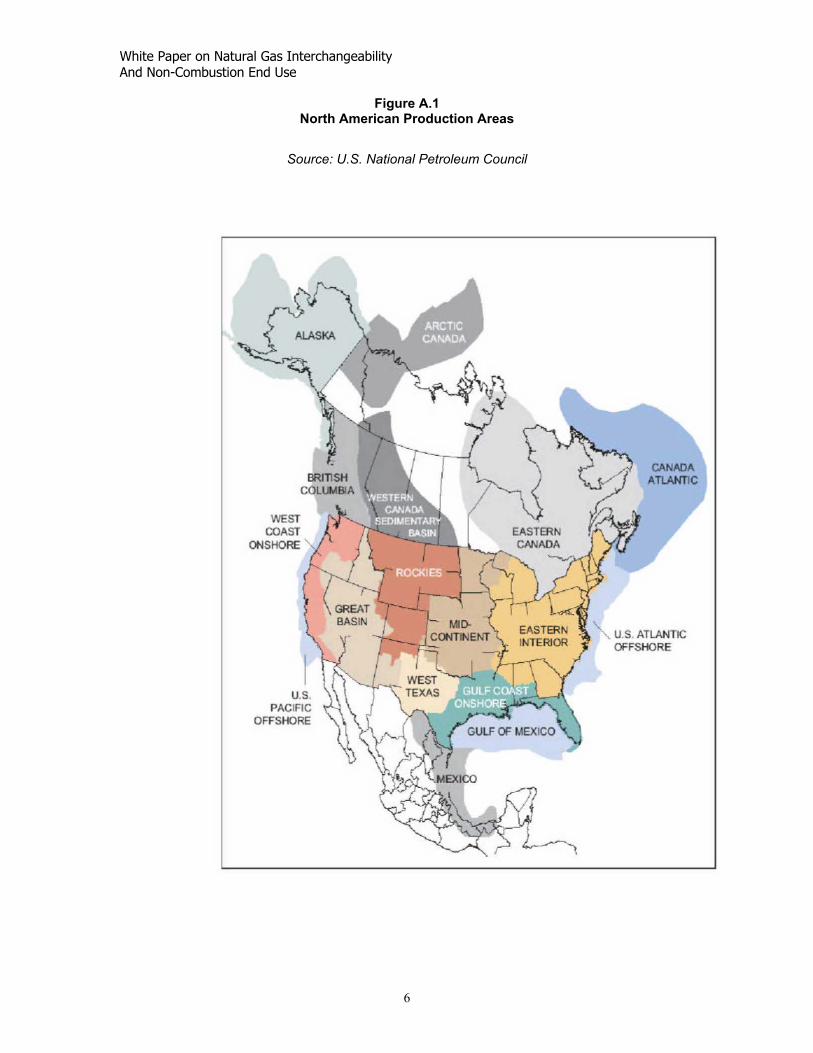
White Paper on Natural Gas Interchangeability And Non-Combustion End Use
Figure A.1 North American Production Areas
Source: U.S. National Petroleum Council
6
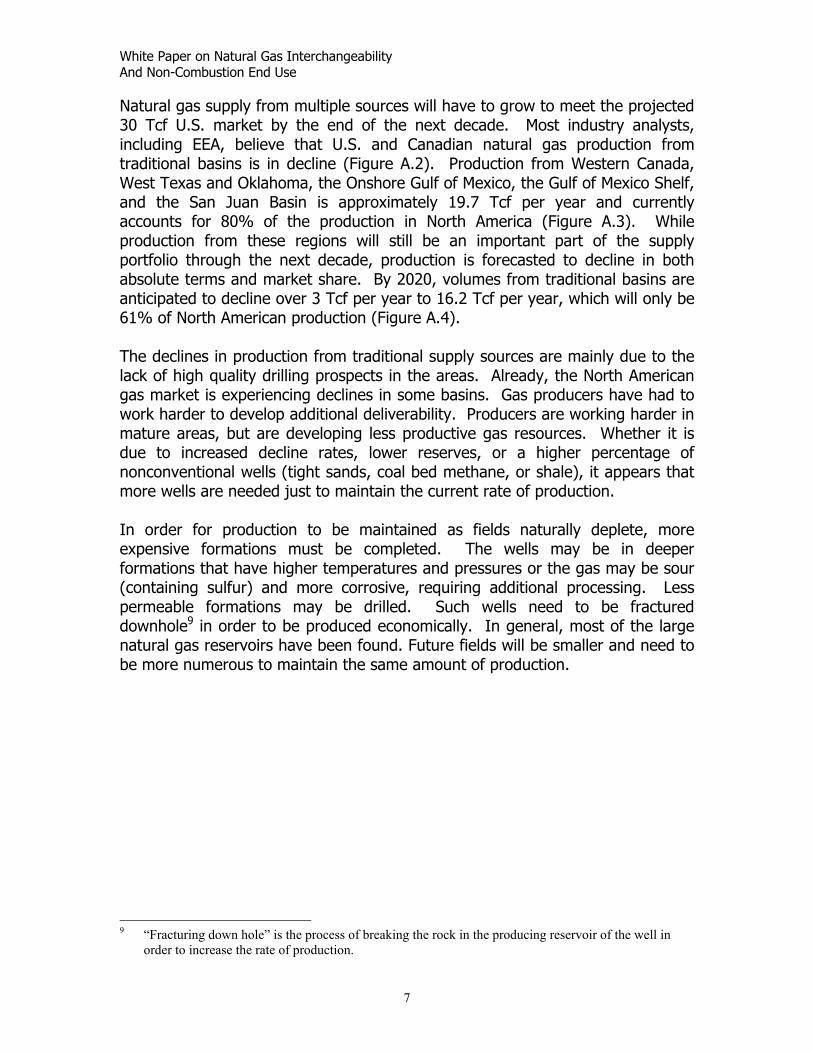
White Paper on Natural Gas Interchangeability And Non-Combustion End Use
Natural gas supply from multiple sources will have to grow to meet the projected 30 Tcf U.S. market by the end of the next decade. Most industry analysts, including EEA, believe that U.S. and Canadian natural gas production from traditional basins is in decline (Figure A.2). Production from Western Canada, West Texas and Oklahoma, the Onshore Gulf of Mexico, the Gulf of Mexico Shelf, and the San Juan Basin is approximately 19.7 Tcf per year and currently accounts for 80% of the production in North America (Figure A.3). While production from these regions will still be an important part of the supply portfolio through the next decade, production is forecasted to decline in both absolute terms and market share. By 2020, volumes from traditional basins are anticipated to decline over 3 Tcf per year to 16.2 Tcf per year, which will only be 61% of North American production (Figure A.4). The declines in production from traditional supply sources are mainly due to the lack of high quality drilling prospects in the areas. Already, the North American gas market is experiencing declines in some basins. Gas producers have had to work harder to develop additional deliverability. Producers are working harder in mature areas, but are developing less productive gas resources. Whether it is due to increased decline rates, lower reserves, or a higher percentage of nonconventional wells (tight sands, coal bed methane, or shale), it appears that more wells are needed just to maintain the current rate of production. In order for production to be maintained as fields naturally deplete, more expensive formations must be completed. The wells may be in deeper formations that have higher temperatures and pressures or the gas may be sour (containing sulfur) and more corrosive, requiring additional processing. Less permeable formations may be drilled. Such wells need to be fractured downhole9 in order to be produced economically. In general, most of the large natural gas reservoirs have been found. Future fields will be smaller and need to be more numerous to maintain the same amount of production.
9 “Fracturing down hole” is the process of breaking the rock in the producing reservoir of the well in
order to increase the rate of production.
7

White Paper on Natural Gas Interchangeability And Non-Combustion End Use
Figure A.2 North American Natural Gas Production by Region
-
5,000
10,000
15,000
20,000
25,000
30,000
1998
2000
2002
2004
2006
2008
2010
2012
2014
2016
2018
2020
Bcf
per
Yea
r
Rockies GOM Slope Eastern Canada Alaska Makenzie Delta
Traditional Basins
Fronter Basins
Other GOM Shelf Onshore Gulf West TX / OK Western Canada San Juan
North American production including gas produced and consumed in Canada but excludes Mexico
8

White Paper on Natural Gas Interchangeability And Non-Combustion End Use
Figure A.3 2003 North American
Natural Gas Production by Region
Onshore Gulf 21%
West TX / OK 14%
Western Canada 24%
Rockies 9%
GOM Slope 7%
San Juan 6%
GOM Shelf 12%
Other 4%
Eastern Canada 1%
Alaska 2%
Traditional Basins19.3 Tcf - 80%
Frontier Basins4.7 Tcf - 20%
Hence, much of the growth of the gas market over the next 20 years must be sustained by development of currently untapped supplies from areas that are generally more remote from the consuming markets in North America. LNG imports will also play a key role (see next section). Frontier basins in the arctic, such as Alaska and the Mackenzie Delta, new offshore regions, such as the Gulf of Mexico Slope and Offshore Eastern Canada, and underdeveloped domestic areas such as the Northern Rockies all will be needed to serve U.S. Demand by 2020. To bring gas from the new supply regions, pipeline infrastructure will have to be built.
9
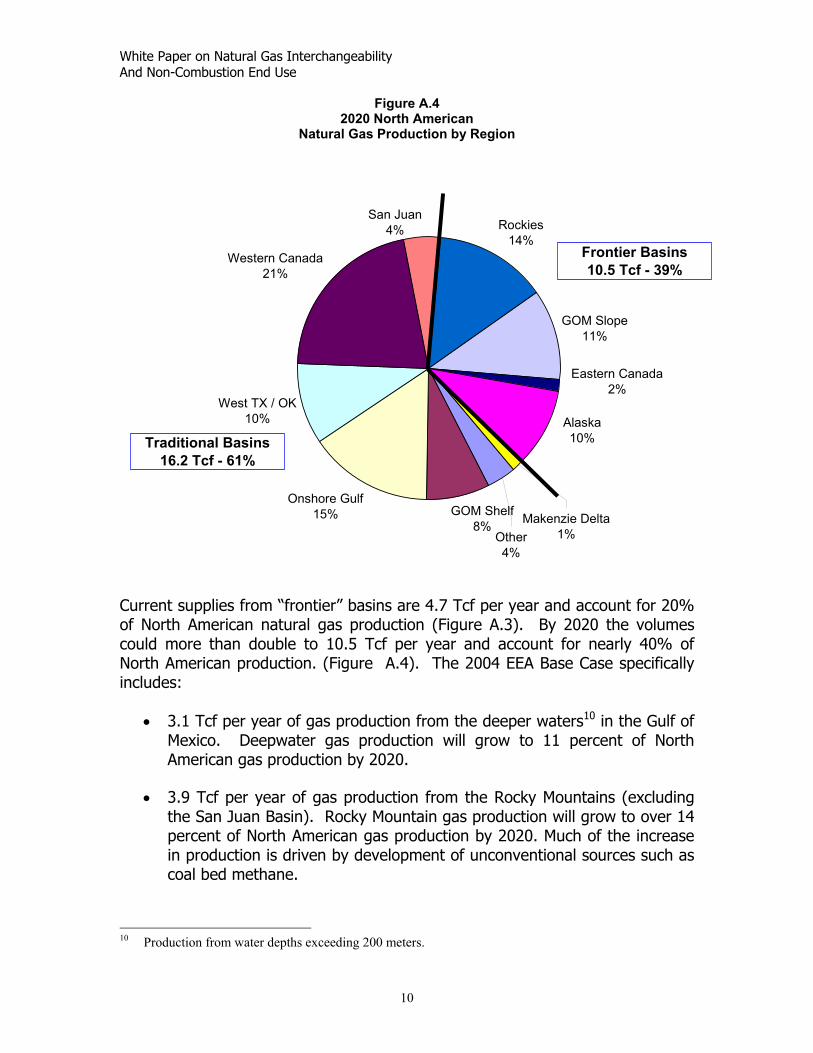
White Paper on Natural Gas Interchangeability And Non-Combustion End Use
Figure A.4 2020 North American
Natural Gas Production by Region
Onshore Gulf 15%
West TX / OK 10%
Western Canada 21%
Rockies 14%
GOM Slope 11%
San Juan 4%
Makenzie Delta 1%
GOM Shelf 8%
Other 4%
Eastern Canada 2%
Alaska 10%Traditional Basins
16.2 Tcf - 61%
Frontier Basins10.5 Tcf - 39%
Current supplies from “frontier” basins are 4.7 Tcf per year and account for 20% of North American natural gas production (Figure A.3). By 2020 the volumes could more than double to 10.5 Tcf per year and account for nearly 40% of North American production. (Figure A.4). The 2004 EEA Base Case specifically includes:
• 3.1 Tcf per year of gas production from the deeper waters10 in the Gulf of Mexico. Deepwater gas production will grow to 11 percent of North American gas production by 2020.
• 3.9 Tcf per year of gas production from the Rocky Mountains (excluding
the San Juan Basin). Rocky Mountain gas production will grow to over 14 percent of North American gas production by 2020. Much of the increase in production is driven by development of unconventional sources such as coal bed methane.
10 Production from water depths exceeding 200 meters.
10

White Paper on Natural Gas Interchangeability And Non-Combustion End Use
• 2.7 Tcf per year of Alaska gas production, 2.2 Tcf of which flows south to Canada and the Lower-48. Alaska gas production will account for 10 percent of North American gas supply by 2020.
• 0.4 Tcf per year of MacKenzie Delta gas production, most of which may
remain in Western Canada for oil shales development.
• 0.5 Tcf per year of Eastern Canada offshore gas production, most of which will satisfy growth in gas demand in the Northeast U.S. Eastern Canada offshore production will grow to almost 2 percent of North American gas supply by 2020.
Although actual amounts and timing of production from frontier basins will vary from the EEA Base case, most analysts agree that supplies from such regions will be significant by the end of the next decade.
A.2.2 LNG Imports (EEA)
In addition to the need for gas production from more remote locations, the EEA base projection relies on an order-of-magnitude increase in LNG imports to meet the requirements of the U.S. market. U.S. LNG imports for 2002 totaled 229 Bcf. Imports for 2003 doubled the previous year at 475 Bcf. By 2020, U.S. LNG imports could be over 6,600 Bcf per year, nearly a thirty-fold increase from 2002. Figure A.5 presents the forecast of the amount and location of imports and exports of LNG assumed in the study. Currently, there are four operating LNG import terminals in North American.11 In order to attain the level of LNG imports assumed in the EEA Base Case, approximately 10 additional terminals will need to be constructed.
11 In addition to the four import terminals, there are more than 100 LNG peak shaving facilities that are
used principally by local distribution companies to meet peak day demand.
11

White Paper on Natural Gas Interchangeability And Non-Combustion End Use
Figure A.1 U.S. LNG Imports (Bcf / Year)
0
1000
2000
3000
4000
5000
6000
7000
8000
1998
2000
2002
2004
2006
2008
2010
2012
2014
2016
2018
2020
Ann
ual B
cf
Everett Lake Charles / Other LA Cove Point Elba Island SOCAL New EnglandE. TX (Katy) Offshore Texas New Jersey
LNG deliveries compete with wellhead production. LNG is competitive with North American production at prices ranging from $3.50 to $4.00 per Mcf depending upon the distance that the LNG travels from the liquefaction plant to the import terminal. Imported LNG, in large part, becomes an economically viable energy supply because of the low cost of developing and producing abundant stranded gas resource located throughout the world. Most of the gas may be developed and produced at costs under $1 per MMBtu at the wellhead, but the additional costs of liquefaction, tankering, and regasification are significant. Hence, the delivered cost of LNG imports are high, making LNG one of the most expensive Sources of new supply on a unit basis. Unlike domestic or Canadian supplies, the U.S. must compete with the rest of the world for LNG. World market conditions influence LNG prices. In addition to expansion plans at the existing four import terminals, there are nearly 40 new LNG terminals proposed for North America. Obviously not all of them will be built. Actual locations for new terminals will not only be based on economic factors such as proximity to consuming markets but also political factors of permitting and siting. There is significant value in siting LNG terminal
12
White Paper on Natural Gas Interchangeability And Non-Combustion End Use
facilities in “market area” locations that are downstream of pipeline constraints such as the Northeast U.S. However such locations may have limited pipeline access or face additional hurdles in permitting. Terminals along the Gulf of Mexico will have access to a more extensive pipeline network but may receive a lower price for their natural gas supplies. In the end, a mix of supply area and market area terminals will most likely be built. Of the four existing terminals, 3 are on the East Coast, Everett, Cove Point, and Elba Island; While Lake Charles is located along the Gulf of Mexico. The EEA Base case assumes 2 additional East Coast terminals, 7 Gulf Coast terminals and 1 terminal on the West Coast. A.2.3 Imports and Exports from Mexico (EEA) Exports to Mexico have increased from a little over 100 MMcfd in 1998 to over 1 bcfd in 2003. Growth in gas demand in Mexico, driven substantially by increased gas requirements for power generation, has exceeded growth in supply. Consequently, Mexico has needed to import increasing quantities of gas from the United States over the past five years. Mexico has a significant gas resource base of its own. However, much of the resource base is in Southern Mexico and would require the development of pipeline infrastructure to bring the gas to the market regions just south of the U.S. border. A considerable amount of gas is contained in the Burgos region across the Texas border. The EEA forecast used in the INGAA Foundation analysis assumes that development of the indigenous gas resource in North Mexico is used to stabilize the level of required imports from the North by the end of the decade. In addition, the projection anticipates the construction of two LNG terminals, one on the East Coast in Altimira, and one on the West Coast in Baja California. Both would supplement Mexico’s domestic production reducing the need for imports by 585 Bcf per year after 2006. Excess imports of LNG on the West Coast of Mexico provides for net exports to the U.S. on the order of 185 Bcf per year. A.3 LNG Supply Sources and Characteristics Global LNG supply comes from a variety of sources, is not homogeneous, and has heating value contents that vary widely. The interchangeability of LNG is an important issue to consider, as the composition of imported LNG can be different from that of current domestic pipeline gas. That difference is not because the composition of the gas produced in North America differs from natural gas in other parts of the world, but is more of a result of the rise of the ethane-based petrochemical industry. As the petrochemical and natural gas liquids (NGL)
13

White Paper on Natural Gas Interchangeability And Non-Combustion End Use
industries developed in the United States, the typical heating values of the "natural gas" being delivered to the interstate pipeline and end-use markets decreased markedly due to increased recovery of ethane, propane and butane, that were then sold as separate products. As the U.S. gas infrastructure developed and matured, the system delivered leaner pipeline gas (gas with less heavy hydrocarbon constituents and lower heating value). In most other regions of the world, natural gas is not subjected to such high levels of ethane and propane extraction, resulting in higher heating values for pipeline gas. LNG production plants are usually located in remote areas with limited or no local ethane markets. Thus few LNG production plants extract ethane from its feed. Propane and butane, on the other hand, are extracted at varying levels based on the economic value of those products at the specific LNG plants. As a consequence, most LNG contains more ethane, propane, and butane than U.S. domestic pipeline gas. Furthermore, LNG contains virtually no carbon dioxide and little or no nitrogen, both of which are commonly present in domestic natural gas. The presence of hydrocarbons heavier than methane (ethane and propane) and low levels of non-hydrocarbons result in most LNG supplies having a gross heating value between 1,100 and 1,150 Btu per cubic foot or about 10% higher than that of typical U.S. domestic pipeline gas. Many of the U.S. gas pipelines have heating value specifications that serve to protect the pipelines and the markets they supplied from the presence of liquid hydrocarbons in a distribution system designed to handle a gas-only stream. It should be understood and appreciated that LNG contains negligible quantities of pentanes and heavier, which are the natural gas components most likely to create a liquid phase in a pipeline. LNG has generally no more than 0.1% of pentane-plus because, if present in greater quantities, these compounds will freeze in the liquefaction process and plug the heat transfer equipment in the coldest parts of the plant. Technically it is possible to produce lean LNG with a lower heating value, but at a cost. Those costs will vary at each production plant. Costs will be high for LNG plants with significant existing production capacity that have historically been targeted for markets requiring high heating value LNG. These facilities will require separate fractionation, liquefaction, and LNG storage to be built to be able to produce lean LNG as well as rich LNG. Costs may also increase if the gas supply contains a significant amount of ethane. If the ethane cannot be left in the LNG or blended into the rich LNG product, then, due to lack of a local ethane market, it will have to be sold as a waste product. Those costs can be significant, making supply of a lean LNG economically unattractive for most of
14

White Paper on Natural Gas Interchangeability And Non-Combustion End Use
the existing LNG producers. Tight specifications on maximum heating value for the U.S. market may significantly limit the LNG supply options. Some liquefaction facilities, such as Atlantic LNG in Trinidad and Tobago and Nigeria LNG, have installed liquifiable extraction facilities that remove significant portions of ethane and heavier components as part of the production process. The resulting LNG is similar in heating value to U.S. pipeline gas. A.3.1 Atlantic Basin Sources Atlantic Basin exporters produced 1.5 Tcf (32 million tons) in 2002, about 29 percent of total world LNG production. As of late 2003, Atlantic Basin LNG producers had 2.1 Tcf (43 million tons) of annual capacity. Expansions in Nigeria and Trinidad and Tobago, as well as new facilities in Egypt and Norway, would increase annual Atlantic Basin liquefaction capacity to 3.3 Tcf (73 million tons) by 2007. Algeria was the second largest LNG exporter in 2002, shipping 935 Bcf (19.6 million tons) mainly to Europe (France, Belgium, Spain, and Turkey) and the United States. A major renovation in 1999 raised the country’s LNG production capacity to more than 1.1 Tcf (23.1 million tons) per year. Algeria also exports more than 1.0 Tcf of natural gas per year to Europe by pipeline. The Algerian State-owned oil and gas company Sonatrach owns and operates four liquefaction complexes, the first of which started up in 1964, making Algeria the world’s first LNG exporter. Algeria has no new liquefaction capacity planned before 2008 but in the long term is planning to add another train. Nigeria exported 394 Bcf (8.2 million tons) of LNG in 2002, mainly to Turkey, Italy, France, Portugal, and Spain. Nigeria has also delivered more than 20 cargos under short-term contracts to the United States over the past three years. The total annual capacity of Nigeria’s Bonny Island LNG plant is 463 Bcf (9.5 million tons), and Nigeria LNG has begun construction of two additional 200-Bcf-per-year (4.1-million-tpy) trains that are scheduled to begin operation in 2005. Additional trains are under discussion as are three new projects that have been considered in the West Niger Delta (by ExxonMobil, ChevronTexaco, and ConocoPhillips), Brass River (by the Italian company ENI and ConocoPhillips), and a floating offshore project (by Statoil and Total). Trinidad and Tobago exported 189 Bcf (4.0 million tons) of LNG in 2002. Trinidad and Tobago’s LNG facility at Point Fortin has three trains and an annual capacity of 482 Bcf (9.9 million tons). In June 2003, the Government of Trinidad and Tobago approved the construction of a fourth train that could produce an
15
White Paper on Natural Gas Interchangeability And Non-Combustion End Use
additional 253 Bcf (5.2 million tons) per year. Trinidad and Tobago exports LNG to the continental United States, Puerto Rico, Spain, and the Dominican Republic. Libya exported 21 Bcf (0.4 million tons) of LNG in 2002. The plant at Marsa El Brega has an annual capacity of about 131 Bcf (2.7 million tons). Only about 25 percent of the total capacity, or 29 Bcf (0.6 million tons) per year, is available for export due to maintenance issues. Two LNG export projects are being built in Egypt: a one-train liquefaction facility at Damietta, which will start operations in 2004 with an annual capacity of 244 Bcf (5.0 million tons), and a two-train project at Idku with a 2005 startup date and a projected annual capacity of 175 Bcf (3.6 million tons). All of the Idku LNG is contracted to Gaz de France. Commitment to a second 175-Bcf-per-year (3.6-million-tpy) train was announced in September 2003. British Gas (BG) has agreed to buy the entire output for U.S. and Italian markets. Beginning in 2006, Norway plans to export LNG from a 200-Bcf-per-year (4.1-million-tpy) liquefaction terminal now being built on Melkøye Island in the Norwegian Sea. Exports are targeting markets in Spain, France, and the United States. A.3.2 Middle Eastern Sources Exporters from the Middle East produced 1.2 Tcf (25 million tons) in 2002, about 23 percent of total world LNG production. As of late 2003, the three Middle Eastern exporters had 1.4 Tcf (29 million tons) of annual capacity. Expansions to facilities in Qatar and Oman will add 619 Bcf (13 million tons) of annual liquefaction capacity, increasing Middle East capacity to 2.0 Tcf (42 million tons) per year by 2007. Qatar ranks fourth in world LNG exports and has an annual capacity of 726 Bcf (14.9 million tons) from two liquefaction plants owned by the Qatargas and Ras Laffan LNG (RasGas) consortia. The Qatargas plant is being debottlenecked, and two more trains are being added to the RasGas facility, which would add 458 Bcf (9.4 million tons) of annual capacity by 2005. Most of Qatar’s exports go to customers in Japan and South Korea, but short-term cargos have also been shipped to the United States and Europe. Its enormous natural gas reserves and low upstream production costs give Qatar the potential to significantly expand its LNG exports to a targeted annual capacity of 2.9 Tcf (60 million tons) by 2015. Oman has one LNG export terminal, which began operation in 2000 with two liquefaction trains and an annual capacity of 356 Bcf (7.3 million tons). Most of the LNG is sold to South Korea’s Kogas. Smaller volumes are shipped to
16
White Paper on Natural Gas Interchangeability And Non-Combustion End Use
customers in Japan, the United States, and Europe. A planned third train would add 161 Bcf (3.3 million tons) per year in 2006. Further expansion potential for LNG exports from Oman is limited by the modest size of the country’s reserves. The United Arab Emirates (UAE) has the world’s fifth largest natural gas reserves and ranks ninth in LNG exports. Abu Dhabi Gas Liquefaction Co. operates the nation’s only export facility with a capacity of 278 Bcf (5.7 million tons). Roughly 90 percent of UAE LNG production is exported to Japan. Despite its large reserves, the UAE is unlikely to expand its production of LNG since it uses much of the gas for domestic purposes. A.3.3 Pacific Basin Sources Pacific Basin LNG exporters produced 2.6 Tcf (55 million tons) in 2002, about 49 percent of total world LNG production. As of late 2003, five Pacific Basin exporters had 3.1 Tcf (63 million tons) of annual liquefaction capacity. Liquefaction capacity in the Pacific Basin is expected to increase by 780 billion cubic feet (Bcf) or 16 million tons of annual capacity over the next few years to more than 3.8 Tcf (80 million tons) per year by 2007. Indonesia is the world’s largest LNG producer and exporter. In 2002, Indonesia exported 1.1 Tcf (23 million tons) of LNG or 21 percent of the world’s total LNG exports. Most of Indonesia’s LNG is imported by Japan with smaller volumes going to Taiwan and South Korea. Indonesia’s annual liquefaction capacity is 1.4 Tcf (30 million tons) from the two exporting complexes at Bontang and Arun. An additional train at Bontang is under consideration but has yet to contract for the capacity. BP is leading development of a two-train, 341-Bcfper-year (7.0-million-tpy) project at Tangguh scheduled to start up in 2007. The Tangguh LNG is destined for China, other Asian markets, and potentially the United States. Malaysia, the world’s third largest LNG exporter after Indonesia and Algeria, exported 741 Bcf (15.6 million tons) in 2002. These exports went primarily to Japan, with smaller volumes to Taiwan and South Korea. Three liquefaction terminals have been developed at the Bintulu LNG complex in Sarawak, Malaysia Satu, Dua, and Malaysia Tiga, the first train of which went on-stream in mid-2003. A second train will come online in November 2003, raising the total capacity of the Bintulu complex to an annual 1.1 Tcf (22.7 million tons). Australia exported 367 Bcf (7.7 million tons) of LNG from the Northwest Shelf project in 2002, primarily to Japanese utilities. The project owners have started construction on an additional 205-Bcf-per-year (4.2-million-tpy) train scheduled to come online in 2004. An additional train is under consideration. Three new projects are also in various stages of development. Conoco Phillips has begun
17

White Paper on Natural Gas Interchangeability And Non-Combustion End Use
construction on a 175-Bcf-per-year (3.6-million-tpy) Darwin LNG project, to monetize reserves in the Timor Sea shared by Australia and East Timor. ConocoPhillips is also working with Shell, Osaka Gas, and Woodside Petroleum to develop the 258-Bcf-per-year (5.3-million-tpy) Greater Sunrise project via a floating LNG facility. ChevronTexaco, in partnership with ExxonMobil and Shell, is spearheading a two-train Gorgon project with an annual capacity of 487 Bcf (10.0 million tons) to monetize reserves discovered offshore Northwest Australia. Brunei Darussalam has a two-train liquefaction terminal at Lumut with an annual capacity of 351 Bcf (7.2 million tons). About 90 percent of its output goes to customers in Japan and the remaining 10 percent to South Korea. The United States has a 68-Bcf-per-year (1.4-million-tpy) liquefaction terminal at Kenai, Alaska, that has been exporting LNG to Japan for more than 30 years. There are currently no plans to expand this facility. Russia’s first LNG plant is under construction on Sakhalin Island off Russia’s east coast. The two-train facility will have an annual capacity of 466 Bcf (9.6 million tons), with exports of 234 Bcf (4.8 million tons) per year from the first train scheduled to begin in 2007. The partners have already secured sales contracts with three Japanese utilities for 136 Bcf (2.8 million tons) per year over 20 years. There are reports that Russian officials have also expressed interest in exporting LNG from the giant Shtokman field in the Barents Sea to the United States and elsewhere. A.3.4 New Sources of LNG At least seven additional countries are exploring their potential as LNG exporters. Pacific Basin. A project is proposed for exporting natural gas from Peru’s Camisea field to a terminal in Mexico. Several European and U.S. companies are proposing a project to pipe gas from Bolivia to either Peru or Chile on the Pacific Coast where it could be liquefied and shipped to a terminal on the West Coast of North America. Middle East. With the world’s second largest proved gas reserves, Iran has great potential to export gas to markets in Europe, Asia, and India by pipeline and as LNG. The Iranian government is considering at least four projects, each of 390 to 490 Bcf (8 to 10 million tons) per year, to process reserves in the South ParsNorth field in partnership with companies in Europe and Asia. An LNG project has been proposed in Yemen for more than a decade but to date has not made significant progress.
18

White Paper on Natural Gas Interchangeability And Non-Combustion End Use
Atlantic Basin. In Venezuela, an LNG project has been discussed since the early 1970s. Shell and Mitsubishi have signed preliminary agreements to develop a 229-Bcf-per-year (4.7-million-tpy) project called Marisal Sucre based on offshore reserves. Discussions have been held with neighboring Trinidad and Tobago to bring Venezuelan gas to their Atlantic LNG plant for processing until a Venezuelan LNG plant can be built. In Angola, ChevronTexaco, ExxonMobil, BP, Total, and Sonangol are proposing to build a plant based on offshore associated gas for export to North American and European markets. The plant would initially have a single 195-Bcf-per-year (4.0-million-tpy) train with the option for development of additional trains later. Equatorial Guinea is looking to export LNG from its offshore Alba field. In May 2003, U.S.-based firm Marathon Oil signed a 17-year draft agreement to supply British Gas with 166 Bcf (3.4 million tons) per year of LNG to be delivered to the Lake Charles regasification facility in the United States. The project is currently undergoing advanced engineering feasibility studies, and a final investment decision is due in the first quarter of 2004. A.4 U. S. Domestic Supply Characteristics A.4.1 1992 GRI Study U. S. domestic supply gas quality characteristics were reported on in an GRI study in 1992 entitled “Variability of Natural Gas Composition in Select Major Metropolitan Areas of the United States”. Gas supply compositions within the U. S. vary by region depending on demand, available supply, the degree of processing and pipeline blending. The 1992 GRI survey of gas supplies included gas composition data for over 6,800 samples from 26 cities in the United States. The absolute minimum and maximum Wobbe numbers in the data were 1201 and 1418, respectively. Most of the data showed a narrow range of Wobbe numbers, with tenth and ninetieth percentile levels of 1331 and 1357, respectively. The team found that the historical range of gas compositions reported in the 1992 survey has been successfully utilized; more recent gas composition data is currently being collected. However, it is critical to recognize that not all gases within the absolute range are interchangeable with each other. The range of interchangeability for a given region is generally tighter than the variation between regions of the country. Other Work Group findings from this study include:
• The 1990-91 data in the 1992 study, absent of other data of similar breadth, represents a reasonable snapshoot of U. S. historical gas supply
19

White Paper on Natural Gas Interchangeability And Non-Combustion End Use
to LDC city gates over relevant historical period for interchangeability considerations.
• Such historical data represents gas supply under which the current stock
of appliances and other end use equipment were installed and adjusted for combustion characteristics.
• Deviations in gas supply from these historical characteristics must be,
themselves, considered in the context of interchangeability compared with this historical baseline or “adjustment gases” for the stock of appliances and end use equipment installed at the time.
Given this historical perspective, the Work Group found a need to describe more recent gas compositions in the U. S. gas system in order to:
• Characterize current supplies in light of historical conditions, and • Identify interchangeability issues suggested by any trends away from
historical supply compositions. A.4.2 2004 Analysis by the NGC Work Groups The NGC Work Groups initiated work in September 2004 to gather gas quality information from AGA member companies and pipeline companies for the periods 1995/1996 and 2002/2003 in order to allow the Work Group to base its interchangeability recommendations on contemporary domestic gas quality data. Data was generally provided for the periods September 1995 through August 1996 and September 2002 through August 2003. Since parallel work was being done by the NGC Liquid Dropout Work Group, data was collected that would benefit both work groups.
Data collected contained the following types of information:
• Company
• Location
• State
• Date
• Gas Volume (mcf)
• Gas Temperature (F),
20

White Paper on Natural Gas Interchangeability And Non-Combustion End Use
• BTU content
• Specific Gravity
• Wobbe • C1 to C6, C6+, Nitrogen, and CO2 mole percent composition
Twenty-three (23) companies supplied data sets. Not all data sets submitted contained gas composition. Those without gas composition were only used to for Wobbe and related interchangeability purposes. Figures A.6 and A.7 at the end of this section show the number of records used in the liquid dropout and interchangeability analyses by State and time period. Total records available by time period and application are summarized in this table:
Application 0203 Period 9596 Period Total
Interchangeability 705810 870 706680
Liquid dropout 17335 629 17964
Total by Period 723145 1499 724644
After receipt of the data, the following procedure was used to prepare the data for further analysis by the appropriate work groups:
• Load the data into an Access database.
• Review data and eliminate/correct data that was obviously incorrect.
• Calculate SG, Wobbe, C4+ and other parameters of interest for
interchangeability for all records if not already supplied with the data. Verify the values for these parameters if they were supplied in the data set.
• Extend C6+ to C6, C7, C8 using a 0.47/0.36/0.17 spilt for all data records
supplied with composition data.
• Extract the maximum/minimum liquid dropout data for any location by time period (95/96 or 02/03) by taking the record with the maximum/minimum C6+ value for that location and time period for cricondentherm determination.
21
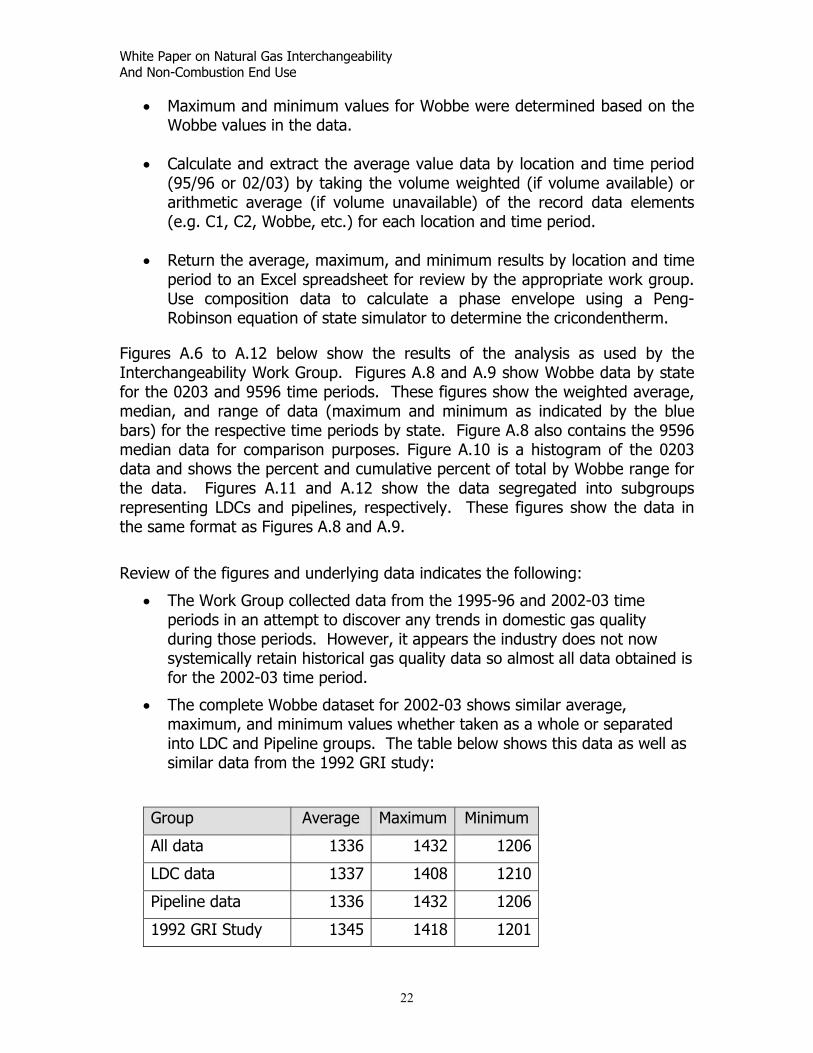
White Paper on Natural Gas Interchangeability And Non-Combustion End Use
• Maximum and minimum values for Wobbe were determined based on the Wobbe values in the data.
• Calculate and extract the average value data by location and time period
(95/96 or 02/03) by taking the volume weighted (if volume available) or arithmetic average (if volume unavailable) of the record data elements (e.g. C1, C2, Wobbe, etc.) for each location and time period.
• Return the average, maximum, and minimum results by location and time
period to an Excel spreadsheet for review by the appropriate work group. Use composition data to calculate a phase envelope using a Peng-Robinson equation of state simulator to determine the cricondentherm.
Figures A.6 to A.12 below show the results of the analysis as used by the Interchangeability Work Group. Figures A.8 and A.9 show Wobbe data by state for the 0203 and 9596 time periods. These figures show the weighted average, median, and range of data (maximum and minimum as indicated by the blue bars) for the respective time periods by state. Figure A.8 also contains the 9596 median data for comparison purposes. Figure A.10 is a histogram of the 0203 data and shows the percent and cumulative percent of total by Wobbe range for the data. Figures A.11 and A.12 show the data segregated into subgroups representing LDCs and pipelines, respectively. These figures show the data in the same format as Figures A.8 and A.9.
Review of the figures and underlying data indicates the following:
• The Work Group collected data from the 1995-96 and 2002-03 time periods in an attempt to discover any trends in domestic gas quality during those periods. However, it appears the industry does not now systemically retain historical gas quality data so almost all data obtained is for the 2002-03 time period.
• The complete Wobbe dataset for 2002-03 shows similar average, maximum, and minimum values whether taken as a whole or separated into LDC and Pipeline groups. The table below shows this data as well as similar data from the 1992 GRI study:
Group Average Maximum Minimum
All data 1336 1432 1206
LDC data 1337 1408 1210
Pipeline data 1336 1432 1206
1992 GRI Study 1345 1418 1201
22

White Paper on Natural Gas Interchangeability And Non-Combustion End Use
• Figures A.6, A.7, A.8, and A.9 clearly show variability among states in the range of Wobbe number. This is particularly true in producing states where the average range (difference between maximum and minimum) in Wobbe in 2002-03 was 127 compared to non-producing states with an average range in Wobbe of 61.
• Review of Figure A.10 shows that 90% of the 0203 data has a Wobbe less than 1349 and 99.7% of the data has a Wobbe less than 1400.
23
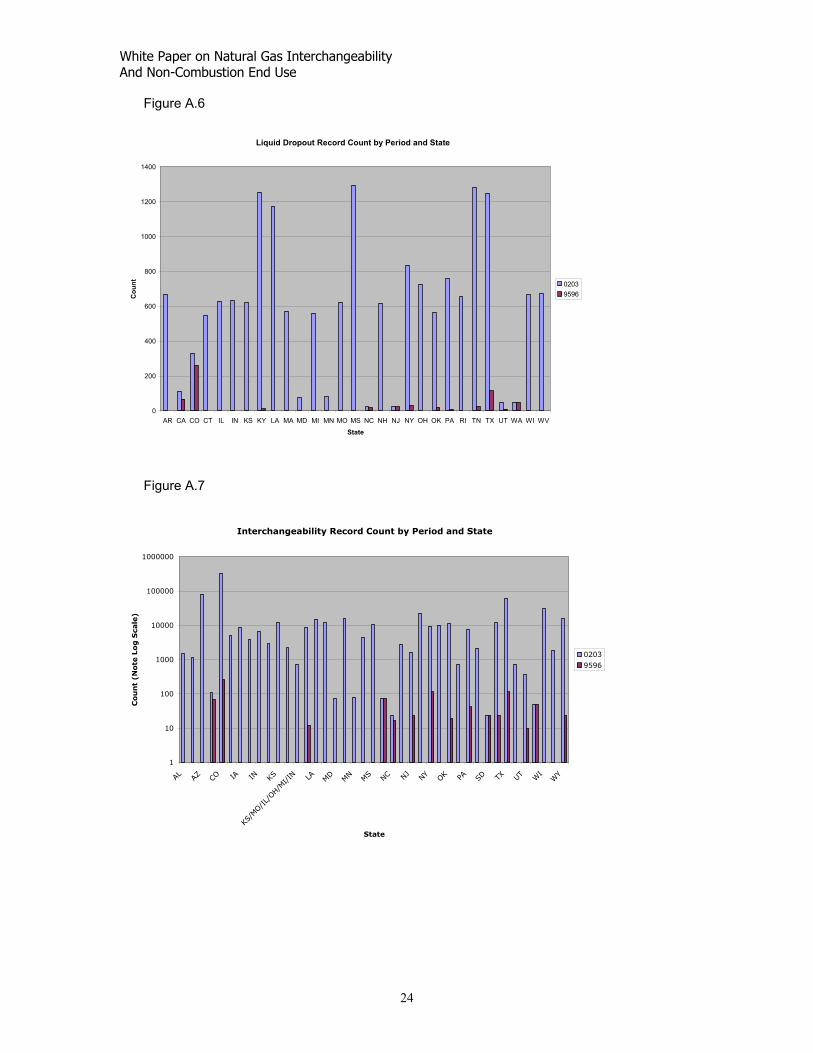
White Paper on Natural Gas Interchangeability And Non-Combustion End Use
Figure A.6
Liquid Dropout Record Count by Period and State
0
200
400
600
800
1000
1200
1400
AR CA CO CT IL IN KS KY LA MA MD MI MN MO MS NC NH NJ NY OH OK PA RI TN TX UT WA WI WV
State
Cou
nt 02039596
Figure A.7
Interchangeability Record Count by Period and State
1
10
100
1000
10000
100000
1000000
AL AZ CO IA IN KS
KS/MO/IL/OH/MI/IN LA M
D MN MS NC NJ NY OK PA SD TX UT W
IWY
State
Cou
nt
(No
te L
og
Sca
le)
0203
9596
24

White Paper on Natural Gas Interchangeability And Non-Combustion End Use
Figure A.8
Wobbe By State 0203
1200
1250
1300
1350
1400
1450
AL AZ CO IA IN KS
KS/MO/IL
/OH/M
I/IN LA MD MN MS NC NJ NY OK PA SD TX UT WI
WY
State
Wob
be (B
tu/s
cf)
0203AvgWobbe0203MedianWobbe9596WobbeMedian
Figure A.9
Wobbe By State 9596
1200
1250
1300
1350
1400
1450
CA CO KY MT NC NJ NY OK PA SD TN TX UT WA WY
State
Wob
be (B
tu/s
cf)
9596AvgWobbe9596WobbeMedian
25

White Paper on Natural Gas Interchangeability And Non-Combustion End Use
Figure A.10
Wobbe Histogram 0203 Data
0%
10%
20%
30%
40%
50%
60%
<133
0
1330
-1340
1341
-1350
1351
-1360
1361
-1370
1371
-1380
1381
-1390
1391
-1400
1401
-1410
1411
-1420
1421
-1430
1430
+
Wobbe Interval
Perc
ent o
f Tot
al
0%
20%
40%
60%
80%
100%
120%Cum
Percent of
Total
0203 Wobbe Histogram Cum Percent of Total
Figure A.11
Wobbe By State 0203 - LDC
1200
1250
1300
1350
1400
1450
AR CA CO IL KS KY LA MD MI MN MO MS MT NC NJ NY OK PA SD TN TX UT WA WY
State
Btu
/scf 0203AvgWobbe
0203MedianWobbe9596WobbeMedian
26
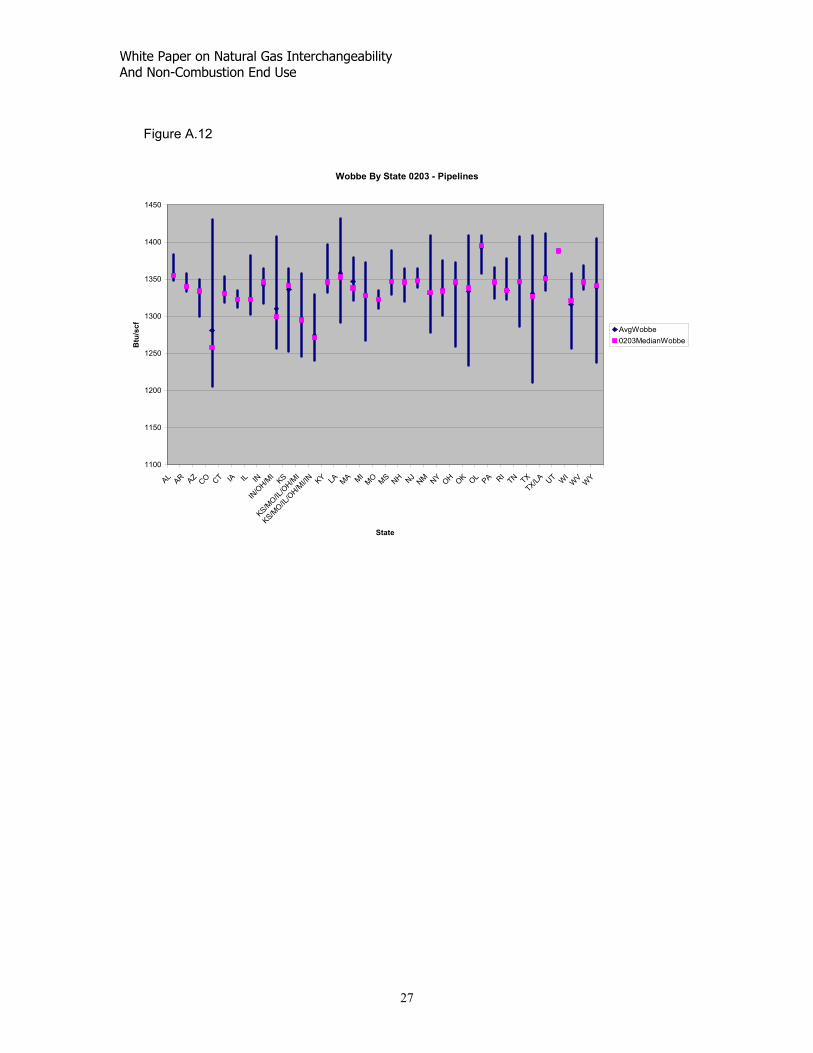
White Paper on Natural Gas Interchangeability And Non-Combustion End Use
Figure A.12
Wobbe By State 0203 - Pipelines
1100
1150
1200
1250
1300
1350
1400
1450
AL AR AZ CO CT IA IL IN
IN/O
H/MI
KS
KS/MO/IL
/OH/M
I
KS/MO/IL
/OH/M
I/IN KY LA MA MIMO MS NH NJ
NM NY OH OK OL PA RITN TX
TX/LA UT WI
WV WY
State
Btu
/scf AvgWobbe
0203MedianWobbe
27

White Paper on Natural Gas Interchangeability And Non-Combustion End Use
28

White Paper on Natural Gas Interchangeability And Non-Combustion End Use
Appendix B
Impact of Changing Supply on Natural Gas Infrastructure
Terry Boss, INGAA Bob Wilson, Keyspan
B.1 Chronology of the Development of the Natural Gas Transportation System
The original natural gas pipeline infrastructure was individual “town gas” systems that utilized gas made from coal with low heating values (≈600-700 BTU). This manufactured gas usually had larger quantities of carbon monoxide and carbon dioxide then natural gas produced from production wells. The initial building of long distance transmission pipelines from wellheads in producing states to market regions in the late 1920s permitted the gradual switchover in market areas previously served by town gas facilities to produced natural gas (≈ 970 – 1050 BTU). The particular mixture of produced natural gas transported in these pipelines was a function of the supply coming from the regional basins that served that particular market. As the natural gas market grew, additional supplies were needed and in some cases, additional pipelines were built to connect these growing markets to other supply regions resulting in a more diverse supply mix. To satisfy additional market peaking needs, storage fields were developed where gas was stored seasonally. In other cases, indigenous gas was liquefied (LNG) at market locations and subsequently re-gasified. Propane-air injection facilities were also installed at these market locations to handle peak usage periods. In rare circumstances, new sources of gas were provided by processing naphtha and coal. In some areas, gas was derived from biological digestion techniques (i.e. landfills, manure) and these sources were connected to the pipeline grid in the 1970’s and later. Almost all natural gas delivered to the interstate natural gas market was purchased at the wholesale level by natural gas pipeline companies during the mid 30’s to the mid 80’s and those companies controlled the quality and interchangeability of the gas delivered to the market through gas purchase contracts. These gas purchase contracts contained specifications that defined the acceptable range of inert gases, hydrocarbon liquids, water vapor and other contaminants in purchased natural gas. In some cases, these gas purchase contract specifications varied because of the particular characteristics of the supply basin that the natural gas was purchased and the competitive market. In other cases, during high market growth periods, pipeline companies would build and operate processing facilities in order to attract new supplies. Regulatory
1

White Paper on Natural Gas Interchangeability And Non-Combustion End Use
policy encouraged the purchase of sufficient gas supplies to build up reserves; hence there was a lot of flexibility on what gas to schedule for particular market conditions. The overall mixture of gas supply that was scheduled and hence the quality that was delivered to the market place was controlled by the pipeline, since they controlled the gas contracts and the scheduling of different sources of supply. This mixing of gas was described by the term “blending”. In the 1980’s the Federal Energy Commission began a restructuring of the interstate natural gas pipeline companies. Under Order 436 and 636 pipeline were instructed to abrogate gas purchase contracts and concentrate on the transportation of gas. In many cases, pipeline companies divested many of the gathering systems and processing systems that they had accumulated during the period that they were wholesalers. The responsibility for gas purchases was transferred to shippers1. As a result of restructuring of the interstate pipeline industry in the 1980s, the shippers of the gas became responsible for the quantity and quality of the gas. These shippers were required to purchase natural gas at the wellhead and then obtain transportation through pipeline systems to deliver to the gas to the market. During this regulatory restructuring process, the pipeline companies were instructed by FERC to incorporate their aggregate gas purchase quality specifications into their new gas transportation tariffs. The transportation quality specifications incorporated in pipeline tariffs reflected generalized (i.e. ranges, limits) gas purchase specifications in place at that time of restructuring. As such, the limits or ranges did not reflect the average quality of gas delivered to the market, but more, the minimum or maximum limits that would be accepted into the system. The term “pipeline quality gas” is used to describe the quality of natural gas that is accepted to be transported into the interstate pipeline system and is defined via the pipeline tariff. Since the interstate pipeline companies had originally developed their gas purchase specifications based on the particular supply basin characteristics that the pipelines connected to and processing and liquid handling equipment in place, the tariff specifications varied from pipeline to pipeline. During the late 1970’s the importation of liquefied natural gas (LNG) began, but as prices for domestic gas moderated delivery, of this imported LNG focused on the Northeast U.S. LNG was introduced at the market end of the natural gas transportation system. In many other cases, domestic gas was liquefied locally and then vaporized during peak usage periods. During the decades of the 80s and 90s this LNG was primarily used in the market areas through the use of demand peak shaving facilities during winter periods. In some market areas, these LNG sources can supply up 40% of the market needs for short term supply. 1 Local distribution companies, marketers, producers, industrial users and electric generators
2

White Paper on Natural Gas Interchangeability And Non-Combustion End Use
Presently, a small percentage of the market is served by alternative gas sources such as synthetic natural gas (SNG), or propane-air injection systems that are operated by LDCs, although the percentage of synthetic gas that a particular customer will see can vary significantly due to the market peak shaving characteristics of these sources of gas supply. B.2 Characteristics of the Gas Transmission System and the Effects of Interchangeability of Gas The principal natural gas infrastructure consists of gathering systems, transmission systems and distribution systems. In general, the pipeline system accepts a wide range of natural gas. Gathering systems are designed and operated to accept natural gas with some liquid hydrocarbons and impurities. Gas transmission and distribution pipelines are designed and operated to accept natural gas with the impurities and hydrocarbon liquids removed from the system. The following sections will describe in detail the effects of interchangeability of natural gas on particular components of the natural gas transmission and distribution infrastructure.
B.2.1 Operational Characteristics In general, there are no major differences in the operation of a pipeline system for the range of natural gas compositions being discussed in this paper. It is assumed for this range of natural gases that the temperature and pressure of the pipeline transportation system is operated normally to prevent liquid dropout, rather than operating in liquid phase2. In the case of LNG, it is assumed that the LNG is re-vaporized and heated to “normal” pipeline temperatures before being put into the pipeline, so that it does not affect the fracture characteristics3 of the steel. There are efficiency advantages4 with natural gas with a higher heating value (e.g. LNG), because every volume of cubic ft of natural gas transported in a pipeline has more energy per cubic foot. The efficiency gain is a ratio of the higher heating values of the tow products being compared. This will result in more “real” pipeline capacity during peak periods and some savings in fuel efficiency of compressors.
2 PR-3-42 Materials of Construction for Use in An LNG Pipeline; Battelle, 1968 3 PR-3-9113 Fracture Control Technology For Natural Gas Pipelines; Battelle, 1993 4 NB 13 Steady Flow in Gas Pipelines (IGT#10); IGT; 1970
3
White Paper on Natural Gas Interchangeability And Non-Combustion End Use
B.2.2 Pipe Most natural gas transmission pipelines are made of steel and pipeline steel is sensitive to higher levels of hydrogen in natural gas5, which can cause blisters or cracks in the pipe. Depending on the metallurgy of the pipe, some steel6 is more sensitive than others. The range of hydrocarbon constituents being discussed in this paper does not cause deterioration in the steel material. The injection of inert7 gases (combustion inerts) into the gasified LNG in order to lower the Wobbe number (i.e. improve the interchangeability) has been utilized (nitrogen and air) in the past and is anticipated to be used in the future. There are tradeoffs on the performance of steel pipe depending on the inert gas used:
• Nitrogen (N2) does not appear to have any affect on pipelines and it is a common constituent of domestic natural gas.
• Oxygen (O2) has aggressive internal corrosion characteristics when paired
with water. The few cases where oxygen has been injected into the system to lower the Wobbe number, it is injected after locations where water may be inadvertently present in the piping systems (i.e. storage fields).
• Carbon dioxide (CO2) can be an aggressive corrosion agent8 when
combined with water. The presence of CO2 in natural gas has been identified as a key contributor9 to several major pipeline safety accidents in natural gas storage fields.
Also, pipeline steel is sensitive to corrosion due to the presence of CO2 and O2 in the presence of water. This can occur in storage field piping or during conditions where dehydration equipment fails to operate. Some older transmission pipes are connected with mechanical couplings which have elastomers10 which are sensitive to liquid hydrocarbon content. Presence of liquid hydrocarbons in some cases cause swelling of the some elastomers.
5 PR-140-105 Composition Characterization of Hydrogen Cracking in Line Pipe Materials; Welding Institute of Canada, 1980 6 PR-252-9605 Recommended Practice for Sour-Service Piping Components; Metallurgical Consultants, Inc., 1997 7 The term inert refers to its combustion characteristics, rather than its corrosion characteristics 8 PR-15-9916 Interdependent Effects of Bacteria, Gas Composition, and Water Chemistry on Internal Corrosion of Steel Pipelines; Southwest Research Institute, 2002 9 PR-15-9712 Effects of Water Chemistry on Internal Corrosion of Steel Pipelines; Southwest Research Institute, 2000 10 Oil and Gas Industry Seals and Sealing - Success and Failure; Daniel L. Hertz, Jr., Seals Eastern, Inc., 1996,
4
White Paper on Natural Gas Interchangeability And Non-Combustion End Use
Distribution piping is made of steel, cast iron, various types of plastic and copper. Performance of the steel is the same as transmission piping. Heavier hydrocarbon constituents in gaseous phase as discussed in this paper (components up to and including C6) do not materially affect plastic pipe. Cast iron has the same characteristics as steel as discussed above. Much like plastic components, copper should not be materially impacted considering the nature of the hydrocarbon constituents discussed in this paper. However, while the materials of construction of pipe itself should not be impacted by gas composition variations discussed in this paper, compositional changes and related impacts to pipe joint seals, gasket materials and couplings are somewhat less known. More specifically, there has been some evidence that compositional changes associated with switching to a leaner gas supply over time may induce small dimensional changes in some gasketing and seal materials when compared to original installation. Additional research in this area will be necessary to better understand this potential phenomenon. B.2.3 Valves In general valves are constructed of the same material as the pipe mentioned above and would exhibit similar behavior. Seals utilized in this equipment are similar to what is used in controls and instrumentation. Generally, there are two types of elastomers, butyl rubber and vitron type materials. The performance of these materials is not expected to vary substantially based on the interchangeability range discussed here, however additional research will be needed to confirm this conclusion and to better understand the long term effects of leaner supply compositions on gasket and seal materials that have been traditionally exposed to compositions with hydrocarbon constituents greater than C4. B.2.4 Controls and Instrumentation Many controls used in transmission and distribution systems are made of the same materials as pipe and valves. In some cases “pot metal” and aluminum is used. No issues are expected with the range of interchangeability is expected. Certain type of instrumentation is affected by different constituents such moisture and sulfur analyzers but these fall outside the ranges that are being discussed in this paper. Of course, the change in constituents will cause a change in some basic properties and if used in a calculation (i.e. heating value) it must be accounted. There does not appear to be any significant issues with the type of equipment that is used to determine the heating value (i.e. calorimeter, chromatograph) of
5

White Paper on Natural Gas Interchangeability And Non-Combustion End Use
natural gas with the range of expected values. However, calibration gas associated with these instruments may need to be adjusted to better account for compositions actually being measured. As with the potential abovementioned issues with seal and gasket materials, additional research is needed to better understand the long term impact of “hydrocarbon lean” supplies will have on gaskets and seals that have been “conditioned” by richer hydrocarbon supplies through C6+. B.2.5 Measurement Generally, measurement devices for the purpose of determining the commercial value of gas by measuring the volume of gas and calibrating it with the heat content of the gas moved. Orifice meters and turbine meters that are used in transmission and distribution systems do not seem to be affected by the range of gases that are discussed in this paper. Positive displacement meters used in distribution service are not affected either by the constituents being discussed. The main measurement issue is the level of accuracy needed in correlating the measurement of the constituents of the gas (i.e. heating value) with the quantity of gas measured (mcf). This can be done on a continuous basis, resulting in high accuracy, or averaged by using frequency based gas samples (sampling bottles). Finally, periodic spot samples (based on location and timing) of heating value can be used to approximate the heating value for a wide geographic distribution area. However the issue of measurement may have significant impacts on LDC’s and end users. Most custody transfer locations (“delivery points”) utilize energy measurement techniques (chromatography) for accounting purposes. LDC’s that have multiple pipeline feeds into their systems establish “therm zones” or calculated energy flow factors to properly bill customers. As a result of compositional changes associated with the interchangeability process, these therm zones may shift requiring additional hardware and operating costs (additional chromatography measurement instrumentation) to properly establish real time shifts for billing purposes. If measure compensation is not fully understood and adequately measured, increases in lost and unaccounted for gas (LUF) may occur. In addition, residential meters may also be impacted by hydrocarbon lean supplies relative to historically acceptable hydrocarbon rich supplies. Materials of construction of gas meters, specifically residential diaphragm meters may be impacted similar to the potential effects discussed with seals and gaskets.
6

White Paper on Natural Gas Interchangeability And Non-Combustion End Use
B.2.6 Gas Heaters Natural gas Heaters either water bath or air to air heat exchangers are prominent in both the transmission and distribution systems. These units are typically atmospheric burners and do not have emission controls. In certain states emission controls are needed due to permitting requirements. The issues with air emissions should be in the same category as the “atmospheric burners” discussed later in this report. However, as with commercial and industrial combustion applications, additional research is needed to better understand the effects of varying compositions have on these burner control systems, combustion chambers and other hardware associated with this equipment. B.2.7 Dehydration Facilities Natural gas transmission and distribution companies utilize natural gas dehydration at storage facilities when natural gas is withdrawn from those fields. These facilities are typically either glycol dehydration or sorbent bead technology. Neither of these technologies is affected by the range of constituents that are discussed in this paper. B.2.8 Gas Processing In some cases, additional gas processing to remove CO2 is conducted by transmission companies. There appears to be no problems with those processes by the range of constituents being discussed in this paper. B.2.9 Gas Compressors Reciprocating and centrifugal compressors are designed to compress certain ranges natural gas. The ranges of constituents of natural gas being discussed in this paper appear to not materially affect the capability of these units; however these effects must be evaluated on an individual basis to establish operability and efficiency impacts due to potential changes in the physical properties of the gas being compressed. While the higher range of heating values of gas with higher ethane and propane content will increases the overall amount of heat content transported, the higher molecular weight of the gas will reduce the volumetric efficiency compressor. Gasket and seal materials may also exhibit long term impacts associated with the transition to leaner supplies relative to historically acceptable richer supplies.
7
White Paper on Natural Gas Interchangeability And Non-Combustion End Use
B.2.9.1 Reciprocating Gas Compressor Drivers – Environmental Impacts Reciprocating compressors utilize natural gas powered reciprocating engines. These units are more typically two-cycle engines (as compared to four-cycle engines). These units can be naturally aspirated or utilize super or turbo charging. Typically the larger units utilize fuel injection rather that carburetion. Recently, state and federal permitting requirements have put limitations on the amount of carbon monoxide (CO) and nitrogen oxides (NOx). In some cases, catalytic converters are utilized on four-cycle units to reduce CO. Catalytic converters or ammonia slip injection are rarely used to reduce NOx reductions on 2 cycle engines. The concentration of CO is a function of the air/fuel ratio and it does not appear the range of constituent values being discussed in this paper will have a material affect on CO emissions. NOx emissions are a function of combustion temperatures. Higher combustion temperatures can occur if the heating content of the fuel increases and there is not a coincident increase in the quantity of combustion air. Present engine control technology does not compensate for the change in the amount of combustion air as a result in the heating value of natural gas. This can be important if the constituents of the gas change on a periodic basis causing the heating value to change. This can cause an increase in combustion temperature resulting in higher NOx emissions. Research is being conducted at this time to determine the effects on NOx emissions of changing the fuel compositions. Present permits allow the testing of the individual units under controlled conditions. As of yet, these units are not subject to continuous emission monitoring which would detect changes in NOx emissions due to fuel composition changes. The introduction of higher amounts of ethane and propane may cause increases in detonation under high load conditions, since the ignition temperature of these constituents is lower than methane, the primary constituents in natural gas. New combustion head designs are based on modified ignition and compression ignition designs that may show different characteristics. B.2.9.2 Turbine Gas Generator Drivers for Centrifugal Compressors The performance of these units should be very similar to the turbines that are used to power electric generation, except gas compressor operation usually entails operating at varied speed ranges as compared to units attached to electric generators. Permitting for natural gas compressors at this time does not require the use of continuous emission monitoring and therefore emission
8

White Paper on Natural Gas Interchangeability And Non-Combustion End Use
transients due fuel changes has not been monitored. A research program has been initiated to determine the effects. The introduction of higher amounts of ethane and propane will not cause detonation conditions as in reciprocating engines due to the continuous burning characteristics of gas turbines.
B.2.10 Odorization Odorization involves the injection of trace amounts of mercapatan compounds into the gas stream. While there has been reports of masking of the odor due to higher levels of hydrocarbons in the natural gas stream, the level of constituents being discussed in this paper do not appear to present a problem. However, each odorization system needs to be evaluated individually to assess potential local impacts on current odorization practices. B.3 Safety Issues Ethane and propane have different physical characteristics than methane. Both of these gases are heavier than air and equipment and procedures designed for systems with natural gas composed primarily of methane may vary. Equipment such as gas detectors located in the ceilings of compressor stations will probably not be affected since there will be a significant amount of methane in any leak that occurs. However, the lower and upper flammability limits of a gas mixture are dependent on composition and the effects of compositional changes will need to be evaluated locally. Blowdowns (exhausting gas to the atmosphere) from the pipeline may be partially affected if there is stratification of the methane, ethane and propane constituents. The change to incorporate these constituents will probably require the modification of the operating and emergency procedures. B.4 SNG A limited number of SNG Plants are currently in operation in the U.S. Impacts to these facilities are feedstock related and directly impact the production of hydrogen if hydroreforming is included in the particular process, typically utilized for hydrodesulfurization processes. Each facility will need to be evaluated on an individual basis to assess specific impacts.
9

White Paper on Natural Gas Interchangeability And Non-Combustion End Use
B.5 Impacts on Local Peakshaving Facilities North America has a large base of residential and commercial customers that use more gas in the winter than summer, although this load curve is flattening due to increased gas-fired power generation. Local peakshaving facilities are used throughout the country to augment pipeline supplies during temporary peak demand periods. These facilities are typically located closer to large demand centers (major urban areas) or areas of a distribution system that have limited pipeline supplies. These facilities consist of LNG liquefaction plants & associated storage, LNG satellite distribution plants and propane-air plants. The objective of this section is to address the impacts regasified Btu stabilized LNG imports and unprocessed domestic supplies may have on liquefaction plant operations and the interchangeability issues associated with propane-air when combined with regasified LNG Btu adjusted gas. The majority of local peakshaving supply is provided by LNG liquefaction plants which generally consist of between one and four billion cubic feet (Bcf) of storage. Pipeline supplies are liquefied during warmer months (about 200 days per year) and revaporized for delivery into local pipelines and distribution systems during the coldest days (usually no more than 20-40 days a year). A recent survey identified 77 active peakshaving liquefaction plants, most of which (62) are located in the United States making the U.S. by far the world leader in natural gas peakshaving liquefaction. From a regional perspective, it is not surprising that over 25% of the plants are concentrated in the Northeast. Table B.1 shows the location of peakshaving liquefaction plants by state.
10

White Paper on Natural Gas Interchangeability And Non-Combustion End Use
Table B.1 Peakshaving Liquefaction Plants by U.S. State11
State
Number of Plants
Massachusetts 6 Indiana, Tennessee 10 Georgia, Iowa, North Carolina 12 Alabama, Connecticut, Minnesota, New York, Pennsylvania
15
Maryland, Oregon, Virginia, Wisconsin 8 Alaska, Arizona, Arkansas, Delaware, Idaho, Illinois, Nebraska, Nevada, New Jersey, South Carolina, Washington
11
Total 62
More than half the plants with roughly half the liquefaction capacity were built in the five year period from 1971 – 1975. This was a period of rapidly expanding natural gas demand with resulting capacity limitations on U.S. pipelines. The drop in construction was primarily due to gas supply curtailments and the development of other peakshaving alternatives including underground storage. Construction was revived in the mid to late 1990’s and as a result, most plants were designed and constructed with a feedstock composition consistent with processed pipeline supplies during these periods. LNG peakshaving makes economic sense when the cost to deliver gas from storage is less than the cost to lease pipeline capacity to deliver the same amount of gas. The value of peakshaving is the avoided cost of pipeline transportation required to deliver the peak day gas. This benefit does not include the obvious supply security and reliability associated local supply control. As a result, distribution companies have installed over 9 Bcf/day of LNG vaporization capacity to help deal with this highly seasonal, weather sensitive load. B.5.1 Feedstock Implications on Peakshaving Liquefaction Operations LNG peakshaving plants consist of four process components including feedstock purification, liquefaction, storage and vaporization. A brief description of each component process is described below. Purification
11 LNG Source Book 2001
11

White Paper on Natural Gas Interchangeability And Non-Combustion End Use
Feedstock purification is a critical first step in the liquefaction process. Traditional feedstock impurities are removed by a variety of processes such as mole sieve adsorption and solvent absorption such as Rectisol and amine systems. These impurities include sulfur, water and carbon dioxide which may freeze at process temperatures. Liquefaction Most commercial liquefaction processes generate “heat sinks” by flashing condensed refrigerants across an expansion valve with process heat exchanges housed in a “cold box”. These processes include the Cascade Process utilizing propane, ethylene and methane in discrete “cooling circuits” as refrigerants, the SMR (single mixed refrigerant) process using multicomponent refrigerants and the PPMR (propane pre-cooled mixed refrigerant) process utilizing mixed refrigerants and a propane pre-chiller to cool the natural gas stream prior to the liquefaction process. Another important process is the open loop expansion cycle where compressed natural gas is expanded across a turboexpander which in turn drives the compressor. Low pressure expander exhaust is sent to the distribution system. In this process, approximately 80% of the feed gas is utilized in the refrigeration circuit while the remaining 20% is converted into liquid. Finally, the closed loop nitrogen recycle process where high pressure nitrogen is expanded to supply cooling similar to the turboexpander process described above. In most cases, the process gas stream is cooled down to approximately -110 to -120°F before liquefaction. Heavy hydrocarbon components are condensed out of the gas stream in this step and are reheated and removed. Otherwise, these components would precipitate out and freeze later in the process resulting in blockages in the cold box heat exchangers. Storage Liquefied natural gas is stored in insulated tanks that maintain the LNG at approximately -260°F. This liquid is constantly “boiling”, or generating vapor, due to heat leaks. The cold vapor or “boiloff gas” is either utilized in the liquefaction process when running, or delivered into the local distribution after warming. Vaporization Liquid natural gas is pumped from the tank and re-vaporized for delivery into the local distribution system.
12

White Paper on Natural Gas Interchangeability And Non-Combustion End Use
Each peak shaving liquefaction process has individual design criteria and the effectiveness of the process is highly dependent on the constituents of the feedstock. Plants are designed to handle moderate swings in feedstock composition including varying concentrations of carbon dioxide, nitrogen, water, non-methane hydrocarbons and to some degree, heavy hydrocarbons (C6+). Liquefaction process feedstock compositions that exceed original design criteria could have significant operational consequences ranging from efficiency and reliability issues through rendering a plant completely inoperable. More specifically, feedstock interchangeability of unprocessed pipeline natural gas and Btu adjusted regasified LNG imports presents a real concern for existing peak shaving liquefaction units throughout North America. The potential impacts are discussed below. B.5.2 Impacts of Unprocessed Pipeline Natural Gas Feedstock Unprocessed natural gas feedstock is typically rich in higher hydrocarbons beyond C6+. Although not typically analyzed by pipelines or LDC’s, other trace constituents in the C6+ fractions can have significant impacts on both purification and liquefaction processes. When gas is not processed to historically acceptable levels in which the vast majority of C6+ components have been reduced to low concentrations, these trace constituents increase in concentration along with the measured heavy hydrocarbons found in the C6+ fraction. Examples of these trace constituents of concern are: Cycloparaffins & Aromatics Cyclohexane Benzene(s) Methylcyclohexane Toluene Cyclopentane Xylene(s) In most cases, feedstock composition is monitored utilizing gas chromatography out to C6+. Increasing heating values and specific gravity associated with an increase in C6+ components is an indicator that unprocessed gas is present and it is likely that trace constituents concentrations are also increasing. As the temperature of the process gas flowing through the cold box decreases, these trace constituents have a tendency to freeze and “plate” out on the interior surfaces of the heat exchangers in the cold box. Heat exchangers will continue to operate but with decreased efficiency and greater pressure drops. Eventually the exchangers will become completely plugged resulting in plant shutdown. Existing plant designs accounted for the potential of historical processed gas hexane concentrations in the feedstock and engineered removal strategies at temperatures between -100°F to -120°F to avoid freezing. When domestic gas is
13

White Paper on Natural Gas Interchangeability And Non-Combustion End Use
unprocessed, heavy hydrocarbons remain in the feedstock to LNG plants and plant operations suffer. This phenomenon is best illustrated in Figure B.1 below. The gas quality trend graphically demonstrates the overwhelming impact of increases in heavy hydrocarbon concentrations and associated trace constituents on the effieiency of the liquefaction process. As the heating value of feedstock trended up, the measured values of total aromatic and cycloparaffins was found to be over five times that of historically received processed gas (from 100 parts per million (ppm) to over 500 ppm) resulting in premature exchanger fouling, inefficient operation and ultimately, plant shut down. As the trend lines in Figure B.1 show, as the heating value trends up, plant make falls off due to partial exchanger fouling. In four instances, fouling was evidently extreme and the make fell off precipitously. This clearly demonstrates the significant impact
unprocessed pipeline gas could have on peakshaving liquefaction and that pipeline gas quality and interchangeability is a major consideration for LDC’s that operate LNG peakshaving liquefaction plants.
Figure 1 LNG Liquefaction
Oct '02 thru Sept '03
1010
1015
1020
1025
1030
1035
1040
1045
1050
1055
28-O
ct-02
1-Nov
-02
12-N
ov-02
19-D
ec-02
29-D
ec-02
2-Jan
-03
31-Ja
n-03
4-Feb
-03
8-Feb
-03
21-F
eb-03
12-A
pr-03
16-A
pr-03
20-A
pr-03
24-A
pr-03
30-A
pr-03
4-May
-03
8-May
-03
12-M
ay-03
16-M
ay-03
21-M
ay-03
25-M
ay-03
29-M
ay-03
2-Jun
-03
6-Jun
-03
10-Ju
n-03
17-Ju
n-03
Date
Feed
stoc
k H
eatin
g Va
lue
(BTU
/SC
F)
0
1000
2000
3000
4000
5000
6000
7000
Plan
t Mak
e (D
TH)
BTUDTHPlant Make TrendFeedstock BTU Trend
B.5.3 Impacts of Regasified Btu Adjusted LNG Feedstock In some cases, LNG imports contain relatively high concentrations of ethane (C2) and propane(C3). To ensure that interchangeability criteria related to combustion are achieved, the LNG Terminal output is diluted with an inert gas such as nitrogen. While this output gas does not contain heavy hydrocarbons such as C6+ or carbon dioxide and thus does not impact the purification section of
14

White Paper on Natural Gas Interchangeability And Non-Combustion End Use
existing plants, it does present other challenges in both the liquefaction and storage areas of the plant. The greatest single impact is on efficiency, or “net” LNG produced. Secondary effects include the handling and disposal of excessive C2 and C3 hydrocarbon liquids that will condense out at various stages of the liquefaction process. Another serious concern is the handling of excessive nitrogen rich boiloff that will flash off in the storage systems leading to potential excess boil-off beyond original design capacity . A computer simulation was performed to quantify the overall impact of liquefying Btu stabilized LNG import feedstock. Figure B.2 highlights the simulation process. It should be noted that this simulation is not process specific and in general applies to most liquefaction processes previously cited (the open expander process is somewhat different) This simulation looks at the fundamental thermodynamic conditions across a typical LNG peakshaving liquefaction process12. The circles represent process steps including heat exchange, vapor/liquid separation and flash. Squares represent stream identification including pressure, temperature flow etc.
12 Simulation by Kryos Energy Inc.
15
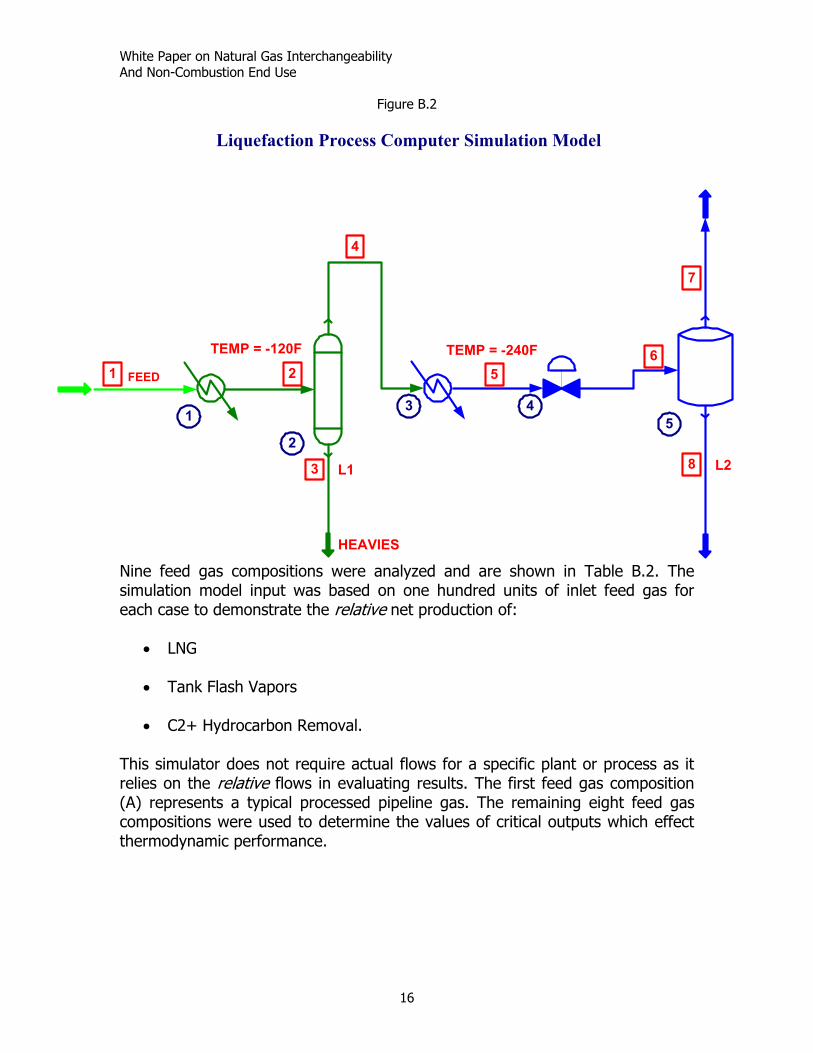
White Paper on Natural Gas Interchangeability And Non-Combustion End Use
Figure B.2
1
2
3 45
Liquefaction Process Computer Simulation Model
1 FEED 2
TEMP = -120F
3 L1
HEAVIES
4
56
7
8
TEMP = -240F
L2
Nine feed gas compositions were analyzed and are shown in Table B.2. The simulation model input was based on one hundred units of inlet feed gas for each case to demonstrate the relative net production of:
• LNG • Tank Flash Vapors
• C2+ Hydrocarbon Removal.
This simulator does not require actual flows for a specific plant or process as it relies on the relative flows in evaluating results. The first feed gas composition (A) represents a typical processed pipeline gas. The remaining eight feed gas compositions were used to determine the values of critical outputs which effect thermodynamic performance.
16

White Paper on Natural Gas Interchangeability And Non-Combustion End Use
Table B.2 Liquefaction Simulation Model Feed Gas Compositions
Feed Gas CompositionVolume %
N2 C1 C2 C3 C4
A 1.0 95.4 3.0 0.5 0.1B 1.0 94.4 4.0 0.5 0.1C 1.0 91.9 3.0 4.0 0.1D 4.0 92.4 3.0 0.5 0.1E 3.0 93.4 3.0 0.5 0.1F 2.0 94.4 3.0 0.5 0.1G 1.0 89.9 6.0 3.0 0.1H 1.0 87.9 8.0 3.0 0.1I 1.0 92.9 4.0 2.0 0.1
Each feed gas composition tabulated in Table B.2 was modeled at four different operating pressures to account for varying inlet pressures typical for the most common liquefaction technologies13. These pressures include 200, 300, 400 and 500 psig respectively. The data confirms suspected impacts identified earlier and suggests the following:
• In all cases lower Net LNG Production • Increased C2+ in feedstock results in hydrocarbon dropout
• Increased Nitrogen in Feedstock Results in Increased Tank Flash.
For all cases considered in the model, C2+ dropout was fixed to occur at -120°F and the LNG product sub cooled to -240°F prior to delivery to LNG storage. Tank boiloff consists of vapors from LNG flash and does not include tank heat leak due to variations in tank design, capacity and inventory. This model concentrates on feed gas composition impacts in LNG processing. The simulation clearly demonstrates the sensitivity of gas composition to the overall liquefaction process. The majority of plants designed and constructed to meet historical gas composition feedstock criteria will not be able to make process adjustments to accommodate either unprocessed pipeline gas or Btu stabilized LNG imports as feedstock. Plants would require extensive redesign and substantial capital investment (with little or no direct benefit to LNG production) to address the following common issues:
13 Flash Simulation using ChemCad & Peng Robinson EOS
17

White Paper on Natural Gas Interchangeability And Non-Combustion End Use
• Increased removal and collection of condensed C2+ components • Removal of increased concentrations of aromatics and cycloparaffins
• Increased storage system boil off handling including handling/blending of
low Btu nitrogen enriched boil off gases. Further compounding the problem is the possibility of receiving intermittent “slugs” of Btu stabilized LNG imports as feedstock. Significant variations in feedstock composition may result in varying the density of the LNG product. If storage systems are not equipped for recirculation of liquids, density stratification may evolve over time resulting in potential “roll over” of the LNG product in the tank which could cause significant damage to the tank and storage systems. This is especially true if the storage system only allows liquid to enter the bottom of the tank and the tank is nearly full with minimal ullage. B.6 Impacts on Propane-Air Peakshaving Operations Liquid Propane-Air (LPA) Plants for peakshaving operations have been in use since the mid-1930’s. These Plants use liquefied petroleum gas (LPG), a mixture of C3 and C4 hydrocarbons, as the feedstock. A typical Plant consists of liquid receiving, storage, transfer and vaporization, air compression and propane-air mixing. This process involves blending a mixture of approximately 55% by volume propane with 45% by volume air into the natural gas distribution system. Blending is a primary concern with this type of peak shaving operation making the pipeline natural gas composition receiving this peaking supply a critical variable in assuring interchangeability. Due to significant differences in the chemical properties and combustion characteristics of LPA from natural gas, accurate and reliable blending becomes an important function for achieving satisfactory gas interchangeability. Depending on local distribution company requirements and pipeline natural gas quality, LPA having 50%-60% propane blended with 40%-70% natural gas could provide satisfactory gas interchangeability. Operating experience, equipment testing and classical interchangeability criteria such as Wobbe, Knoy, Weaver and AGA Indices, have been used to develop guidelines for determining gas interchangeability. Figure B.3 highlights the general interchangeability guidelines used by many companies, however, it should be noted that the criteria is subject to change based on specific pipeline gas composition.
18

White Paper on Natural Gas Interchangeability And Non-Combustion End Use
Figure B.3
The potential impacts associated with propane-air peakshaving and Btu stabilized LNG are directly related to blending. In summary, the increased ethane and propane concentrations found in some LNG imports compound the blending and mixing problem and in some cases, can result in blends beyond the operating range of interchangeability existing blending equipment is designed to handle. This can result in significant “yellow tipping” as compared to blending with more traditional pipeline supplies.
19

White Paper on Natural Gas Interchangeability And Non-Combustion End Use
20

White Paper on Natural Gas Interchangeability And Non-Combustion End Use
Appendix C Changing Supply Impacts on End-Use (Burner Tip Combustion Issues)
Ted Willams, AGA and Bob Wilson, Keyspan, Coordinators
While the issues associated with gas interchangeability are broad, including gas supply and transportation issues, gas interchangeability is by definition a funda-mentally technical issue of end use. Traditionally and in most applications, gas interchangeability is associated with combustion applications. The challenge faced in considering broad aspects of interchangeability is identification of com-mon requirements of end use combustion and identifying, based on these com-monalities and potential unique requirements, efficient and equitable means of addressing end use requirements without imposing constraints on gas supply. This appendix summarizes combustion end use considerations discussed by the Work Group and captured by Work Group stakeholders bringing expertise and unique perspectives to the discussion of gas interchangeability. This discussion is limited to the range of stakeholders actively participating in the Work Group and the drafting of the Gas Interchangeability White Paper. Therefore, not all end user interests are covered by this appendix.
1
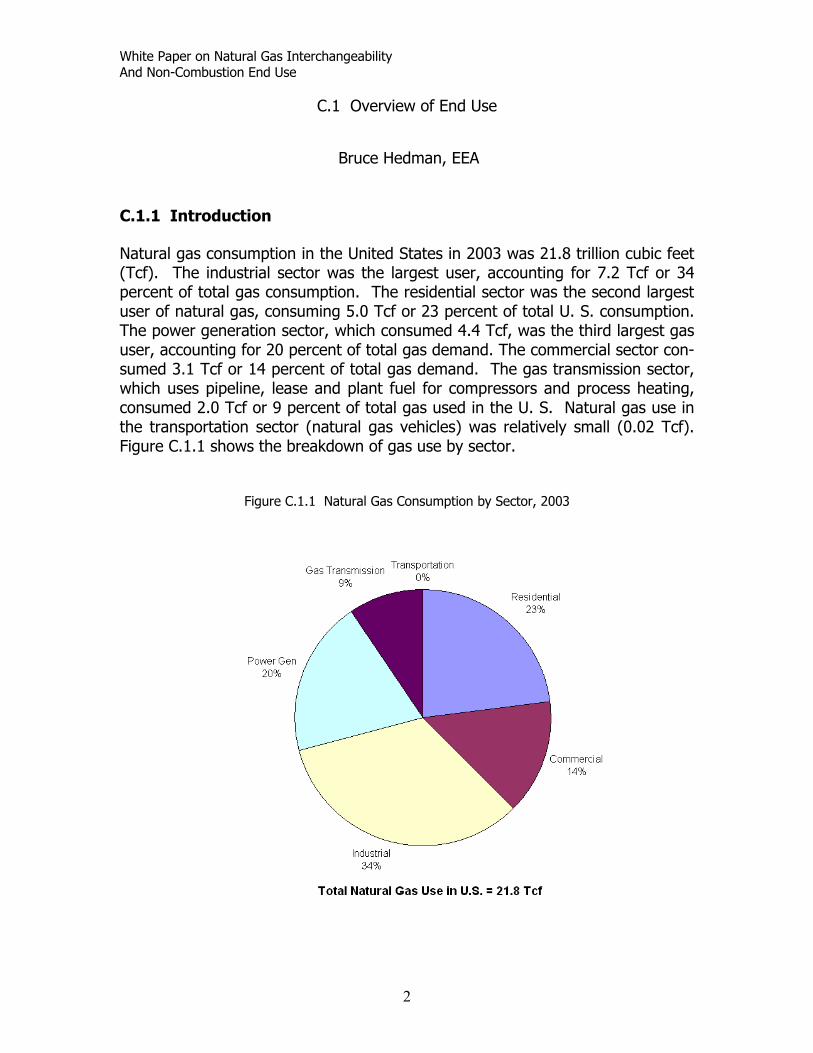
White Paper on Natural Gas Interchangeability And Non-Combustion End Use
C.1 Overview of End Use
Bruce Hedman, EEA
C.1.1 Introduction Natural gas consumption in the United States in 2003 was 21.8 trillion cubic feet (Tcf). The industrial sector was the largest user, accounting for 7.2 Tcf or 34 percent of total gas consumption. The residential sector was the second largest user of natural gas, consuming 5.0 Tcf or 23 percent of total U. S. consumption. The power generation sector, which consumed 4.4 Tcf, was the third largest gas user, accounting for 20 percent of total gas demand. The commercial sector con-sumed 3.1 Tcf or 14 percent of total gas demand. The gas transmission sector, which uses pipeline, lease and plant fuel for compressors and process heating, consumed 2.0 Tcf or 9 percent of total gas used in the U. S. Natural gas use in the transportation sector (natural gas vehicles) was relatively small (0.02 Tcf). Figure C.1.1 shows the breakdown of gas use by sector.
Figure C.1.1 Natural Gas Consumption by Sector, 2003
2
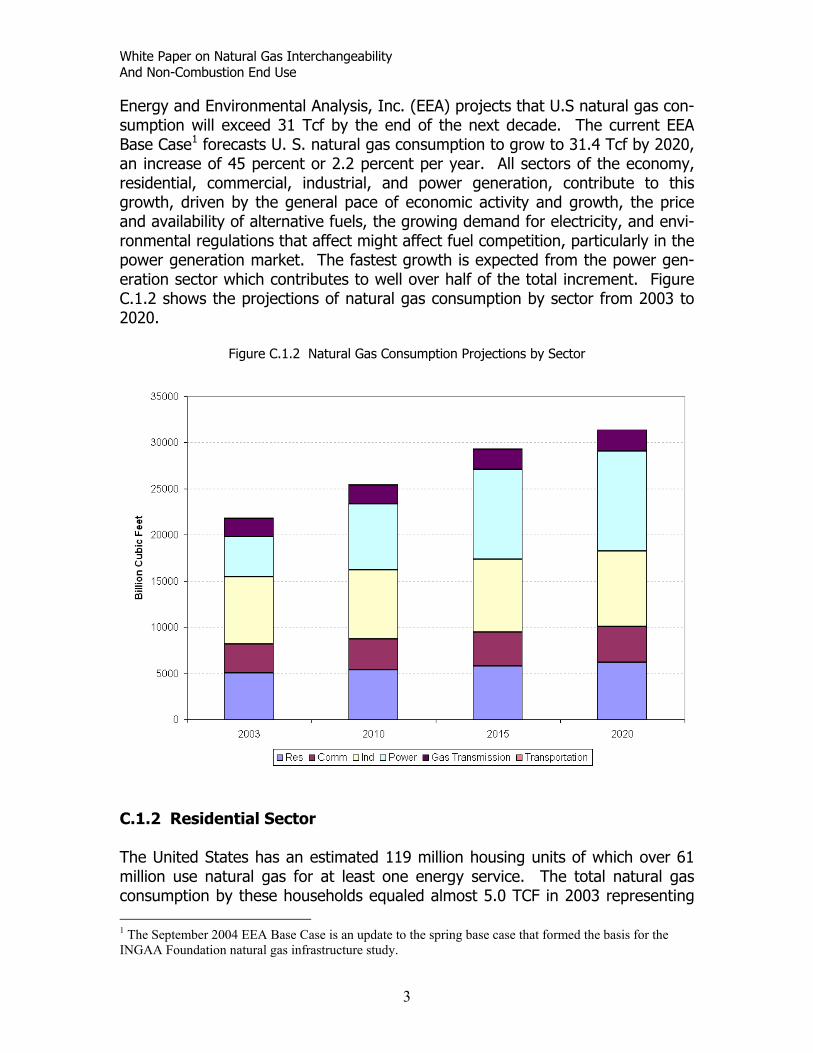
White Paper on Natural Gas Interchangeability And Non-Combustion End Use
Energy and Environmental Analysis, Inc. (EEA) projects that U.S natural gas con-sumption will exceed 31 Tcf by the end of the next decade. The current EEA Base Case1 forecasts U. S. natural gas consumption to grow to 31.4 Tcf by 2020, an increase of 45 percent or 2.2 percent per year. All sectors of the economy, residential, commercial, industrial, and power generation, contribute to this growth, driven by the general pace of economic activity and growth, the price and availability of alternative fuels, the growing demand for electricity, and envi-ronmental regulations that affect might affect fuel competition, particularly in the power generation market. The fastest growth is expected from the power gen-eration sector which contributes to well over half of the total increment. Figure C.1.2 shows the projections of natural gas consumption by sector from 2003 to 2020.
Figure C.1.2 Natural Gas Consumption Projections by Sector
.1.2 Residential Sector
he United States has an estimated 119 million housing units of which over 61
C Tmillion use natural gas for at least one energy service. The total natural gas consumption by these households equaled almost 5.0 TCF in 2003 representing
3
1 The September 2004 EEA Base Case is an update to the spring base case that formed the basis for the INGAA Foundation natural gas infrastructure study.

White Paper on Natural Gas Interchangeability And Non-Combustion End Use
23 percent of total natural gas consumption in the country. Despite the in-creasing size (in terms of square footage) of newer houses, average gas use per household is declining because of improved insulation and more energy efficient equipment. The primary uses of natural gas in the residential sector are space heating, water
Figure C.1.3 Residential Natural Gas Consumption by End-Use, 2003
ater heating is the second most important residential use of natural gas, ac-ounting for 26 percent of total gas use in the residential sector. Unlike space
heating, cooking, clothes drying, and other uses (that include space cooling, and hearth products) (Figure C.1.3.). The largest use of natural gas is space heating, accounting for 64 percent of total natural gas use in the sector. Natural gas dominates the space heating market in the U. S. residential sector. In recent years gas has captured more than 60 percent of the space heating market for new single family homes and will continue to dominate this market in the future. In addition, the percentage of natural gas heating in new multi-family construc-tion increased slightly in recent years.
Wcheating, water heating is generally not weather-sensitive. Nevertheless, the market penetration of natural gas water heating is similar to that of space heat-
4

White Paper on Natural Gas Interchangeability And Non-Combustion End Use
ing; natural gas is currently used for over two-thirds of all residential water heat-ing requirements. Cooking is the third largest residential use of natural gas, accounting for 4 per-
igure C.1.4 shows the regional breakdown of residential natural gas use in the
Figure C.1.4 Residential Natural Gas Consumption by Region, 2003
opulation growth and housing construction will largely determine the long-term rowth in residential gas consumption, tempered by contributing factors such as
conservation, efficiency and technology changes. Natural gas consumption and
cent of total natural gas consumption in the residential sector. However, market shares of both ovens and ranges are dominated by electric appliances. Natural gas is also used for clothes drying; this end-use represents one percent of total residential gas use. Other end-use, which includes space cooling and hearth products, account for the remaining consumption (5 percent). FU. S. The East North Central (ENC) region consumes the largest amount of natural gas, representing about 26 percent of total residential natural gas con-sumption. The second largest consuming region is the Middle Atlantic (MATL), accounting for 19 percent. The third largest consuming region West North Cen-tral (WNC) accounted for 14 percent.
Pg
5

White Paper on Natural Gas Interchangeability And Non-Combustion End Use
expenditures are also positively correlated with household income: the higher the household income, the more energy the household consumes energy. The higher use and related expenditures is reflected in the typically larger homes owned by higher-income families, requiring more heating and additional uses for natural gas. Figure C.1.5 shows the projected use of natural gas in the residential sector by end-use, from 2003 to 2020. Overall residential natural gas consumption is pro-
cted to grow at a modest rate of 1.3 percent per year. Gas use for space heat-
s use is the West South Central SC) region, which is estimated to grow annually by 1.8 percent. The Moun-
jeing is expected to grow by 0.7 percent per year, while gas use for water heating is projected to increase annually by 1.7 percent. Natural gas consumption pro-jections for clothes drying and cooking are projected to grow by 1.8 percent and 1.5 percent per year, respectively. The fastest growth is expected for “other use”, growing annually at a rate of 4.3 percent. This is driven by the continued popularity of hearth products in residential units. Figure C.1.6 shows residential natural gas use projections by region. The region with the largest projected growth in residential ga(Wtain (MT) region reports the second largest growth, at 1.7 percent per year. The East North Central (ENC) region, which currently consumes the largest amount of residential natural gas, is expected to grow at 1.1 percent per year.
Figure C.1.5 Residential Natural Gas Consumption Projections by End-Use
6
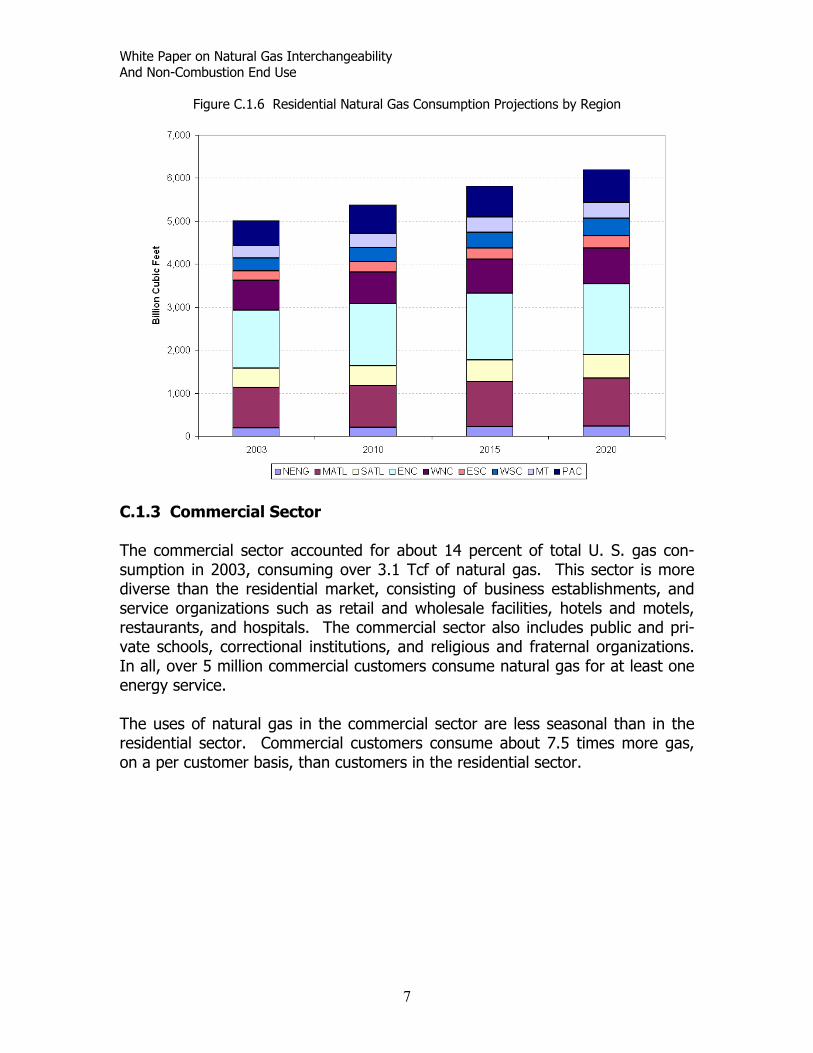
White Paper on Natural Gas Interchangeability And Non-Combustion End Use
Figure C.1.6 Residential Natural Gas Consumption Projections by Region
C.1.3 Commercial Sector
he commercial sector accounted for about 14 percent of total U. S. gas con-
he uses of natural gas in the commercial sector are less seasonal than in the
Tsumption in 2003, consuming over 3.1 Tcf of natural gas. This sector is more diverse than the residential market, consisting of business establishments, and service organizations such as retail and wholesale facilities, hotels and motels, restaurants, and hospitals. The commercial sector also includes public and pri-vate schools, correctional institutions, and religious and fraternal organizations. In all, over 5 million commercial customers consume natural gas for at least one energy service. Tresidential sector. Commercial customers consume about 7.5 times more gas, on a per customer basis, than customers in the residential sector.
7
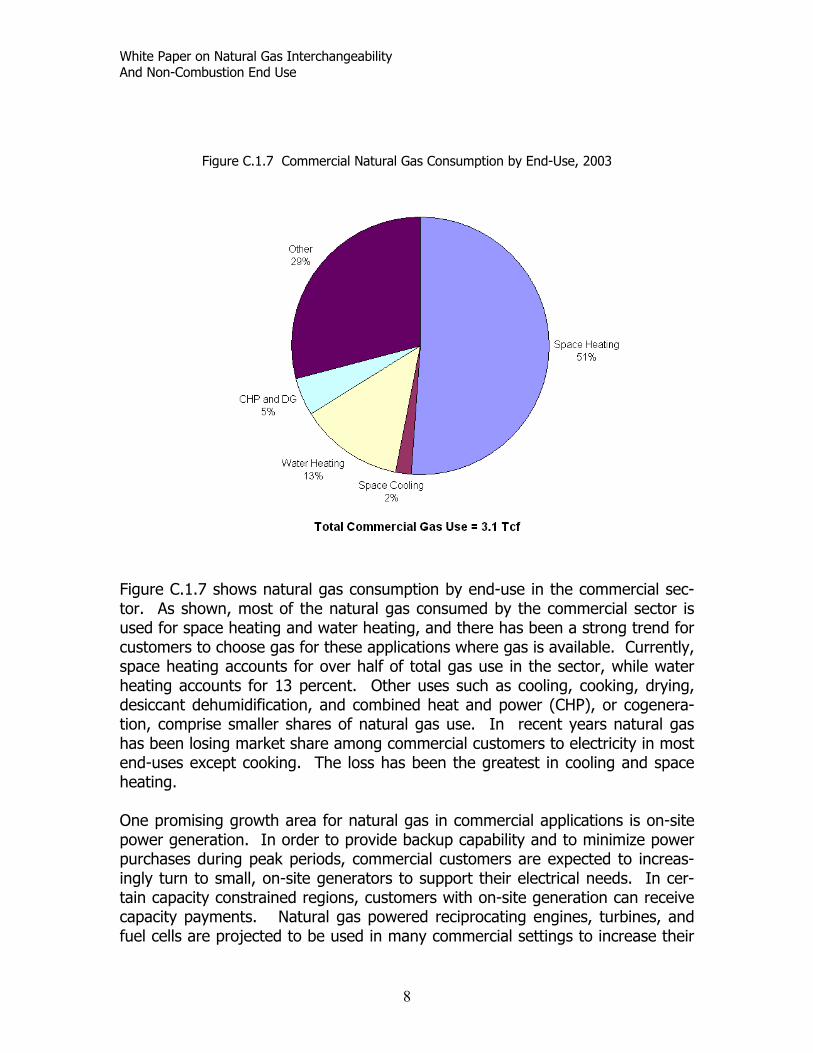
White Paper on Natural Gas Interchangeability And Non-Combustion End Use
Figure C.1.7 Commercial Natural Gas Consumption by End-Use, 2003
Figure C.1. ercial sec-r. As shown, most of the natural gas consumed by the commercial sector is
ising growth area for natural gas in commercial applications is on-site ower generation. In order to provide backup capability and to minimize power
7 shows natural gas consumption by end-use in the comm
toused for space heating and water heating, and there has been a strong trend for customers to choose gas for these applications where gas is available. Currently, space heating accounts for over half of total gas use in the sector, while water heating accounts for 13 percent. Other uses such as cooling, cooking, drying, desiccant dehumidification, and combined heat and power (CHP), or cogenera-tion, comprise smaller shares of natural gas use. In recent years natural gas has been losing market share among commercial customers to electricity in most end-uses except cooking. The loss has been the greatest in cooling and space heating. One promppurchases during peak periods, commercial customers are expected to increas-ingly turn to small, on-site generators to support their electrical needs. In cer-tain capacity constrained regions, customers with on-site generation can receive capacity payments. Natural gas powered reciprocating engines, turbines, and fuel cells are projected to be used in many commercial settings to increase their
8

White Paper on Natural Gas Interchangeability And Non-Combustion End Use
independence from the utility grid, and reduce the possibility of power disruption and inconsistent power quality. CHP is already penetrating certain commercial markets. Hospitals, universities, airports and other establishments with appropri-ate thermal and electrical load, including those that cannot afford power failure, are becoming major users of CHP.
Figure C.1.8 – Commercial Natural Gas Consumption by Region, 2003
S. The figu ddle Atlan-c (MATL) and East North Central (ENC) regions. These two regions account for
from 3.1 Tcf to 3.9 Tcf be-een 2003 and 2020, or 1.3 percent per year. Figure 9 shows the projected
Figure C.1.8 shows the regional representation of commercial gas use in the U.
re shows that the largest consumption levels are in the Miti42 percent of total commercial gas use. Other major consuming regions are the West North Central (WNC) and South Atlantic (SATL) regions. These two regions represent 25 percent of total commercial gas use. Driven by general economic activity and population growth, , commercial sector gas consumption in the U. S. is projected to growtwincrease by end-use. Space heating and water heating are expected to grow at a relatively modest rate of 0.9 and 1.2 percent per year, respectively. Space cooling and other uses are projected to grow at annual rates of 1.6 percent and 1.5 percent, respectively. The fastest growing end-use is CHP and other forms of distributed generation, which are projected to grow at a robust rate of 3.3 percent annually.
9
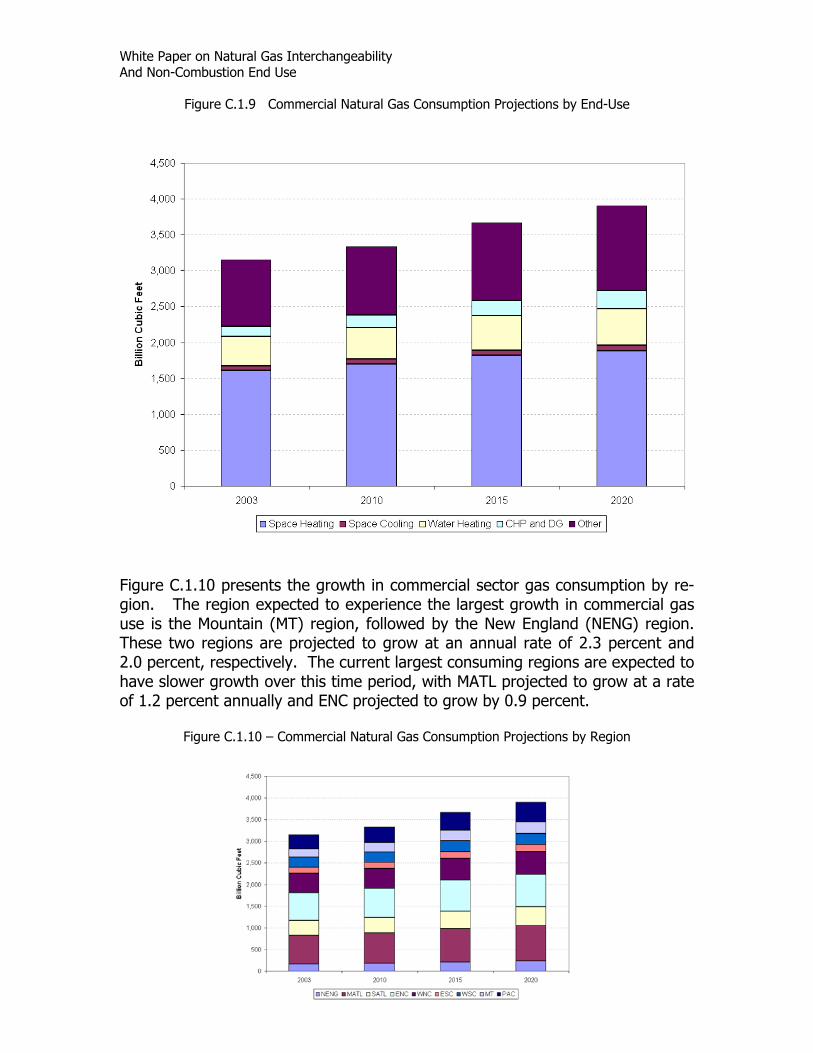
White Paper on Natural Gas Interchangeability And Non-Combustion End Use
Figure C.1.9 Commercial Natural Gas Consumption Projections by End-Use
se is the Mountain (MT) region, followed by the New England (NENG) region. hese two regions are projected to grow at an annual rate of 2.3 percent and
Figure C.1.10 presents the growth in commercial sector gas consumption by re-gion. The region expected to experience the largest growth in commercial gas uT2.0 percent, respectively. The current largest consuming regions are expected to have slower growth over this time period, with MATL projected to grow at a rate of 1.2 percent annually and ENC projected to grow by 0.9 percent.
Figure C.1.10 – Commercial Natural Gas Consumption Projections by Region
10

White Paper on Natural Gas Interchangeability And Non-Combustion End Use
C.1.3 Industrial Sector Over 210,000 industrial gas users consumed 7.2 Tcf of natural gas in 2003, rep-resenting one-third of total U. S. gas consumption. Industrial gas use is com-prised of five basic end-use components: 1) boilers used to generate process steam, 2) direct fired process heaters and furnaces, 3) CHP or cogeneration sys-tems producing both electricity and steam, 4) feedstock to manufacture com-modity chemicals such as ammonia, methanol, and hydrogen, and 5) other uses comprised of direct space heating and non-CHP power generation. Figure C.1.11 presents the breakdown of industrial natural gas demand by end-use category. As shown in the figure, the primary use of natural gas in industry is to fuel steam generating equipment including standalone boilers and CHP sys-
nt) of natural gas used in industry is for this purpose: and another 15 percent through non-boiler CHP. De-
e ground in
tems. Almost half (49 perce4 percent through boilers 3
spite fuel oil and coal maintaining their competitiveness and despite increased use of byproduct fuels, natural gas has expanded its role as the dominant fuel source for both boilers and CHP equipment. Natural gas is also the primary energy source for direct process heating in the sector, accounting for over half of total process heat requirements. Natural gas used for process heating represents over one-third (34 percent) of total industrial
s demand. Although electrotechnologies have slowly gained somgacertain applications, natural gas has maintained its position as the preferred fuel for most clean, direct thermal heating applications.
Figure C.1.11 – Industrial Natural Gas Consumption by End-Use, 2003
11
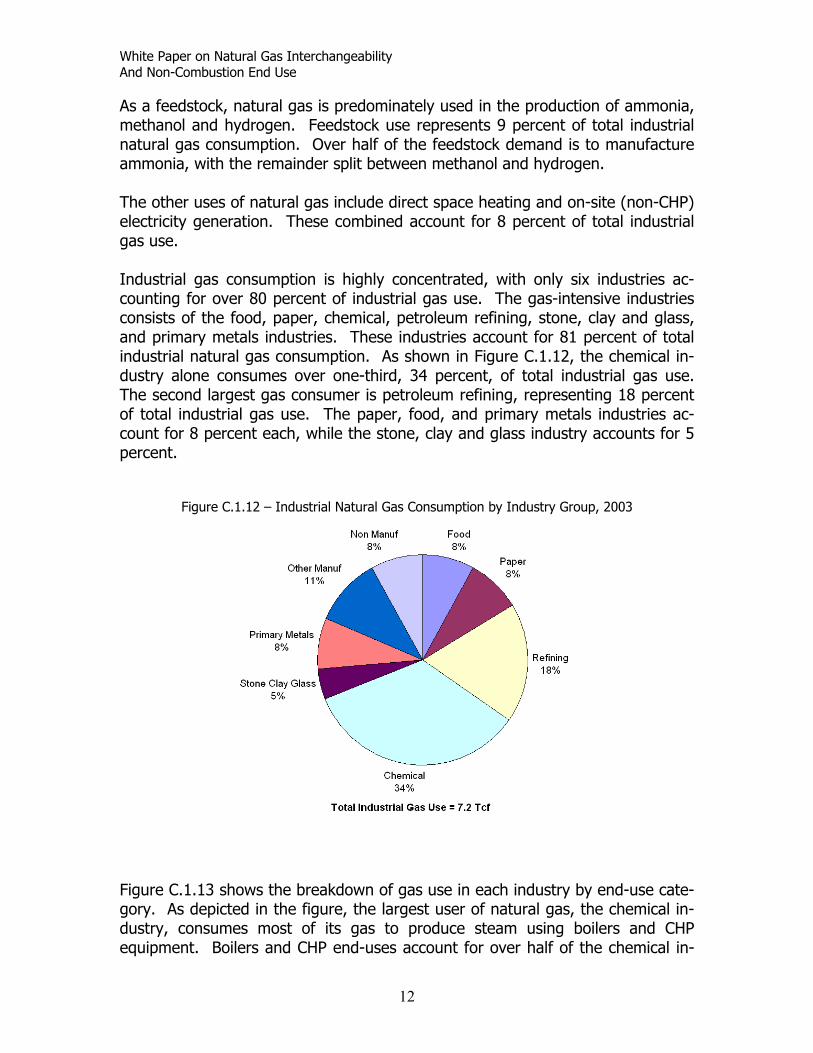
White Paper on Natural Gas Interchangeability And Non-Combustion End Use
As a feedst ammonia, ethanol and hydrogen. Feedstock use represents 9 percent of total industrial
natural gas consumption. Over half of the feedstock demand is to manufacture ammonia, with the remainder split between methanol and hydrogen. The other uses of natural gas include direct space heating and on-site (non-CHP) electricity generation. These combined account for 8 percent of total industrial gas use. Industrial gas consumption is highly concentrated, with only six industries ac-counting for over 80 percent of industrial gas use. The gas-intensive industries consists of the food, paper, chemical, petroleum refining, stone, clay and glass, and primary metals industries. These industries account for 81 percent of total industrial natural gas consumption. As shown in Figure C.1.12, the chemical in-dustry alone consumes over one-third, 34 percent, of total industrial gas use. The second largest gas consumer is petroleum refining, representing 18 percent of total industrial gas use. The paper, food, and primary metals industries ac-ount for 8 percent each, while the stone, clay and glass industry accounts for 5 ercent.
Figure C.1.13 shows the breakdown of gas use in each industry by end-use cate-gory. As depicted in the figure, the largest user of natural gas, the chemical in-dustry, consumes most of its gas to produce steam using boilers and CHP equipment. Boilers and CHP end-uses account for over half of the chemical in-
ock, natural gas is predominately used in the production ofm
cp
Figure C.1.12 – Industrial Natural Gas Consumption by Industry Group, 2003
12

White Paper on Natural Gas Interchangeability And Non-Combustion End Use
dustry’s gas consumption. Feedstocks represent a substantial amount of gas use in the chemicals industry as well, accounting for 25 percent. In the refining in-dustry, a majority of gas consumption is to fuel direct process heaters; about 57 percent of the refining industry’s use of natural gas is for this purpose. The re-mainder is used mostly for steam generation through boilers and CHP. For the primary metals industry, its largest end-use is direct process heat, representing almost 70 percent of this industry’s total gas consumption. In the food industry, over half the gas consumption is for the production of steam through boilers and CHP. Direct process heating accounts for 39 percent of this industry’s gas de-mand. The paper industry has a substantial steam load; 87 percent of total gas use in paper is for the production of steam through boiler and CHP. The largest use of natural gas in the stone, clay and glass industry is for direct process heat-ing (glassmaking furnaces and cement kilns), accounting for 83 percent of total gas use by that industry.
Two regions together account for 54 percent of total industrial natural gas con-sumption in the U.S (Figure C.1.14). The West South Central (WSC) region represents the largest portion of industrial gas consumption, 2.7 Tcf or 37 per-
Figure C.1.13 – Industrial Natural Gas Consumption by Industry and End-Use, 1998
13

White Paper on Natural Gas Interchangeability And Non-Combustion End Use
cent of total U. S. industrial gas use. Much of this consumption is centered in petrochemical industries which prospered from the availability of abundant and inexpensive local natural gas resources. The East North Central (ENC) region represents the second largest industrial natural gas consuming region, account-ing for 1.2 Tcf or 17 percent of total industrial gas consumption. This region is comprised of the food, chemicals, and metals industries, which prefer natural gas not only for its historically competitive pricing, but also because of these indus-tries' use of specific gas applications such as cooking, baking (in the food indus-try), ammonia production (in the chemical industry), and metal melting and heating (in the metals industry). The third largest consuming region is the Pa-cific (PAC) region, accounting for 14 percent of total industrial gas use. The presence of a large refining industry as well as gas use in enhanced oil recovery drive industrial gas consumption in this region. Gas consumption in the industrial sector is primarily driven by the level of indus-trial production. Energy efficiency improvements are introduced through process changes or evolutionary technical improvements. Energy prices affect energy demand, especially, where the equipment is switchable from one fuel form to another. For example, a large number of boilers and process heaters can switch from gas to oil and vice versa.
Figure C.1.14 – Industrial Natural Gas Consumption by Region, 2003
14
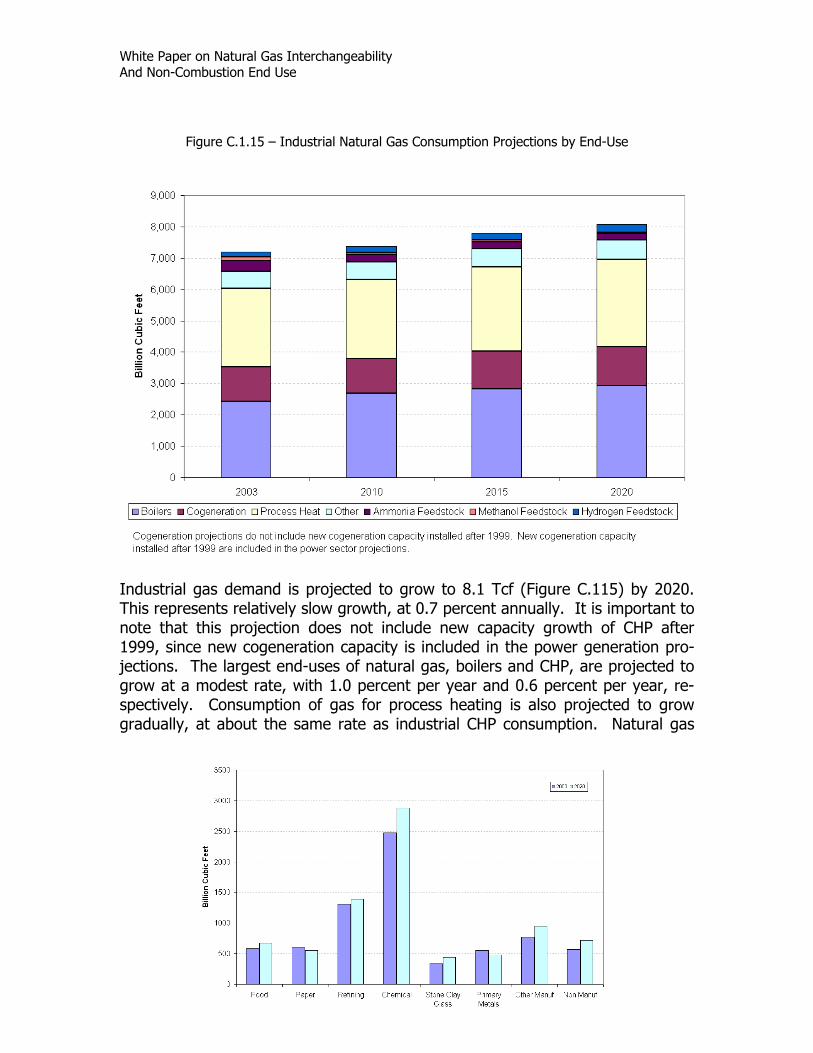
White Paper on Natural Gas Interchangeability And Non-Combustion End Use
Figure C.1.15 – Industrial Natural Gas Consumption Projections by End-Use
dustrial his repre ortant to ote that owth of CHP after
1999, sin ion pro-ctions. The largest end-uses of natural gas, boilers and CHP, are projected to
grow at a modest rate, with 1.0 percent per year and 0.6 percent per year, re-spectively. Consumption of gas for process heating is also projected to grow gradually, at about the same rate as industrial CHP consumption. Natural gas
In gas demand is projected to grow to 8.1 Tcf (Figure C.115) by 2020.
sents relatively slow growth, at 0.7 percent annually. It is imp this projection does not include new capacity gr
Tn
ce new cogeneration capacity is included in the power generatje
15

White Paper on Natural Gas Interchangeability And Non-Combustion End Use
feedstock consumption for ammonia and methanol is projected
Figure C.1.16 – Industrial Natural Gas Consumption Projections by Industry Group
to decline, while feedstock consumption for hydrogen is expected to grow at a fairly rapid rate of 3.0 percent per year. Figure C.1.16 shows natural gas use over the projection period by industry group. The largest consumer of natural gas, the chemical industry, is expected to increase its gas consumption annually at a rate of 0.9 percent. The refining industry, which is the second largest user of gas, is projected to increase its gas consumption by a much slower rate of 0.4 percent per year. Gas consumption in the stone, clay and glass industry is projected to grow the fastest among the en-ergy-intensive industries at 1.5 percent per year. The food industry is expected to increase its gas use by a rate of 0.8 percent per year. Two energy-intensive industries are reporting declines in projected gas use: paper and primary metals. The non-energy-intensive industry groups report a modest growth in gas use of about 1.3 percent per year. Figure C.1.17 shows projected industrial gas growth from 2003 to 2020 by re-ion. Each region is projected to grow between 0.5 percent to 0.9 percent per
gyear. The fastest growth in industrial gas use is expected to occur in the Pacific (PAC) region at 0.9 percent per year. The two largest gas consuming regions of West South Central (WSC) and East North Central (ENC) are projected to in-crease their industrial gas use by 0.7 percent per year and 0.6 percent per year, respectively. The slowest growth is expected in the Mountain region (MT), with an annual rate of growth in industrial gas use of 0.5 percent.
Figure C.1.17 – Industrial Natural Gas Consumption Projections by Region
16

White Paper on Natural Gas Interchangeability And Non-Combustion End Use
C.1.4 Power Sector
easing electricity demand, the rapid uildup of gas-fired generating capacity, and more stringent environmental poli-
Figure C.1.19 presents the projection of electric generation capacity in terms of gigawatts. The large quantity of natural gas-fired generation capacity installed between 1998 and 2004 drives significant gas demand growth over much of the
The power generation sector has been steadily increasing its consumption of natural gas over the past decade. Incrbcies, have all contributed to this growth. Figure C.1.18 shows electricity power generation by fuel type. Currently, the majority (55 percent) of U. S. electricity generation if fueled by coal followed by nuclear at 22 percent and natural gas at 14 percent. While coal-fired generation is expected to increase over the forecast period, its share of total generation is expected to decrease to less than 50 percent by 2020, while gas’s share is ex-pect to increase to 25 percent.
Figure C.1.18 – Power Generation Projections by Fuel Type
17

White Paper on Natural Gas Interchangeability And Non-Combustion End Use
forecast period. Between 1998 and the end of 2004, over 210 gigawatts of new ingle-cycle combustion turbines (CT) and combined cycle turbines (CC) were dded to the generation fleet. From 2005 to 2020 it is forecast that an addi-
capacity will be added, bringing the total turbine capac-y to nearly 360 GW.
cycle (CC) units erving intermediate and, in some cases, base load demand. While CCs are sig-
sational 120 GW of CC/CTit Most of the gas turbines installed through the mid-1990s were single cycle com-bustion turbines (CT) added as peaking capacity (Figure C.1.20). However, since then the majority of new gas units added have been combinedsnificantly more efficient than CTs, they also operate many more hours per year, and therefore consume a higher percentage the sector’s total gas consumption.
Figure C.1.19 – Electric Generating Capacity
18

White Paper on Natural Gas Interchangeability And Non-Combustion End Use
Figure C.1.20 – Simple Cycle Versus Combined Cycle Capacity
Figure C.1.21 shows the projection of the electric power sector’stechnology. At the same time new gas-fired capacity is being added, olsteam turbine units are being retired from the fleet. While the older steabines are far less efficient than the new units, a high percentage of the steam
witch to oil at times of high gas prices, a feature that isCC and CT units. Therefore, the replacement of
Figure C.1.21 – Power Sector Natural Gas Consumption Projections by Technology
gas demand by der
m tur-
units can s rare in new
steam
19

White Paper on Natural Gas Interchangeability And Non-Combustion End Use
turbines with CC and CT units tends to increase gas-fired generation at the ex-pense of oil generation. While gas consumption at steam units remains fairly constant throu from 1.9 Tcf in 2003 to 7.9 Tcf by 2020. Gas consumption by CTs rises at a more modest pace, increasing from 0.7 Tcf in 2003 to 1.0 Tcf by 2020. Power generation gas consumption also varies significantly by region (Figure C.1.22). As of 2003, the Western Electricity Coordinating Council (WECC) dis-patch area consumes the majority of gas used in the power sector, followed closely by ERCOT (Texas).
Figure C.1.22 – Power Sector Natural Gas Consumption by Region
Differences in regional growth in gas consumption are largely driven by different growth rates for electricity demand. For the U. S. as a whole, demand for elec-tricity is expected to grow at a rate of 1.9 percent per year over the forecast; however, regional growth rates vary from a high of 2.2 percent (in SERC, Florida and WECC) to a low of 1.5 percent (ECAR). (Figure 23)
ghout the forecast, gas consumed by CCs increases
20

White Paper on Natural Gas Interchangeability And Non-Combustion End Use
Figure C.1.23- Regional Shares of Power Sector’s Natural Gas Consumption, 2003 and 20
20
it is expected to
grow most quickly in t y Council to
2.2 Tcf by 2020. Fl consumption, in-ally been a large
consumer of gas f nsumption to 2.0 y far the fastest
growing ar otal U. S. power generation gas use, up from
Table C.1.1 Electricity Sales by Region, in Millions of kWh
2.2%Florida/FRCC 215 308 2.2%ECAR 394 510 1.5%MAIN 208 286 1.9%MAPP 219 299 1.8%SPP 258 348 1.8%Texas/ERCOT 325 454 2.0%WECC 619 896 2.2%U.S. Total 3,495 4,842 1.9%
While gas consumption is expected to increase in all regions,he Southeast. The Southeastern Electric Reliabilit
(SERC) is forecast to increase it’s gas consumption by nearly 2 Tcf per year,orida/FRCC also has significant growth in
creasing to 1.3 Tcf by 2020. Texas, a state that has historicor power generation, increases its annual co
Tcf by 2020. In both percentage and absolute terms, SERC is bea. By 2020, SERC will to consume 20 percent of t
only 5 percent in 2003.
SPP7%
MAPP1%
MA0.1
2003NPCC
SPP11%
Texas/ERCOT26%
MAPP1%
MAIN1%
ECAR2%
13%
12%
MAAC2%
SERC5%
WECC27%
MAAC4%
WECC26%
2020 NPCC10%
SERC20%
Texas/ERCOT19% Florida/FRCC
12%ECAR1.5%IN
%
Florida/FRCC
2003 2020
Annual Percentage
Growth Rate
NPCC 263 349 1.7%MAAC 299 393 1.6%SERC 695 998
21
White Paper on Natural Gas Interchangeability And Non-Combustion End Use
C.1.5 Tr Natural gas vehicles (NGVs) have slowly penetrated certain fleet vehicle and ur-ban transit bus markets in recent years. According to the Natural Gas Vehicle Coalition, there are almost 60,000 NGVs currently in operation in the U. S. The U. S. Postal Service currently operates the nation’s largest fleet of natural gas vehicles and United Parcel Service (UPS) operates the largest private fleet. Fur-thermore, utilities, airport shuttle services, taxi companies, police departments, school districts, and ice rinks also operate large fleets of natural gas vehicles. A prominent off-road application of NGVs is forklifts in warehouse operations. There were approximately 6,200 natural gas transit buses operating in the U. S. at the end of 2001. Natural gas buses represented approximately 11 percent of total transit buses and 97 percent of all alternatively fueled transit buses. At the beginning of 2002, an additional 1,313 natural gas transit buses were on order. Almost 21 percent of all transit buses on order are natural gas powered.
pede the success of NGVs the future include continued high up-front costs, ongoing problems with refu-ling infrastructure, penetration of new and more competitive options like hy-
brids, performan tile natural gas prices. C.1.6 Gas Transmission The process of extracting and delivering natural gas consumes substantial amounts of natural gas. There are three types of natural gas consumption in gas transmission: plant fuel, lease fuel, and pipeline fuel. Plant fuel is natural gas consumed as fuel by heaters and compressors in natural gas processing plants. Lease fuel is gas consumed in operating well and field gathering systems. Pipe-line fuel is natural gas consumed in the operation of pipelines, primarily com-pressors. Lease and plant fuels are usually reported combined and referred to as lease and plant. Nevertheless, as a general assumption, 65 percent of the total
ansportation Sector
The Energy Information Administration (EIA) reports that natural gas consump-tion (compressed natural gas) in the transportation sector was around 21 Bcf in 2003. This is significantly smaller relative to the consumption of natural gas in the other sectors. EIA projects that compressed natural gas consumption in the transportation sector will reach 96 bcf by 2020, or grow at an annual rate of 9.4 percent. EEA believes that EIA’s projections are overly optimistic. Although, there has been some success in the use of natural gas powered vehicles, it is ex-pected that the success will not be maintained over the projected period (2003 to 2020). Some of the factors that are expected to imine
ce issues (e.g., driving distance range), and vola
22

White Paper on Natural Gas Interchangeability And Non-Combustion End Use
lease and plant consumption is lease fuel and the remainder (35 percent) is plant el.
otal pipeline and lease and plant consumption in 2003 was 2.0 Tcf, with 1.2 Tcf
Cen-al, Central, and Southwest.
fu Tlease and plant fuel and 0.8 Tcf pipeline fuel. Figures C.1.24 and C.1.25 show the regional breakdown of lease and plant fuel and pipeline fuel, respectively.2 The West South Central region reports the largest lease and plant gas consump-tion, followed by the state of Alaska. These two regions combined account for 52 percent of total lease and plant gas consumption in the U. S. Pipeline con-sumption is more equally distributed regionally, although the West South Central region reports the largest pipeline fuel consumption, accounting for 11 percent of total U. S. consumption. Other major regions are the Midwest, East South tr
Figure C.1.24 – Lease and Plant Consumption by Region, 2003
2 The definitions for the regions are different from those used in the residential, industrial and commercial sectors analysis. The regional breakdown used for the residential, industrial and commercial sectors follow the Census Division definitions. The regional definitions used for the Gas Transmission analysis are provided in the Appendix.
23

White Paper on Natural Gas Interchangeability And Non-Combustion End Use
Figure C.1.25 – Pipeline Fuel Consumption by Region, 2003
Over the projection period (2003 to 2020), lease and plant fuel consumption is projected to increase by only 42 bcf, or 0.2 percent per year. Lease and plant fuel use in the West South Central region will decline while its use in Alaska will remain fairly flat. Increases in lease and plant fuel use are expected in the Mountain and Gulf Slope regions. Figure C.1.26 shows the lease and plant fuel consumption projections by region.
Figure 26 – Lease and Plant Fuel Consumption Projections by Region
24

White Paper on Natural Gas Interchangeability And Non-Combustion End Use
Pipeline fuel consumption is projected to increase at a higher rate than lease and plant consumption. From 2003 to 2020, pipeline fuel consumption will grow an-nually at a rate of 1.5 percent. Alaska and New England are expected to show the largest growth rate (17 percent pe year and 8 percent per year, respec-tively). Figure C.1.27 shows the pipeline fuel consumption projections by region.
Figure C.1.27 – Pipeline Fuel Consumption Projections by Region
ts of a number of different chemical com-ounds, including methane (natural gas), ethane, propane, butane and pen-
tanes. The d from the natural gas stream, for use as petrochemical feedstocks, and to control the qual-y of the natural gas stream. During previous high gas price periods, a signifi-
cant amount of these hydrocarbons have been left in the gas stream, sometimes creating operational difficulties for pipelines, utilities, and end-users U. S. ethane production at gas processing plants represents the Btu equivalent of about four percent of total U. S. natural gas production. Ethane is generally con-sidered to be a high value product, and most of the ethane produced with the production of natural gas is removed and sold as a petrochemical feedstock. However, the ethylene market, (the primary use of ethane) is an international market, and high domestic natural gas prices make U. S. ethylene production non-competitive with other international sources. This makes removing ethane from natural gas uneconomic under high gas price conditions.
r
C.1.7 Natural Gas Processing Trends Natural gas at the wellhead consisp
bulk of the hydrocarbons other than methane are remove
it
25
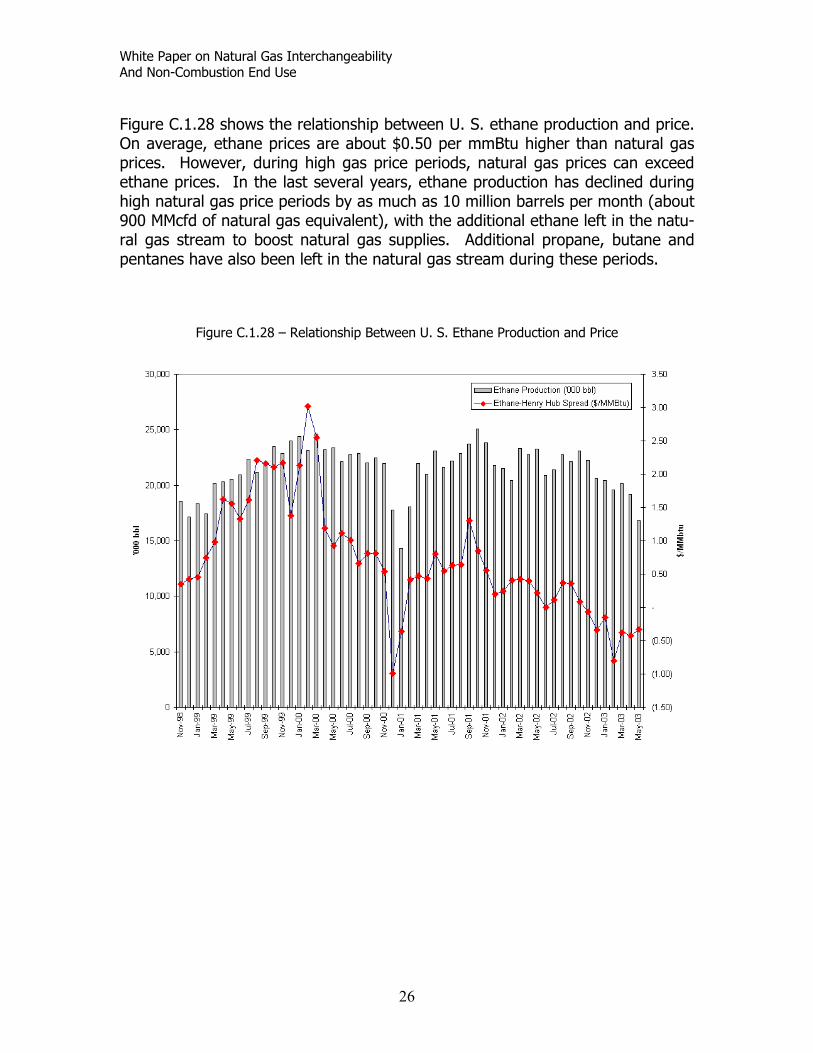
White Paper on Natural Gas Interchangeability And Non-Combustion End Use
Figure C.1.28 shows the relationship between U. S. ethane production and price. On average, ethane prices are about $0.50 per mmBtu higher than natural gas prices. However, during high gas price periods, natural gas prices can exceed ethane prices. In the last several years, ethane production has declined during
igh natural gas price periods by as much as 10 million barrels per month (about 900 MMcfd of in the natu-
l gas stream to boost natural gas supplies. Additional propane, butane and pentanes have also been left in the natural gas stream during these periods.
Figure C.1.28 – Relationship Between U. S. Ethane Production and Price
h natural gas equivalent), with the additional ethane left
ra
26

White Paper on Natural Gas Interchangeability And Non-Combustion End Use
Addendum
South Atlantic = DE, DC, FL, GA, MD, NC, SC, VA, WV East South Central = AL, KY, MS, TN West South Central = AR, LA, OK, TX MouPacific = AK, CA, HI, OR, WA
I. Census Division Definitions
New England = CT, ME, MA, NH, RI, VT Middle Atlantic = NJ, NY, PA East North Central = IL, IN, MI, OH, WI West North Central = IA, KS, MN, MO, NE, ND, SD
ntain = AZ, CO, ID, MT, NV, NM, UT, WY
27

White Paper on Natural Gas Interchangeability And Non-Combustion End Use
C.2 Appliances
Kendall, GAMA Ted Williams, AGA
C.2.1
Applia ace and water, cook food, and dry clothes s consumed in the U. S. There are more in U. S. households and 14 million year. Residential appliances are generally produced in central locations based on standardized designs and are sold nation-ally. Water heating and space heating appliances are the largest consumers of natural gas in the residential sector (93 percent of residential appliance gas con-sumption) followed by cooking appliances (4 percent) and clothes dryers (1 per-cent), although the number of installations of ranges and clothes dryers (30 mil-lion and 15 million, respectively) are comparable to the number of installations of water heaters and furnaces (60 million and 45 million).
In the commercial sector, nearly 8 million buildings have some type of gas space heating or water heating appliance installed. Like the residential sector, appli-ances in the consumer sector are generally produced in a central location based on a standardized design and sold across the country. Larger heating boilers and water heaters, however, may be partially erected on site and engineered for each specific application. From a gas interchangeability perspective, there are several characteristics to consider relative to appliances:
• Performance (heat output, energy efficiency, noise) • Durability and reliability (premature failure or shutdown of components
due to corrosion, erosion, fatigue, gas pressure, or operating tempera-ture)
• Consumer safety (fire, increased release of CO and other toxins or irri-
tants into the occupied space) • Environmental impacts (increased release of NOx, CO, particulates and
other pollutants into the atmosphere) • Initial installation conditions and adjustment.
Mark
The Appliance Market nces that are used to heat building sp consume one-third of the natural ga
than 160 million gas-fired appliances installed new appliances installed each
28

White Paper on Natural Gas Interchangeability And Non-Combustion End Use
Different appliance markets and different applications are more sensitive to changes in these factors. For instance, emissions from unvented appliances (e.g. residential ranges and ovens and rs and commercial direct-fired makeup air heaters), and con ated with those emissions, are more of a concern than in vented appliances (furnaces, boilers, and water heaters).
nt capacity to deal with changes in gas charac-teristics. The commercial sector is more likely to conduct routine maintenance
er heaters sold in the district limit NOx emissions to no more than 40 nanogram per Joule of
in gas composition. By law, energy efficiency regula-ns can only become more stringent, and increases in the price of natural gas
App gely because of the characteristics of their component technologies. The next section describes those diff nc
C.2.3 Technologies
The es li-ances react to changes in gas characteristics:
Heat exchangers and combustion chambers
unvented space heatesumer safety associ
Each market sector has a differe
and adjustment and perform proper appliance commissioning procedures than is the residential sector, where appliance are sometimes installed by homeowners and serviced only when they stop working.
C.2.2 Market Trends U. S. clean air regulations and concerns over the health effects of indoor NOx are putting pressure on appliance manufacturers of all types to reduce NOx produc-tion to very low levels. For example, in California, the South Coast Air Quality Management District requires that all residential furnaces and wat
heat output. The regulations for water heaters drops to 10 nanogram per Joule in 2006.
The U. S. also regulates the energy efficiency of gas appliances. Higher efficiency designs, because of their more precise control and components, are likely to be more sensitive to changestioresult in more market demand for highly efficient products, regardless of regula-tions.
liances react differently to changes in gas composition lar
ere es.
d ign and construction of four classes of components affect the way app
• Burners •
29
White Paper on Natural Gas Interchangeability And Non-Combustion End Use
ign is the most important.
ixture (i.e. the equivalence ratio) at which they are designed to operate cleanly, efficiently, safely, and with a mini-mum production of pollutants as described in Appendix D. The classifications are:
• Partial premix (excess fuel)
the Wobbe Index than are lean premix burners. NOx control in resi-dential appliances is usually accomplished through the insertion of a ceramic de-
ave a narrow range of operation that is difficult to meet even with the current gas supply. Typically they have a 60-80 percent primary air mixture.
itrogen content of the natural gas relative to design conditions, can increase the lift index of the burner. An increase in lifting can extinguish the
t impossible to light (incombustible at port).
nges be designed such that com-bustion of the fuel gas is clean and complete, without generation of by-products. To un nges, burner tubes can be pro ed primary air to be regulated,
• Flues and vents • Safety components.
Burner des
C.2.3.1 Burners From the perspective of gas interchangeability, appliance burners are generally classified based on the relative fuel-air m
• Lean premix (excess air).
The vast majority of appliances installed in residential applications use partially premixed burners with an equivalence ratio greater than one. Appliances using partial premix burners are more forgiving to changes in gas composition and in-creases in
vice into the flame to reduce flame temperature and associated thermal NOx formation. The trend in new appliances, particularly commercial heating appliances because of NOx and efficiency regulations, is toward lean premix burners. These burner types h
Some low NOx burners induce a controlled amount of flame lifting to reduce the heat at the burner port. Using nitrogen blending to control Wobbe, thereby in-creasing the n
burner and may make i
Range burners are very common in households throughout the U. S. and are normally unvented except for the incidental venting performed by kitchen venti-lation systems. It is therefore essential that ra
co ter the effects of periodic gas properties chavid with adjustable vanes to allow the flow of
30

White Paper on Natural Gas Interchangeability And Non-Combustion End Use
reducing some of these problems. These vanes are however, intended for the initial set-up of an appliance against a known gas specification, not for the day-to- c would be needed for multiple variations in gas compo-sition. Alternative gas nozzles/orifices are also usually available, but they are in-ten d between compositionally different gas types such as natural gas and propane, and are normally changed only by a qualified tech-
used to accommodate infrequent changes gas composition, this is not a viable solution for frequent modification of home
appliances, due to the necessity to involve personnel trained in the procedure.
majority of commercial products use tubular heat exchangers with induced draft insh t (s large end of the capacity range, it is com-mon to use a drum type combustion chamber joined to a tubular secondary heat exc ng r burner. Residential equipment is split be-tween the two types of exchangers, with the majority as stamped steel clam-
mbusted in the secondary flame front; however, in some instances e soot does not fully combust and the deposits affect the appliances opera-
elative to the ambient air. For commercial vents the most common is a pressure stack stainless
day ompensation that
de to allow for variances
nician. While vane adjustment can bein
C.2.3.2 Heat Exchangers and Combustion Chambers The most prevalent types of heat exchangers currently used in the United States for space heating are tubular and clamshell or serpentine exchangers. The vast
o ingle port) burners3. At the
ha er, and fired with a powe
shell/serpentine. Aluminized steel (most common) and 409 stainless steel (con-densing equipment) are the primary materials used in contemporary heat ex-changers. Modern heat exchangers have tighter internal passageways that make them more susceptible to clogging from soot. Soot produced from yellow tipping, is typically cothtional lifetime and performance.
C.2.3.3 Flues and Vents The products of combustion of vented appliances are exhausted to the outdoors through the appliance flue and its venting system. The most prevalent vent sys-tems used for residential appliances are masonry chimneys (lined or unlined) and B-vents4 in which flue products are vented at a negative pressure r
steel, which operates under positive pressure. 3 In inshot burners, one long flame is directed into the heat exchanger after ignition. “Induced draft” means that the combustion products are evacuated from the chamber by a fan located in the appliance flue downstream of the combustion chamber. The flow through the fan is not suffi-cient to pressurize the venting system. 4 B-vents are double wall, rigid vents, usually of galvanized steel that are suitable only for nega-tive pressure service.
31

White Paper on Natural Gas Interchangeability And Non-Combustion End Use
The degree of pressurization and the temperature of the flue gases determine the requirements for the venting system. If flue gas temperatures are low enough, condensation can occur in the venting system. Condensation of flue gases in the vent can lead to corrosion and premature vent system failure. Gas composition can adversely affect venting systems by increasing flue gas temperatures and increasing the presence of corrosives that could condense in the vent.
igh efficiency condensing appliances, which are popular in the residential fur- cool the flue gases
the point of condensation within the appliance. Since flue gases are designed
rating conditions are present. Among these are high-temperature witches that can fail to function if they are chronically overheated.
rocesses here is no mandatory national requirement in the U. S. for the application of a
ety standards to gas appliances, nor for the testing d listing thereof. The federal government has the authority to regulate the
at
uthority. The most prominent of these are Un-
,
Hnace market (over 1 million sold each year) are designed tototo leave the appliance at nearly room temperature and free of condensate, vent systems can be constructed of ordinary polyvinyl chloride (PVC) and CPVC (chlo-rinated polyvinyl chloride) plastic vent pipe. C.2.3.4 Safety Systems Components All gas appliances are equipped with safety devices that act to prevent uncon-trolled ignition or shut down the equipment when abnormal and potentially dan-gerous opes C.2.4 Appliance Certification Testing
C.2.4.1 Industry Standards P
Tspecific set of design or safansafety of consumer products, but has elected at various times not to exercise that authority in the case of gas appliances. The Consumer Products Safety Commission contemplated the promulgation of standards for gas cooking prod-ucts during the 1970’s, for example, but was satisfied with the appliance indus-try’s record in the maintenance of and compliance with voluntary standards, so it has not proceeded further.
In practice however, virtually all building codes at state or city levels require thinstalled products be tested to relevant product-specific safety standards andmarked by a recognized testing aderwriters Laboratories, CSA America, and Intertek Testing Services. Additionally
32

White Paper on Natural Gas Interchangeability And Non-Combustion End Use
it is unlikely that any reputable retail concern would stock gas appliances that
he ANSI Z21/83 standards committee and CSA America share the development
National Standards Institute consensus procedures. The Z21/83 com-ittee is comprised of nearly 40 individuals representing manufacturers, testing
d components of gas appliances not overed by Z21/83. The more popular of these standards are also usually ANSI tandards subject to the consensus process.
ds most sen-itive to gas interchangeability are performance-based. In other words, rather an just assessing the design and construction of the appliance, the standards
iance using a set of test gases and under different gas pressures, operating conditions, and venting conditions to be
ifications of safe operation.
ting, or blowing; flame rollout; yellow tipping; soot generation noise generation; interaction between burners; extinguishing of
tion are within prescribed limits. Additionally, for ranges and space heaters,
had not been examined and listed by a competent and nationally recognized laboratory. The “voluntary” system for certifying the safety of gas appliances therefore is effectively “mandatory” across the U. S.
Tof the design and safety standards universally accepted by U. S. industry and the testing laboratories. These standards are maintained and developed under American mlaboratories, safety organizations, and other interested parties. All proposed changes are subjected to peer and public review through the ANSI process prior to any revisions of the standards. In addition to the Z21/83 standards, CSA America and Underwriters Laboratories also maintain standards addressing types ancs
C.2.4.2 Tests and Test Gases Although the gas appliance standards cover all aspects of the design, construc-tion, and performance of the appliances, the aspects of the standarsthrequire the testing agency to operate the appl
sure that the appliance performs within spec The standards as currently published assume the use of natural gas as supplied from traditional US domestic sources. The representative gas prescribed is Test Gas “A”, which has a heating value of 1,074 BTU/ft and specific gravity relative to air of 0.65 (equivalent to a Wobbe of 1,333, which is near the U. S. mean of 1,336). Operational tests are performed using Test Gas “A” at normal (7” water column), reduced (3.5” water column) and increased (10.5” water column) gas supply pressures with the burners at maximum rated output to verify freedom from the following performance defects: excessive carbon monoxide emission; flashback; flame lifting, floa
; flame through drafts or sudden changes in air pressure; lack of flame stability; and ignition/re-ignition difficulties. Tests are also performed to confirm that external surface temperatures in opera-
33

White Paper on Natural Gas Interchangeability And Non-Combustion End Use
there is a clothing ignition test that simulates the action of a user leaning across the cooktop or surface of the heater while the burners are in use. In addition to the safety evaluations performed using Test Gas “A”, a flashback test is performed using Test Gas “G” which is a butane/air mix having a heating
tory of the appliance safety standards, there ave been occasions that the Z21/83 committee has considered adding limit
ts significantly from Test Gas “A.” ubjecting appliances to a battery of safety tests at minimum gas pressures and
e indication of how the appliances would per-rm if the pressure remained constant but the Wobbe value of the gas was
value of 1,400 BTU/ft and a specific gravity of 1.42 (Wobbe of 1,175, which is 12 percent below the traditional range of U. S. natural gas). Yellowtipping is usually severe with Test Gas “G”, but sooting is not acceptable. Besides flashback and ignition, other safety and emissions tests are not conducted with Test Gas “G”. Unlike Europe, the U. S. standards do not test appliances with “limit” gases that represent a conservative range in gas characteristics that the appliance may see during its lifetime. During the hishgases to the standards, and a great deal of work has been done to define what appropriate limit gases would be. The U. S. approach of testing with “point” gases provides little assurance regarding the safe operation of appliances when burning natural gas whose composition depar
Smaximum input rates provides somfochanged instead. Ideally, input rate varies in direct proportion to a change in Wobbe. Therefore, an increase in input rate of 12% should be roughly equivalent to an increase in Wobbe of 12% for many gas burner designs. Table C.2.1 provides the range of input rates or gas pressures at which common gas appliances are tested using Test Gas “A.” Note that residential boilers and water heaters are not evaluated for safety at increased firing rate, except for
eir CO emissions. No products undergo a full battery of testing at decreased thfiring rates, although all are tested for safety at high and low gas inlet pressures, as mentioned above. Changes in gas inlet pressure are partially or totally com-pensated for by the gas controls, so there may be no effect on the gas manifold pressure or the firing rate of the appliance. Any effects due to changes in firing rate are evaluated, but the actual firing rates are not recorded. Limited tests for flashback and ignition are tested at 87% of rated input for some appliances.
Table C.2.1 Safety Tests at Increased Firing Rates for Selected Gas Appliances
Highest Tested Input Rate Relative to Rated Input
Z21/83 Standard Reference
Boilers (residential, light com- 106.25% (CO test only) Z21.13-2004 mercial) (2.3.1 Table XIII, 2.4.1) Direct-fired makeup air heaters, No test Z83.18-2000
34
White Paper on Natural Gas Interchangeability And Non-Combustion End Use
recirculating Furnaces (residential) 112% Z21.47-2003
(2.5.3, Table X) Ranges and ovens (residential) 112% Z21.1b-2003
(2.3.3, Table X) Unvented room heaters 112%
123% (CO test only) Z21.11.2b-2004 (2.3.3, Table XI)
Vented space heaters 112%
Z21.86b-2002 (2.3.3, 2.3.5, Table X)
ater heaters (commercial) 106.25% (CO test only) Z21.10.3-2001 W(2.3.1, Table XI, 2.4.1)
Water heaters (residential) 106.25% (CO test only) Z21.10.1-2004 (2.3.1 Table IX, 2.4.1)
C.2.5 Installation, Commissioning, and Maintenance Practices Gas composition and altitude, which also affects appliance operation, have al-ways varied across the United States. Since most appliances are produced cen-
ally and sold nationally, and since the appliance safety standards do not test
stallation procedures for residential and commercial natural gas appliances
ent as been used in end use gas service for newly installed space heating and water eating appliances for decades and has provided the basis for accommodating
variatio he documented qualificatio any re li-
censing requirements in man dictions, in many cases, there is no assurance n c iv . This concern is
plicable in the residential sector, where more products are installed and f d technicians. T appliance main-
trthe appliances for safe performance under the full range of U. S. conditions, the approach taken by the appliance standards and building codes to help ensure proper performance in the field is to require installers to adjust the appliance for proper operation at the time of installation. This one time adjustment does not address changes in gas composition over the life of the equipment. Inthroughout the U. S. are prescribed by state and local installation codes and ap-pliance manufacturer installation instructions. State and local codes are com-monly based on model codes, principally the National Fuel Gas Code (NFGC), ANSI Z223.1/NFPA 54. Required procedures in installation codes and manufac-turer installation instructions address combustion behavior as part of installation. Combustion issues associated with gas composition and burning properties are addressed by general requirements for setting the appliance “on rate” (i.e., matching Btu input – Btu content of gas times flow rate -- to the appliance nameplate rating), observing flame characteristics, and making adjustments to achieve acceptable behavior. The practice of flame observation and adjustmhh
ns in local natural gas compositions.
T ns of technicians my juris
vary. Although there a
that a particular techniciamost ap
an properly set up a g en appliance
there is a severe shortage o qualifie he extent of
35

White Paper on Natural Gas Interchangeability And Non-Combustion End Use
tenance also varies. Both of these situations affect appliance performance in the onducted gas utility in the Northeast, for instance, ob-
served a marginal or non-compliant yellow flame inappliances in its service territory, indicating overfi percent had
pliant C this on resentative of all appliances in the nation, appli would be 16 million appliances. Marginal or already non-compliant appliances are of particular
n-tradition is introduced. The U. S. approach to appliance installation and co ibed be-
field. One survey c by a 9 to 13 percent of installed ring. Five to 9
marginal or non-com O emissions. If e survey is rep10 percent of the ance population
concern when a no al gas
mmissioning is descrlow.
.2.5.1 Installation Codes and Practices
he National Fuel Gas Code has procedures for checking input rate with and
(i.e., “overfired”) may be expected exhibit incomplete combustion behavior. Installation codes therefore require
C Twithout the use of the installed gas service meters. These procedures precede final adjustment for proper flame behavior and provide an initial means of ad-dressing local gas composition. The installer should obtain this information from the gas supplier; however, an assumption of 1,000 BTU/scf and a specific gravity of 0.60 for “utility gas” are commonly used. This combination of assumptions would tend to result in appliances being overfired by 4 percent compared to the firing rate that would be realized if appliances were adjusted to the U. S. “aver-age” national gas. Appliance installation codes cover installation alone and not maintenance. Putting the appliance “on rate” may be accomplished on some appliances by adjusting the manifold pressure or primary air shutters to achieve a target gas flow rate through the gas meter. Along with adjustments to the pressure regulator, if such adjustments are possible, discrete changes in firing rate may be accomplished by replacing the gas orifice. Additional information on primary air adjustment on burners with air shutters is provided in the National Fuel Gas Code Handbook. When the installer achieves the target input rate, the installer should still check the flame and make any necessary adjustments until a proper flame color and shape is observed.
Appliances served by inputs above the rate specified on the nameplate and the tolerances allowed in its design certificationtothat the appliance input rate not exceed its nameplate rating by more than the amount allowed in the applicable design standard.
36
White Paper on Natural Gas Interchangeability And Non-Combustion End Use
C.2.5.2 Installation Instructions Installation codes also usually require that installers follow manufacturer instruc-tions, even if they are more stringent than what is required by the installation code. Manufacturers’ installation instructions document a wide variety of installa-tion requirements and maintenance recommendations for residential and com-mercial appliances. Minimum requirements for installation instructions are speci-ed in the relevant design certification standards. Specific requirements vary ac-
o maintain appliance durability and performance, manufacturers often provide structions for putting appliances “on rate” with more precision than the safety
ct than an installer following their structions will be able to place the appliance to within +/-2 percent of the
or many years, gas utility training and service organizations have emphasized
is U. S. Environmental Protection Agency publication, “Guidelines for Adjustment
the subjective interpretation of installation and service tech-nicians, relatively consistent performance in terms of more objective criteria
ficording to the Z21/83 standard of the appliance’s listing.
Tinstandards require. Manufacturers typically expeinspecified firing rate. Markings on most instructions include required wording that “installation and service must be performed by a qualified installer, service agency or gas sup-plier.”
C.2.5.3 Flame Adjustment by Visual Means Fidentifying abnormal flame behaviors including flame lifting, flash back, yellow tipping, and adjustment to proper appearance as part of training of service per-sonnel. One established objective source for visual interpretation of normal and abnormal flame behaviors, published in 1950, is the AGA Flame Code classifica-tion method, recently applied in interchangeability studies by GTI.5
Another source depicting normal and abnormal flames with color photographyaof Atmospheric Gas Burners for Residential and Commercial Space Heating and Water Heating,” published in 1979.6 While burner adjustment to flame appear-ance depends upon
(e.g., calculated air-free CO emissions based on CO measurements in combus-tion products) is generally achieved. Again, such adjustments are typically per-formed upon installation of the appliance and may not be repeated, regardless of 5 Gas Interchangeability Tests: Evaluating the Range of Interchangeability of Vaporized LNG and Natural Gas, Final Report, Gas Technology Institute, April 2003. 6 Guidelines for Adjustment of Atmospheric Gas Burners for Residential and Commercial Space Heating and Water Heating, U. S. Environmental Protection Agency, February 1979, EPA-600/8-79-005.
37

White Paper on Natural Gas Interchangeability And Non-Combustion End Use
instructions and consumer information. As a result, response of appliances to ered in light of their likely initial installation
nd adjustment.
. Annual maintenance consists of inspection and cleaning of the burner, safety systems, and venting
changes in gas supply must be consida
C.2.5.4 Maintenance Annual maintenance is recommended by a number of gas utilities and publicagencies and by manufacturers; however, periodic maintenance is not requiredin the U. S. for private establishments and occupancies
system, but may or may not result in readjustment of the appliance for changinggas characteristics.
angeability Testing Programs for Appliances
ny studies are shown in Table H.1. Unfortunately, there are limitations on
lying on this work to evaluate interchangeability today. These limitations in-clude:
• Many test reports are proprietary and not available for public review and
• Adjustment gases (i.e., new supplies) were evaluated in some studies af-
of installed appliances, the number of appliances was small relative to the
r- appliances over their lifetime.
C.2.6 Gas Interch Over the last several decades, a large body of testing has been performed to evaluate the impacts of changing gas composition on appliance operation. Maof thesere
dissemination. • Few studies are recent enough to have evaluated appliances utilizing
modern burner and heat exchanger designs, particularly regarding NOx emissions.
ter checking the settings of appliances for input rate and other adjust-ments instead of evaluating appliance performance without adjusting the appliance.
• In most studies, appliances were not evaluated over their entire operating
range and in common maladjustment situations, where concerns about changes in gas composition are the most serious.
• For testing intended to evaluate gas interchangeability on the population
total population of appliances.
• Testing did not evaluate the effects of the gases on the durability and peformance of the
38

White Paper on Natural Gas Interchangeability And Non-Combustion End Use
C.2.7 Gas Interchangeability Concerns
here are three questions to be considered:
• How will the 160 million appliances already installed in the U. S. react to
he answers to these questions may depend on the degree of departure of local atural gas from Test Gas “A”, from the traditional range in characteristics of U.
installed nd commissioned, and the rate at which changes in gas composition occur.
nce
tion in appliances. For example, cold ambient air temperature affects ombustion airflow while cold gas temperature affects gas input, meaning that
input a -ture is varied. Cold metal temperatures make ignition and carry-over between burners more difficult and make flame extinction more likely. Outdoor appliance uni m ith-out ge so have direct impacts on combustion characteristics.
The o a shift o ari-ability signed, tested, and installed. Although appliances are designed to perform any
aditional U. S. gas well when the appliance is properly adjusted, an appliance tharequire s. For tha restrictive than national
nges are desirable to ensure the safe and reliable operation of installed appli-ances.
.2.7.1 Performance (heat output, efficiency)
T
changes in gas composition?
• How will the 14 million new appliances sold each year react?
• Is Wobbe a sufficient indicator of gas interchangeability? TnS. gas, from the characteristics of the gas when the appliance was firsta The degree to which residential and commercial products are susceptible to changes in gas composition has not been fully quantified, and indeed there arevarious environmental factors not related to gas interchangeability that influecombusc
nd excess air levels can drift away from design conditions when tempera
ts ust be designed to withstand high winds without flame failure and wnerating excessive CO emissions. High moisture and ambient humidity al
c ncerns related to gas interchangeability are related to the effects that
r excursion in gas characteristics will have when combined with the vin operating conditions that were foreseen when the appliance was de-
trt is set to operate at the low end of U. S. gas (1,210 Wobbe) that is suddenly
d to burn gas at the high end (1,403 Wobbe) will experience problemt reason, local or regional ranges that are more
ra
C
39

White Paper on Natural Gas Interchangeability And Non-Combustion End Use
Variation in heat output and efficiency due to changes in Wobbe are generally ot of concern in the appliance market. Heating appliances such as furnaces,
nd manually or thermostatically ad-ore or less frequently to maintain
n changes.
Coo npes o ble exceptions. Fluctuations beyond +/- 5% f the he “simmer” et g heat output uring or undercooked o U time and output
and
rchangeability.
nboilers, water heaters, and clothes dryers, ajusted cooking appliances will simply cycle mhe proper heat output as the gas compositiot
ki g equipment without thermostatic controls, such as rangetops and some
f commercial cooking are notatyo appliance adjustment point will cause the heat output on t
tin on residential cooktops to fluctuate noticeably. Variation insd timed commercial broiling cycles can result in overcooked
d. ndercooking poses health concerns. Again, since broilingfocan be adjusted, short-term fluctuations in Wobbe is the only concern. Regarding efficiency, GRI (1982) concluded that for the majority of cases, varia-tions in composition of natural gases did not have a noticeable affect on the effi-
encies of residential forced-air furnaces, hot water boilers, water heaters, ciranges. When appliance efficiencies were measured repeatedly using gases with Wobbe numbers of 1,296, 1,179, 1,432, and 1,062 they generally gave results within 1 – 2 percentage points of each other. Similar variations in efficiency would be expected in today’s appliances. Noise is a special performance concern that is most acute in larger residential heating products. Within the Wobbe ranges being considered, excessive noise is not an important consideration. Flame lift and flashback, which are not accu-rately predicted by Wobbe, can cause objectionable noise, but the safety con-cerns associated with those phenomena are more important than noise concerns, and are discussed below.
C.2.7.2 Durability, Reliability, and Safety Appliances are designed to operate safely through their useful life. Gas appli-ances owe much of their market success to the homeowners’ recognition that the appliances are reliable and convenient, overcoming their usually higher first cost relative to their electric counterparts. Changes in gas composition that no-ticeably and adversely affect the reliability of existing or new gas appliances could result in a marked decline in the demand for gas appliances. Heat ex-changers and other components such as switches and burners are sensitive to gas inte C.2.7.2.1 Heat Exchangers
40

White Paper on Natural Gas Interchangeability And Non-Combustion End Use
Heat exchanger designs and materials are selected in conjunction with the burner to optimize performance. Heat exchanger failure is normally caused by fatigue (expansion and contraction due to changes in temperature), which can be exacerbated by corrosion. Heat exchangers are subject to corrosion problems if underfired (whether additional corrosive agents are present or not) and subject
fatigue if overfired. Stainless steel heat exchangers may withstand a wider
rn.
.2.7.2.2 Other Components
a very significant influence on the lifetime of an appli-ance and its components (i.e. thermocouples, electrodes, switches). Faster burn-
g gases put more heat on the surface of the burner resulting in surface over-rm effects on the appliance. High
mperatures lead to heat deterioration, port opening, and corrosion (both stress
ed by activation or overheating of safety switches and ensors. Frequent nuisances, besides being irritating and costly for the home-wner, can cause troubleshooters to bypass the safety systems, leading to more
en BG&E introduced Algerian natural gas with a obbe number about 6 percent higher than traditional BG&E natural gas, BG&E
tovariation in gas composition because of stainless steel’s greater stress and corro-sion resistance as compared to aluminized steel. Any changes in gas composition that affect combustion temperature or corrosive properties will have a detrimental effect on the life of the heat exchanger. Pre-mature heat exchanger failure, besides resulting in warranty claims, normally ne-cessitates replacement of the appliance, and can present a safety conce Simulations conducted by one furnace manufacturer predict that overfiring a residential furnace heat exchanger so as to raise its peak surface temperature 30˚F above its design temperature will cut in half its 20 year expected life. Thus transient and chronic increases in Wobbe value can lead to noticeable and costly reductions in heat exchanger life. C To meet the performance and prescriptive requirements in the appliance safety standards, modern appliances typically rely on pressure and temperature sensors and switches that cause the appliance to shut down when hazardous operating conditions (e.g. high gas pressure, high heat exchanger temperature) are sensed. Temperature has
inheating, which has both immediate and long-teteand intergranular). Infrared burners, for example, are very sensitive to tempera-ture increases and demonstrate thermal mechanical stress and ignition delay in addition to corrosion. Once the burners begin to corrode their performance will begin to decline, typically resulting in flashback. Moreover, changes in flame characteristics and ignition and increased operating temperature due to changes in gas quality can increase the frequency of these nuisance outages caussoserious safety concerns. WhW
41

White Paper on Natural Gas Interchangeability And Non-Combustion End Use
noticed an increase in service requests by 13 percent, odor calls increased by 31 percent and gas leak calls increased by 10 percent. Generally temperature fluctuations are not a concern for venting systems; how-ever, the increase in corrosion potential from by-products or remnants of chemi-cals such as sulfur in the odorant, chlorides, and other potential contaminants is a concern.
ts of arbon monoxide, fire, and explosion are some of these concerns. A higher
rs.
arbon monoxide is a toxic gas, and under high concentrations, it is potentially ide production, which occurs as a result of incom-
lete combustion, is particularly concerning for unvented appliances such as
C.2.7.2.3 Consumer Safety Perhaps the most serious concerns related to gas interchangeability and appli-ances are those that impact health and safety. Release of excessive amouncWobbe potentially raises the firing rate of the appliance beyond the overfire test conditions allowed by design and under the safety certification regime. The most restrictive of these overfire tests is a test for excessive carbon monoxide produc-tion at 6.25 percent above the nameplate firing rate, which is test required for residential boilers and water heate Clethal. Excessive carbon monoxpsome space heaters and fireplaces, nearly all ranges and ovens, and direct-fired air heaters. As discussed in Appendix D, Wobbe is a reasonably good predictor of carbon monoxide production. However, as can be seen in the diagrams in Ap-pendix D, carbon monoxide production can increase dramatically with small changes in Wobbe when the appliance is initially not properly adjusted or when moving from a gas at one Wobbe extreme (e.g. 1,269) to another (e.g. 1,403). Unlike many newer furnaces, some older furnaces still used in the U. S. today do not have the safety devices such as pressure switches and temperature limits that require that the furnace be installed with the temperature rise within the rise range and on or nearly on rate, in order to function properly. For a newer product, such an excursion would be a nuisance outage, but for an older prod-uct, this would be a safety hazard. Since appliance safety testing in the U. S. relies on “point” gases rather than “limit” gases, safe appliance design is proven during testing only around that point. The safety of the appliance is further proven by its field experience and qualification testing, which historically has involved natural gas that generally lies within the a range of 1,269 to 1,403 Wobbe, but which probably has fluctuated only within a range within 2 percent of a local baseline (or narrower) during its lifetime.
42

White Paper on Natural Gas Interchangeability And Non-Combustion End Use
Unvented appliances sold nationally and not adjusted during commissioning ex-perience up to 5% variation in Wobbe relative to the Wobbe at which they were safety-certified. Unvented appliances that have been properly adjusted during
Carbon monox m vented appliances (furnaces, boilers, water heaters) is less of a concern from a health and safety standpoint since the carbon monoxide
ly operating system. However, in the case of a enting system failure or blockage, combustion products can be inadvertently
nition of items such as paper towels on the ounter top due to overfiring, especially if the burner input originally performed
ithin the certified range of the appliance (+/-6 percent from Test Gas “A”)
hat do not meet local or regional NOx emissions standards can be pre-ented from being installed or can be removed from service. Verification of NOx
installation, but which were installed at the extremes of the U. S. range will need to remain within 5% of the Wobbe value in order to avoid previously unexperi-enced increases in carbon monoxide generation.
ide fro
is vented outdoors in a propervintroduced into the occupied space. It is advisable to maintain carbon monoxide generation at levels below 400 ppm, air-free (i.e., in undiluted combustion prod-ucts), which is the level required by appliance safety standards for vented heat-ing appliances.
Fire can result from excessively high appliance or surface temperatures igniting surrounding objects or from flame rollout. Surface burners could also pose a fire hazard such as clothing ignition and igcnear the limit of test tolerances with Test Gas “A.” In the case of appliances with an enclosed combustion chamber, fires due to high surface temperatures or flame rollout are not a concern for gases with Wobbe values within the a range of +/-12 percent of Test Gas “A.” Explosion results from a buildup, then delayed ignition, of uncombusted natural gas in a confined space such as a combustion chamber or oven. Poor ignition properties caused by low Wobbe numbers can be to blame. Maintaining Wobbewposes no incremental explosion risk, as long as ignition parameters remains within a range that guarantees reliable ignition and stable flame in partially pre-mix burners.
C.2.7.2.4 Environmental Some types of appliances in California and Texas are covered by stringent regu-lations on emissions of nitrous oxides (NOx) that contribute to the formation of ground-level ozone. U. S. NOx emissions are quite strict, and because of the de-sign of U. S. regulations, there is constant pressure on burner designs to achieve lower and lower NOx limits. For a given appliance design, changes in gas compo-sition, apart from Wobbe, can have unpredictable effects on NOx formation. Ap-pliances tv
43

White Paper on Natural Gas Interchangeability And Non-Combustion End Use
emissions in the field is only practical, and only practiced, for high input com-mercial appliances. Each NOx element is carefully designed for particular combinations of flame temperature and energy output, and even subtle changes in either of those two characteristics can rapidly deteriorate the element and emissions performance.
ere is no recognized indicator based on gas composition or characteristics that Thaccurately predicts NOx formation in new appliances designs.
44

White Paper on Natural Gas Interchangeability And Non-Combustion End Use
C.3 Power Generation
The natural gas supply profile in North America is shifting due to the narrowing gap between supply and demand. As a result, domestic supply sources may not be processed to historical levels due to fluctuation in natural gas liquid (NGL) market conditions. Unprocessed gas supplies result in an increase in higher hy-drocarbons coupled with an increase in hydrocarbon dew point (HDP). In addi-tion, increased LNG imports, which also may contain higher hydrocarbons, will be necessary to meet future demand. The transition from historical fuel composi-tions to the evolving fuel profile including unprocessed gas as well as LNG im-ports has presented some technical challenges for all stakeholders including the power generation industry. Recognizing these challenges, the Natural Gas Coun-cil has formed two technical task groups to address both the hydrocarbon dew point and the natural gas interchangeability issues associated with both LNG im-ports and unprocessed domestic supplies. According to the Energy Information Agency, electric power generation con-sumed nearly 23% of the natural gas used in the United States in 2003. Fur-thermore, industrial applications, which include power generation (other than by electric utilities), consumed nearly 32% of the U.S. natural gas in 2003. This highlights the importance and large role of power generation applications as an end user of natural gas. This appendix will mainly focus on the effects of natural gas fuel composition on combustion in gas turbines, though the same issues ex-ist for non-gas turbine power generation devices. However, the high pressures and temperatures of gas turbine combustors generally exacerbate these issues and create additional problems. A survey of gas turbine operators and equipment manufactures indicates that more than 85% of the gas fired capacity built since 1995 (>200,000 MW) has some version of a lean-premixed combustion system. There have been increas-ing issues with modern gas turbine performance as a result of changing gas quality, even though the fuel specifications of the original equipment manufac-turers (OEM) are generally fairly broad. The advent of lean-premixed combus-tion in the power generation industry has changed the stability range of these machines as compared with older, diffusion flame combustion systems. This movement has also changed the sensitivity of these machines to fuel composi-tion. The physics and chemistry of lean-premixed combustion makes dry, low emission (DLE) gas turbines more sensitive to the composition of fuel than tradi-
Mike Klassen, Combustion Science and Engineering
C.3.1 Introduction
45

White Paper on Natural Gas Interchangeability And Non-Combustion End Use
tional diffusion flame syste s been adopted by other combustion technologies that face regulation for pollutant emissions. A change in composition effects fundamental thermo-physical and chemical properties of the fuel, as w rocess. The changes in these properties manifest th mselves in various phenomena, includ-ing lean blowout, autoignition, and elevated CO and NOx emissions. Also, even
ests premixed combustion, since perfect premixing is usu-lly hard to attain, the level of premixing can also have a significant effect on the
he gas turbine was initially developed for aircraft propulsion, where the com-
tants, primarily carbon monoxide (CO) and ni-ogen oxides (NOx), than their aero counterparts at very high thermal efficien-
ms. Similar technology ha
ell as the chemical kinetics of the combustion pe
though the name suggaNOx emissions. This appendix will focus on the role of natural gas composition on gas turbine operations including machine life and pollutant emissions production. It is in-tended to inform stakeholders of the relevant technical issues in the ongoing process of building consensus on standards for natural gas quality and inter-changeability. This paper provides the technical guidance necessary to help as-sess the impact of natural gas composition on both combustion stability and emissions of modern combustion turbines. C.3.2 Background Tpact size and high thrust of this technology are quite desirable. Similar designs to those used for propulsion, known as aero-derivatives, have been used for sta-tionary electrical power generation. Gas turbine technology is also widely used for compression, replacing reciprocating engines, in the transportation of natural gas. However, most large industrial gas turbines have different designs than those used for propulsion. These stationary gas turbines take advantage of the less restrictive size and weight requirements of ground-based operation to pro-vide more power generation capability, while enhancing the combustion process. This has allowed stationary power generation gas turbines to achieve much lower emissions of regulated pollutrcies.
46

White Paper on Natural Gas Interchangeability And Non-Combustion End Use
Natural Gas Distribution Main
Combustor
Filter
Exhaust Gas
Air
Fuel
Compressor Turbine
Heat Recovery Steam
Selective Catalytic Reduction
Generator (Scrubber)
Figure C.3.1 Schematic of a combined cycle gas turbine plant.
Figure C.3.1 is a schematic of a generic combined cycle power generation gas
rbine plant. Natural gas is obtained from the pipeline and, together with the from a compressor, is burned to produce the working fluid
spin the turbine and produce electricity. The high temperature exhaust from
atures are kept high enough to convert the carbon monoxide to carbon ioxide (CO2). The goal of the dilution zone is to alter the combustion gases to a
temperature suitable for the metal blades of the turbine, where the energy is ex-tracted from the hot gases. Gas turbine engine combustors vary in design and methods in which the fuel and air are combined. The region where the air and fuel are combined and its rela-tionship to where combustion takes place can have dramatic effects on the level of pollutant production. Various combustion modes are found in gas turbine combustors designs, including diffusion, lean-premixed, catalytic, and rich-
tuhot, high pressure air tothe turbine can be used to create steam for use in an industrial process or in a steam generator to produce additional electrical power (combined-cycle power plant). In some instances, the exhaust gases are passed through a scrubbing section to reduce the pollutant emissions. The exhaust gases are then released to the atmosphere via an exhaust stack. Figure C.3.2 shows the main zones of a generic combustor. Fuel and air are fed through nozzles, and in most cases, swirlers are used to provide flame holding and better mixing. A high temperature area, where the primary fuel oxidation reactions occur, exists in the primary zone, and the flame is usually stabilized in a recirculation zone created by either a bluff body or some other fluid dynamic method. Addition of air in the intermediate zone lowers the temperature, but temperd
47
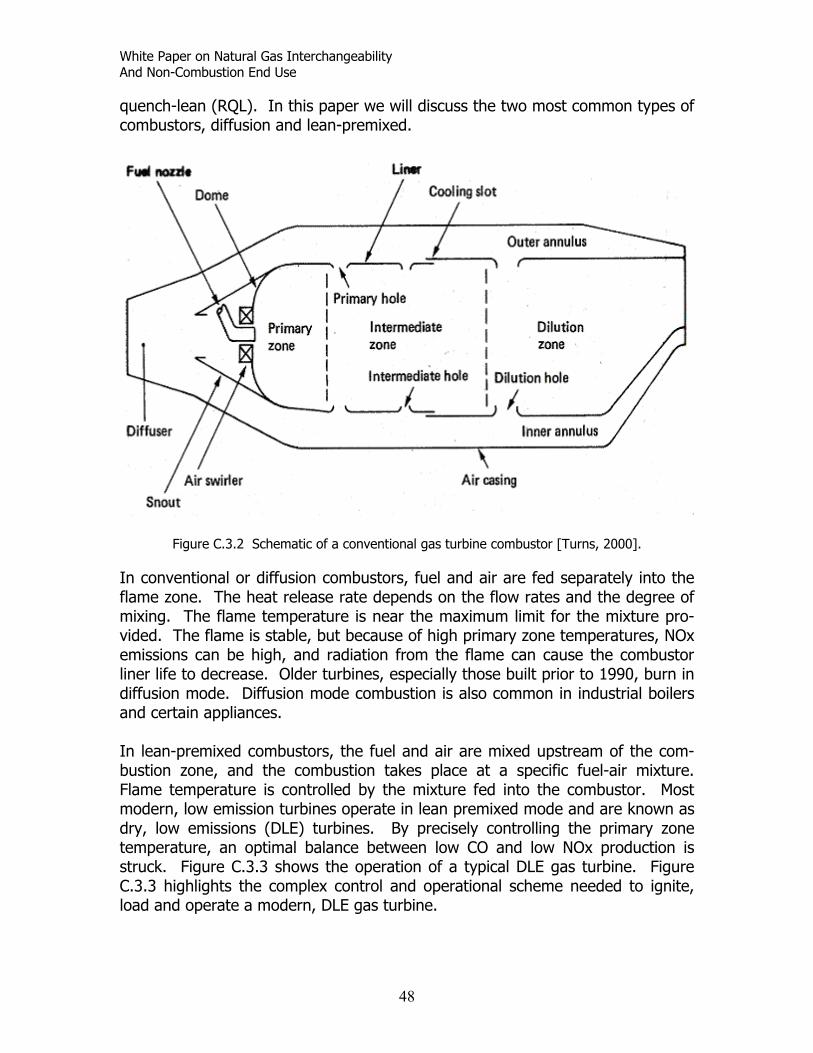
White Paper on Natural Gas Interchangeability And Non-Combustion End Use
48
quench-lean (RQL). In this paper we will discuss the two most common types of combustors, diffusion and lean-premixed.
s on the flow rates and the degree of
es operate in lean premixed mode and are known as
Figure C.3.2 Schematic of a conventional gas turbine combustor [Turns, 2000].
In conventional or diffusion combustors, fuel and air are fed separately into the lame zone. The heat release rate depend
fmixing. The flame temperature is near the maximum limit for the mixture pro-vided. The flame is stable, but because of high primary zone temperatures, NOx emissions can be high, and radiation from the flame can cause the combustor liner life to decrease. Older turbines, especially those built prior to 1990, burn in diffusion mode. Diffusion mode combustion is also common in industrial boilers and certain appliances. In lean-premixed combustors, the fuel and air are mixed upstream of the com-bustion zone, and the combustion takes place at a specific fuel-air mixture. Flame temperature is controlled by the mixture fed into the combustor. Most
odern, low emission turbinmdry, low emissions (DLE) turbines. By precisely controlling the primary zone temperature, an optimal balance between low CO and low NOx production is struck. Figure C.3.3 shows the operation of a typical DLE gas turbine. Figure C.3.3 highlights the complex control and operational scheme needed to ignite, load and operate a modern, DLE gas turbine.

White Paper on Natural Gas Interchangeability And Non-Combustion End Use
Figure C.3.3 Schematic of DLE combustor in different operational modes [Lefebvre, 1998].
49
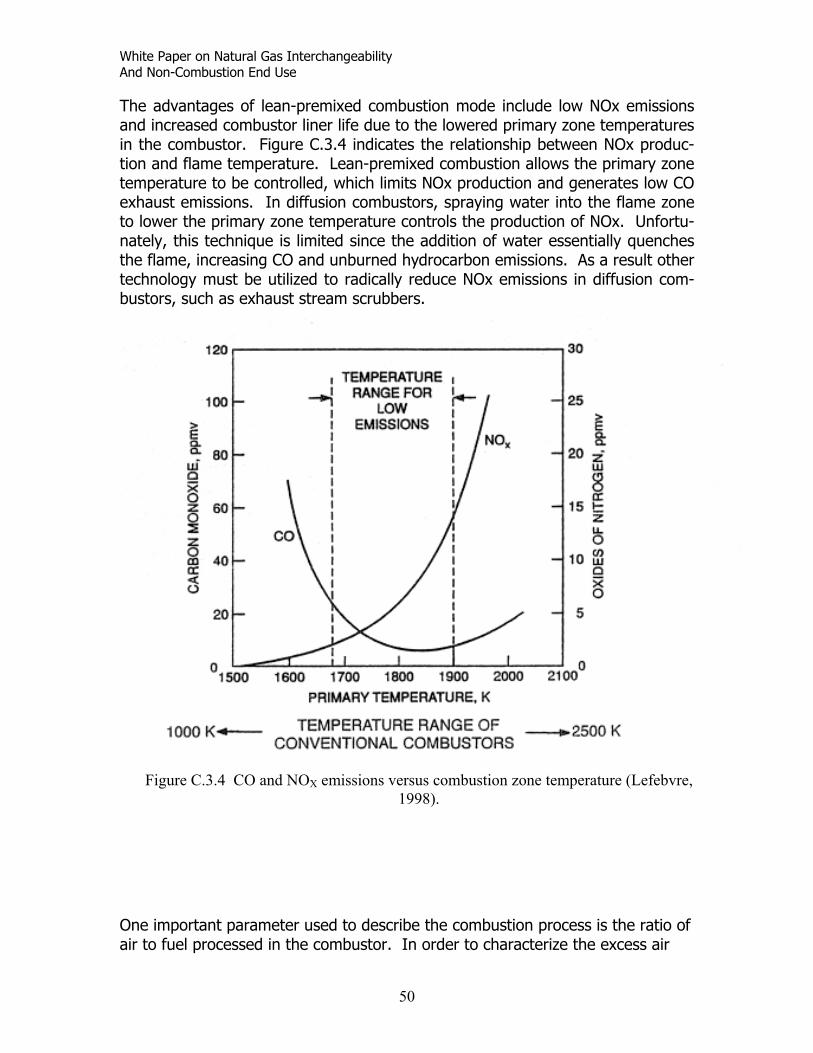
White Paper on Natural Gas Interchangeability And Non-Combustion End Use
The advantages of lean-premixed combustion mode include low NOx emissions and increased combustor liner life due to the lowered primary zone temperatures in the combustor. Figure C.3.4 indicates the relationship between NOx produc-tion and flame temperature. Lean-premixed combustion allows the primary zone temperature to be controlled, which limits NOx production and generates low CO exhaust emissions. In diffusion combustors, spraying water into the flame zone to lower the primary zone temperature controls the production of NOx. Unfortu-nately, this technique is limited since the addition of water essentially quenches the flame, increasing CO and unburned hydrocarbon emissions. As a result other technology must be utilized to radically reduce NOx emissions in diffusion com-bustors, such as exhaust stream scrubbers.
ir to fuel processed in the combustor. In order to characterize the excess air
Figure C.3.4 CO and NOX emissions versus combustion zone temperature (Lefebvre, 1998).
50
One important parameter used to describe the combustion process is the ratio of a
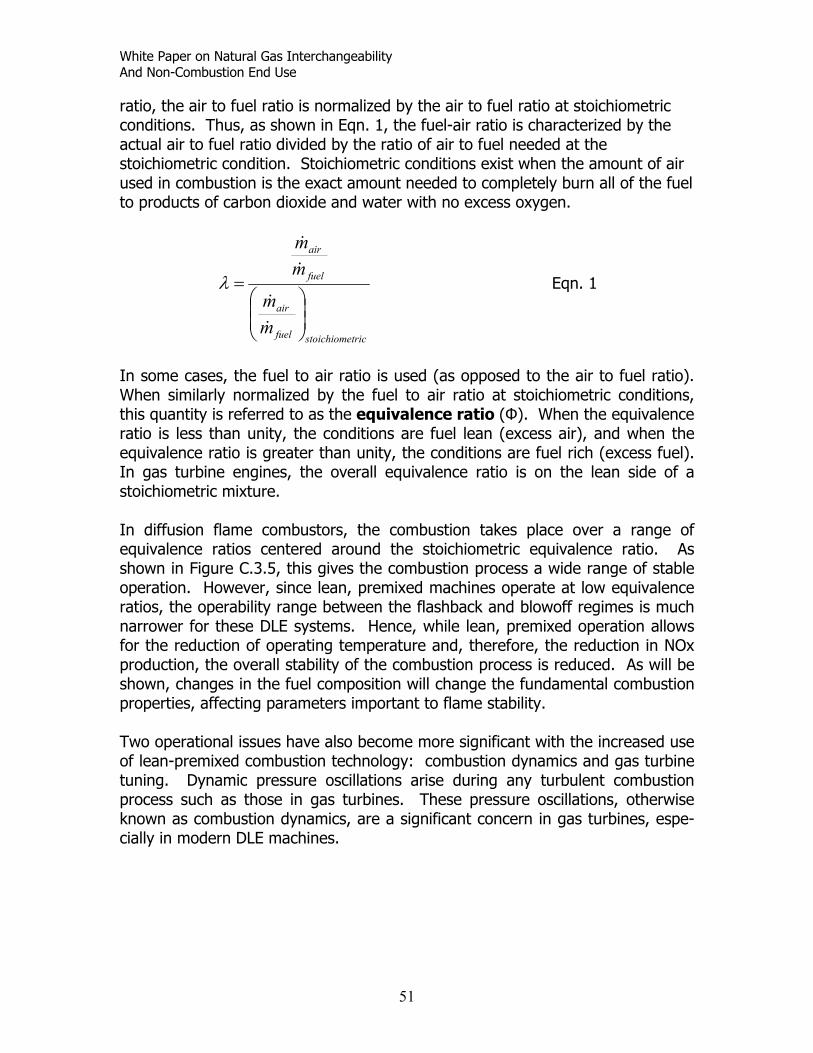
White Paper on Natural Gas Interchangeability And Non-Combustion End Use
ratio, the air to fuel ratio is normalized by the air to fuel ratio at stoichiometric conditions. Thus, as shown in Eqn. 1, the fuel-air ratio is characterized by the actual air to fuel ratio divided by the ratio of air to fuel needed at the stoichiometric condition. Stoichiometric conditions exist when the amount of air used in combustion is the exact amount needed to completely burn all of the fuel to products of carbon dioxide and water with no excess oxygen.
air
fuel
air
m
mm
=
&
&
&
λ Eqn. 1
tricstoichiomefuelm
&
In some cases, the fuel to air ratio is used (as opposed to the air to fuel ratio). When similarly normalized by the fuel to air ratio at stoichiometric conditions, this quantity is referred to as the equivalence ratio (Φ). When the equivalence ratio is less than unity, the conditions are fuel lean (excess air), and when the equivalence ratio is greater than unity, the conditions are fuel rich (excess fuel). In gas turbine engines, the overall equivalence ratio is on the lean side of a stoichiometric mixture. In diffusion flame combustors, the combustion takes place over a range of equivalence ratios centered around the stoichiometric equivalence ratio. As shown in Figure C.3.5, this gives the combustion process a wide range of stable operation. However, since lean, premixed machines operate at low equivalence ratios, the operability range between the flashback and blowoff regimes is much narrower for these DLE systems. Hence, while lean, premixed operation allows for the reduction of operating temperature and, therefore, the reduction in NOx production, the overall stability of the combustion process is reduced. As will be shown, changes in the fuel composition will change the fundamental combustion properties, affecting parameters important to flame stability. Two operational issues have also become more significant with the increased use of lean-premixed combustion technology: combustion dynamics and gas turbine tuniprocess such as those in gas turbines se pressure oscillations, otherwise known as combustion dynamics, are a significant concern in gas turbines, espe-ially in modern DLE machines.
ng. Dynamic pressure oscillations arise during any turbulent combustion . The
c
51

White Paper on Natural Gas Interchangeability And Non-Combustion End Use
T
Figure C.3.5 Flamturbines have w
Combustion dynaoften called humcause the gas turterm exposure tohardware. The melivery system, t
manner to changtype, and fuel injflame location duics.
dthe turbine, act aresonate violentlyoscillations can bfailure [Hubbard lead to increasedThe amplitude an
Diffusion GT
Premixed (DLE) G
e regimes as a function of fuel-oxygen ratio. Conventional or diffusion gas ider stability limits than premixed (DLE) gas turbines (Glassman 1996).
mics can be exhibited as audible noise from the gas turbine, ming or chugging. If excessive, the pressure oscillations can bine to shut down in order to avoid catastrophic damage. Long pressure oscillations will reduce the lifetime of gas turbine ajor components of the combustion system, including the fuel he premixer, the combustion chamber and the initial portion of
f combustion instabilities depend in a sensitive
es in operating conditions including: inlet temperature, fuel ector and burner geometry. Changes in flame speed or stable e to changes in fuel composition can induce combustion dynam-
s an acoustic chamber which under the proper conditions can [Correa, 1998]. Even at low levels, self-excited combustion ecome large enough to cause excessive wear and component and Dowling, 2000]. These combustion instabilities can also emission of NOx and unburned hydrocarbons [Ni et al., 2000]. d frequencies o
52

White Paper on Natural Gas Interchangeability And Non-Combustion End Use
Gas turbines have the ability to operate on a wide range of gaseous fuels. Sta-ble operation of gas turbines has been demonstrated over a wide range of heat-ing values. However, this operation requires a gas supply with a consistent composition. Virtually all lean, premixed, low emissions gas turbines are “tuned” to be optimized for the local gas supply. Tuning of the machine entails the ad-justment of fuel and air flows across a variety of machine loading levels to opti-mize performance, while minimizing emissions and combustion dynamics. Once tuned, these turbines operate best on a limited range of gas properties. If the gas properties change significantly, the turbines can usually be adjusted to oper-ate on the new gas composition, given sufficient advanced warning of the change. The amount of time necessary to perform the tuning, and the cost of the machine modifications can vary depending on the change in the operating conditions. For minor changes in operating conditions, including variation in the environmental conditions (e.g. changes in atmospheric temperature due to sea-sonal variations), accomplished in less than a day. More substan-tial changes, such t changes, in gas composition can require several days of machine outage and expenses ranging up to $100K. Very radical changes in fuel composition could require retrofitting the gas turbine with new
ould require significant outage time and cost several million dollars per machine. Currently, lean, premixed, low emissions gas turbines can-not respond to significant, short-term changes in natural gas properties while re-taining stable, low emissions operation. The degree of change that is significant is dependent upon which component of the gas is changing, with some deleteri-ous effects occurring with relatively small changes while other changes in com-po
tuning can be as significan
hardware, which w
sition can be much larger with minimal impact.
C.3.3 Natural Gas Composition Processed natural gas is comprised primarily of methane (CH4), but it does con-tain higher hydrocarbons such as ethane (C2H6), and propane (C3H8) and larger hydrocarbons that are characterized by the number of carbons as C4, C5, C6+ etc. In some cases, it also contains hydrogen (H2), carbon dioxide (CO2), nitro-gen (N2), oxygen (O2), sulfur compounds, and water. Unprocessed natural gas is typically richer in higher hydrocarbons such as C6+. With liquefied natural gas, impurities such as water, CO2 and heavy hydrocarbons (C5+) are removed dur-ing processing. However, LNG imports may contain varying concentrations of C2 and C3 components that result in elevated heating values relative to traditional domestic supplies.
53

White Paper on Natural Gas Interchangeability And Non-Combustion End Use
Table C.3.1 shows the range of composition of natural gas supplies in the U.S. as determined by the Gas Research Institute in 1992. As can be seen in Table C.3.1, natural gas in the U.S. generally has very high methane content and this milestone study suggests that the gas supply has
Mean Minimum * Maximum * 10th Percentile 90th Percthane Mole % 93.9 74.5 98.1 89.6 96.5ane Mole % 3.2 0.5 13.3 1.5 4.8pane Mole % 0.7 0 2.6 0.2 1.2 + Mole % 0.4 0 2.1 0.1 0.62 + N2 Mole % 2.6 0 10 1 4.3ating Value MJ/m3 38.46 36.14 41.97 37.48 39.03ating Value BTU/scf 1033 970 1127 1006 1048ecific Gravity 0.598 0.562 0.698 0.576 0.623bbe Number MJ/m3 49.79 44.76 52.85 49.59 50.55bbe Number BTU/scf 1336 1201 1418 1331 135
/Fuel Ratio Mass 16.4 13.7 17.1 15.9 16./Fuel Ratio Volume 9.7 9.1 10.6 9.4 9.9lecular Weight g/mol 17.3 16.4 20.2 16.7 18tical Compression Ratio 13.8 12.5 14.2 13.4 14thane Number 90 73.1 96.2 84.9 93.5er Flammability Limit Volume % 5 4.56 5.25 4.84 5.07rogen:Carbon Ratio 3.92 3.68 3.97 3.82 3.95
ithout peakshaving
able C.3.1 Concentrations of fuel constituents for natural gas in the United States. [Liss, 19T 92]
been relatively consistent in
HeHeSpWoWo 7Air 8AirMoCriMeLowHyd* w
composition, especially in a given region and point of consumption. Conse-uently, most gas turbines have been ‘tuned’ for operation on a given fuel com-
iability of natural gas composition worldwide nd includes a ‘typical’ U.S. gas composition for comparison. Table C.3.2 shows
e that does not allow the operator to make an on-line ad-justment to the changing composition.
entileMeEthProC 4CO
qposition. Table C.3.2 shows the varathat most LNG imports will have considerably higher concentrations of C2, C3 than typically found in the U.S. when gas processing is occurring at historically high levels. Source to source fuel composition variation can lead to changes in thermo-physical and chemical properties of natural gas. These changes in prop-erties over a short period of time can lead to operational problems in gas turbine engines. A significant change in natural gas composition can lead to irregular heat release rate, change in operational temperature, autoignition of the natural gas, lean blowout in dry low NOx (DLE) combustors, flame speed irregularities, and exceedence of emissions limits. Such a change is significant when it takes place on a time scal
54

White Paper on Natural Gas Interchangeability And Non-Combustion End Use
Table C.3.2 Fuel composition from various fuel sources around the world.
Source: Siemens-Westinghouse Power Corporation
.3.4 Interchangeability
as turbines that are prevalent today. ence, a more robust definition of interchangeability has recently been created
to better account for the specific issues that end-users face.
C The American Gas Association has created the following criteria for interchange-ability of various gas compositions.
“American Gas Association (AGA) classifies two gases as ‘inter-changeable’ if flame characteristics are the same after the sub-stitution of one gas for another. Two gases are considered in-terchangeable if the flame does not lift, yellow tip, or flashback. The AGA precision burner is used to create lifting, yellow tip-ping, and flashback curves for various natural gas compositions. (Gas Engineers Handbook, 1974)”.
The natural gas industry has performed interchangeability studies in the past. However, these studies have mostly focused on industrial diffusion flame burners and partially premixed home appliances. The result of these studies is a com-prehensive mapping of parameter space (composition, air-fuel ratio, heat re-lease) as it applies to industrial diffusion flame burners. These studies took place before the advent of lean-premixed gH
55
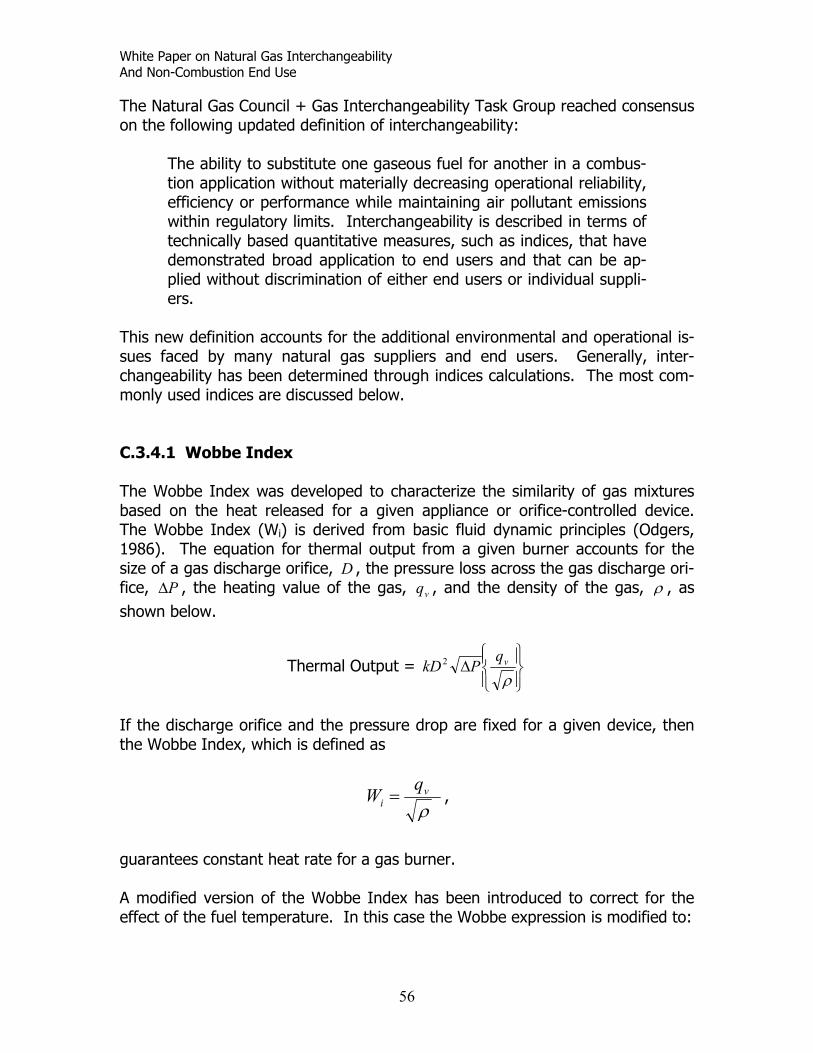
White Paper on Natural Gas Interchangeability And Non-Combustion End Use
The Natural nsensus on the following updated definition of interchangeability:
The ability to substitute one gaseous fuel for another in a combus-tion application without materially decreasing operational reliability, efficiency or performance while maintaining air pollutant emissions within regulatory limits. Interchangeability is described in terms of technically based quantitative measures, such as indices, that have demonstrated broad application to end users and that can be ap-plied without discrimination of either end users or individual suppli-ers.
This new definition accounts for the additional environmental and operational is-sues faced by many natural gas suppliers and end users. Generally, inter-changeability has been determined through indices calculations. The most com-monly used indices are discussed below.
.3.4.1 Wobbe Index
ped to characterize the similarity of gas mixtures ased on the heat released for a given appliance or orifice-controlled device.
tput from a given burner accounts for the ize of a gas discharge orifice, , the pressure loss across the gas discharge ori-
fice,
Gas Council + Gas Interchangeability Task Group reached co
C The Wobbe Index was develobThe Wobbe Index (Wi) is derived from basic fluid dynamic principles (Odgers, 1986). The equation for thermal ous D
∆ ρP , the heating value of the gas, vq , and the density of the ga below.
Thermal Output =
∆ρvqPkD 2
s, , as shown
the discharge orifice and the pressure drop are fixed for a given device, then e Wobbe Index, which is defined as
Ifth
ρv
iqW = ,
guarantees constant heat rate for a gas burner. A modified version of the Wobbe Index has been introduced to correct for the ffect of the fuel temperature. In this case the Wobbe expression is modified to:
e
56

White Paper on Natural Gas Interchangeability And Non-Combustion End Use
TρTqW refv
i =
where ly. In anothe Wobbe ssure. Histori he in-tercha y of gases. However this index, as a stand-alone test, is more ap-ropriate for diffusion flame combustors. Application of the index for computing
less stable combustion regime, so heat te alone will not be a sufficient constraint to guarantee consistent operation.
.3.4.2 Weaver Indexes
eat Release (JH)
Tref and T are the reference and delivery temperatures, respectiver version of the modified Wobbe Index, the Tref term is not included.
index is proportional to the heat release from a fuel at constant precally, the gas turbine industry has used Wobbe index to determine tngeabilit
pinterchangeability in lean-premixed combustors will not be sufficient without fur-ther constraints. Since diffusion flame combustors operate in a more stable combustion regime, constant heat rate is a suitable constraint on gas inter-changeability. DLE machines operate in ara C Since the Wobbe Index is only concerned with matching heat release for a given burner, other indices have been developed that monitor for interchangeability of other flame properties. The Weaver indexes compare the heat release, flame lift, flashback and yellow tipping of the proposed substitute gas relative to a ref-erence gas (Gas Engineers Handbook, 1974). H
5.0
s
a
a
s
GG
H =H
HJ
hange in Primary Air (JA) C
=sa GB
5.0
asA
GBJ
Lifting Index (JL)
−−
=a
s
a
sAL Q
QvvJJ
100100
Flashback Index (J ) F
v 4.04.1 +−= As
F JJ av
Yellow Tip Index (JY)
57

White Paper on Natural Gas Interchangeability And Non-Combustion End Use
1110
−−
+= AsAY
NNJJ
Complete Combustion Index (JI)
634.0366.0 −−= sRJJa
AI R
where: H = heating value of gas, Btu per cu ft
rate the effect of a change in gas composition by ompensating for the change in air needed for combustion at stoichiometric con-
e developed before the advent of DLE combustors, and the combustion fundamentals that apply to industrial burners (diffusion) do not apply to DLE (lean-premixed) combustors. Therefore, the fundamental properties of
nvestigated to understand how the properties of the tion in fuel mixture composition.
uel Composition on Fundamental Combustion Proper-ties As described above, the fuel composition directly affects many combustion prop-
ies include heat release rate, burning velocity, autoignition tendencies and flame temperature. These properties can directly affect gas tur-bine operation, as the combustors have been designed for specific tolerances. arge variations in these properties over a short duration of time can directly im-
nce, including emissions production, combustion dynamics and maintenance schedules. This section will review the effects of increases in
G = specific gravity of gas (air = 1.0) B = air theoretically required for complete combustion, cu ft per cu ft of
gas a and s = adjustment gas and substitute gas, respectively v = flame speed (fps) N =number of carbon atoms easily liberated by combustion per 100 mole-cules of gas, saturated hydrocarbons are assumed to have one carbon atom per molecule R= ratio of number of hydrogen atoms in the hydrocarbons only
The Weaver indexes incorpocditions. These indices were developed to create a set of calculations that could be performed easily in order to test the interchangeability of a natural gas for use in industrial and home appliances. The experiments were carried out with burners that can be classified as industrial burners with diffusion flames or a lim-ited amount of premixing. These indices wer
fuel mixtures must be re-ifuel change due to the varia
C.3.5 Effect of F
erties. These propert
Lpact turbine performa
58

White Paper on Natural Gas Interchangeability And Non-Combustion End Use
higher hydrocarbon concentrations in natural gas as it applies to basic combus-tion properties.
C.3.5.1 Air/Fuel Ratio able C.3.3 lists the fuel properties of methane, ethane, propane, as well as six atura positions having the same Wobbe index. The natural gases were
compo ons (methane, ethane, propane), and ad an arbitrarily chosen natural gas (NG1)
itio n, is calculated and tab In ordturbineratios ( atio is an
dicato r of NOx missions. The equivalence ratio in the primary zone of the combustor can also
, and an increase in CO emissions. DLE combustors
stant Wobbe index.
Tn l gas com
sed by changing the ratio of hydrocarbtoding dilution in the form of nitrogen
composition. The ideal gas densities listed are calculated at standard temperature and pressure (0˚ C, 1 atm). The air to fuel ratio at stoichiometric cond ns, taking into consideration the effect of dilution nitroge
ulated.
er to show how a change in fuel composition can effect operation in gas engines, more specifically DLE combustors, a comparison of equivalence phi) is shown for the natural gases in Table C.3.3. Equivalence rr of flame temperature, and the flame temperature is an indicatoin
eindicate if the combustor is approaching lean-blowout. Table C.3.3 shows that if a theoretical combustor is operating on NG1 with air and fuel flow rates of 100 kg/s and 3 kg/s, respectively, the equivalence ratio inside the combustor can be calculated to be 0.505. If NG1 is replaced with same mass flow rate of NG6, even though the Wobbe index remains constant, the equivalence ratio drops by 16.6 percent, to a value of 0.421. A change in natural gas composition, such as the one described above, is likely to cause a range of operational issues, such as
an-blowout, poor dynamicsleare usually tuned over a narrow range of equivalence ratios, and, therefore, must be re-tuned if the fuel composition is significantly altered.
Table C.3.3 Fuel properties for pure gases and six natural gases of con Methane Ethane Propane NG1 NG2 NG3 NG4 NG5 NG6
ethane (volume %) 100 0 0 90 85 82 79 77 75thane (volume %) 0 100 0 5 15 0 20 10 0
196
eating Value (Btu/lb) 21503 20417 19930 21222 21228 20701 21026 20708 20498eal Gas Density (STP, lb/ft3) 0.0447 0.0837 0.1228 0.0505 0.0506 0.0572 0.0528 0.0572 0.0614
3 13525.22421.56
MEPropane (volume %) 0 0 100 5 0 14.5 0 9.6Nitrogen (volume %) 0 0 0 0 0 3.5 1 3.4Lower HIdWobbe Index (Btu/ft ) 1288 1675 1980 1352 1352 1352 1352 1352A/F ratio (mass basis) 17.11 15.98 15.57 16.83 16.82 15.79 16.44 15.78 1Phi (100 lb air / 3 lb fuel) 0.513 0.479 0.467 0.505 0.504 0.450 0.484 0.450 0.Percentage Change in Phi (From NG1) 0.00 0.13 10.85 4.18 10.95 16NOT CONSTANT WOBBE
C.3.5.2 Autoignition
59

White Paper on Natural Gas Interchangeability And Non-Combustion End Use
Autoignition is the process through which a fuel-air mixture spontaneously ignites at a specified set of conditions (i.e. pressure, stoichiometry). Either a tempera-
re or a delay time can quantify autoignition. Autoignition temperature is the which a combustible mixture ignites with no external
nition source. The autoignition delay time has two components. The physical
rmed knock and can damage cylinders and pistons. In gas tur-ines, premature ignition of the fuel can cause the flame zone to shift to areas
aneous ignition rior to the flame zone.
tuminimum temperature at igdelay time is dependent on the mixing process used to mix the fuel and air to make a combustible mixture. The chemical delay time is dependent on the chemical kinetics of the specific fuel present in the mixture. Autoignition is utilized in diesel engines to ignite the fuel and power the engine. However, autoignition is not desirable in most engines, including gas turbine combustors. In spark-ignition engines, premature ignition of the fuel due to autoignition is tebnot designed to handle the heat and flame impingement. This generally leads to premature failure of the hardware and potentially to extensive damage to the machine. Figure C.3.6 shows the autoignition temperature as a function of fuel molecular weight for a range of saturated hydrocarbons. Methane has the highest autoig-nition temperature of most common hydrocarbons, and the autoignition tem-perature decreases exponentially with increasing molecular weight. If introduced as liquid droplets, the higher hydrocarbons will tend to autoignite even at very low concentrations. In the vapor phase, the introduction of C4 and higher hy-drocarbons to the natural gas can lower the autoignition temperature of the mix-ture. Significant amounts of the higher hydrocarbons in the natural gas may lower the autoignition temperature to levels similar to the temperature of the compressed air entering the premixer and combustor (i.e. compressor discharge temperature). This substantially increases the possibility of spontp
60

White Paper on Natural Gas Interchangeability And Non-Combustion End Use
61
lence ratio of the mixtures affect autoignition delay mes. Methane, ethane and propane mixtures are used to simulate various natu-
ral gas compositions. Figure C.3.7 shows the results of the chemical kinetics modeling. The vertices of the triangles represent the maximum percentage (vol-ume) of each hydrocarbon component in the natural gas mixture. Therefore, the maximum concentration of either ethane or propane present in any mixture is 20 percent. Since autoignition delay times vary by orders of magnitude from mix-ture to mixture, the data is presented on a logarithmic (base 10) plot. The loga-rithm is negative for autoignition delay times of less than unity.
Chen (2003) has conducted computational studies to show how fuel composition, temperature and equiva
Figure C.3.6. Minimum Autoignition Temperature vs. Average Carbon Chain Length (Zabetakis, 1965).
ti

White Paper on Natural Gas Interchangeability And Non-Combustion End Use
62
The kinetics modeling shows that an increase in temperature, pressure or equivalence ratio decreased autoignition delay time. This study showed that the presence of ethane and propane both reduce autoignition delay time as com-pared to pure methane and that this reduction increased with increasing C2 and C3 concentration. This result is important for the gas turbine industry, since it can be demonstrated that a large change in composition will have a significant effect on the autoignition properties of the mixture, even if the overall energy content of the fuel is within a specified range. In order to further investigate this issue, autoignition experiments and modeling must be performed for natural gases with varying fuel compositions having a constant energy content.
Figure C.3.7. Autoignition delay time vs. equivalence ratio, temperature, pressure and fuel composition. (Chen, 2003)

White Paper on Natural Gas Interchangeability And Non-Combustion End Use
C.3.5.2 Burning Velocity, Lean Blowout, and Flashback The velocity at which a flame propagates through a fuel/air mixture is dependent on the mixture composition, including the fuel components and the ratio of fuel to air. Burning velocity of the mixture is directly related to lean blowout and flashback within the combustor. Lean blowout can be defined as the point where flame extinction occurs because the rate of heat released during combustion is below the amount of heat needed to ignite a fresh fuel-air mixture entering the combustion zone (Lefebvre, 1998). The effect of molecular structure of hydrocarbons on burning velocity (some-times called flame speed) has been extensively studied (e.g. Gerstein, 1951). For the same number of carbons, up to four, it was shown that unsaturated hy-drocarbons have a higher burning velocity than their counterpart saturated hy-drocarbons. Bond type and placement are the reason for these trends.
function of eFigure C.3.8. Laminar burning velocity as a quivalence ratio and fuel type [Lefebvre,
1983].
63
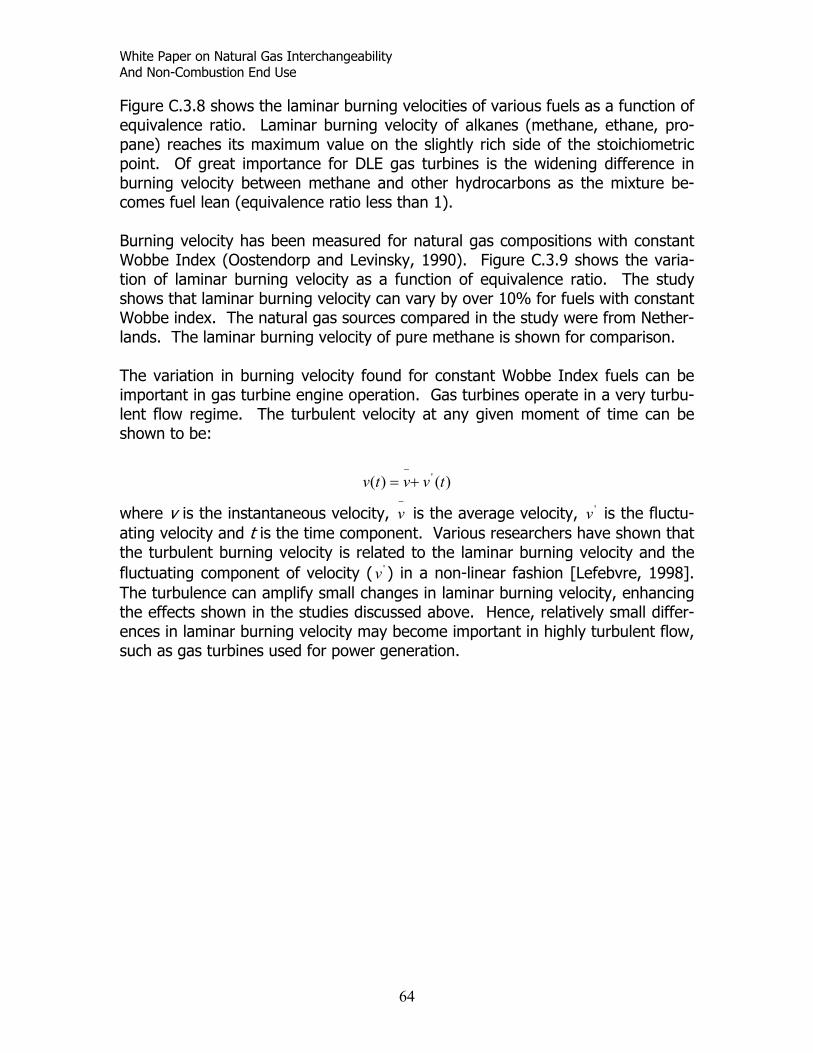
White Paper on Natural Gas Interchangeability And Non-Combustion End Use
Figure C.3.8 shows the laminar burning velocities of various fuels as a function of quivalence ratio. Laminar burning velocity of alkanes (methane, ethane, pro-
sky, 1990). Figure C.3.9 shows the varia-on of laminar burning velocity as a function of equivalence ratio. The study
can be portant in gas turbine engine operation. Gas turbines operate in a very turbu-
nt flow regime. The turbulent velocity at any given moment of time can be shown to be:
where v is the instantaneous velocity, is the average velocity, is the fluctu-ating velocity and t is the time component. Various researchers have shown that the turbulent burning velocity is related to the laminar burning velocity and the fluctuating component of velocity ( ) in a non-linear fashion [Lefebvre, 1998]. The turbulence can amplify small changes in laminar burning velocity, enhancing the effects shown in the studies discussed above. Hence, relatively small differ-ences in laminar burning velocity may become important in highly turbulent flow, such as gas turbines used for power generation.
epane) reaches its maximum value on the slightly rich side of the stoichiometric point. Of great importance for DLE gas turbines is the widening difference in burning velocity between methane and other hydrocarbons as the mixture be-comes fuel lean (equivalence ratio less than 1). Burning velocity has been measured for natural gas compositions with constant Wobbe Index (Oostendorp and Levintishows that laminar burning velocity can vary by over 10% for fuels with constant Wobbe index. The natural gas sources compared in the study were from Nether-lands. The laminar burning velocity of pure methane is shown for comparison. The variation in burning velocity found for constant Wobbe Index fuels imle
)()( ' tvvtv +=−
−
v 'v
'v
64
White Paper on Natural Gas Interchangeability And Non-Combustion End Use
40
0.7 0.8 0.9 1 1.1 1.2 1.3 1.4
Φ (Fuel/Air)/(Fuel/Air)stoichiometric
Bur 3 8
C4H10 0.141 0.131 0 0
METHANE
Burning Velocities of Various Fuels Constant Wobbe Index
45
50 The Effects of Fuel and Non-Fuel Gases on the Laminar Burning Velocity of Methane-Air Flames. D.L. van Oostendorp, and H. B. Levinsky. Journal of the Institute of Energy, December 1990, Volume 63, pp 160-166
25
30
35
ning
Vel
ocity
(cm
/s)
Constant Wobbe Index Natural Gases Wieringermeer Slochteren NGO 1 NGO 2CH4 81.709 81.315 90 86C2H6 4.034 2.770 5 0C H 0.756 0.376 0 0
10
15
20NGO 1NGO 2SlochterenWieringermeerMethane
C4+ 0.057 0.053 0 0N2 5.348 14.238 15 14CO2 7.646 0.987 0 0
s
C.3.5.3 Combustion Dynamics The introduction of DLE technology into the gas turbine industry compounded the problem of combustion dynamics. Combustion dynamics, generally present in the form of pressure fluctuations within the gas turbine combustor, can occur in any combustion device. However, the control or elimination of this problem is generally more straightforward in diffusion combustors. DLE machines are much more susceptible to this issue and in many instances combustor dynamics can limit the performance of a given gas turbine in order to maintain hardware life or meet emissions restrictions [Mongia et al., 2003]. The pressure oscillations associated with combustion dynamics can lead to ex-ternally audible tones that are damaging to workers on site. Furthermore, if the
Figure C.3.9 Burning velocities of various fuel with a constant Wobbe index. [Oostendorp and Levinsky , 1990].
Changes in burning velocity due to fuel composition differences may increase the propensity for the gas turbine to flashback or blowout un-der conditions where the machine operated normally previously. These changes can also lead to increased emissions and combustion dynam-ics, to shortened hardware lifetimes, and to increased maintenance to the machine.
65
White Paper on Natural Gas Interchangeability And Non-Combustion End Use
pressure waves become resonant, significant hardware damage can occur [Mongia et al., 2003]. Combustion dynamics occur due to the coupling of pres-sure oscillations with the energy release rate. Since the need to reduce emis-sions has caused operation of the gas turbine near the lean flammability limit, the combustion process has become inherently less stable. Janus and co-workers [1997] found that a number of factors, including fuel composition, influ-ence combustion stability for a given combustor. As shown in Figure 10, Nord and Andersen [2003] found that the change in fuel composition (shown as changes in the lower heating value (LHV)) affected the level of pressure pulsa-tions (combustion dynamics) of the machine, increasing the pressure pulsations by a factor of 50%.
C.3.6 Effect of Natural Gas po on Pollutant Emissions The introduction of gas turbine ng , premixed technology has served to lower the emissions from gas t es to 10 fold as compared to conven-tional, diffusion flame combustors (Cowell et al., 2002). Following this trend, the organizations that regulate pollutant emissions have tightened restrictions on gas turbines. Operators of gas turbines are typically required to meet strict limits on NOx and CO emissions. Furthermore, restrictions on visible plumes from exhauss
sition
leanby 8
Com
s usiurbin
t tacks are frequently invoked.
Fuel composition will play a role in the production of NOx and CO in gas turbines. To assist in this explanation, a short review of the fundamentals of NOx forma-tion will be presented.
66

White Paper on Natural Gas Interchangeability And Non-Combustion End Use
Figure C.3.10. Combustion pulsations and NO emissions as a function of fuel composition (Fuel XLower Heating Value (LHV)). Nord and Andersen (2003).
C.3.6.1 Fundamentals of NOx Formation
The collective emissions of NO and NO2 are referred to as oxides of nitrogen (NOx). NOx is generated during combustion of hydrocarbon fuels through a va-riety of mechanisms. There are five primary pathways of NOx production in the gas turbine engine combustion process: Thermal NOx, prompt NOx, NOx from the N2O intermediate reactions, fuel NOx, and NOx formed through reburning (Turns, 2000). When burning lean mixtures of natural gas, the thermal NOx and N2O intermediate pathways are of primary importance. C.3.6.1.1 Thermal (Zeldovich) NOx Mechanism Thermal (or Zeldovich) NOx is created through the oxidation of nitrogen intro-duced with the combustion air. This mechanism of NOx generation is highly temperature dependent, and the production rate is non-linear. Hence, small in-creases in temperature can lead to large increases in NOX. This trend is shown in Figure C.3.10, where the exponential nature of NOX as a function of tempera-ture is evident. The thermal NOx mechanism consists of three elementary reac-tions (Turns, 2000).
67
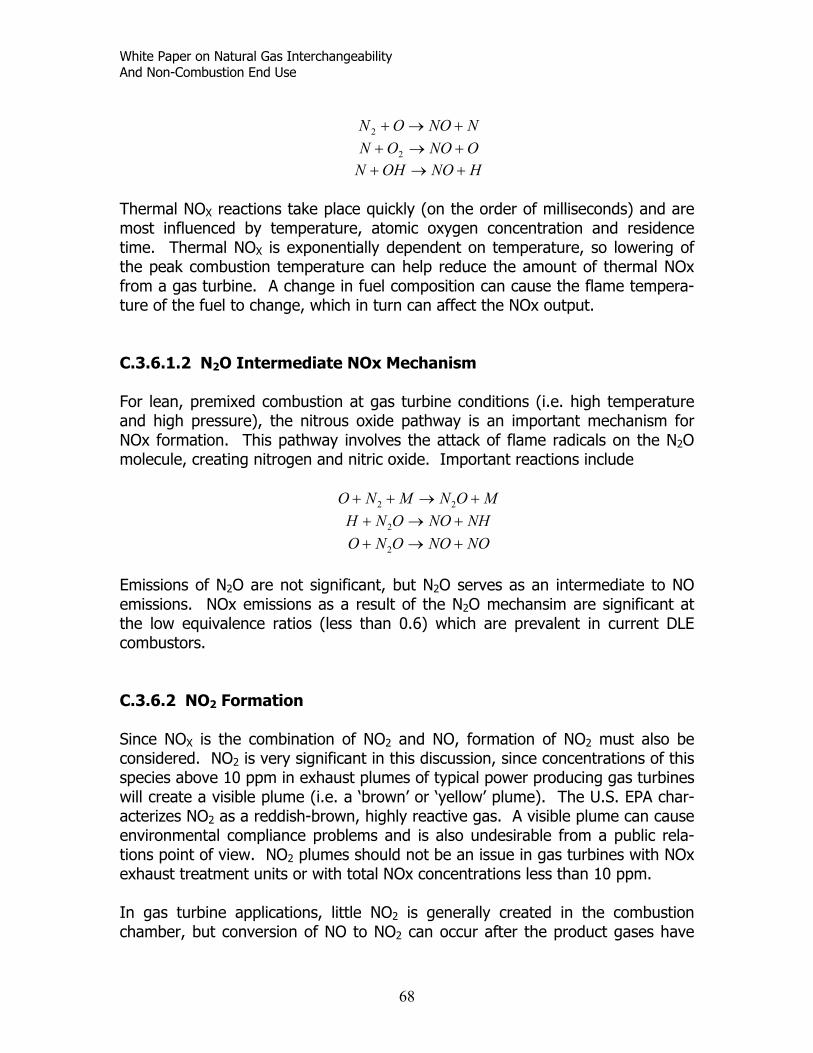
White Paper on Natural Gas Interchangeability And Non-Combustion End Use
NNOON +→+2
ONOON +→+ 2
HNOOHN +→+
Thermal NOX reactions take place quickly (on the order of milliseconds) and are most influenced by temperature, atomic oxygen concentration and residence time. Thermal NOX is exponentially dependent on temperature, so lowering of the peak combustion temperature can help reduce the amount of thermal NOx from a gas turbine. A change in fuel composition can cause the flame tempera-ture of the fuel to change, which in turn can affect the NOx output. C.3.6.1.2 N2O Intermediate NOx Mechanism For lean, premixed combustion at gas turbine conditions (i.e. high temperature and high pressure), the nitrous oxide pathway is an important mechanism for NOx formation. This pathway involves the attack of flame radicals on the N2O molecule, creating nitrogen and nitric oxide. Important reactions include
MONMNO +→++ 22
NHNOONH +→+ 2 NONOONO +→+ 2
Emissions of N O are not significant, but N O serves as an intermediate to NO
N2O mechansim are significant at e low equivalence ratios (less than 0.6) which are prevalent in current DLE
2 2
emissions. NOx emissions as a result of the thcombustors.
2
2 ce concentrations of this pecies above 10 ppm in exhaust plumes of typical power producing gas turbines
lume). The U.S. EPA char-cterizes NO as a reddish-brown, highly reactive gas. A visible plume can cause
2
C.3.6.2 NO2 Formation Since NOX is the combination of NO2 and NO, formation of NO must also be considered. NO is very significant in this discussion, sinswill create a visible plume (i.e. a ‘brown’ or ‘yellow’ pa 2
environmental compliance problems and is also undesirable from a public rela-tions point of view. NO2 plumes should not be an issue in gas turbines with NOx exhaust treatment units or with total NOx concentrations less than 10 ppm. In gas turbine applications, little NO2 is generally created in the combustion chamber, but conversion of NO to NO can occur after the product gases have
68

White Paper on Natural Gas Interchangeability And Non-Combustion End Use
left the combustion chamber. The conversion process predominately occurs at low temperatures (800– 1000 K, 980 – 1340 F), and is helped by reactions with unburned hydrocarbons and CO. Temperatures in the range of (800-1000 K) are present at some points after the exhaust gases have left the combustion cham-ber for a period of time necessary for the conversion of NO to NO2.
Proportion of NO2 to NOx as a function of fuel added and fuel type. [Hori, 1992].
NO2 formation, and especially the conversion of NO to NO2, has been an area of active study for over a decade due to the desire to eliminate the visible plumes
om power plants. As shown in Figure C.3.11, the composition of the exhaust
as compared to methane. Hence, when unburned hydro-arbons (i.e. fuel) bypass the combustion zone (which happens in all as turbines in minute amounts), the presence of higher hydrocarbons
omestic natural gas and LNG will increase the ropensity r the conversion of NO to NO2.
Figure C.3.11
frstream is critical in conversion of NO to NO2. The presence of higher hydro-carbons found in unprocessed natural gas and some LNG imports in-creases the tendency for NO2 conversion by up to several orders of magnitude cgfound in unprocessed d
fop
m-ers of these fuels were not held constant and varied by up to 15%. The overall
tion were increased by increasing the level of higher hydrocarbons. However,
C.3.6.3 Experimental and Computational Studies Flores et al. (2002) investigated the role of natural gas composition on gas tur-bine emissions using an atmospheric-pressure gas turbine combustor. Emissions from a baseline natural gas, composed mainly of methane (97%), were com-pared with this same natural gas with added ethane and propane. Wobbe nubfuel/air mixture was held constant, but the combustor temperature would change slightly with the different fuels. This study found that both NOx and CO forma-
69

White Paper on Natural Gas Interchangeability And Non-Combustion End Use
differences in operation between the laboratory gas turbine and field units may limit the usefulness of the conclusions from this work. Combustion Science & Engineering, Inc. (CSE) has developed numerous models of gas turbine combustors to assist in the design and optimization of these de-ices. These models, using a technique known as Chemical Reactor Modeling
(CRM), have been validated against operating gas turbines and make use of de-tailed chemical kinetic mechanisms to accurately predict the formation of pollut-ants. Figures C.3.12 and C.3.13 show the predicted NOx and CO from a gas tur-bine as a function of combustor temperature. Six different natural gas formula-tions, having constant Wobbe Index, were considered in the model. Experimen-tal data from an operating gas turbine (burning only one natural gas concentra-tion) is also included for comparison. The initial model was tuned to a natural gas comprised entirely of methane. All model parameters were held constant as the fuel composition was varied. All the data on these plots has been normalized at the request of the manufacturer of the equipment. However, the normaliza-tion process has not altered the trends shown by these results. As is evident from these plots, the change in natural gas composition has little effect on the production of CO from the gas turbine. However, the gas composition had more tangible effects on the production of NO , with the addition of higher hydrocar-
X
v
X
ons causing the creation of additional NO for a given combustor temperature. bFigure C.3.14 shows the change in adiabatic flame temperature for these gas mixtures that plays a role in the differences in NOX production. These effects may be minimal in some cases; however, for machines operating near their regu-lated NOx limit, the change in fuel composition could create emissions that ex-ceed permitted allowances. Unfortunately, there is very little publicly available operational data on the effect of natural gas composition on gas turbine performance. Compounding this prob-lem is the relatively wide range of acceptable fuel compositions stated and/or implied by the OEM
70

White Paper on Natural Gas Interchangeability And Non-Combustion End Use
71
Figure C.3.12. Normalized predictions of NOx in a gas turbine engine as a function of com-bustor exit temperature. Six different natural compositions of constant Wobbe Index were
used.
Figure 13. Normalized predictions of CO in a gas turbine engine as a function of combustor exit temperature. Six different natural compositions of constant Wobbe Index were used.

White Paper on Natural Gas Interchangeability And Non-Combustion End Use
fuetailof sencomEV tionan percom Unfgaslitesult C.3 Gase
Increase in Adiabatic Flame Temperature for Constant Wobbe Index FuelsConstant Inlet Temperature, Pressure, Equivalence Ratio
0
2
4
6
8
10
12
14
16
Methane NG1 NG2 NG3 NG4 NG5 NG6
Adiabatic Flame Temperature Constant Wobbe Natural Gases NG1 NG2 NG3 NG4 NG5 NG6Methane 90 85 82 79 77 75 Ethane 5 15 0 20 10 0Propane 5 0 14.5 0 9.6 19N2 0 0 3.5 1 3.4 6
Incr
ease
in A
diab
atic
Fla
me
Tem
pera
ture
(K)
le
FuelnsFigure C.3.14 Increase of Adiabatic Flame temperature for natural gas compositions of co
Wobbe Index but different chemical comtant
positions.
72
l specifications. This data is difficult to obtain since it requires real-time de-ed analysis of the natural gas coupled with real-time continuous measurement gas turbine parameters including dynamics and emissions. Nord and Ander- (2003) did present some time-resolved data on the effect of natural gas position on the emissions and combustion dynamics of an ALSTOM GT11N1-gas turbine. Measurements were made on the machine at base load opera-. Changes in the fuel composition also changed the NOX emissions, causing increase above the 15 ppm level (see Figure C.3.10). As 15 ppm was the mitted limit of NOx emission, the excursion in LHV caused the machine to be-e non-compliant for NOx emissions.
ortunately, there exists little other operational data on the effect of natural composition on NOX emissions that has been published in the peer-reviewed rature. There are some studies under consideration at this time, but the re-s are not yet available.
.6.4 Visible Plume due to NO2 Discharge
turbines without post combustion emission controls and burning fuels with s. vated higher hydrocarbon concentration have experienced NO2 visible plume

White Paper on Natural Gas Interchangeability And Non-Combustion End Use
Many times this occurs at part load operation, when the combustion efficiency may be lower than that at base load operation. The lowered efficiency allows more unburned hydrocarbons to pass through to the exhaust, enhancing the conversion o O2. However, there are instances where even at baseload operation, vis e umes due to NO2 have been observed. Table 4 shows the fuel compositions at two plants with nearly identical gas turbine hardware. Please note that both gas turbine plants were producing approximately 25 ppm NOX (i.e. NO and NO2). One plant in Asia was operating using LNG with fairly high ethane (C2) concentrations and significant propane (C3). The second plant located in North America operated with natural gas containing little higher hydro-carbons. The Asian power plant had a consistent brown plume that was not ob-served for the North American plant. Neither plant had an exhaust treatment unit. Table C.3.4 Natural Gas composition of two similar gas turbine sites. Component Plant 1
Composition (%)North America
Plant 2 Composition (%)
Asia
f NOibl
to Npl
Methane 95 89 Ethane (C2) 2 8 Propane (C3) <1 2
<1 <1 C4 + Nitrogen 2 <1 After careful analysis of all the potential differences that are likely to cause the brown plume, it was found that the differing fuel composition could explain the differences. An analysis of the propensity of each of the fuel gases to convert NO to NO2 in the exhaust was undertaken using the data provided in Figure C.3.11. The results are given in Table C.3.5. Assuming, in each case, that the concentrations of the unburned hydrocarbons mimicked those of the original fuel, the Asian plant with its higher concentrations of C2 and C3 hydrocarbons
as shown to be able to more effectively convert the NO produced in the com-
rsion of the NO to NO2.
further consequence of the conversion of NO to NO2 due to presence of higher reduction (SCR) methods for
Ox removal in exhaust gases. SCRs utilize ammonia and reduction catalysts to
wbustor to NO2. In this case the added NO2 from the Asian plant was sufficient to create a visible plume (over 16 ppm as shown in Table C.3.5) while the North American plant remained below the visible plume level. Note that the total NOX is not changed by the conve Ahydrocarbons is the effect on selective catalytic Nremove NOx from the exhaust stream of gas turbines. Studies have shown that this process is most efficient when the ratio of NO2 to NO is approximately 1:1
73
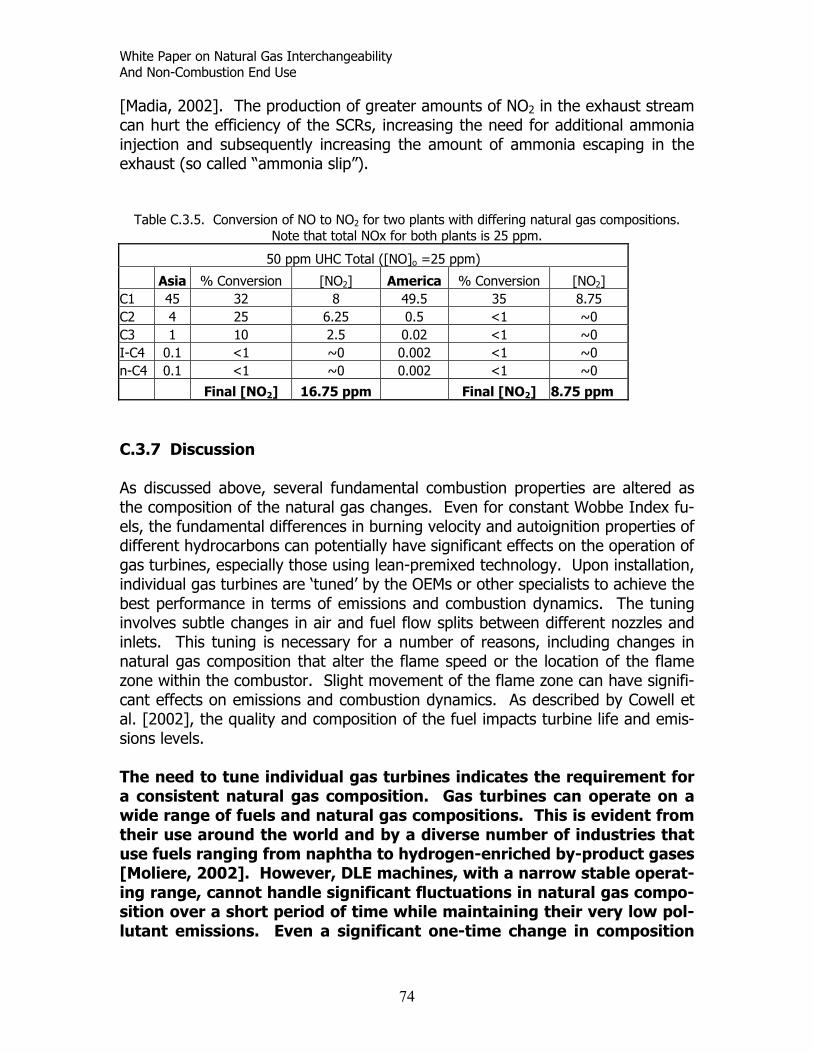
White Paper on Natural Gas Interchangeability And Non-Combustion End Use
[Madia, 2002]. The production of greater amounts of NO2 in the exhaust stream can hurt the efficiency of the SCRs, increasing the need for additional ammonia injection and subsequently increasing the amount of ammonia escaping in the exhaust (so called “ammonia slip”).
Table C.3.5. Conversion of NO to NO2 for two plants with differing natural gas compositions. Note that total NOx for both plants is 25 ppm.
50 ppm UHC Total ([NO]o =25 ppm)
Asia % Conversion [NO2] America % Conversion [NO2] C1 45 32 8 49.5 35 8.75 C2 4 25 6.25 0.5 <1 ~0 C3 1 10 2.5 0.02 <1 ~0 I-C4 0.1 <1 ~0 0.002 <1 ~0 n-C4 0.1 <1 ~0 0.002 <1 ~0
Final [NO2] 16.75 [NO2] 8.75 ppm ppm Final
As discussed ab eral the com turaels, the fun ren
C.3.7 Discussion
ove, sev fundamental combustion properties are altered as position of the na l gas changes. Even for constant Wobbe Index fu-
damental diffe ces in burning velocity and autoignition properties of ifferent hydrocarbons can potentially have significant effects on the operation of as turbines, especially those using lean-premixed technology. Upon installation, dividual gas turbines are ‘tuned’ by the OEMs or other specialists to achieve the
s. This is evident from eir use around the world and by a diverse number of industries that
dginbest performance in terms of emissions and combustion dynamics. The tuning involves subtle changes in air and fuel flow splits between different nozzles and inlets. This tuning is necessary for a number of reasons, including changes in natural gas composition that alter the flame speed or the location of the flame zone within the combustor. Slight movement of the flame zone can have signifi-cant effects on emissions and combustion dynamics. As described by Cowell et al. [2002], the quality and composition of the fuel impacts turbine life and emis-sions levels. The need to tune individual gas turbines indicates the requirement for a consistent natural gas composition. Gas turbines can operate on a wide range of fuels and natural gas compositionthuse fuels ranging from naphtha to hydrogen-enriched by-product gases [Moliere, 2002]. However, DLE machines, with a narrow stable operat-ing range, cannot handle significant fluctuations in natural gas compo-sition over a short period of time while maintaining their very low pol-lutant emissions. Even a significant one-time change in composition
74

White Paper on Natural Gas Interchangeability And Non-Combustion End Use
will require re-tuning of the machine or an expensive hardware change. This conclusion is understandable from basic combustion sci-ence and is indicated in the results of Nord and Andersen [2003]. Un-fortunately, additional published results from operating gas turbines
re scarce.
Ting environmental co es have shown a di-rect correlation betw and pressure and the level
NO Jan l. 1 e surprising or beyond lan n tha E gas turb e perfo ce woul e sensiti the natural co osition d particul o fluct ns in co sition.
d ly, the ave been erou ational es that have been attrib-t tural gas compositi chang r exam an industrial plant oper-
ing LE g access to both Russian pipeline gas and orth Sea natural gas. The machine had been tuned to run on the North Sea as, which had fairly large C2 and C3 content with approximately 82% methane.
mostly methane (over 95%). In attempting to switch from e North Sea gas to the Russian gas, the combustion dynamics were so bad
oduce very low emissions while maintaining acceptable hardware fetimes. As shown above, there are several variables important to stable opera-
a he performance of DLE gas turbines is sensitive to numerous variables, includ-
nditions. For example, numerous studieen environmental temperature
of x production (e.g. us et a 997). H nce, it is not exp atio t DL in rman d b ve togas mp an arly t uatio mpo Anec otal re h num s oper issuuted o na on es. Fo ple,at D as turbines in Germany had NgThe Russian gas wasththat the gas turbine automatically shut down to prevent severe damage to the rotating components. In this case, switching between the natural gas sources required retuning of the combustor. As described by Gottlieb and Weiler [2004], the number of occurrences of opera-tion problems due to natural gas variability is increasing. The owners and opera-tors of the gas turbines also echo this conclusion at various gas turbine user group meetings. However, the number of well-documented cases that have been made available to the public are sparse. The results presented above show that the Wobbe Index alone is not sufficient to guarantee interchangeability of natural gases for modern DLE gas turbines. The complex combustion systems of these machines are designed to prlition of these gas turbines, such as burning velocity and air to fuel ratio, that are not captured by Wobbe Index. Therefore, additional parameters must be used in order to assure that future natural gases of varying composition meet the fuel requirements of modern gas turbines. Such parameters might have broadly ac-ceptable values nationally, but more restrictive values within a given region to assure that frequent retuning of gas turbines is not required. It is important to note that stakeholders throughout the industry generally rec-ognize that Wobbe alone is not sufficient to demonstrate interchangeability.
75

White Paper on Natural Gas Interchangeability And Non-Combustion End Use
Studies involving residential appliances typically conclude that additional combus-tion performance parameter(s) are recommended to adequately describe fuel gas interchangeability. Unfortunately, combustion testing involving gas turbines is typically not included in these studies.
ns. Significant changes in natural gas composition over a short period of time, beyond
ustors; therefore, when changes in fuel composition begin to increase NOx emissions, gas turbines and other
ion properties of the fuel, espe-cially the burning velocity and propensity for autoignition;
needed to assure interchangeability of natural gas for modern gas turbines. More data and
C.3.8 Recommendations and Conclusions
• Modern combustion equipment used in power generation, including DLE gas turbines have very complicated combustion systems whose operation depends on the composition of the fuel supply both to maintain accept-able hardware life and to ensure low pollutant emissio
what equipment is “tuned” to receive, may have a substantial detrimental effect on the operation of DLE gas turbines through increased emissions, shorter hardware lifetime, and less reliable electric power generation.
• Although modern gas turbines and other power generation equipment can operate on a wide variety of different gaseous fuels, they are tuned to a narrow range of gas compositions during installation and must be “re-tuned” in order to maintain low emissions and stable, reliable operation if the gas composition is changed significantly.
• There is an inherent trade-off between NOx and combustion dynamics for modern lean, premixed comb
combustion equipment will be forced to change operations to remain in compliance with emissions permits. These operational changes may result in reduced hardware life and plant reliability.
• Increases in heavier hydrocarbons: o Change the fundamental combust
o Have a significant impact upon the conversion of NO to NO2, thus increasing the risk of visible plumes on non-SCR units, particularly at partial load conditions;
o A relatively small change in heavier hydrocarbon concentration is enough to cause these changes.
• For power generation plants with selective catalytic reduction (SCR) sys-tems for NOx control, increased NO2 can result in reduced catalyst effi-ciency and increased ammonia slip.
• Wobbe Index is not sufficient to characterize interchangeability of natural gas fuels for modern gas turbines. A metric that characterize changes in flame speed and stoichiometric air fuel ratio will likely be
analysis is necessary to identify the right indices and their appropriate al-lowable ranges.
76
White Paper on Natural Gas Interchangeability And Non-Combustion End Use
• Original Equipment Manufacturers (OEM’s) need to better define fuel specifications in meeting performance guarantees to account for potential variations in higher hydrocarbons in fuel supplies.
• Additional research and/or operational experience are needed to better understand and quantify some of the theoretical implications of varying fuel composition on DLE combustion turbines and other modern combus-
results would benefit the indus-try and policy makers in several related areas of gas composition effects tion equipment. Research with published
on this equipment.
77
White Paper on Natural Gas Interchangeability And Non-Combustion End Use
C.3 Chen, ane and Propane Addi-tive a a, Irvine. Correabustionnational) on Combustion/ The Combustion Institute, pp. 1793-1807, 1998. Cowell, L., Etheridge, C., Smith, K. Ten Years of DLE Industrial Gas Turbine Op-erating Experiences. Proceedings of the ASME Turbo Expo. Amsterdam, The Netherlands. GT-2002-30280. 2002. Flores, R.M., McDonell, V. G., and Samuelsen, G. S. Impact of Ethane & Propane Variation in Natural on the Performance of a Model Gas Turbine Combustor. Proceedings of ASME Turbo Expo 2002. June 3-6, 2002. Amsterdam, The Neth-erlands. GT-2002-30080. Glassman, Irvin. Combustion (3rd Edition). San Diego: Academic Press. 1996. Gas Engineers Handbook (1st Edition). New York: Industrial Press. 1974 Gerstein, M., Levine, O., Wong, E. L. Fundamental flame velocities of hydrocar-bons. Industrial and Engineering Chemistry. Vol. 43, No. 12, pp. 2770-2772. 1951. Hubbard, S. and Dowling, A. P., “Acoustic Resonances of an Industrial Gas Tur-bine Combustion System”, Proceedings of the ASME TurboExpo, 2000-GT-94, Munich, Germany, 2000. Gottlieb, J. W., and Weiler, S. A., Legal & Regulatory Perspective: Gas quality a looming problem for power producers, Combined Cycle Journal, 2nd Quarter, 2004, pp 7-8. Hori, M., Matsunaga, P. C., Malte, P. C., Marinov, N. M. The Effect of Low-Concentration Fuels on the Conversion of Nitric Oxide to Nitrogen Dioxide. Twenty Fourth Symposium (International) on Combustion. The Combustion In-stitute. 1992. Janus, M. C., Richards, G. A., Yip, M. J., and Robey, E. H., “Effect of ambient conditions and fuel composition on combustion stability”, ASME/IGTI Turbo Expo, Orlando, FL, 1997.
.9 References
Junhua. Autoignition of Natural Gas Fuels with Eths t Low to Intermediate Temperature. PhD. Thesis. University of Californi
2003
, S. M., Power Generation and Aeropropulsion Gas Turbines: From Com- Science to Combustion Technology, Twenty-Seventh Symposium (Inter-
78

White Paper on Natural Gas Interchangeability And Non-Combustion End Use
Lefebvre, A. H. Gas Turbine Combustion. Philadelphia: Taylor & Francis. 1998.
2/0123, March 1992.
oliere, M., “Benefiting from the wide fuel capability of gas turbines: A review of
and Pandalai, R. P., Challenges and Pro-ress in Controlling Dynamics in Gas Turbine Combustors, Journal of Propulsion
tability in Sequential Combustion”, Proceedings of SME TurboExpo, 2000-GT-0103, Munich, Germany, 2000.
ord, L. O., Anderson, H. G. Influence of variations in the natural gas properties y-duty
as turbine. Proceedings of International Joint Power Generation Conference
, J., Kretschmer, D. Gas Turbine Fuels and their Influence on Combus-on. Kent: Abacus Press. 1986.
ity of Methane-Air Flames. Journal of Institute of En-rgy, December 1990, Volume 63, pp 160-166.
on Gas Turbine Dual Fuel, Dry Low Emission Combustion Sys-ms. Proceedings of ASME Turbe Expo 2003, Atlanta, GA. GT2003-38112.
ppli-
abetakis, M. G., Flammability Characteristics of Combustible Gases and Vapors,
mical Process for Fossil Fuel Combustion Products Recovery nd Utilization,” United States Patent 4,097,349 (1978).
Liss, W. E., Thrasher, W. H., Steinmetz, G. F., Chowdiah, P., Attari, A. Variabilityof Natural Gas Composition in Select Major Metropolitan Areas of the United States, GRI-9 Madia, G. Measures to enhance the NOX conversion in urea-SCR systems for automotive applications, Ph.D. thesis No. 14595, ETH Zurich, 2002. Mapplication opportunities”, ASME Turbo Expo, GT-2002-30017, Amsterdam, 2002. Mongia, H. C., Held, T. J., Hsiao, G. C.,gand Power, 19, pp. 822-829, 2003. Ni, A., Polifke, W., and Joos, F., “Ignition Delay Time Modulation as a Contribu-tion to Thermo-Acoustic InsA Non the combustion process in terms of emissions and pulsations for a heavg2003, June 16-19, Atlanta, Georgia, USA. IJPGC2003-40188. Odgersti Oostendorp, D. L., Levinsky, H. B. The Effects of Fuel and Non-Fuel Gases on the Laminar Burning Veloce Rokke, Petter E., Hustad, Johan E., Rokke, Nils A., Svendsgaard, Ole B. Tech-nology Update te Turns, Stephen R (2000). An Introduction to Combustion: Concepts and Acations (2nd ed.). Boston: McGraw Hill. ZU.S. Department of Interior, Bureau of Mines, Bulletin 627, 1965. Zenty, S., “Photochea
79

White Paper on Natural Gas Interchangeability And Non-Combustion End Use
C.3.10 Glossary Adiabatic Flame Temperature The theoretical maximum flame temperature that can be attained through the ombustion of a fuel. This temperature does not account for heat losses to the
xide s, and disas-
ociation of the products of combustion takes places, causing a flame tempera-
utoignition
ressure, stoichiometry).
ates through a quies-ent fuel/air mixture. In practical systems, the burning velocity is turbulent.
takes place. Com-ustion flame front is formed at the interface where fuel and air diffuse into each
.
quivalence Ratio
ir
wer an the burning velocity of the fuel/air mixture. Since the flame front traveling
place.
a laminar (stream lined) flow, mixing and transport are accomplished by mo-
csurroundings, and assumes that the products of combustion are carbon dioand water. In practical systems, heat loss occurs to the surroundingsture that is less than the theoretical maximum. A Autoignition is the process through which a fuel-air mixture spontaneously ignitesat a specified set of conditions (i.e. p Burning Velocity The burning velocity is the velocity at which a flame propagc Diffusion (Combustion) Fuel and air are mixed in the region where the combustion bother. Older gas turbines (conventional) operate in diffusion mode combustion E Equivalence ratio is the ratio of fuel to air divided by the ratio of fuel to aneeded at stoichiometric conditions. Flashback Flashback occurs when the velocity of a premixed jet of fuel/air mixture is lothbackwards into the fuel/air mixture is faster than the jet of fuel/air mixture trav-eling towards the flame, flashback takes Laminar Inlecular diffusion.
80

White Paper on Natural Gas Interchangeability And Non-Combustion End Use
Lean Blow-out
ean blowout can be defined as the point where flame extinction occurs because
) in a homogeneous mixture of el and air, that can sustain combustion when ignited, is defined as its lean
it.
remixed combustion takes place when fuel and air are mixed upstream of the d fed into the combustor as a homogeneous mixture of fuel
nd air.
to completely combust all of the fuel to the products f combustion of carbon dioxide and water is known as the stoichiometric
nd unsteady flow features enhance mixing, and in combus-on, increase the flame front.
Lthe rate of heat released during combustion is below the amount of heat needed to ignite a fresh fuel-air mixture entering the combustion zone Lean Flammability Limit The amount of fuel (usually percent by volumefuflammability lim Premixed (Combustion) Pcombustion zone ana Stoichiometric The amount of air required oamount. Turbulent (Combustion) Macroscopic eddies ati
81

White Paper on Natural Gas Interchangeability And Non-Combustion End Use
C4 Reciprocating Engines
4.1 Introduction
eciprocating internal combustion engines are a widespread and widely used
n, water pumps and a diverse set of power generation appli-ations. There are two basic types of reciprocating engines – spark ignition (SI)
). Spark ignition engines for peaking or continuous uty stationary applications over 50 kw, such as power generation, use natural
ignition engines (often called diesel engines) are primarily used in mergency generation applications, and can operate on diesel fuel or heavy (re-
can be set up to run in a dual-fuel configuration that burns rimarily natural gas with a small amount of diesel pilot fuel for ignition. Because
tionary power market below 5 MW, many pipeline compression and oil nd gas field gathering systems, and certain fleet vehicle applications.
urrent generation natural gas engines offer low first cost, fast start-up, low
ectric efficiencies of natural gas engines range om 28% LHV for stoichiometric engines7 smaller than 100 kW to more than
40% LHV for larger lean burn engines8 (>2 MW). Waste heat can be recovered from the engine exhaust and from the engine cooling systems to produce either hot water or low-pressure steam for combined heat and power (CHP) applica-tions. Overall, CHP system efficiencies (electricity and useful thermal energy) of 70% to 80% are routinely achieved with natural gas-engine systems in applica-tions whose electrical and heat loads are appropriately in balance. Natural gas engine technology has improved dramatically in the past decade, driven by environmental and economic pressures for power density improve-
Bruce Hedman, EEA
C Rtechnology. North American production exceeds 35 million units per year for automobiles, trucks, construction and mining equipment, marine propulsion, pipeline compressiocand compression ignition (CIdgas as the preferred fuel, although they can be set up to run on propane, gaso-line, or special gases such as landfill, flare, and digester gas. Stationary com-pression esidual) oil, or theypof its relatively low emissions signature and ease of operation, the natural gas-fueled engine is the engine of choice for the higher-duty-cycle (more than 500 hr/yr) staa Cemissions, proven reliability, good load-following characteristics, and significant potential for heat recovery. Elfr
7 Stoichiometric engines are designed to burn the chemically correct proportions of fuel and air needed for complete combustion, i.e., there is no excess fuel or oxygen after combustion. A rich-burn engine is a common term for a stoichiometric engine, where the air to fuel ratio is maintained at or near the correct level for complete combustion. 8 In lean-burn engines, the fuel-air mixture contains more air than is needed for complete combustion by design, allowing for cooler combustion temperatures and lower NOx emissions formation.
82
White Paper on Natural Gas Interchangeability And Non-Combustion End Use
ments (more output per increased fuel efficiency, and reduced emissions. Computer systems and software have greatly advanced reciprocating engine design and contro ced engine designs and making possible more pr gnostic monitoring of engine operation. Stationary engine manufacturers and worldwide engine R&D firms continue to drive advanced engine technology, including accelerating the diffu-
he on highway heavy duty truck market to e stationary engine market.
unit of engine displacement),
l, accelerating advanecise control and dia
sion of technology and concepts from tth The emissions signature of natural gas engines, in particular, has improved sig-nificantly in the past decade through better design and control of the combustion process and through the use of catalytic treatment of exhaust gases. Advanced lean-burn natural gas engines are available that produce NOx levels as low as 50 ppmv @ 15% reference O2 (dry basis) without the use of a post treatement cata-lyst system.
procating ngines in stationary applications in the United States is supported by a highly
bines, but the ngine maintenance can often be performed by in-house staff or provided by lo-
Potential distributed generation applications for natural gas reciprocating engines
lled so er
C.4.2 Market Trends C.4.2.1 Power Generation Applications Reciprocating engines are well suited to a variety of distributed generation appli-cations and are widely used in the United States and Europe in power-only – as well as combined heat and power (CHP) – configurations in the industrial, com-mercial, and institutional market sectors. The widespread use of reciedeveloped sales and service infrastructure. Reciprocating engines start quickly, follow load well, have good part-load efficiencies, maintain efficiency and output at increasing altitude and ambient conditions, and generally have high reliabil-ities. In many cases, multiple reciprocating engine generating sets are used to ensure overall plant capacity and maintain high levels of reliability and availabil-ity. Reciprocating engines have higher electrical efficiencies, and thus lower fuel-related operating costs than gas turbines of comparable size. In addition, the first costs of reciprocating engine generator sets are generally lower than gas turbine gensets up to 3-5 MW output range. Reciprocating engine maintenance costs per kW-hr are generally higher than equivalent-sized gas turecal service organizations.
include standby, peak shaving, grid support, and CHP applications, in which en-gine waste heat is utilized to produce hot water, low-pressure steam, or chiwater through waste-heat-fired absorption chillers. Reciprocating engines alare used extensively as direct mechanical drives in applications such as watpumping, air and gas compression, and chilling/refrigeration.
83

White Paper on Natural Gas Interchangeability And Non-Combustion End Use
C.4.2.1.1 Standby Power Standby power systems are required by fire and safety codes for hospitals, ele-vator loads, and water pumping. The standby genset is typically the simplest distributed generation system, providing power only when the primary source is out of service or falters in its voltage or frequency. This application typically re-uires low capital cost, minimal installation costs, black-start capability (ability to
owing (transient response) characteristics. Standby applications nge from a few kW to very large capacities (up to 10 MW) in industrial or utility
pplications. However, most are high-speed units under 2 MW. Diesel engines in standby applications without being required to meet
trict emissions standards, although operation is limited to a certain number of ). While primarily a diesel engine
arket, natural gas-fueled engines are increasing market share in the small
qstart when the grid supply is interrupted), and grid-isolated operation. Due to the relatively low number of operating hours typically required in standby power applications, efficiency, emissions, and variable maintenance costs are not major factors in technology selection. Diesel engines are highly preferred for standby power due to their low capital cost, rapid start-up capability (within 10 seconds), and load-follraacan typically be installed shours per year (generally 300 to 500 hoursm(<500 kW) standby market.
.4.2.1.3 Combined Heat and Power
C.4.2.1.2 Peak Shaving In certain areas, customers and utilities are using on-site power generation to reduce the cost of peak load power. Peak shaving is beneficial to customers who have poor load factors and/or high electricity provider demand charges. Typi-cally, peak shaving does not involve heat recovery, but heat recovery may be cost effective if the peak period is more than about 2,000 hours/year. Since low equipment cost and high reliability are the primary requirements, reciprocating engines are ideal for many peak-shaving applications. Emissions may be an is-sue if the annual number of operating hours is high or the operating facility is located in a non-attainment area. Where peak shaving can be combined with an-other function, such as standby or emergency power, the economics are consid-erably enhanced. Peak shaving is a growing market for natural gas engines. C While the use of natural gas engines is expected to grow in both grid support and customer peak-shaving applications, the most prevalent on-site generation application for natural gas engines has traditionally been CHP, and this trend is likely to continue due to the cost effectiveness of heat recovery and growing
84

White Paper on Natural Gas Interchangeability And Non-Combustion End Use
government recognition of the benefits of CHP. The economics of natural gas engines in on-site generation applications are enhanced by effective use of the
he exhaust gas and cooling systems, which gener-lly represents 60% to 70% of the input fuel energy.
engines and differ greatly in terms of their combus-on process and sensitivity to variations in gas composition because of their igher compression ratios. In both types of engines, control of the air-fuel ratio
rmance of the engine and emission control systems. s gas composition affects the gas density and stoichiometric air-fuel ratio, it can
thermal energy contained in ta There were an estimated 1,354 engine-based CHP systems operating in the United States in 2003, representing more than 1,425 MW of electric power ca-pacity. Facility capacities range from 30 kW to more than 40 MW, with many larger facilities comprised of multiple units. Reciprocating engine CHP is installed in a variety of industrial and commercial applications with natural gas engines representing 78% of the total installed reciprocating engine CHP capacity. C.4.3 Reciprocating Engine Technology Natural gas engines fall into two basic categories, each having fundamentally dif-ferent characteristics and implications from a gas composition perspective. Stoichiometric engines, typically derived from gasoline engines, are used in light duty cars and trucks, some medium duty vehicles, and small to medium-sized power generation applications. Lean burn engines, used in medium and heavy duty vehicles, larger power generation applications and pipeline compression, are generally derived from diesel tihis critical for optimum perfoAhave an important influence on engine performance and emissions.
• Stoichiometric Natural Gas Engines. Under stoichiometric conditions, air and fuel are balanced in the exact proportions required for complete com-bustion. These engines are generally naturally aspirated (drawing fuel and air using vacuum), and all-or nearly all-of the fuel and air are con-sumed in combustion reactions. Such engines produce an exhaust that has very little oxygen content. Closed-loop engine control systems are employed to ensure that the correct air-fuel ratio is maintained. Most modern stoichiometric light-duty vehicles use three-way catalysts to con-trol emissions. Closed-loop engine controls give these engines the ability to adapt to changes in many operating parameters, including gas con-
can be designed to accommodate a itions through the use of oxygen sen-
sumption. Stoichiometric engines relatively wide range of gas compossors in the exhaust stream and electronic fuel controls with adaptive learning capabilities. At modest compression ratios (e.g. under 12:1), most naturally aspirated, spark-ignited engines can tolerate higher ethane and propane levels without experiencing engine knock.
85

White Paper on Natural Gas Interchangeability And Non-Combustion End Use
• Lean-burn Natural Gas Engines. In contrast, most medium-and heavy-duty natural gas engines are based on lean-burn combustion, in which combustion occurs with more air (oxygen) than required to achieve com-plete combustion. Lean-burn engine technology typically uses turbo-charging to compress combustion air and fuel to maintain high specific
when higher-than-normal levels of propane and ethane components are present in the fuel. Lean-burn natural gas engines are usually derived from diesel
te diesel fuel. For natural gas, an ignition source-typically spark or pilot ignition fuel-must be added. Ignition
eters, either irectly or indirectly, and to compensate for changes by modifying the delivered
a ue Naturathree ffuel inthe simthe mcontroemissioenginethat usture, atimum The eltwo m
power output, which is usually reduced at lean air-fuel ratios. This ap-proach also lowers peak combustion temperatures inside the engine and, as a result, reduces the formation of nitrogen oxides. Turbocharged lean-burn engines can approach the efficiency and power of heavy-duty diesel engines at full load operation. However, lean-burn engines are more likely to experience misfiring and pre-ignition or engine knock
engines, which use compression to igni
timing can be used to control combustion to avoid engine knock. Due to concerns regarding variations in fuel composition, some manufacturers have chosen to de-tune certain lean-burn engines by retarding spark igni-tion, resulting in some loss of performance and fuel efficiency.
The combustion process in engines may be sensitive to levels of methane and non-methane hydrocarbons, inert gases, and oxygen in the fuel composition de-livered to the engine’s cylinders. In the engine, variations in these components alter the energy content of the fuel and thus require changes in the air-fuel ratio to burn properly. Precise engine control technology can effectively optimize per-formance and minimize emissions. Engine control systems should have the abil-ity to sense changes in fuel composition and other operating paramdir-f l ratio and ignition timing.
l gas and air can be delivered to engine combustion cylinders by way of ueling systems: conventional carburetion, single-point (or throttle-body) jection or multi-point fuel injection, and direct fuel injection. Carburetion, plest method, was widely used on stationary and vehicle engines through
id 1980s but has virtually been abandoned today because its imprecise l of the fuel-air mixture often results in unacceptable performance and ns. The choice of multi-point or single-point injection depends largely on type and design. Both are electronically controlled by a microprocessor es data from various engine sensors (e.g., engine speed, load, tempera-mbient temperature, etc.) and proprietary algorithms to regulate the op- air-fuel ratio for a specific engine design.
ectronic controls that meter the flow of fuel and air can operate in one of odes: closed-loop control or open-loop control. Closed loop engine con-
86

White Paper on Natural Gas Interchangeability And Non-Combustion End Use
tro ythe expresenratio, This pcompotected Light doxygento apprange more eloop sallowinments.mercialated ogenera l composi-tion.
tant, but they are unable to adapt to variable as composition and other operating factors.
l s stems use an exhaust oxygen sensor (or similar feedback mechanism) in haust stream to monitor combustion products. The sensor signals the ce of oxygen. This data can indicate an out-of-specification equivalence and if such exists, the microprocessor corrects the metered air-fuel ratio. rocess occurs several times each second. If a variation in natural gas sition or air density occurs, the effect on combustion is immediately de- and factored into the air-fuel ratio calculation on a continuous basis.
uty stoichiometric engines can use a standard stoichiometric exhaust gas sensor for the necessary feedback controls. It is currently more difficult ly closed-loop electronic control systems to lean-burn engines since the of oxygen content in the exhaust requires sensors that are different and xpensive than those applied in stoichiometric engines. In addition, closed
ystems have been used in gasoline stoichiometric engines for some time, g greater experience in production and incremental product improve- However, promising sensors for lean-burn engines are entering com-lization. First generation systems are more susceptible to fuel quality re-perational problems than more recent advanced generation systems. In l however, closed loop systems are tolerant of changes in fue
By contrast, open-loop engine control systems incorporate many of the same electronic features as closed-loop systems but do not have oxygen-sensing capa-bility and adaptive learning features. Open loop systems use a predetermined “map” of load and speed to determine the engine fuel injection requirements. A specified fuel composition must be assumed to generate this “map. Conse-quently open loop systems are less tolerant of changes in fuel composition. They are capable of providing excellent engine performance and low emissions where gas composition is relatively consg Some higher compression ratio heavy-duty lean burn engines include an addi-tional feedback for knock detonation. Higher compression ratio makes an engine more susceptible to knock or detonation. If knock is detected via an accelerome-ter, the spark plug timing can be retarded, or caused to spark later in the cycle, to reduce knock. Retarding the timing, however, can reduce fuel economy.
n gas engines depend on good nition, optimum combustion rate, high knock resistance and a sufficient energy
C.4.4 Effects of Gas Composition on Engine Performance The performance and emissions of spark-ignitioigcontent of the fuel mixture. When using natural gas as a fuel the following fuel properties are important in relation to engine performance:
87

White Paper on Natural Gas Interchangeability And Non-Combustion End Use
• Density • Heating value (i.e. the Wobbe Index)
• The stoichiometric air-fuel ratio
• Knock resistance.
These gas properties are closely linked to the composition of the gas. Thus varia-tions in gas composition can have important effects on engine performance and emissions; especially if the engine is optimized for maximum performance and efficiency on a fixed gas composition and is not equipped with means of adjust-ing to other compositions. The equivalence ratio is a fundamental engine operating variable which defines base efficiency and engine-out emissions characteristics of the engine (equiva-lence ratio is the ratio of the actual fuel-air ratio to the stoichiometric fuel-air ra-tio. A mixture with an equivalence ratio of less than one is lean). As discussed in Section 5.6.2, it also defines the type of combustion system and the applicable method of emissions control.
The equivalence ratio operating indow for natural gas three-way catalysts is narrower than for gasoline and at a
Figure C.4.1 – Effect of Air – Fuel Ratio on Emissions in Reciprocating Engines
Typical emissions trends as a function of the relative air-fuel ratio, lamda, are shown in Figure C.4.1 (lamda is the reciprocal of the equivalence ratio). Main-taining the desired equivalence ratio, or lamda, under all operating conditions is the critical factor in minimizing emissions and maximizing efficiency. Stoichiometric engines run basically at an equivalence ratio of 1 (lamda of 1 as well), and in low emissions applications they rely on three-way catalysts for emissions control and they require very precise mixture control to achieve simul-taneous control of CO, HC and NOx emissions.wslightly richer set point.
88

White Paper on Natural Gas Interchangeability And Non-Combustion End Use
Lean burn (equivalence ratio less than 0.75, lamda greater than 1.33) natural gas achieve low NOx levels, even without exhaust aftertreatment, by operating with lowcombustion temperature than stoichiometric engines. Often lean burn engines opeclose to the lean flammability
engines er peak
rate very limit of the fuel-air mixture and small variations in equivalence
tio can either result in engine misfire or high NOx emissions.
sition which ffect the equivalence ratio will affect engine performance and emissions,
nce of the fuel, an important consideration in optimized atural gas engines.
There exists in the literature a limited body of work on the effects of natural gas composition variations on the performance and emissions of natural gas engines, most focused
• Dubel et al (1983) examined the effects of composition on methane num-ber (MN) and engine performance optimization and found that MN pro-vided a good indication of the fuel’s ability to achieve acceptable efficiency within the knock limit spark advance.
ra Since the stoichiometric air-fuel ratio varies with fuel composition, the quantity of fuel metered by the engine fuel system may also be affected, potentially chang-ing the equivalence ratio to the engine. Thus changes in gas compoawhether it is a stoichiometric engine or a lean burn engine. The fuel composition can also affect the composition of any unburned hydrocar-bon emissions. Composition of the hydrocarbons is important because of the question of catalyst efficiency and atmospheric reactivity. Fuel composition also affects the knock resistan
on vehicle applications. Some of the more often cited works are:
89
White Paper on Natural Gas Interchangeability And Non-Combustion End Use
• Klimstra (1978) examined the relationships between gas composition and mixture properties and reported on the effect on stoichiometric air-fuel ra-tio, heating value and the Wobbe Index, and knock sensitivity.
• Jones et al (1983) found that an engine optimized on one gas composition
demonstrated significant performance penalties when run on a gas of dif-ferent composition.
• Boschan et al (1989) found that the compositional effects on NOx emis-
sions due to variations in the methane number are compounded by the ef-fects on the stoichiometric air-fuel ratio. The total hydrocarbon emissions were found to decrease with increasing Wobbe Index, perhaps due to the higher reactivates of the higher hydrocarbons, which are present in higher Wobbe Index fuels.
um spark timing, the work verified the importance of maintaining the correct air-fuel ratio
sions, fuel economy and drivability.
ngine applications, changes in the Wobbe Index are proportional to changes in
-rgy content and knock resistance of the mixture. Since this measure disregards
the ifnents, The m ck resistance of the fuel. Knock, or detonation, can be extremely damaging to an engine. Knock occurs when there is uncontrolled combustion proceeding along a flame front initiated at the spark
• Ryan and Callahan (1991) examined the effects of various gas composi-tions on emissions from a single-cylinder test engine. The results verified significant effects of three variables on performance and emissions – equivalence ratio, spark timing, and chemical composition. However, since composition influences equivalence ratio and optim
as gas com position changes.
• Bevilacqua (2001) examined the impact of natural gas composition on
light-duty and heavy-duty natural gas vehicle emis
The body of work cited above indicates that the influence of gas composition on engine behavior can be adequately characterized by two measures: the Wobbe Index and the methane number. The Wobbe Index is a measure of the fuel in-terchangeability with respect to its energy content and metered air/fuel ratio. In estoichiometric air-fuel ratios. If the Wobbe Index remains constant, a change in the gas composition will not lead to a noticeable change in the air-fuel ratio and combustion rate. But this change in composition may change the volumetric ene
d ferent combustion properties of methane, propane and ethane compo-it is not useful as an indicator of the knock resistance of the fuel.
ethane number is a measure of the kno
90

White Paper on Natural Gas Interchangeability And Non-Combustion End Use
plu gas mfuel co eavier hy-rocarbons in natural gas, such as ethane, propane, and butane have lower
knock resistance and thus reduce the overall knock resistance of the fuel. C.4.4.1 Effects on Engine Efficiency An pcep bsion rahighersion raficiencfuel/air ratio. The efficiency peaks in the lamda range of 1.05 to 1.30. C.4.4. A mixplete chang eater effect on power capacity than a hange in gas composition. Increasing lamda involves adding excess
air, leading to a lower energy content of the mixture. In naturally asp acess agines the power loss is recouped by raising the inlet charge density.
g. Knock can result from the heat produced by compression of the air/fuel ixture in the piston. The knock resistance of the fuel is a function of the mposition. Methane has a very high knock resistance. The h
d
im ortant fuel factor that determines engine efficiency is the maximum ac-ta le compression ratio. A high thermal efficiency requires a high compres-
tio, and hence fuels with a high knock resistance. Natural gas has a knock resistance than gasoline. Engines designed with a high compres-tio to match this high knock resistance will show significant increase in ef-y. A second important factor determining the efficiency of an engine is the
2 Effects on the power output
ture that contains slightly more fuel than is necessary for com-combustion (lamda<1) yields the highest power output. A e in lamda has a much gr
c
ir ted engines an increase from lamda=1,0 to 1.5 (i.e. 50% ex-ir) may lead to a power loss of 30%. With turbocharged en-
.4.4.4 Effects on the combustion rate
consumption at an acceptable level, the combustion rate should not be too slow,
C.4.4.3 Effects of gas composition on ignitability In spark ignition (Otto cycle) engines, the ease with which a mixture ignites de-pends on the air/fuel ratio and gas consumption. There is a strong correlation between ignitability and lamda. Ignition of natural gas usually presents no prob-lems if lamda falls between 0.9 and 1.5. In an open combustion chamber, an air/fuel ratio corresponding to lamda of 1.65 can be achieved. This provides a possible approach to reducing NOx emissions through very lean burn combus-tion. C The combustion in a spark ignition combustion chamber normally starts at the spark plug and spreads to the walls of the combustion chamber. To keep fuel
91

White Paper on Natural Gas Interchangeability And Non-Combustion End Use
while combustion that is too fast may cause a high mechanical load and noise production. Variations in fuel mixture composition affect the speed of combus-tion. An increase in lamda from stoichiometric leads to a longer duration of the process. This means that if engines have been timed for stoichiometric combus-tion, the timing should be advanced if the mixture is lean. The addition of inert asses such as nitrogen and carbon dioxide results in a lower combustion rate nd again a need to advance spark timing. Turbocharging can be used to com-
gapensate for this effect.
e reaches e self-ignition point following piston compression and partial combustion.
Knock combustion may damage the cylinder and in particular the piston rings.
Mixtures with a high self-ignition temperature have a high knock resistance. A
994).
C.4.4.5 Effects of composition on knock In a normally operating engine the combustion process proceeds progressively. This is not so in the case of knock combustion. Knock is caused by a local pres-sure pulse in the cylinder as a result of spontaneous combustion of part of the fuel/air mix. It occurs when the temperature of any unreacted mixturth
good indicator of fuel behavior and particularly its knock resistance, is the meth-ane number. Methane, a fuel with a high knock resistance, is assigned a meth-ane number of 100. Hydrogen, a very knock-sensitive fuel, is given a value of 0. The higher the concentration of higher hydrocarbons, the more likely it is that the fuel will cause knock, and thus lower the methane number. Adding other gasses to natural gas may have a major effect on the methane number. Table 1. Methane number (MN) and octane number (MON) of some fuel gasses (IGU/IANGV 1
Fuel Gas MN Mon Methane 100 122 Ethane 44 101 Propane 32 97 Butane 8 89 Hydrogen 0 63 Research has shown that the ratio between the octane number, used for petrol and the methane number is almost linear. Table 1 presents the methane num-ber and the octane number for several gas components. To ensure that gas ngines will operate without knock in service, engine manufacturers specify
fuel. For heavy-duty engines, the manufacturers specify minimum MON or MN. As an example, Deere Power Sys-
eminimum knock resistance properties of the
tems and Detroit require minimum MON of 118 and 115 respectively. Through
92

White Paper on Natural Gas Interchangeability And Non-Combustion End Use
advanced controls systems, Cummins has been able to reduce the min imum MN from 80 for its standard engines to 65 for its Plus Technology engines. C.4.4.6 Emission effects of gas composition The emissions components of major concern from natural gas are NOx, CO, HC and CO2. The production of NOx is determined by the peak temperature in the ombustion process and the availability of oxygen. If the gas composition
changes, the formation of NOx is only affected if the peak temperature changes ed by lack of air (lamda less than
an
regula-of
ethane hydrocarbons (NMHC). The proportion of NMHC in the fuel directly ffects the levels of NMHC emissions in the exhaust.
c
or if the air/fuel ratio changes. CO is produc1.0) and by quenching of the flame against cool surfaces. It is minimally af-fected by changes in gas composition if the air/fuel ratio is constant. The major source of HC is the clearance at the top-land of the piston. HC emissions tend to increase with leaner mixture because of lower temperatures and flame speed. Variations in gaseous fuel composition can effect the level of these pollutant missions. The primary effect is due to variations in the Wobbe Index; this ce
affect the air/fuel ratio and thus engine out emissions. Given appropriate engine control hardware and software, reasonable variations in Wobbe Index have little effect on emissions from stoichiometric engines with three-way catalysts and closed-loop feedback by means of an O2 sensor. This is because the feedback ontrol system makes it possible to compensate for variations in air/fuel ratio. c
In addition to their effects on the Wobbe Index, differences in the concentration of different hydrocarbons in the fuel can affect the species composition and reac-ivity of the HC emissions in the exhaust. This effect is of considerablet
tory importance, since US emissions standards for vehicles limit emissions only non-ma
93

White Paper on Natural Gas Interchangeability And Non-Combustion End Use
C.4.5 Existing Gas Composition Guidelines for Natural Gas Engines C.4.5.1 Engine Manufacturers’ Recommendations
and durably in end-use appli-ions, engine manufacturers normally require information on the composition
To ensure that their engines will work satisfactorilycatof the natural gas in the location of use. They also issue recommended fuel specifications to guide users. Table C.4.2 lists recommended fuel composition and combustion properties from a number of manufacturers. Table C.4.2 Recommended gas composition ranges by select natural gas engine manufacturers
(SAE, 2001 and Detroit Diesel Corporation, 1998). Component Tolerance CAT Dual-
Fuel Cummins Deere Detroit Mack
Hydrocarbons Methane Minimum 88.0% 90% 88% 85% Ethane Maximum 6.0% 4% 6% 11% C3+ Maximum 3.0% Propane Maximum 1.7% 5% 1.7% 9% C4+ Maximum 0.7% 0.3% C6+ Maximum 0.2% Butane Maximum 1% 5% C2+C3+C4 11% Inerts (N2, O )
Range/Max 1.5-4.5% 3.0% total 2COC 2
% N2 3% 2
Oxygen Maximum 1.0% 0.5% Hydrogen Maximum 0.1% 0.1% 0.1% CO Maximum 0.1% 0.1% Sulfur Maximum 0.001% by
mass 22 ppm by
mass
Methanol Maximum 0% CO2+N2+O2 Maximum 4.5% Wobbe Index Range 1290 - 1365 (Btu/scf)
1270 – 1360
Octane Rating (MON)
Minimum 118 115
Methane Number (MN)
Minimum 80 (standard engines) 65 for Plus Technology
Lower Heating Value
Minimum 43.7 MJ/kg for Plus Technology Engines
897 Btu/scf
Higher Heating Value
Minimum 965 Btu/scf (standard engines)
94

White Paper on Natural Gas Interchangeability And Non-Combustion End Use
Original equipment manufacturers (OEMs) place a very high value on maintaining ustomer satisfaction and the reputation of their products. OEM concerns about
icle OEMs,” which pre-ominantly produce cars and light trucks using gasoline-derived engines with
imum engine op-ration.
ngine OEMs are concerned with the effects of variability on engine performance
ility a O e es ed for informspecifications of natural gas composition based on the tolerance to heavier hy-
th t can caus engine k ck, damage or otherwise unacceptable nce. n le 2, engine OEMs recom d very l
f prop im ethan els are a o specified nd 90 mh falls ional mea which, like all constituents, may
ect to loc e ependent tions. hile engine specific - are desig ro eir en ines from “worst-case” gas, most recog-
e need d tailed data n the effects of gas com osition on tnce and durability of specific engine designs.
ngine hic Ms ha t genera y developed in-house speci-for g sit t have ipated in industry-wide forums such
he Auto/O lit ovem ogram. G s composition ons hav te ial to seri t t e operation lity of
stoichiometric engines with closed-loo o their concerns are more re-he reliability and safety of fueling systems and to gas composition
s emis ions certifications testing by CARB and the U.S. EPA.
r ce tification te ting relates to the way i ich closed-gine controls function. While such systems have adaptive learning capa- engin ar up befor o can become e
utes of operation are bas rogrammed values for fuel com-position, similar to the normal operat f open-loop engine control sys-
c n st fuel diff ha d, he starting a -tio could be incorrect and degr results. The relative proportion of
specific hydrocarbon components ma nce emissions directly in some engines. The impacts of variations i ecific components such as ethane
ropane have not been established but have received the attention of some regulators.
cgas composition differ markedly between “natural gas vehdclosed-loop control systems, and heavy-duty “engine OEMs,” which typically pro-duce diesel-derived engines with lean-burn combustion and open- or closed-loop engine controls. While these two groups share common interests in the effects of gas composition on the integrity and reliability of fueling system components, they differ with respect to gas composition requirements for opte
Eand durab . Almost ll engine EMs hav tablish mal or al
drocarbons a e no ,performa As show in Tab some men ow levels o ane. Min um m e lev ls arou ole %, whic near the nat n but be subj al and tim -d aberra W OEM ations ned to p tect th gnize th for more e o p he performa Unlike e OEMs, ve le OE ve no llfications as compo ion bu particas t il Air Qua y Impr ent Research Pr avariati e less po nt ously affec
p control, sh or durabi
lated to tspecification
used in s
The concernloop en
egarding r s n wh
bility, anfirst few min
e must w m e such contred on preping mode o
ls effective. Th
tems. If the fuel ra
ertificatio te ers from wade testy also influen the sp
t is assume t ir
and p
95

White Paper on Natural Gas Interchangeability And Non-Combustion End Use
Overall, from the perspective of OEMs, both vehicle and heavy-duty engine manufacturers, tightly defined certification gas compositions are important to the task of designing engines and controls systems that meet the requirements of current certification testing protocols. C.4.5.2 Existing Gas Quality Standards For Natural Gas Vehicles An effort to develop national standards for compressed natural gas (CNG) was init1980 by
iated in the American Gas Association (AGA) Methane Powered Vehicle Systems Committee.
ome of the industry groups involved in vehicular compressed natural gas composition issues d Materials NFPA),
nd other ef-te the re-
ion in 1994. discussion
mong industry groups. SAE J1616 recommends specific fuel properties at the fueling station g station. It
te to corro-engine per-
Sinclude the Society of Automotive Engineers (SAE), American Society for Testing an(ASTM), Natural Gas Vehicle Coalition (NGVC), National Fire Protection Association (and the U.S. Consortium for Automotive Research (USCAR). As a result of these aforts, a recommended industry practice was established (SAE J1616) to accommodaquirements of NGV engine and vehicle applications: C.4.5.2.1 SAE J1616 Subject to periodic review and updating, SAE J1616 was issued in its current versAs a recommended practice, it is the basis for ongoing education, debate, andadispenser, as the CNG is delivered to the vehicle, not as it arrives at the fuelinplaces considerable emphasis on physical and chemical properties that can contribusion in cylinder and fueling system components. Recommendations that impact formance and emissions include: Carbon Dioxide: Corrosive environments for fueling system components and cyl-inders is controlled via recommendations on limited water concentration, so no limits are required on the concentration of CO2 for this purpose. However, a limit of 3.0% CO2 by volume is recommended to help maintain proper stoichiometry. Sulfur Compounds: The total content of sulfur compounds, including odorants, would be limited to 8-30 ppm by mass to avoid excessive exhaust catalyst poi-soning. Pressure hydrocarbon dewpoint temperature: SAE J1616 notes that propane injected into natural gas by utilities for peakshaving purposes raises the possibil-ity of hydrocarbon liquid condensation under certain CNG operating pressures and temperatures. If an excessive amount of propane “drops out” of the fuel and subsequently returns to gaseous form as the tank pressure is drawn down, levated levels of propane can be delivered to the engine, causing variations in
the fuel Wobbe Index and posing the risk of engine knock. To minimize such problems, SAE J1616 limits propane content in gas delivered to the vehicle such
e
96

White Paper on Natural Gas Interchangeability And Non-Combustion End Use
that the potential liquid formation not exceed 1% of the cylinder volume at pres-sures between 800 to 1200 psig and at the lowest published monthly ambient temperatures for the local fueling station. Wobbe Index: Variability in the Wobbe Index affects most significantly engines
at are not equipped with closed loop controls. A Wobbe Index range of 1300 as also
een found acceptable for use on current equipment in high altitude areas. The
thto 1420 Btu/scf is recommended, although a range of 1200 to 1250 hbrecommended range, typical of most U.S. natural gas, would allow maximum variation from nominal air-fuel ratio of about 13.7% which is comparable to the range in variation of gasoline density. Knock rating: The resistance of a fuel to autoignition is a fundamental fuel char-acteristic. No recognized test method presently exists for the determination of Motor Octane Number (MON) of natural gas. No specific recommendations are given on the MON rating of natural gas. C.4.5.2.2 Emissions Certification Test Fuels
of obvious importance to manufacturers, but ey have limited practical importance to vehicle operators and fuel providers.
-y of additional data on the effects of gas composition on emissions perform-
Federal and state agencies involved in certifying vehicles and engines as meeting emissions standards specify the composition of test fuels to ensure consistency and repeatability of test data. The California Air Resources Board (CARB) has published certification test fuel specifications for CNG, and the U.S. EPA has simi-lar specifications. Such specifications, which are designed to represent typical in-use gas compositions, specify hydrocarbon, oxygen, and inert as concentrations. Certification test specifications areth CARB has gone one step further in publishing specifications for commercial CNG motor fuel sold to vehicles in the state. The CNG specification took effect on January 1, 1993. CARB’s specifications are subject to change based on availabilitance. CARB CNG specification are compared with SAE J1616 guidelines and fuel requirements of typical heavy-duty engine manufacturers in Table C.4.3.
.
Table C.4.3. Comparison of CNG Fuel Specifications and Guidelines for Selected Components
97
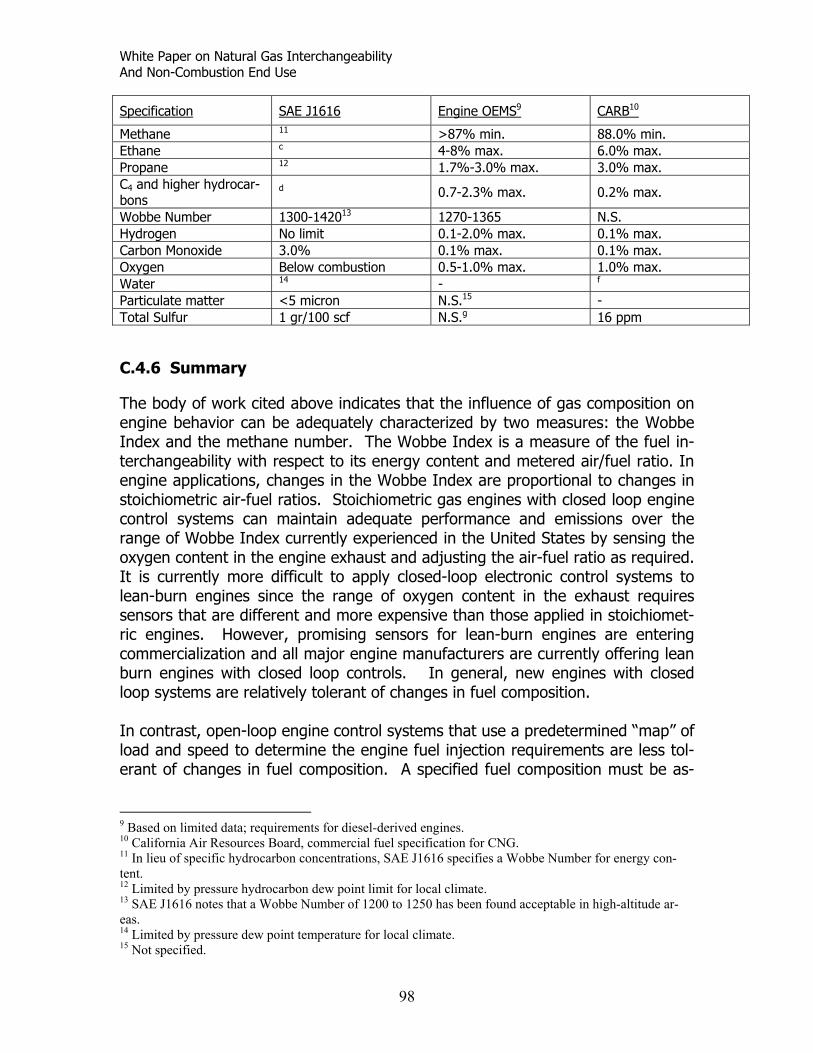
White Paper on Natural Gas Interchangeability And Non-Combustion End Use
Specification SAE J1616 Engine OEMS9 CARB10
Methane 11 >87% min. 88.0% min. Ethane c 4-8% max. 6.0% max. Propane 12 1.7%-3.0% max. 3.0% max. C4 and higher hydrocar-bons
d 0.7-2.3% max. 0.2% max.
Wobbe Number 1300-142013 1270-1365 N.S. Hydrogen No limit 0.1-2.0% max. 0.1% max. Carbon Monoxide 3.0% 0.1% max. 0.1% max. Oxygen Below combustion 0.5-1.0% max. 1.0% max. Water 14 - f
Particulate matter <5 micron N.S.15 - Total Sulfur 1 gr/100 scf N.S.g 16 ppm
hat the influence of gas composition on ngine behavior can be adequately characterized by two measures: the Wobbe
x is a measure of the fuel in- and metered air/fuel ratio. In
t-c engines. However, promising sensors for lean-burn engines are entering
less tol-rant of changes in fuel composition. A specified fuel composition must be as-
C.4.6 Summary The body of work cited above indicates teIndex and the methane number. The Wobbe Indeterchangeability with respect to its energy contentengine applications, changes in the Wobbe Index are proportional to changes in stoichiometric air-fuel ratios. Stoichiometric gas engines with closed loop engine control systems can maintain adequate performance and emissions over the range of Wobbe Index currently experienced in the United States by sensing the oxygen content in the engine exhaust and adjusting the air-fuel ratio as required. It is currently more difficult to apply closed-loop electronic control systems to lean-burn engines since the range of oxygen content in the exhaust requires sensors that are different and more expensive than those applied in stoichiomericommercialization and all major engine manufacturers are currently offering lean burn engines with closed loop controls. In general, new engines with closed loop systems are relatively tolerant of changes in fuel composition. In contrast, open-loop engine control systems that use a predetermined “map” of load and speed to determine the engine fuel injection requirements are e
ased on limited data; requirements for diesel-derived engines.
California Air Resources Board, commercial fuel specification for CNG. In lieu of specific hydrocarbon concentrations, SAE J1616 specifies a Wobbe Number for energy con-nt. Limited by pressure hydrocarbon dew point limit for local climate. SAE J1616 notes that a Wobbe Number of 1200 to 1250 has been found acceptable in high-altitude ar-
ea Limited by pressure dew point temperature for local climate. Not specified.
9 B10
11
te12
13
s. 14
15
98

White Paper on Natural Gas Interchangeability And Non-Combustion End Use
sumed to generate th nd, consequently, open loop systems are unable to adapt to variable gas composition and other operating factors.
vered in the N row Range (1289 to 1383 Wobbe) will most likely not in terms of engine performance or emissions for existing or
stoichiometric and lean burn engines. Gas delivered in the Medium, Broad ric Rang t likely be free on the end for
etric engines sed loop contr comparis AE s. Ho end of both the Asymmetric and Broad
s are significant elow the lower limit of the SAE J1616 guideline of 1300 duty s tric engines. The lower limits of th Asymmetric
Ranges are cantly below the lower limits of th y duty an burn engine manufacturers guidelines. The high end of the Broad Range is ignificantly above the higher limits of the heavy duty lean burn engine manufac-
significant percentage of the existing population of gas en-
ethane has a ery high knock resistance. The heavier hydrocarbons in natural gas, such as
to moderate changes in Wobbe Index and, to a certain extent, antiknock fuel roperties. However, it is important to note that published test results on per-
iations in gas composi-re
une from serious performance effects from elevated levels of propane and esel-derived engines. Their
ter sensitivity to these higher hydrocarbons poses a potential threat to en-
is “map” a
Gas deli arpose any problems new and Asymmet es will mos problem highstoichiom with clo ols based on on to the SJ1616 guideline wever, the lowRange ly bWobbe for light toichiome e and Broad also signifi e heavlesturers guidelines. Agines in power generation and pipeline compression applications utilize open loop control systems. There is currently insufficient data on the potential impact on emissions and knock sensitivity of the Medium, Broad and Asymmetric Ranges. Testing of these ranges on larger engines with open-loop control systems would be invaluable, particularly for the large bore 2-cycle engines used for pipeline compression. Since the Wobbe Index disregards the different combustion properties of meth-ane, propane and ethane components, it is not useful as an indicator of the knock resistance of the fuel. If the Wobbe Index remains constant, a change in the gas composition will not lead to a noticeable change in the air-fuel ratio and combustion rate. But this change in composition may change the volumetric en-ergy content and knock resistance of the mixture. Knock, or detonation, can be extremely damaging to an engine. Knock occurs when there is uncontrolled combustion proceeding along a flame front initiated at the spark plug. The knock resistance of the fuel is a function of the fuel composition. Mvethane, propane, and butane have lower knock resistance and thus reduce the overall knock resistance of the fuel. Stoichiometric engines with closed loop engine controls have the ability to adapt
pformance and emissions have been limited to normal vartion. For this reason, it would be premature to assume that such engines aimmegreathane. The case is much clearer for lean burn di
gine performance and durability.
99

White Paper on Natural Gas Interchangeability And Non-Combustion End Use
Concerns about knock damage have prompted heavy duty engine manufacturers
set limits on propane of 3% or lower. These levels are not temperature re-
nd exhaust temperature all have major impact on the performance f the catalyst. To overcome the effect of fuel composition variations, the en-
tolated and are much lower than the SAE J1616 guidelines for preventing hydro-carbon liquid condensation in engine fueling systems or NGV cylinders. Levels exceeding the maximum set by engine manufacturers are possible, though not common, in regular natural gas supplies and would certainly be exceeded in a propane-air peakshaving situation. Further quantification of the effects of pro-pane levels on both stoichiometric and lean burn engines are needed and may influence future revisions of allowable propane limits. High ethane levels may also contribute to engine knock and damage in lean burn engines. Allowable lim-its set by engine manufacturers are in the range of 4% to 8%. However, insuffi-cient experimental results and field experience with elevated ethane levels make it difficult to draw conclusions about the severity of engine impacts and the ex-tent and duration of unacceptably high levels of ethane at specific locations. With increasingly stringent emissions standards, both stoichiometric and lean burn engines need to be fitted more often with catalytic exhaust aftertreatment systems. The stoichiometric engine utilizes a three way catalyst that is capable of simultaneously reducing NOx and oxidizing CO and HC. Air-fuel ratio, fuel composition, aogine control systems will need to respond to these changes and still maintain air-fuel ratios within the narrow window (which also narrows with catalyst ageing) required for good conversion efficiency. On a lean burn engine, an oxidation catalyst is often used to reduce CO and HC emissions. Methane in particular is difficult to oxidize, and is even more prob-lematic in lean burn engines with relatively low exhaust temperatures. Typical values for methane reduction in a lean burn oxidation catalyst are as low as 30 to 50%. Even the relatively low values of sulfur found in natural gas odorants can poison oxidation catalysts, further reducing the level of methane reduction.
100
White Paper on Natural Gas Interchangeability And Non-Combustion End Use
Appendix D Monitoring Interchangeability and Combustion Fundamentals
Edgar Kuipers, Shell Trading
The definition of interchangeability is linked to combustion issues. In this appendix on interchangeability parameters we will therefore also limit ourselves to combustion issues. The impact of a change in gas supply on feedstock plants and infrastructure will be discussed separately. Interchangeability was an important issue at the start of the natural gas business, as in most places natural gas was introduced as a replacement for manufactured gas. Manufactured gas was made by heating bituminous coal in the absence of air. The knowledge gained about interchangeability at that time has later been used for and adapted to design specifications for the use of LPG/air mixtures for peak-shaving and the blending of rich locally produced gas with lean gas supplies. Most gas quality specifications used today are based on the interchangeability research done 10 – 50 years ago.
D.1 “First principles” of Combustion
Combustion devices utilize natural gas to produce heat for a variety of purposes, from home cooking to power generation. The combustion properties of natural gas depend on the mode in which the fuel is burned and especially on the amount of air available for combustion, leading to following burner categorisation; Diffusion and Partial pre-mix Burners: In conventional or diffusion burners, fuel and (part of the) air are fed separately into the flame zone. The picture below shows a schematic diagram of such a conventional ‘Bunsen-type’ burner. Pressurized gas flows through the orifice of a nozzle into a venturi where the primary air is introduced. Fuel and primary air will mix while accelerating through the venturi and enter into the primary combustion zone. In the primary combustion zone the fuel will be partly combusted with the premixed primary air. In the secondary combustion zone, the combustion process will be completed with secondary air that diffuses into the flame front.
1

White Paper on Natural Gas Interchangeability bustion End Use
gas
Primary Combustion
Zone
Secondary Combustion
Zone
Primary Combustion
AirSecondary Combustion
Air
gas
Primary Combustion
Zone
Secondary Combustion
Zone
Primary Combustion
AirSecondary Combustion
Air
And Non-Com
2
Diffusion and partly pre-mix burners are common in residential and industrial burners and in older power generation plants especially those built prior to 1990. Diffusion mode combustion is also common in industrial boilers and certain appliances. Flames burning in diffusion mode tend to have a partly yellow color. Lean premixed burners: In lean-premixed burners, the fuel and all of the combustion air are mixed upstream of the combustion zone. The amount of premixed air sets the fuel-air ratio at which the combustion takes place, allowing control of combustion temperature, CO and NOx formation. Modern, low emission burners such eg used in power generation plants operate in lean premixed mode. Interchangeability concerns: As the purpose of determining and requiring the interchangeability of fuels is to ensure continued operability of burners for different fuels, it is important to understand the combustion characteristics that can be affected by fuel composition. Typically, discussions of the interchangeability of gases have addressed the following characteristics: • Flame shape and stability (both of which are related to flame speed) • Flame color • Combustion efficiency • Flue gas composition (CO2, NOx, CO, water) In this section we will provide a basic understanding of those combustion issues for the different types of burners. We will then use this basic understanding to discuss the impact of gas composition in more detail. Combustion of gas

White Paper on Natural Gas Interchangeability And Non-Combustion End Use
however is a very complex process and thus first principles will not be fully sufficient for a thorough understanding of all aspects.
Thermal input: The thermal input (btu/hour) or gross thermal load of a burner, QBtu, will be mainly determined by the design and setting of the burner as well as the gas composition. In this chapter we will assume that the design and setting are fixed and only focus on the remaining impact of gas quality. The gross thermal load of a burner can be written as:
QBtu = HV * Qv (1)
where HV is the gross calorific value (btu/scf) of the gas and Qv is the volumetric gas flow rate (scf/hour). At constant pressure the volumetric flow Qv through the orifice of a nozzle is inversely proportional to the square root of the relative density G of the gas1.
Qv ∝ 1/√G (2)
Where the relative density is defined according to ISO6976 as the ratio of the density of a gas to the density of air under the same stated conditions of temperature and pressure2. Combining (1) and (2) above results in the following relation for the thermal burner load:
QBtu ∝ HV/√G (3)
Goffredo Wobbe was the first to describe this relationship3 4 and thus the following has been defined as the Wobbe index:
W = HV/√G (4)
Combining this definition with (3), leads to the conclusion that the thermal burner load is directly related to the Wobbe index of the fuel gas. Air supply:
1 Pritchard, Guy and Connor, Industrial Gas Utilization 1977, ISBN 0-85935-059-2 2 ISO 6976 3 Monats-Bull. schweiz Ver. Gas- u. Wasserfach (1927), 7, 277-8 4 Ind. Gas acquedolli, (Rome) (1926
3

White Paper on Natural Gas Interchangeability And Non-Combustion End Use
The air supply (whether natural draft, forced, primary or secondary) will be mainly determined by the design and setting of the burner. Once those have been set, the air supply is fixed and will not be influenced by the gas quality. Thus for the discussions in this chapter on the impact of gas quality, we can assume the air supply to be constant. Equivalence ratio: As we will show later on, the most important single parameter for combustion performance is the so-called equivalence ratio, �, defined as the amount of air required for complete combustion of fuel supply, divided by the air supply to the combustion zone, or in other words the air-requirement/air-supply ratio.
� = Fair, st/Fair, act (5)
in which Fair, st is the volumetric stoichiometric air requirement (scf air/hour) and Fair, act is the volumetric actual air supply (scf air/hour) to the combustion zone. A stoichiometric fuel/air mix has �=1, whereas a mix with excess air has � <1. Properties of Alkanes5: The main components of natural gas are alkanes (methane, ethane, propane, butane, …) and inerts. Both the calorific value of alkanes as well as the amount of air required for stoichiometric combustion (volumetric air/fuel ratio at �=1) increase with carbon number as is shown in the following graphs:
methane
ethane
propane
butane
pentane
0
1000
2000
3000
4000
5000
GC
V (b
tu/s
cf)
methane
ethane
propane
butane
pentane
0
1000
2000
3000
4000
5000
GC
V (b
tu/s
cf)
5 Alkanes (also known as paraffins) are saturated hydrocarbons with general formula CnH2n + 2 where n is an integer eg Methane, ethane, propane, butane.
4

White Paper on Natural Gas Interchangeability ustion End Use
methane
ethane
propane
butanepentane
0
10
20
30
40
50
stoi
chio
met
ricai
r/fue
l (vo
l) ra
tio
methane
ethane
propane
butanepentane
0
10
20
30
40
50
stoi
chio
met
ricai
r/fue
l (vo
l) ra
tio And Non-Comb
5
But one of the peculiar properties of alkanes is that the volumetric air/fuel ratio at �=1 divided by the calorific value, ie the amount of air required for stoichiometric combustion to release a specific amount of heat, stays almost constant independent of carbon number to within 5% from methane up to pentane as shown in the next plot:
methane ethane propane butanepentane
0.00
2.00
4.00
6.00
8.00
10.00
scfa
ir pe
r 100
0bt
u
methane ethane propane butanepentane
0.00
2.00
4.00
6.00
8.00
10.00
scfa
ir pe
r 100
0bt
u
This means that the stoichiometric air supply requirement, Fair, st, for an alkane mixture is directly related to the thermal burner load, QBtu:
Fair, st = c * QBtu (6)
Where c is a constant (scf/btu) and the air stoichiometric air requirement to combust 1 btu of alkanes. Equation 6 can be rewritten as, by replacing Qbtu for the Wobbe index, W:
Fair, st ∝ W (7)
This tells us that the stoichiometric air requirement is directly related to the Wobbe index. Combining equations 5 and 7, we get the following for the equivalence ratio:
�= Fair, st/Fair, act ∝ W/ Fair, act (8)
As discussed above, substitution of one gas for another should not have any impact on the actual air supply to the combustion zone, so Fair, act is independent

White Paper on Natural Gas Interchangeability And Non-Combustion End Use
of the fuel composition. When substituting one gas for the other the relative equivalence ratio can now be written as:
2
1
2
1
WW
=ϕϕ
(9)
Thus for the interchange between an adjustment gas and a substitute gas, consisting of alkanes and inerts, the relative equivalence ratio is to a very good approximation given by the Wobbe index ratio.
D.2 First principles applied to combustion performance and
interchangeability
D.2.1 Flame Temperature: The flame temperature will depend directly on the equivalence ratio. At low equivalence ratio’s (�<1, ie excess air) all fuel is likely to be consumed but the energy that is released in the process will have to heat the excessive amount of nitrogen and air resulting in a relatively low flame temperature. At some point, the lower flammability limit, the equivalence ratio becomes too low for combustion to take place. As the amount of excess air is reduced, moving closer to stoichiometry (�=1), there is less excess air to heat, leading to an increase of the flame temperature. However once the equivalence ratio increases beyond stoichiometric point (�>1) there is not sufficient air for complete combustion and thus the flame temperature will drop again. This is schematically shown in the following diagram:
Equivalence Ratio, Φ10
Flam
e Te
mpe
ratu
re
Excess Air Excess Fuel
Equivalence Ratio, Φ10
Flam
e Te
mpe
ratu
re
Excess Air Excess Fuel
6

White Paper on Natural Gas Interchangeability And Non-Combustion End Use
The importance of the equivalence ratio for flame temperature is exemplified by the small differences in adiabatic flame temperature for the various alkanes as shown in the next table for φ=1:
Adiabatic Flame Temperature (F) for φ=1 Methane 3484 Ethane 3540 Propane 3573 Butane 3583
The importance of the equivalence ratio for flame speed is exemplified by the t
minar Flame Speed (cm/s) for φ=1
D.2.2 Flame Speed; Lifting/Flashback The flame speed is very relevant for the combustion performance, as it is one of the factors that determine flame shape and stability. The flame speed can be linked to the flame temperature and thus also depends on the equivalence ratio. The highest laminar flame speed is achieved for a fuel/air mixture that is slightly above stoichiometry, as shown schematically in next picture.
Equivalence Ratio, Φ
Flame Temperature
10
Flam
e Sp
eed,
Tem
pera
ture
Flame Speed
Excess Air Excess Fuel
Equivalence Ratio, Φ
Flame Temperature
10
Flam
e Sp
eed,
Tem
pera
ture
Flame Speed
Excess Air Excess Fuel
differences in laminar flame speed for the various alkanes as shown in the nextable for φ=1:
LaMethane 38.3 Ethane 40.6 Propane 42.3 Butane 42.6
7

White Paper on Natural Gas Interchangeability And Non-Combustion End Use
The flame speed determines the flame shape and stability, as at a stable flame
An increase in flame speed will cause the flame to move upstream into the
decrease of flame speed will cause the flame front to move further
xperimentally by the Gasunie have shown that at constant equivalence ratio a
summary, the flame speed of an alkane/air mixture is almost solely determined by the equivalence ratio and as such is directly related to the Wobbe index.
front the flame speed and flow velocity have to be in balance, see next diagram:
Flame SpeedFlame Speed
burner tip. For premixed flames in the extreme case this can even lead to the flame moving inside the burner causing so-called flash-back. Adownstream of the burner, also called lifting. In the extreme case the flame speed will always be smaller than the flow speed and thus the flame will blow-off and extinguish. Evariation in the natural gas composition only has a small impact on the flame speed6. Thus the impact of a change in gas composition on flame speed is mainly dictated by its impact on the equivalence ratio. Or in other words the impact of gas quality on flame speed is related to the Wobbe index. The lower order corrections on the Wobbe index can become relevant in lean premixed combustion especially when operating near the lower flammability limit of the fuel. The Wobbe index also falls short if the natural gas contains non-alkane components such as e.g. H2, olefins or O2. In
8
6 A.Hoven and H. Levinsky; International Gas Research Conference 1998 Proceedings p 7.

White Paper on Natural Gas Interchangeability And Non-Combustion End Use
D.2.3 NOx emissions
the combustion process, relatively small amounts of nitrogen oxides (NOx) are are mainly composed of nitric oxide (NO), a colorless
as, and nitrogen dioxide (NO2), which is a brownish gas that can be visible in
t are most levant for the combustion of natural gas; the Zeldovich and Fenimore
bustion air. The thermal mechanism consists of three elementary actions:
The activation energy for th high (0.137 MMBtu/lb-mole) and as a consequence this reaction is strongly dependent on the flame temperature, and only occurs at temperatures > 3950 0F. As discussed earlier on the
Informed. Nitrogen oxidesgthe exhaust plume. Although in the past the impact of gas quality on NOx emissions was generally not specifically addressed, presently NOx emission levels have become an important performance indicator and regulated pollutant, which must be taken into consideration when discussing interchangeability. NOx is generated during combustion of hydrocarbon fuels through a variety of mechanisms. We will discus the two NOx formation mechanisms thareMechanism; Zeldovich or ‘thermal’ NOx7 is created through the oxidation of N2 introduced with the comre
OOO +→
is reaction is very
NONO
ONOON
222
2
→+−−−−−−−−−−
+→+
equivalence ratio has a strong impact on the flame temperature, an increase of air supply above stoichiometric requirements will reduce the flame temperature and thus the NOx formation via this Zeldovich mechanism. Lean-premixed Low NOx burners typically operated at a equivalence ratio of ~0.6. The third mechanism is called the Fenimore mechanism:
NNONO 2
2
+→+
7 Zeldovich, Y. B., P. Y. Sadonikov, and D. A. Frank-Kamenetskii, 1947: Oxidation of nitrogen in combustion (M. Shelef, Transl.). Acad. Sci. USSR, Inst. Chem. Phys., Moscow–Leningrad.
9

White Paper on Natural Gas Interchangeability And Non-Combustion End Use
The activation energy for quite low (90 kJ/mol) and s such can be the dominant NOx formation process at lower temperatures. The O formed via this mechanism is also called ‘prompt NO’ as it is mainly formed in
Summariz
fired burners. The Zeldovich mechanism has a high activation energy
CHNOOHCNONOON
NHCNNCH
2
2
+→++→+
+→+
the Fenimore mechanism is
NONO 222 →+−−−−−−−−−−−−−
aNthe early stage of combustion, where hydrocarbons are still present. This is a similar reaction mechanism to ‘thermal NO’ but catalyzed by the presence of CH as shown in the above reaction equations. The Fenimore reaction will be more significant under fuel-rich conditions.
ing, there are various NOx formation mechanisms, of which the Zeldovich mechanism is the most important one for natural gas
Flame Temperature
Emis
sion
s, T
emp
NOx emissions
Equivalence Ratio, Φ10
Fenimore
Zeldovich
Flame Temperature
Emis
sion
s, T
emp
NOx emissions
Equivalence Ratio, Φ10
Fenimore
Zeldovich
Excess Air Excess FuelExcess Air Excess Fuel
erat
ure
erat
ure
and as a consequence the reaction rate will strongly depend on the flame temperature, which is almost solely determined by the equivalence ratio. The influence of gas quality is therefore mainly via the equivalence ratio. Hence, at constant equivalence ratio, a variation in the natural gas composition only has a second order impact on the amount of NOx formation.
10
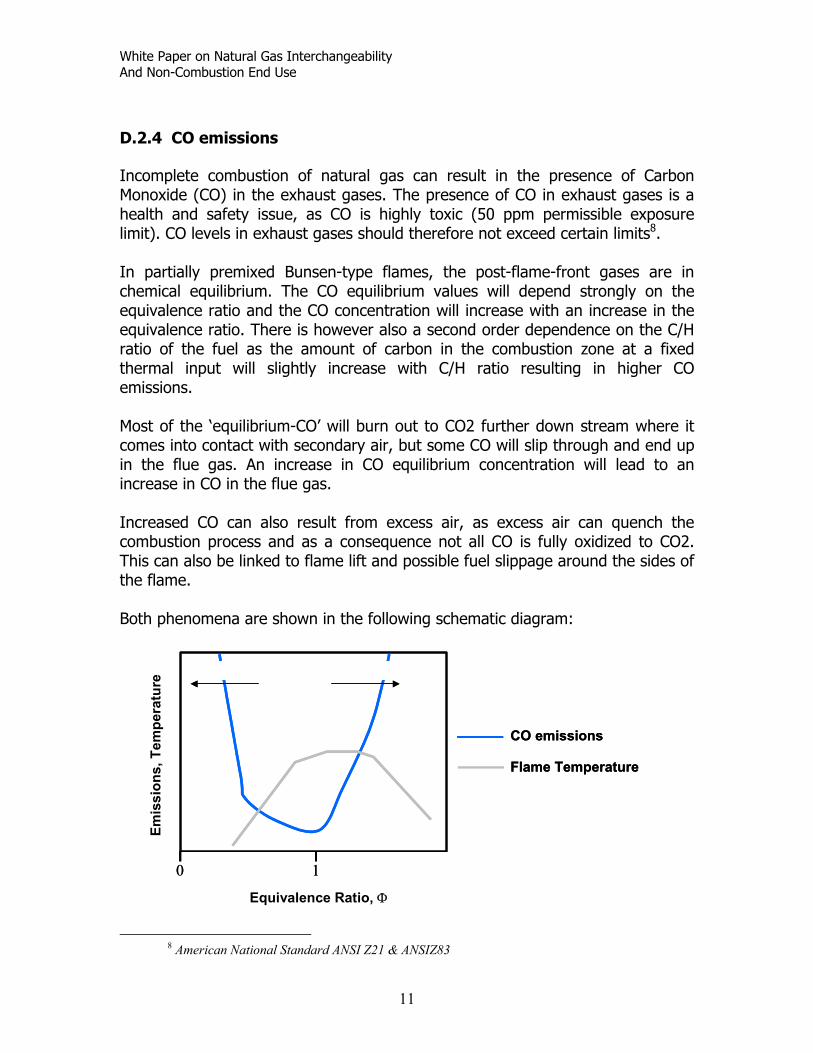
White Paper on Natural Gas Interchangeability And Non-Combustion End Use
D.2.4 CO emissions Incomplete combustion of natural gas can result in the presence of Carbon
xhaust gases. The presence of CO in exhaust gases is a ealth and safety issue, as CO is highly toxic (50 ppm permissible exposure
the quivalence ratio and the CO concentration will increase with an increase in the
ontact with secondary air, but some CO will slip through and end up the flue gas. An increase in CO equilibrium concentration will lead to an
onsequence not all CO is fully oxidized to CO2. his can also be linked to flame lift and possible fuel slippage around the sides of
Monoxide (CO) in the ehlimit). CO levels in exhaust gases should therefore not exceed certain limits8. In partially premixed Bunsen-type flames, the post-flame-front gases are in chemical equilibrium. The CO equilibrium values will depend strongly on eequivalence ratio. There is however also a second order dependence on the C/H ratio of the fuel as the amount of carbon in the combustion zone at a fixed thermal input will slightly increase with C/H ratio resulting in higher CO emissions. Most of the ‘equilibrium-CO’ will burn out to CO2 further down stream where it comes into cinincrease in CO in the flue gas. Increased CO can also result from excess air, as excess air can quench the combustion process and as a cTthe flame. Both phenomena are shown in the following schematic diagram:
Equivalence Ratio, Φ
CO emissions
Flame Temperature
10
Emis
sion
s, T
empe
ratu
re
Equivalence Ratio, Φ
CO emissions
Flame Temperature
10
Emis
sion
s, T
empe
ratu
re
Excess Air Excess FuelExcess Air Excess Fuel
8 American National Standard ANSI Z21 & ANSIZ83
11

White Paper on Natural Gas Interchangeability And Non-Combustion End Use
The influence of gas quality is again mainly via the equivalence ratio, set by the Wobbe index. At constant Wobbe index a variation in the natural gas composition only has a very small impact on the amount of CO formation9. D.2.5 Soot/Yellow Tipping Another relevant issue for combustion performance is the flame color, which can change from blue to yellow. Natural gas burners are usually adjusted such that it produces a flame that is mostly of a blue color. However a change in equivalence ratio might change the flame tip to yellow. The figure below shows a properly adjusted burner with a blue flame whereas the second picture shows an ill-adjusted burner with yellow tip. Yellow tipping is caused by the formation of soot in the primary flame front. Yellow tipping in itself is not necessarily a concern, as the soot formed in the primary flame front will subsequently be burned in the secondary flame front. In some appliances yellow tipping is even desired for decorative reasons, e.g. log fires. However in some cases (e.g. extreme yellow tipping or quenching on heat exchanger) the soot might not fully burn and thus cause soot deposits, which affects equipment performance as well as its useful life. Soot formation and yellow tipping is a complex process related to the equivalence ratio. An increase of equivalence ratio will increase the tendency for yellow tipping. However, since different alkanes have different tendency to soot, the equivalence ratio alone is not sufficient to describe yellow tipping. Fuel composition is also a factor. Generally yellow tipping tendencies have been determined using empirical parameters developed by AGA and the Bureau of Mines and which will be discussed in a later section.
12
9 Presentation Prof H Levinsky,’ Interchangeability form first principles’, NGC meeting DC July 2004.
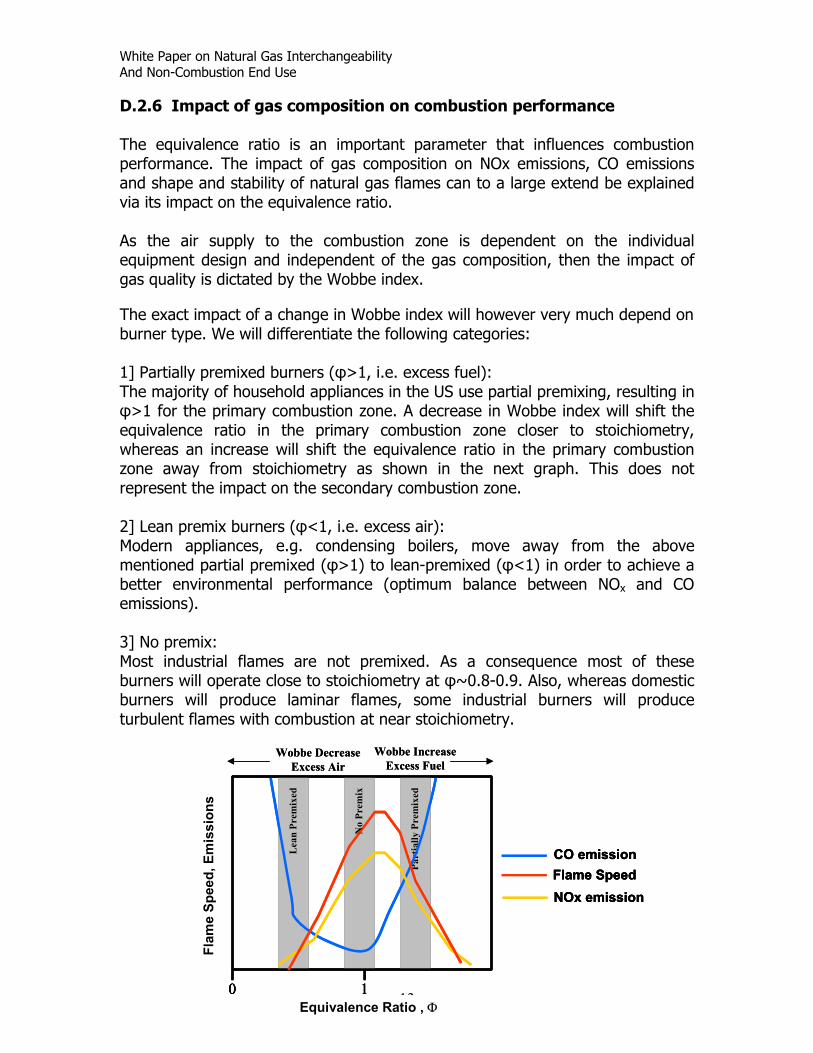
White Paper on Natural Gas Interchangeability And Non-Combustion End Use
D.2.6 Impact of gas composition on combustion performance The equivalence ratio is an important parameter that influences combustion performance. The impact of gas composition on NOx emissions, CO emissions and shape and stability of natural gas flames can to a large extend be explained via its impact on the equivalence ratio. As the air supply to the combustion zone is dependent on the individual equipment design and independent of the gas composition, then the impact of gas quality is dictated by the Wobbe index. The exact impact of a change in Wobbe index will however very much depend on burner type. We will differentiate the following categories: 1] Partially premixed burners (φ>1, i.e. excess fuel): The majority of household appliances in the US use partial premixing, resulting in φ>1 for the primary combustion zone. A decrease in Wobbe index will shift the equivalence ratio in the primary combustion zone closer to stoichiometry, whereas an increase will shift the equivalence ratio in the primary combustion zone away from stoichiometry as shown in the next graph. This does not represent the impact on the secondary combustion zone. 2] Lean premix burners (φ<1, i.e. excess air): Modern appliances, e.g. condensing boilers, move away from the above mentioned partial premixed (φ>1) to lean-premixed (φ<1) in order to achieve a better environmental performance (optimum balance between NOx and CO emissions). 3] No premix: Most industrial flames are not premixed. As a consequence most of these burners will operate close to stoichiometry at φ~0.8-0.9. Also, whereas domestic burners will produce laminar flames, some industrial burners will produce turbulent flames with combustion at near stoichiometry.
13
Part
ially
Pre
mix
ed
10
Emis
sion
s, T
empe
ratu
re
Equivalence Ratio , Φ10
Flam
e Sp
eed,
Em
issi
ons
CO emission
NOx emissionFlame Speed
Lea
n Pr
emix
ed
No
Prem
ix
Wobbe IncreaseExcess Fuel
Wobbe DecreaseExcess Air
Part
ially
Pre
mix
ed
10
Emis
sion
s, T
empe
ratu
re
Equivalence Ratio , Φ10
Flam
e Sp
eed,
Em
issi
ons
CO emission
NOx emissionFlame SpeedCO emission
NOx emissionFlame Speed
Lea
n Pr
emix
ed
No
Prem
ix
Wobbe IncreaseExcess Fuel
Wobbe DecreaseExcess Air
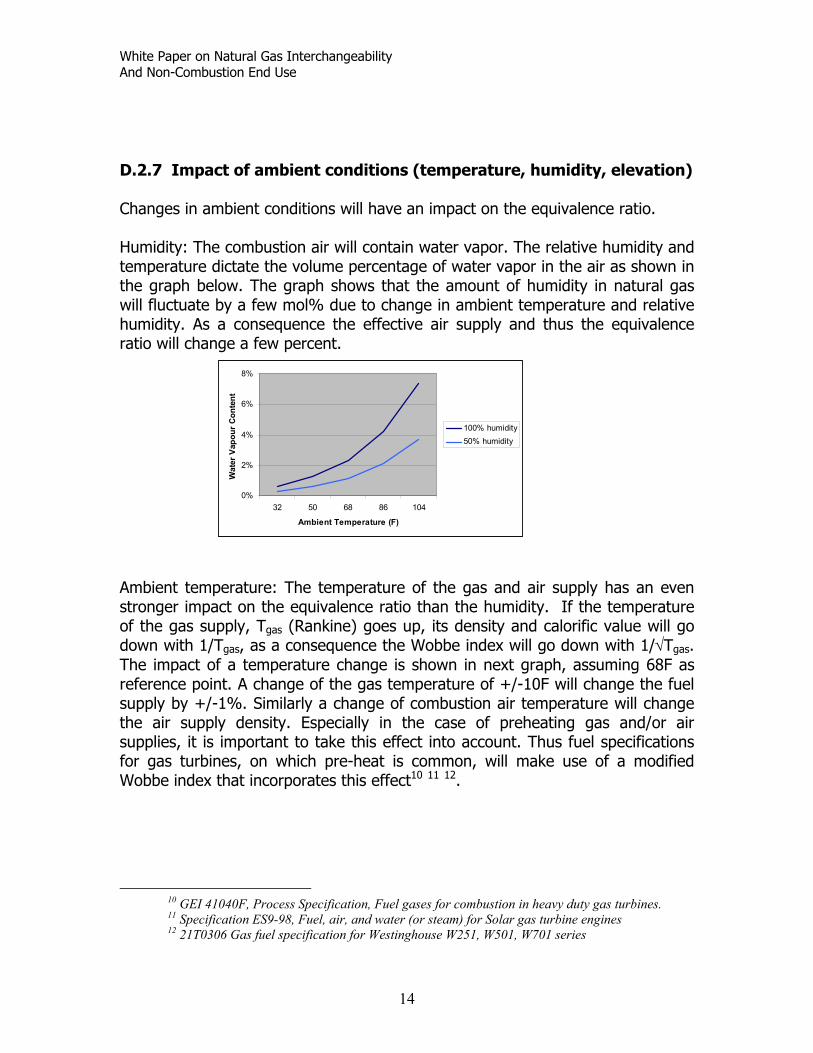
White Paper on Natural Gas Interchangeability And Non-Combustion End Use
D.2.7 Impact of ambient conditions (temperature, humidity, elevation) Changes in ambient conditions will have an impact on the equivalence ratio. Humidity: The combustion air will contain water vapor. The relative humidity and temperature dictate the volume percentage of water vapor in the air as shown in the graph below. The graph shows that the amount of humidity in natural gas will fluctuate by a few mol% due to change in ambient temperature and relative humidity. As a consequence the effective air supply and thus the equivalence ratio will change a few percent.
0%
2%
4%
6%
8%
32 50 68 86 104
Ambient Temperature (F)
Wat
er V
apou
r Con
tent
100% humidity50% humidity
Ambient temperature: The temperature of the gas and air supply has an even stronger impact on the equivalence ratio than the humidity. If the temperature of the gas supply, Tgas (Rankine) goes up, its density and calorific value will go down with 1/Tgas, as a consequence the Wobbe index will go down with 1/√Tgas. The impact of a temperature change is shown in next graph, assuming 68F as reference point. A change of the gas temperature of +/-10F will change the fuel supply by +/-1%. Similarly a change of combustion air temperature will change the air supply density. Especially in the case of preheating gas and/or air supplies, it is important to take this effect into account. Thus fuel specifications for gas turbines, on which pre-heat is common, will make use of a modified Wobbe index that incorporates this effect10 11 12.
10 GEI 41040F, Process Specification, Fuel gases for combustion in heavy duty gas turbines. 11 Specification ES9-98, Fuel, air, and water (or steam) for Solar gas turbine engines 12 21T0306 Gas fuel specification for Westinghouse W251, W501, W701 series
14
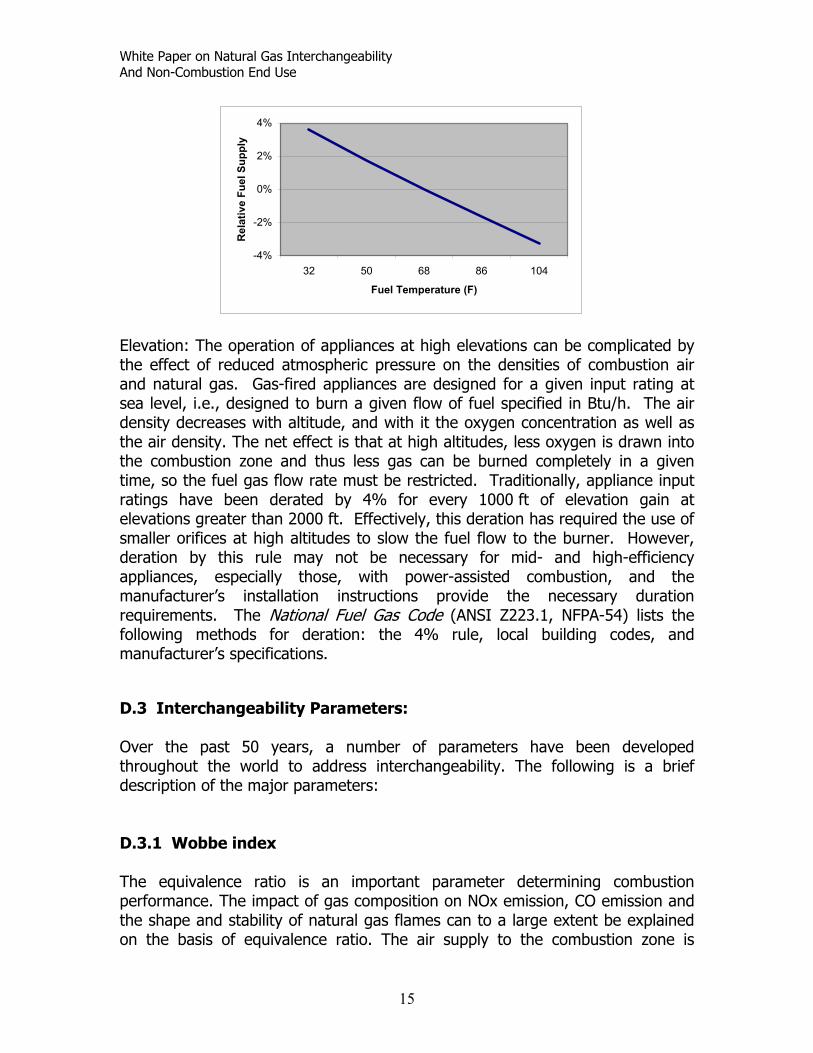
White Paper on Natural Gas Interchangeability And Non-Combustion End Use
-4%
-2%
0%
2%
4%
32 50 68 86 104
Fuel Temperature (F)
Rel
ativ
e Fu
el S
uppl
y
Elevation: The operation of appliances at high elevations can be complicated by the effect of reduced atmospheric pressure on the densities of combustion air and natural gas. Gas-fired appliances are designed for a given input rating at sea level, i.e., designed to burn a given flow of fuel specified in Btu/h. The air density decreases with altitude, and with it the oxygen concentration as well as the air density. The net effect is that at high altitudes, less oxygen is drawn into the combustion zone and thus less gas can be burned completely in a given time, so the fuel gas flow rate must be restricted. Traditionally, appliance input ratings have been derated by 4% for every 1000 ft of elevation gain at elevations greater than 2000 ft. Effectively, this deration has required the use of smaller orifices at high altitudes to slow the fuel flow to the burner. However, deration by this rule may not be necessary for mid- and high-efficiency appliances, especially those, with power-assisted combustion, and the manufacturer’s installation instructions provide the necessary duration requirements. The National Fuel Gas Code (ANSI Z223.1, NFPA-54) lists the following methods for deration: the 4% rule, local building codes, and manufacturer’s specifications.
D.3 Interchangeability Parameters:
Over the past 50 years, a number of parameters have been developed throughout the world to address interchangeability. The following is a brief description of the major parameters: D.3.1 Wobbe index The equivalence ratio is an important parameter determining combustion performance. The impact of gas composition on NOx emission, CO emission and the shape and stability of natural gas flames can to a large extent be explained on the basis of equivalence ratio. The air supply to the combustion zone is
15

White Paper on Natural Gas Interchangeability And Non-Combustion End Use
independent of the gas composition. The impact of gas quality on fuel supply is dictated by the Wobbe index. Thus the impact of gas composition on CO emission, NOx emission and flame speed can be quite accurately estimated on the basis of the Wobbe index, without the need to take specific gas compositional aspects into account. However the Wobbe index does not provide a fully comprehensive description of interchangeability for all applications, e.g. in case of yellow tipping the Wobbe index as such is not sufficient. The Wobbe index will also not provide a complete description of the interchangeability for lean premixed burners. For a more complete description additional parameters are required. Usually this is done by an additional limit on heating value or setting separate compositional restrictions. Examples of this will be discussed in section 5.
D.3.2 Modified Wobbe Index In the fuel specifications for gas turbines the Wobbe index takes a central role13 14. There is only a slight difference in that commonly a modified Wobbe Index, Wmod, is being used:Wmod = HVnet/√(G*Tgas), where HVnet is the Net Calorific Value (NCV), instead of the Gross Calorific Value, and Tgas is the Rankine temperature of the fuel gas at the fuel nozzle inlet. The temperature correction reflects the fact that the fuel gas is preheated prior to mixing with air in order to prevent condensation of liquids and increase the efficiency of combined cycle plants and the impact this has on the fuel supply ratio as explained previously. Preheat temperatures usually vary from 80 F to 360 F. Sometimes the Modified Wobbe Index is also referred to as the Gas Index. Turbine manufacturers use HVnet instead of the HV used in the common Wobbe index, as flue gases will leave the turbine with water in the vapor phase. Thus the use of HVnet in the modified Wobbe index gives a better reflection of the thermal burner load for a gas turbine with preheated fuel. Note that the Modified Wobbe Index must be calculated using the temperature at the fuel nozzle inlet, not at inlet to the transmission and distribution grid.
D.3.3 AGA
13 GEI 41040G; Specification for fuel gases for combustion in heavy-duty gas turbines, GE publication.
14 Siemens Westinghouse Gas Fuel specifications for W251, W501, W701 series, June 2001
16

White Paper on Natural Gas Interchangeability And Non-Combustion End Use
More than 50 years ago, AGA conducted extensive experimental studies on gas interchangeability. Tests were done on a specially developed Bunsen-type burner with partial premixing, the so-called AGA “precision burner”. Based on this experimental work several empirical parameters were developed to address Yellow Tipping, Flame Lift and Flash Back (flash back was relevant as the use of manufactured gas was still quite common). This work has been published in AGA Bulletin 3615 ; Acceptable limits for the Lifting Index (IL), Flash-Back Index (IF) and Yellow Tip Index (IY) were determined. The indices are not absolute numbers but are based on a reference or adjustment gas that is typically representative of the historic gas serving a particular area. The following tables are copied from the AGA Bulletin 36 and provide AGA’s empirical constants as well as the formula’s required for calculation. Subscript “s” denotes substitute gas and subscript “a” denotes an adjust gas.
17
15 AGA Research Bulletin 36, Interchangeability of other fuel gases with natural gases, 1946.

White Paper on Natural Gas Interchangeability Non-Combustion End Use
And
18
Although the formulas in the tables above do not make this immediately clear, there is a link between AGA criteria and the Wobbe index and Heating Value of the gas. This can be exemplified by calculating the AGA parameters for many different natural gases and by plotting the data in a 2-dimensional plot with color reflecting a fail or a pass of the AGA interchangeability as done in the next graph.
1280
1300
1320
1340
1360
1380
1400
1420
1440
1000 1050 1100 1150
HHV (Btu/scf)
Wob
be (B
tu/s
cf)
Unfeasible for Natural Gas
Empirically determined, wrt reference gas C1=95%, C2=4%, C3=0.25%, N2=0.75%
IL > 1.06Lifting
AGA indices
IY < 0.88YellowTipping
1280
1300
1320
1340
1360
1380
1400
1420
1440
1000 1050 1100 1150
HHV (Btu/scf)
Wob
be (B
tu/s
cf)
Unfeasible for Natural Gas
Empirically determined, wrt reference gas C1=95%, C2=4%, C3=0.25%, N2=0.75%
IL > 1.06Lifting
AGA indices
IY < 0.88YellowTipping

White Paper on Natural Gas Interchangeability And Non-Combustion End Use
D.3.4 Weaver/Bureau of Mines
In the 1950’s while working for the U.S. Bureau of Mines, E.R.Weaver expanded the AGA test regime on lifting, yellow tipping and flash back, by adding separate parameters for incomplete combustion, burner load and air supply. These included values such as flame speed and incomplete combustion. Below, are the formulas required to calculate the Weaver interchangeability indices:
1) JA = As )/( saa DAD
is the Weaver index for air supply. 2) J F = -1.4 Jas SS / A+0.4 is the Weaver index for flashback. For gases that are exactly interchangeable with respect to flash-back, JF=0 3) JH =Hs )/( saa DHD
is the Weaver index for burner load and is equivalent to a Wobbe index ratio. 4) JI = JA-0.366 -0.634 as RR /is the Weaver index for incomplete combustion. For exact interchangeability JI=0 5) JL = JA ( )(100-Qas SS / s)/(100- ) aQ is the Weaver index for lifting. For exact interchangeability JL=1 6) JY = JA-1+( )/100 as NN −is the Weaver index for yellow tipping. For gases that are exactly interchangeable, JY=0
As with the AGA calculations, the subscript “a” denotes the original adjust gas and subscript “s” the new substitute gas. The constants and factors in the above indices are defined as follows: A = cubic feet of air required for the complete combustion of 1 cubic foot of gas. D = relative density of gas expressed as specific gravity referred to air as unity. S = maximum flame speed in a mixture of the gas with air, expressed as a fraction of the flame speed for hydrogen
S =18.185...
+−++++
QZAcFbFaF cba
19

White Paper on Natural Gas Interchangeability And Non-Combustion End Use
In which a, b, c, … are the fractions by volume of various combustible constituents of the fuel gas, are corresponding values of the coefficient F listed below, A is the volume of air required to burn one volume of gas, and Z and Q are, respectively, the fraction by volume of inert gases, chiefly carbon dioxide and nitrogen, and of oxygen in the fuel.
,...,, cba FFF
Gas Gross Calorific Value (btu/scf); H
Specific Gravity; D
Air requirement; A
Flame Speed Factor; Fa
Methane 994.1 0.55 9.55 148 Ethane 1757 1.04 16.71 301 Propane 2535 1.56 23.87 398 Butane 3330 2.09 31.03 513 N2 - 0.97 - - Carbondioxide - 1.53 - - Oxygen - 1.11 -4.78 -
Where: H = heating value of gas in Btu/scf. R = ratio of number of atoms of hydrogen in all forms of combination in the fuel gas to the number of carbon atoms in the hydrocarbons. (carbon monoxide is excluded) Q = percentage of oxygen in the fuel gas. N = number of “readily liberated atoms” of carbon per hundred molecules of gas. All carbon atoms of unsaturated and cyclic hydrocarbons and all but one atom per molecule of saturated hydrocarbons are considered to be readily liberated. Hence, N represents the number of carbon atoms in hydrocarbons minus the number of molecules of saturated hydrocarbons.
Although the formulas in the tables above do not make this immediately clear, there is a link between Weaver criteria and the Wobbe index and Heating Value of the gas. This can be exemplified by calculating the Weaver parameters for many different natural gases and by plotting the data in a 2-dimensional plot with color reflecting a fail or a pass of the Weaver interchangeability criteria as is shown in the next graph. From this graph it is clear that the Weaver interchangeability criteria, can to a good extent be set by limits on the heating value and the Wobbe index .
20

White Paper on Natural Gas Interchangeability And Non-Combustion End Use
1280
1300
1320
1340
1360
1380
1400
1420
1440
1000 1050 1100 1150
HHV (btu/scf)
Wob
be (b
tu/s
cf)
Jy > 0.15Yellow Tipping
JL < 0.95Lifting
JI > 0.042Incomplete Combustion
Unfeasible for Natural Gas
Empirically determined, wrt reference gas C1=95%, C2=4%, C3=0.25%, N2=0.75%
Weaver indices
1280
1300
1320
1340
1360
1380
1400
1420
1440
1000 1050 1100 1150
HHV (btu/scf)
Wob
be (b
tu/s
cf)
1280
1300
1320
1340
1360
1380
1400
1420
1440
1000 1050 1100 1150
HHV (btu/scf)
Wob
be (b
tu/s
cf)
Jy > 0.15Yellow Tipping
JL < 0.95Lifting
JI > 0.042Incomplete Combustion
Unfeasible for Natural Gas
Empirically determined, wrt reference gas C1=95%, C2=4%, C3=0.25%, N2=0.75%
Weaver indices
21
D.4 Setting gas quality specifications
D.4.1 Selection of the interchangeability parameters: Wobbe, AGA or Weaver The impact of gas composition on CO emissions, NOx emissions and flame speed can to a large extend be understood on the basis of the Wobbe index. This makes the Wobbe index a simple, easy to calculate and robust parameter to describe interchangeability. However, some of the empirical parameters such as the Weaver indices can give a more accurate description of several specific interchangeability issues on partially premixed Bunsen-type burners. The diagram plotted above shows the discrepancy between the Wobbe index and the various Weaver indices. The discrepancies will increase with a step-out on gas composition (i.e. step-out on heating value). The discrepancy for lifting is negligible. The discrepancy for incomplete combustion is small. The discrepancy for yellow tipping is significant. However, by adding an upper limit to the gross calorific value (GCV) the interchangeability area is almost identical as that achieved by limit on three Weaver indices for a mixture of alkanes and inerts. Instead of a limitation on GCV this can also be achieved by a limit on specific density or by imposing separate compositional limits. In the next section we will provide examples for each of these. The resulting shortcomings of the Wobbe index are especially small if compared to fluctuations in the system caused by e.g. humidity, temperature and equipment settings. Also note that although the Weaver indices give a better description than the Wobbe index of specific issues for a specific type of burner, it does not cover all interchangeability issues for all types of burners. To that end many more
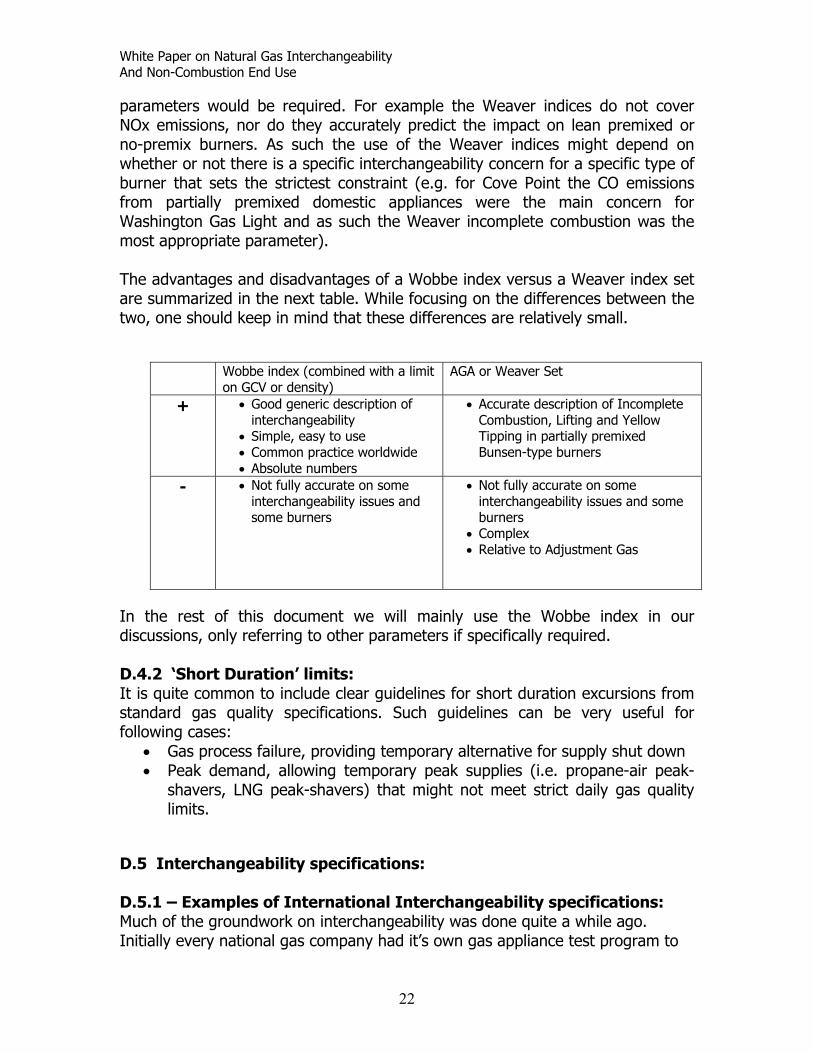
White Paper on Natural Gas Interchangeability And Non-Combustion End Use
parameters would be required. For example the Weaver indices do not cover NOx emissions, nor do they accurately predict the impact on lean premixed or no-premix burners. As such the use of the Weaver indices might depend on whether or not there is a specific interchangeability concern for a specific type of burner that sets the strictest constraint (e.g. for Cove Point the CO emissions from partially premixed domestic appliances were the main concern for Washington Gas Light and as such the Weaver incomplete combustion was the most appropriate parameter). The advantages and disadvantages of a Wobbe index versus a Weaver index set are summarized in the next table. While focusing on the differences between the two, one should keep in mind that these differences are relatively small.
Wobbe index (combined with a limit
on GCV or density) AGA or Weaver Set
+ • Good generic description of interchangeability
• Simple, easy to use • Common practice worldwide • Absolute numbers
• Accurate description of Incomplete Combustion, Lifting and Yellow Tipping in partially premixed Bunsen-type burners
- • Not fully accurate on some
interchangeability issues and some burners
• Not fully accurate on some interchangeability issues and some burners
• Complex • Relative to Adjustment Gas
In the rest of this document we will mainly use the Wobbe index in our discussions, only referring to other parameters if specifically required. D.4.2 ‘Short Duration’ limits: It is quite common to include clear guidelines for short duration excursions from standard gas quality specifications. Such guidelines can be very useful for following cases:
• Gas process failure, providing temporary alternative for supply shut down • Peak demand, allowing temporary peak supplies (i.e. propane-air peak-
shavers, LNG peak-shavers) that might not meet strict daily gas quality limits.
D.5 Interchangeability specifications:
D.5.1 – Examples of International Interchangeability specifications: Much of the groundwork on interchangeability was done quite a while ago. Initially every national gas company had it’s own gas appliance test program to
22

White Paper on Natural Gas Interchangeability And Non-Combustion End Use
come up with it’s own interchangeability criteria. In the USA, AGA and the Bureau of Mines leading to the AGA and Weaver indices did this work. In the UK, the work started with Gilbert and Prigg and was further improved by Dutton. In France, most of the work was done by Delbourg. A good overview of all this initial work has been provided by GRI16. Previously it has been shown that the AGA, Weaver and Dutton interchangeability criteria can be viewed as ‘corrections’ to the Wobbe index to give a more accurate prediction of incomplete combustion, yellow tipping and lifting for partially premix Bunsen-type burners. More recent interchangeability analyses draw on this earlier work, but recent gas quality specifications simplify to the basic Wobbe index range often with separate limits on gross calorific value and/or density. All the separate interchangeability indices are not included. Below we will give a list with some examples. Note this list is by far from complete: Europe The gas transmission networks of all European countries (including UK) are interconnected with one another. However, all the countries have their own national gas quality specifications (see below). With the implementation of a single internal gas market in Europe, the existence of different requirements throughout Europe regarding natural gas quality have appeared to be a potential barrier for interoperability of natural gas networks. A pan-European joint industry task force (EASEE-GAS) has been addressing the need to harmonize gas quality specifications for cross-border trade and gas imports. In 2005 this joint-industry task force reached agreement on harmonized gas quality specifications and a phased implementation approach17. The harmonized gas quality specifications use the Wobbe index as the interchangeability parameter with following range:
• Wobbe Max = 15.81 kWh/m3 (~1449 btu/scf)
• Wobbe Min = 13.76 kWh/m3 with targeted future lowering to 13.60 kWh/m3 (~1246 Btu/scf).
This reflects a +/-7.5% Wobbe range. EASEE GAS specifications contain additional limits on relative density (0.555-0.700). There are, however, no separate limits on Heating Value and/or hydrocarbon compositional limits. Germany
16 GRI-80/0021; P.T.Harsha, R.B.Edelman and D.H.France, Catalogue of existing interchangeability prediction methods, 1980
17 EASEE-GAS CBP Gas Quality Harmonization February 2005, http://www.easee-gas.org/
23

White Paper on Natural Gas Interchangeability And Non-Combustion End Use
In Germany gas quality specifications are set by the Deutsche Vereinigung des Gas- und Wasserfaches (DVGW)18. Germany has two sets of transmission networks, one for low (L) and one for high (H) calorific gas both with their separate Wobbe index and density ranges. Italy In Italy the gas quality specification are set by Snam Rete Gas the company that operates the natural gas pipeline network in Italy. Gas quality specifications are set in their Network Code. The specifications provide limits for the Wobbe index as well as the density19. Japan Japan uses re-gasified LNG as well as manufactured gas. The main gas quality parameter is the Wobbe Index. There are two different Wobbe index ranges with the selected range based on the specific metropolitan area. New Zealand A committee with multiple stakeholder representatives prepared a joined proposal for a gas quality standard. The New Zealand Standards council accepted this proposal in 199920. The standard is based on the Wobbe index with a separate limit on density. Brazil In Brazil the gas quality specifications are set by the Agencia National do Petroleo. In 2002 the gas quality specification was revised. Separate gas quality specifications are set for three different regions in the country. The specifications are based on the Wobbe index but include separate limits on gross calorific value. The specifications also include separate compositional limits on methane, ethane, propane and butane21. Mexico In Mexico gas quality specifications are set for the entire natural gas pipeline and distribution network by the Secretary of Energy advised by the federal regulator, Comision Reguladora de Energia (CRE) and set in the NOM001. In its 2003 review CRE suggested to replace the orignal compositional constraints (C3+ limits) in NOM001 with a more meaningful Hydrocarbon dew point and limits on the Wobbe index and the Gross Calorific Value. The proposal was accepted by a
18 G260, Technische Regeln Gasbeschaffenheit, Deutsche Vereinigung des Gas- und Wasserfaches e.V., January 2000. 19 Network Code SNAM Rete Gas, http://www.snamretegas.it 20 New Zealand Standard 5442:1999 21 Agencia Nacional de Petroleo, Portaria 104, 8 July 2002
24

White Paper on Natural Gas Interchangeability And Non-Combustion End Use
large majority of the stakeholders and the new NOM001 became effective in May 200422. Country Wobbe
Index Range
Other Parameters
Regional/National Short Duration Limits
Year of last modification
EC +/-7.5% density EC import and cross-border trade
No 2005
UK +/-5% Incomplete Combustion Factor + Sooting Index
National Yes 1996
Germany +/-10% Relative Density L-Cal and H-Cal network
Yes 2000
Italy +/-5% Relative Density and GCV
National No -
Japan +/-5% Combustion Potential23
Regional - -
New Zealand
+/-6% Relative Density National Yes 1999
Brazil +/-6% GCV and Compositional Limits
Regional No 2002
Mexico +/-5% GCV National Yes 2003 D.5.2 Examples of existing Interchangeability specifications in US: D.5.2.1 Southern California Gas Company Southern California Gas Company provides natural gas distribution services to over five million customers in Southern California. There are two sources for this gas, interstate gas suppliers and intrastate California gas suppliers. The interstate gas comprises about 88% of the total supply and originates primarily in the Rocky Mountains, Texas and in the San Juan Basin. The interstate gas supplies are delivered to the Southern California Gas Company system through six pipeline interties along the Colorado River and along the pipeline corridor between Needles and Bakersfield. The interstate gas supplies are delivered at forty-two locations, in the coastal areas from Orange County to Santa Barbara County, the Los Angeles Basin and in the San Joaquin Valley of Central California. Also, there is a supply from an intrastate utility Intertie in the San Joaquin Valley.
22 Norma Oficial Mexicana NOM-001-SECRE-2003
23 Combustion Potential is a measure of flame speed. Flame speed parameters are relevant as Japan also uses manufactured gas.
25

White Paper on Natural Gas Interchangeability And Non-Combustion End Use
59%20%
12%
9% SWRockiesCalifCanada
SoCalGas Total Supply Mix for 2003
59%20%
12%
9% SWRockiesCalifCanada
SoCalGas Total Supply Mix for 2003
In 2003, the interstate supplies had a Wobbe number range from 1314 to 1373. The intrastate supplies had a Wobbe number range from 1270 to 1440. Range of Acceptability (CPUC TARIFF Rule 30) has been used for more than 30 years by SoCalGas to determine if new supplies could be accepted. For supplies outside this range, interchangeability has been employed on occasion to provide entry into the system on a short term basis as long as the out of range gas can be managed. The interchangeability has been specified in contracts since 1985. Meet the American Gas Association's Wobbe Number, Lifting Index, Flashback Index and Yellow Tip Index interchangeability indices for high methane gas, as revised by the American Gas Association from time to time, relative to a typical composition of Gas in Utility's system [near the points of receipt]. Acceptable specification ranges are: Wobbe Number (W for typical system gas composition, WP for Producer) : 0.9W < WP < 1.1W
26

White Paper on Natural Gas Interchangeability And Non-Combustion End Use
• Lifting Index (IL): IL < 1.06
• Flashback Index (IF): IF < 1.2
• Yellow Tip Index (IY): IY > 0.8 Also included was a minimum Btu limit of 970 Btu/cf (high heating value dry). There was no maximum Btu limit specified in 1985. In the early 1990s, higher efficient appliances were required and appliance service people were verifying that BTU input rates were within ±5% of the manufacturers rated input rate. In 1994, there were recent and potential Btu increases of more than 5% due to changes in local California gas production. SoCalGas investigated the field performance of residential and commercial appliances in these affected areas. The field investigation found no problems, but recommended that Btu fluctuations should be minimized to no more than a 15% Btu spread and to have it verified by a controlled engineering evaluation. A follow-up engineering study was conducted by SoCalGas in 1995, to establish an acceptable Btu range. It was found that most appliances tested performed satisfactorily from 970 to 1150 btu/cf. It was found that for some newer appliances (premixed burners) the AGA interchangeability calculations did not accurately predict performance. Based on these investigations, maximum btu limit of 1150 Btu/cf was added to CPUC Rule 30 ( www.socalgas.com/regulatory/tariffs/tm2/pdf/30.pdf). As a continual safety effort, SoCalGas has initiated tests and studies from 2003, along with others. These studies indicate a potential for improper equipment operation when fuel gas composition changes and air/fuel mixtures remain fixed or have limited capacity to adjust. SoCalGas has been assessing the acceptability of heating value ranges and is currently considering to replace the AGA Bulletin 36 interchangeability indices with a maximum Wobbe index of 1400. D.5.2.2 QuestarGas Company Questar Gas Company is a local distribution company held by Questar Corporation, an integrated natural gas company that also holds Questar Pipeline Company, an interstate pipeline company and Questar Market Resources Company, an unregulated exploration and production company. Questar Gas serves over 790,000 customers in three states – Utah, Southwest Wyoming, and Southeastern Idaho. Questar Pipeline transports the majority of Questar Gas’ gas supplies from producing basins in the Rocky Mountain region. Questar Gas supplies its customers with gas purchased from third parties and obtained from its Company owned production. The producing basins in the vicinity of Questar
27

White Paper on Natural Gas Interchangeability And Non-Combustion End Use
Gas' service territories are some of the fastest growing the United States. These basins include Green River, Uinta, Ferron, Sandwash, Overthrust, and Piceance. Questar Gas has historically relied on these producing basins to supply gas to its customers. In 1929, Questar Pipeline’s predecessor company constructed a pipeline from Southwest Wyoming to deliver gas from a newly discovered gas field near Rock Springs, Wyoming to customers along the "Wasatch Front", a series of communities that extend south to north and include Utah’s population centers (Salt Lake City, Ogden, and Provo). The pipeline, in concert with the distribution market, stimulated the discovery of producing fields that were eventually connected to Questar Pipeline's system. Gas from these fields typically had high heat content. In addition, much of the production was not processed to remove heavy hydrocarbons, which contributed to the high delivered Btu value. Based on the supplies available during this early era, an appliance Btu set-point of 1088 (with a corresponding Wobbe index of 1386) was established. For over sixty years, the Btu content of the gas delivered to Questar Gas trended downward, but not to a level to cause concerns about interchangeability. By the late 1990’s, at least three trends developed that signaled the potential for gas interchangeability problems in the future. First, Questar Pipeline observed that as the price spread between natural gas liquids and natural gas widen (A Dth of liquid was more valuable in the liquid phase than the gas phase), processors delivering gas to Questar Pipeline with cryogenic plants would extract ethane from the gas stream. This would have the impact of significantly reducing the heating value of the delivered stream. Much of the gas that enters Questar Pipeline’s northern system is processed in cryogenic plants and if all these plans are in high-ethane recovery mode, the reduction in heating value of gas delivered to Questar Gas through its Northern gate stations could cause interchangeability problems. Second, Questar Gas interconnected with Kern River pipeline. The heating value of gas supplies received from Kern was usually lower than supplies received from Questar Pipeline. Second, the first commercially successful coalbed methane development started producing significant volumes in the Ferron field near Price, Utah. (Most geologists do not recognize Ferron as a separate producing basin but rather an extension of the Uinta Basin.) The gas being produced from the development had a heating value of about 980 and a CO2 content of around 3% (the corresponding Wobbe number is 1,283). Much of the produced gas actually had CO2 content higher than 3% but producers processed the gas to the 3% level to meet Questar Pipeline’s total inert specification. This gas met all other Questar Pipeline quality specifications along with most interstate pipeline gas quality specifications as well. The Ferron production enters Questar Pipeline’s system upstream of Questar Gas' Indianola and Payson gate stations. Attached is a schematic that
28
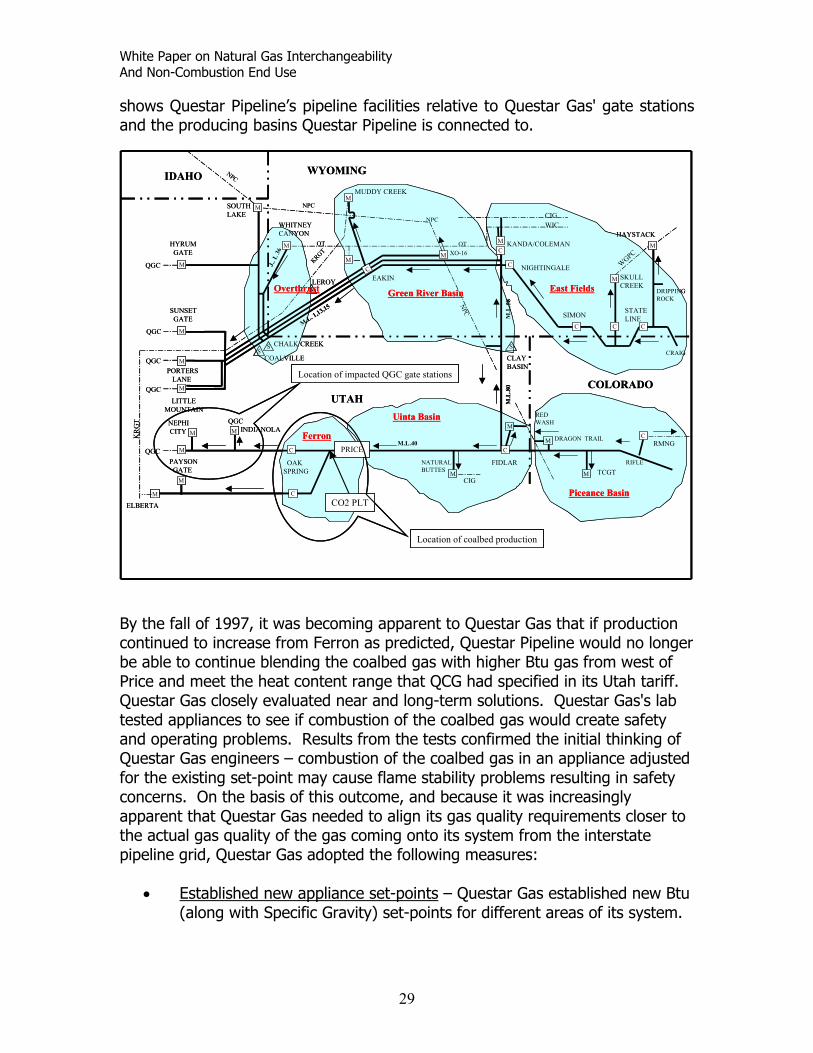
White Paper on Natural Gas Interchangeability And Non-Combustion End Use
shows Questar Pipeline’s pipeline facilities relative to Questar Gas' gate stations and the producing basins Questar Pipeline is connected to.
y the fall of 1997, it was becoming apparent to Questar Gas that if production r
f
ser to
• Established new appliance set-points
C
M
M TCGTFIDLAR
MCIG
NATURALBUTTES
CRMNG
RIFLE
REDWASH
M.L
.80
S
CLAYBASIN
CRAIG
C
DRIPPINGROCK
STATELINE
M SKULLCREEK
C
SIMON
M
HAYSTACK
WGPCC NIGHTINGALE
M.L
.58NPC
C
M
MM OT
MMUDDY CREEK
WHITNEYCANYON
OT
J.. L
36
KRGT
Y EAKIN
M.L. 1,13,15
CIGWIC
M.L.40C
OAK SPRING
M
M
M
M
M
MM INDIANOLAQGCNEPHI
CITY
PAYSONGATE
S CHALK CREEKS
COALVILLE
LITTLEMOUNTAIN
PORTERSLANE
SUNSETGATE
HYRUMGATE
QGC
QGC
QGC
QGC
QGC
KR
GT
IDAHO WYOMING
UTAHCOLORADO
NPC
NPC
SOUTHLAKE
MC
KANDA/COLEMAN
PRICE
M
M DRAGON TRAIL
NPC
XO-16
C
CO2 PLTCM
ELBERTA
M
Location of coalbed production
Location of impacted QGC gate stations
C
M
M TCGTFIDLAR
MCIG
NATURALBUTTES
CRMNG
RIFLE
REDWASH
M.L
.80
S
CLAYBASIN
CRAIG
C
DRIPPINGROCK
STATELINE
M SKULLCREEK
C
SIMON
M
HAYSTACK
WGPCC NIGHTINGALE
M.L
.58NPC
C
M
MM OT
MMUDDY CREEK
WHITNEYCANYON
OT
J.. L
36
KRGT
Y EAKIN
M.L. 1,13,15
CIGWIC
M.L.40C
OAK SPRING
M
M
M
M
M
MM INDIANOLAQGCNEPHI
CITY
PAYSONGATE
S CHALK CREEKS
COALVILLE
LITTLEMOUNTAIN
PORTERSLANE
SUNSETGATE
HYRUMGATE
QGC
QGC
QGC
QGC
QGC
KR
GT
IDAHO WYOMING
UTAHCOLORADO
NPC
NPC
SOUTHLAKE
MC
KANDA/COLEMAN
PRICE
M
M DRAGON TRAIL
NPC
XO-16
C
CO2 PLTCM
ELBERTA
M
Location of coalbed production
Location of impacted QGC gate stations
SLERO
Piceance Basin
Uinta Basin
Ferron
East FieldsGreen River BasinOverthrustSLERO
Piceance Basin
Uinta Basin
Ferron
East FieldsGreen River BasinOverthrust
Bcontinued to increase from Ferron as predicted, Questar Pipeline would no longebe able to continue blending the coalbed gas with higher Btu gas from west of Price and meet the heat content range that QCG had specified in its Utah tariff. Questar Gas closely evaluated near and long-term solutions. Questar Gas's lab tested appliances to see if combustion of the coalbed gas would create safety and operating problems. Results from the tests confirmed the initial thinking oQuestar Gas engineers – combustion of the coalbed gas in an appliance adjustedfor the existing set-point may cause flame stability problems resulting in safety concerns. On the basis of this outcome, and because it was increasingly apparent that Questar Gas needed to align its gas quality requirements clothe actual gas quality of the gas coming onto its system from the interstate pipeline grid, Questar Gas adopted the following measures:
– Questar Gas established new Btu (along with Specific Gravity) set-points for different areas of its system.
29
White Paper on Natural Gas Interchangeability And Non-Combustion End Use
Questar Gas also revised the gas quality specifications in its tariff to better conform with its upstream pipeline service providers.
• Adjusted appliances in communities directly fed by the Ferron gas –
Several smaller communities in the vicinity of Price, Utah directly received gas supply from coalbed sources. Questar Gas inspected and adjusted customer appliances in the impacted communities to operate at the new established set-points.
• Reduce CO2 content of Ferron gas – Questar Gas contracted to have gas
processed from a CO2 content of 3% to a level of about 1%. Removing CO2 increases the heating value of the gas but more importantly decreases the Specific Gravity (thus raising the Wobbe index from 1,297 to 1,334). Processing allowed Questar Gas to continue to receive the coalbed gas and still deliver interchangeable gas to customers whose appliances were adjusted for the original set-point.
• Inspect and adjust appliances in Questar Gas' system – Questar Gas has
embarked on a long-term program that has customers’ appliances inspected, and if necessary adjusted, to conform to the new appliance set-points. Questar Gas refers to this program as the “Green Sticker” program. Questar Gas service technicians and licensed heating, ventilation and air conditioning contractors place a green sticker on appliances that have been inspected and, if necessary, adjusted.
Since 1998, Questar Gas has been actively managing the interchangeability issues described above. At times, this has not been an easy process. Questar Gas experience has been that many areas of its operations are impacted including Gas Control, Field Operations, Legal, Regulatory, Rates and Engineering. Questar Gas' overriding focus has been to deliver a product to its customers that is safe and reliable. D.5.2.3 Cove Point The re-commissioning of the Cove Point LNG import facility was approved by FERC in October 2001. Following protests from Washington Gas and Light (WGL), the LDC that would receive much of its gas directly from the Cove Point facility, the maximum HHV (high heating value) for send out gas was limited at 1065 Btu/scf. An agreement was made in which WGL agreed to raise the maximum HHV of the gas leaving Cove Point to 1100 Btu/scf, as long as certain interchangeability criteria could be met. Initially the criteria included the AGA parameters for yellow tipping and lifting, combined with the Weaver parameter
30

White Paper on Natural Gas Interchangeability And Non-Combustion End Use
for incomplete combustion. The interchangeability criteria were such that the specific limits fell within the historical distribution for pipeline gas. An independent consultant, TIAX, was asked to study a possible relaxation of those interchangeability indices. The study involved testing of domestic and commercial appliances. The testing re-confirmed that interchangeability parameters provide a good description of interchangeability. Based on the outcome of those tests TIAX proposed to change the AGA parameters for a set of Weaver indices (Yellow Tipping, Lifting and Incomplete Combustion) with the following limits24:
• Weaver lift index > 1.0
• Weaver Yellow Tipping < 0.119
• Weaver Incomplete Combustion < 0.030
• HHV maximum 1100 Btu/scf
• N2 maximum 4.0% The revised tariff for Cove Point LNG was approved by FERC in 2003. High Btu LNG can comply with these limits with N2 injection. (Cove Point currently has one N2 injection unit of 12 mmscfd capacity allowing 1.5% N2 injection at maximum send-out capacity. Installation of additional N2 injection units will be required for send-out of high btu LNG.) The maximum heating value of LNG, that the tariff allows to be brought into Cove Point is 1138 Btu/scf. D.2.5.4 Xcel Energy Natural gas supplies on the Colorado Front Range are blended with air for the purpose of Btu stabilization in the Xcel Energy gas delivery system. The original supply of natural gas to the Denver area contained high levels of nitrogen and was characterized by Wobbe indices of 1200-1250. As additional supplies with Wobbe indices of 1300-1350 became available from Wyoming, the issue of interchangeability became critical. In the late 1970s, the Institute of Gas Technology performed appliance testing and interchangeability calculations and determined that the new supplies could not be safely substituted for the existing base gas because of the risk of yellow tipping and incomplete combustion.25 The 24 Wrt following adjust gas: Adjust Gas:Methane 95.2%, Ethane 2.81%, Propane 0.44%,iButane 0.07%, n-Butane 0.08%, i-Pentane 0.06%, n-Pentane 0.05%, Nitrogen 0.53%, Carbon Dioxide 0.76%
25Scott, M. I., Interchangeability of Wyoming Natural Gas and Denver Adjustment Gas (Natural Gas), Final Report, IGT Project 8899. Institute of Gas Technology, February, 1978.
31

White Paper on Natural Gas Interchangeability And Non-Combustion End Use
most feasible and economic solution to address the interchangeability concern was to blend air into the new supplies to reduce the Wobbe index to the acceptable values. Air compressors have been installed at three stations supplying Denver and the surrounding areas. The quality of the gas-air mixture is controlled by measuring the oxygen content and Wobbe Index. The air added is typically 5-8% of the gas flow. In other locations, Xcel Energy has solved interchangeability concerns with supplies by changing the burner orifices in the entire regional distribution systems. This was done in the city of Fort Collins, located 70 miles north of Denver, in 1968, to accommodate higher HHV gas and the remaining area north of Denver was also so modified in the early 1980s. In 1995 a similar effort in the mountain area near Vail, Colorado, was completed. These modifications are time-consuming and labor-intensive and are only undertaken if no other alternatives are available. The utility must enter all homes and businesses to install the new orifices in all of the appliance burners and to adjust all air shutters and manifold pressures to insure proper combustion. Follow-up inspections are necessary to verify that the work has been performed properly and to minimize the liability associated with improper adjustments. Xcel Energy has developed curves based on the Wobbe Index to define the allowable range of gas composition in its system and to control the amount of air blended into the gas supply. A typical utilization curve is shown in Figure D.1. The curve defines the allowable deviations from the target or adjustment gas, which is defined by the composition of the historical base gas. The upper and lower lines represent differences of ±4% from the Wobbe Index of the target gas. Upper and lower limits are also placed on the heating value and specific gravity. Interchangeability calculations show that gases on the limit lines are interchangeable with the target gas. However, gases represented by opposite ends of the limit box may not be interchangeable with each other if using the AGA Bulletin No. 36 and/or Weaver methods.
32

White Paper on Natural Gas Interchangeability And Non-Combustion End Use
920
960
1000
1040
1080
1120
0.6 0.65 0.7 0.75 0.8
Specific Gravity
Hea
ting
Valu
e (B
tu/s
cf)
Supply 1
Supply 2
Supply 3
Supply 4
Supply 5
Quality Control Box
Target Wobbe
Adjustment Gas
945 Btu/scf
0.625 SG
1100 Btu/scf
0.77 SG
1130 Wobbe
1280 Wobbe
1210 Wobbe
Figure D.1 Xcel Energy Utilization Curve Interchangeability calculations are also used to establish gas quality limits during peak load. For example, the air injection capability at a particular mixing station may not be sufficient to reduce the Wobbe Index to the target value of 1210 on the coldest winter days. Therefore Short-duration limits have been developed using the interchangeability program. Maximum allowable Wobbe indices for one hour and one day are specified, respectively, by calculations of yellow tipping from AGA Bulletin No. 36 and the incomplete combustion index from the Weaver method.
33

White Paper on Natural Gas Interchangeability And Non-Combustion End Use
34
White Paper on Natural Gas Interchangeability And Non-Combustion End Use
Appendix E Managing Interchangeability
Grant McCracken Cheniere LNG
E.1 Options for Managing Interchangeability There are three categories of options for managing interchangeability. The categories are:
• Management at the production source • Management prior to introduction into the transmission pipeline system • Management at the point of end use.
Each of these options is described below and placed in context with the existing infrastructure. E.2 Management at the Production Source Natural gas interchangeability can be managed nearby the source of production. For domestic supply, this generally entails treating and processing gas to reduce concentrations of inerts, contaminants such as corrosive compounds and hydrocarbons other than methane. Gas is treated to remove inerts and corrosive compounds such as water, hydrogen sulfide, carbon dioxide and nitrogen. Gas is processed through refrigeration, lean oil absorption, or cryogenic extraction to remove various levels of natural gas liquids (NGLs) such as ethane, propane, butanes, pentanes and hexanes plus. The level of NGL removal is dependent upon the technology, existing NGL infrastructure, economics and known gas specification requirements. Some existing and future domestic supply sources do not have access to processing plants and may not be sufficient in volume to justify the cost of compliance.
Imported LNG is processed at the production source primarily for the removal of butanes plus (C4+) level of the NGLs. This means LNG generally does not contain the heavier hydrocarbons but does contain appreciable concentrations of ethane and propane. LNG suppliers could add additional equipment to remove ethane and propane (C2/C3) from their gas stream but have historically elected to produce a higher Btu content LNG. It is important to note that Japan, Korea
1

White Paper on Natural Gas Interchangeability And Non-Combustion End Use
and Taiwan import over 50% of globally traded LNG, and their gas specification of relatively high C2/C3 content has served as the basis of many current and future LNG supplies. Also, many LNG supply regions lack infrastructure and markets for extracted the C2/C3 product. In addition, economics favor leaving the C2/C3 fraction in the gas as transportation and sales are executed on an energy, or “dekatherm” basis. Reducing the C2/C3 fraction reduces the energy value of the LNG and reduces the economic value of each cargo. Conceivably, LNG producers have the option of injecting inerts at the production source as well; however, the transportation economics virtually preclude this as a viable option. E.3 Management Prior to Introduction Into the Transmission Pipeline System Imported LNG can be processed to reduce the C2/C3 fraction at the LNG receiving terminal. LNG terminal operators or shippers contracting with terminal operators or third parties can use C2/C3 separation technology to achieve the desired interchangeability indices. The economics of this option are dependent upon the economics of of ethane and propane extraction and the proximity of local C2/C3 markets and/or available infrastructure. Given these facts, this is not an economically attractive option except in the Gulf (Texas and Louisiana) or in coastal locations where there is sufficient demand for ethane and propane. The economics in the Gulf are not what they once were as the domestic petrochemical market has shrunk in recent years. There are no NGL extraction plants associated with the three existing terminals along the East Coast. There is a small slipstream NGL extraction facility operated by a third party in the Gulf. Conceivably, LNG terminal operators have the option of using an extracted NGL product stream as a source of energy; however, this is generally not a viable option as the volumes produced are likely to far exceed the energy consumed (check). Injection of an inert gas is an option at the LNG terminal. There are three types of inerts that can be used:
• Nitrogen • Air • Flue gas.
2

White Paper on Natural Gas Interchangeability And Non-Combustion End Use
Inert gas injection reduces the heating value and increases the density of the gas, and as a consequence reducing the interchangeability indices such as the Wobbe Index. For example, injection of one (1) percent by volume of nitrogen or air reduces the Wobbe Index of natural gas by approximately 1.3 percent1 The costs of air injection are significantly lower than N2 injection. Air injection has been historically used for managing interchangeability. It is common in propane/air peak shaving and is also used in some regions of the US where the base natural gas supplies currently contain less inerts than the historical appliance adjustment gases. There is one drawback with air injection, as it introduces oxygen into the natural gas; for example, injection of 3 percent air by volume results in an oxygen level to approximately 0.6 mol%. Such high oxygen levels may not be acceptable because of current tariff restrictions, concerns on pipeline integrity impact on feedstock plants and other end uses, such as peak-shaving, and underground gas storage.
Injection of flue gas is an option; however, it requires that a source of flue gas be in immediate proximity of the terminal. None of the domestic terminals use flue gas injection. In addition, the presence of oxygen in the flue gas poses the same issues described in the previous subsection. Blending within a receiving terminal is conceivably an option. A gas meeting interchangeability specifications can be blended with a gas not meeting specifications. A terminal operator may have the option to blend two LNG sources to achieve an overall specification however, this would create operational issues and to rely on this option would reduce overall terminal capacity. As such, blending is not an option of consequence for terminal operators.
Blending applied by the pipeline operator is also a conceivable option. However, widespread use of blending is out of the direct control of the pipeline operator. The transportation of natural gas is governed by nomination of volumes and specification of receipt and delivery points as specified daily, and sometimes within a day, by shippers. Consequently, the pipeline blending that occurs is coincidental and cannot be planned to achieve a specific end point or specification. Management of interchangeability of domestic gas is described in section 7.1, through processing prior to introducing it into the pipeline transmission system.
1 The reduction in a parameter such as Wobbe will be greater that the simple reduction in heating value alone as the specific is also reduced.
3

White Paper on Natural Gas Interchangeability And Non-Combustion End Use
It is important to note that following implementation of FERC Order 636, significant numbers of independent producers emerged and over time have entered into contracts with pipelines to transport their gas without prior processing. This occurred as the production grew up nearby the existing pipeline infrastructure and producers determined that it was either infeasible or not economically attractive to process. The volumes of any one source tended to be small and pipelines were often able to take advantage of incidental blending to achieve a gas that was interchangeable.
In summary, when considering all of the options described above, inert injection is the most widely applicable option. C2/C3 separation may be a viable option in particular situation.
E.4. Management at the Point of End Use Injection of an inert gas may also be an option for certain end-use customers. The management process would be similar to that described in Section E.3 Management Prior to Introduction Into the Transmission Pipeline System but on a smaller scale. For some large industrial natural gas customers in France, such as several glass manufacturing factories, air injection equipment has been used to stabilize the quality of their fuel gas. There are also options that can provide greater clarity for equipment manufacturers and aid in development of North American interchangeability Standards. The options include
• Addition of specificity to design and installation standards • Development and implementation of a limit-gas testing regime.
Each of these is described in greater detail below. In general, end use equipment is designed presuming that a gas stream of known composition will be the fuel source on a continual basis. As described above, the nature of the domestic natural gas has changed over time. Also, the composition of natural gas varies from region to region within the country. Manufacturers could adjust the design basis for particular end use applications, especially for low emission equipment. Also manufacturers could adjust combustion equipment at the factory and seal the equipment to ensure that it arrives for installation in a configuration consistent with the design basis.
4

White Paper on Natural Gas Interchangeability And Non-Combustion End Use
End use equipment manufacturers do provide instructions for installing and placing equipment into service. Manufacturers and even national consensus standards developing organizations could develop standards for installing and placing equipment into service that ensures that the equipment is set up and being installed consistent with the design basis. The standards could also provide guidance for installers in the event that factory settings are found to be out of spec.
Much of the end use equipment in place today is placed into service using one test gas, usually whatever the gas is at the time the testing in undertaken. National consensus standards developing organization or manufacturers working together could define a multiple test-gas testing regime. This is the approach that is used in the European Community for appliances. A benefit of this approach is that it defines the working range for end use equipment. The working range can then be factored into broader interchangeability standards.
In summary these options are of value for equipment that will be manufactured, installed and placed into operation in the future. Applying these for end use applications with large fleets in place, such as appliances will be extremely costly.
5

White Paper on Natural Gas Interchangeability And Non-Combustion End Use
6

White Paper on Natural Gas Interchangeability And Non-Combustion End Use
Appendix G Derivation of Interim Guideline Calculations
Rosemarie Halchuk Xcel Energy
Bob Wilson Keyspan
G.1 Background The Interim Guideline limits proposed in this document have been developed for gas supplies to those market areas without extended experience with gas supplies characterized by Wobbe numbers higher than 1,400 or heating values higher than 1,110 Btu/scf. It should be noted that the Work Group selected an operating regime based on Wobbe and heating value, but that other combinations of parameters, such as heating value and specific gravity, are possible. The combination of Wobbe and heating value was chosen because the calculation of these gas properties is straightforward using gas chromatographic data and furthermore, because these parameters are already in common use in many sectors of the U. S. gas industry. In addition, these properties are relevant to most end-use applications, including traditional and low emission combustion equipment as well as feedstock and process applications. Development of the interim guidelines included the following steps:
• Comparison of expected LNG to historical supplies • Estimation of a national average adjustment gas • Traditional calculations based on interchangeability indices to develop
maximum Wobbe and heating value limits • Development of local specifications and absolute maximum limits.
The details of these steps are discussed below. G.2 Comparison of LNG to Historical Gas Supplies
The first step in developing the Wobbe and heating value limits was to compare these parameters for expected LNG compositions to historical gas supplies in the
1

White Paper on Natural Gas Interchangeability And Non-Combustion End Use
US. At the time that the NGC+ Technical Work Group was formed, the 1992 GRI report on gas compositions in 26 major US cities was the most comprehensive, publicly available set of gas analysis data.1 Current data collection efforts are underway to update and expand the database, but the results have not been finalized and are not yet published. Figure G.1 shows annual average Wobbe Numbers and heating values for the reporting city gate stations in the 1992 GRI report and for expected LNG supplies. The box in Figure G.1 represents an envelope of gas compositions that have been historically delivered to and successfully utilized by LDCs in the U. S. that participated in the study, and this envelope can be considered to establish a “gas map” of U. S. adjustment gases, i.e., gases to which appliances and other equipment have been set up and on which they have operated. It is clear from Figure G.1 that the expected LNG compositions, which include both non-blended and inert-stabilized sendouts, do not fall inside the U. S. gas map.
The Work Group believed that the gas map boundaries could be extended to higher Wobbe Numbers and heating values based on two reasons: 1) Some LDCs receive gas deliveries with Wobbes in excess of the 1372 annual average maximum on the U. S. gas map. (In fact, the maximum of the individual Wobbe numbers reported in 1992 was 1418), and 2) Most end-use equipment has historically tolerated operation at Wobbes and heating values at some level above that of the adjustment gas. The goal of the NGC+ Technical Work Group, therefore, became the development of an upper boundary to the U. S. gas map that would maximize gas supply and that would still satisfy interchangeability requirements for end use equipment.
Figure G.1. Map of US Adjustment Gases (1992 GRI Data) and Expected LNG
1150
1200
1250
1300
1350
1400
1450
900 950 1000 1050 1100 1150 1200 Gross Heating Value (Btu/scf)
Wobbe
Wobbe-HHV Map NortheastSoutheastNorth Central South Central PacificMountainExpected LNG
1 “Variability of Natural Gas Composition in Select Major Metropolitan Areas of the United States,” Gas Research Institute, March 1992, GRI-92/0123.
2
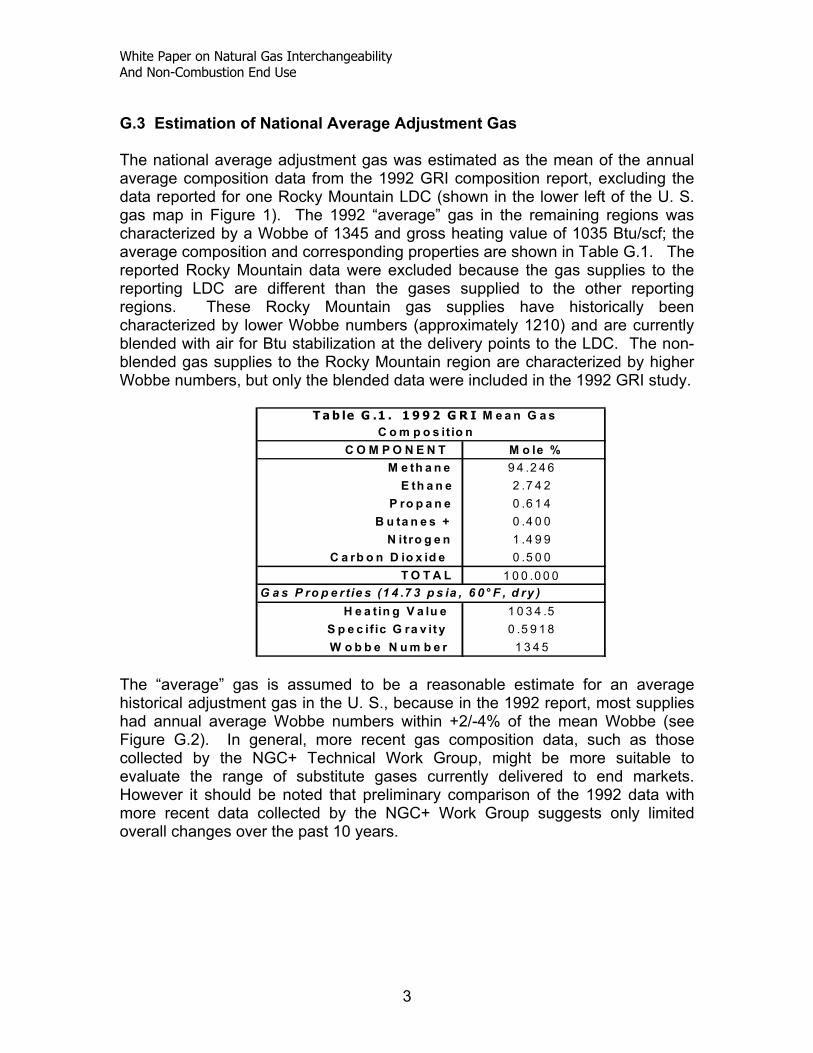
White Paper on Natural Gas Interchangeability And Non-Combustion End Use
G.3 Estimation of National Average Adjustment Gas
The national average adjustment gas was estimated as the mean of the annual average composition data from the 1992 GRI composition report, excluding the data reported for one Rocky Mountain LDC (shown in the lower left of the U. S. gas map in Figure 1). The 1992 “average” gas in the remaining regions was characterized by a Wobbe of 1345 and gross heating value of 1035 Btu/scf; the average composition and corresponding properties are shown in Table G.1. The reported Rocky Mountain data were excluded because the gas supplies to the reporting LDC are different than the gases supplied to the other reporting regions. These Rocky Mountain gas supplies have historically been characterized by lower Wobbe numbers (approximately 1210) and are currently blended with air for Btu stabilization at the delivery points to the LDC. The non-blended gas supplies to the Rocky Mountain region are characterized by higher Wobbe numbers, but only the blended data were included in the 1992 GRI study.
C O M P O N E N T M o le %M e th a n e 9 4 .2 4 6
E th a n e 2 .7 4 2 P ro p a n e 0 .6 1 4
B u ta n e s + 0 .4 0 0 N itro g e n 1 .4 9 9
C a rb o n D io x id e 0 .5 0 0 T O T A L 1 0 0 .0 0 0
H e a tin g V a lu e 1 0 3 4 .5 S p e c if ic G ra v it y 0 .5 9 1 8 W o b b e N u m b e r 1 3 4 5
G a s P ro p e r t ie s (1 4 .7 3 p s ia , 6 0 °F , d ry )
T a b le G .1 . 1 9 9 2 G R I M e a n G a s C o m p o s it io n
The “average” gas is assumed to be a reasonable estimate for an average historical adjustment gas in the U. S., because in the 1992 report, most supplies had annual average Wobbe numbers within +2/-4% of the mean Wobbe (see Figure G.2). In general, more recent gas composition data, such as those collected by the NGC+ Technical Work Group, might be more suitable to evaluate the range of substitute gases currently delivered to end markets. However it should be noted that preliminary comparison of the 1992 data with more recent data collected by the NGC+ Work Group suggests only limited overall changes over the past 10 years.
3

White Paper on Natural Gas Interchangeability And Non-Combustion End Use
G.4 Traditional Interchangeability Calculations There are currently no standard methods to evaluate the interchangeability of gases for all end-use applications. As discussed elsewhere in this document, the only available calculation methods to evaluate interchangeability are the various single and multiple index methods based on combustion behavior in traditional appliances. These calculation methods were chosen by the NGC+ Technical Work Group as the basis for the maximum limits for Wobbe Number and heating value. Calculations were performed with the most common interchangeability calculations in the U. S., Weaver2 and AGA Bulletin #36.3 The calculations used an adjustment gas corresponding to the 1992 average U. S. gas discussed above and various substitute gases based on LNG and and other high Wobbe Number mixtures. The major results of the calculations, as shown In Figure G.3, are limit lines for both Weaver Incomplete Combustion (JI ) and AGA Bulletin #36 Yellow Tipping (IY ). The Index limits for JI and IY were 0.86 and 0.05, respectively; these limits are the default values in the interchangeability program available from AGA.4 Each limit line divides the graph into areas that are interchangeable and not
2 Weaver, E., Formulas and Graphs for Representing the Interchangeability of Fuel Gases. Journal of Research of the National Bureau of Standards, Vol. 46, No. 3, March, 1951 3 Interchangeability of Other Fuel Gases with Natural Gas. American Gas Association Research Bulletin No. 36, 1946. 4 Interchangeability Program, Catalog No. XH8810, 1988. American Gas Association, Arlington, VA
4
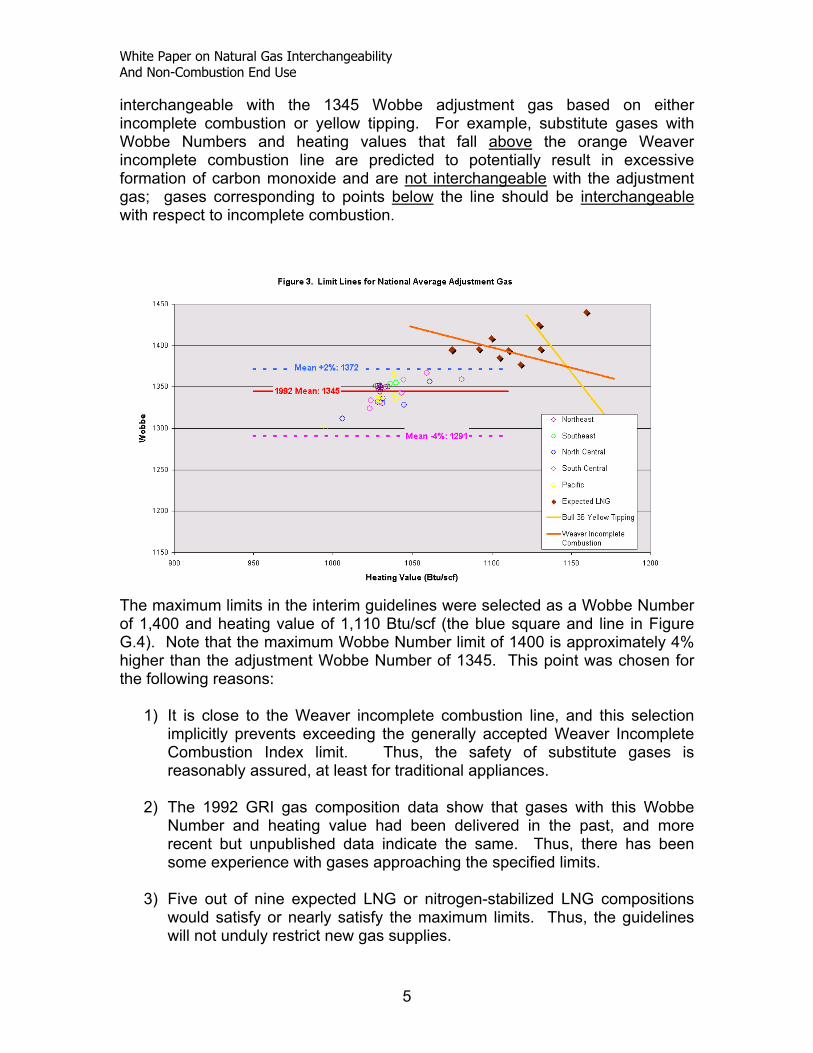
White Paper on Natural Gas Interchangeability And Non-Combustion End Use
interchangeable with the 1345 Wobbe adjustment gas based on either incomplete combustion or yellow tipping. For example, substitute gases with Wobbe Numbers and heating values that fall above the orange Weaver incomplete combustion line are predicted to potentially result in excessive formation of carbon monoxide and are not interchangeable with the adjustment gas; gases corresponding to points below the line should be interchangeable with respect to incomplete combustion.
The maximum limits in the interim guidelines were selected as a Wobbe Number of 1,400 and heating value of 1,110 Btu/scf (the blue square and line in Figure G.4). Note that the maximum Wobbe Number limit of 1400 is approximately 4% higher than the adjustment Wobbe Number of 1345. This point was chosen for the following reasons:
1) It is close to the Weaver incomplete combustion line, and this selection implicitly prevents exceeding the generally accepted Weaver Incomplete Combustion Index limit. Thus, the safety of substitute gases is reasonably assured, at least for traditional appliances.
2) The 1992 GRI gas composition data show that gases with this Wobbe
Number and heating value had been delivered in the past, and more recent but unpublished data indicate the same. Thus, there has been some experience with gases approaching the specified limits.
3) Five out of nine expected LNG or nitrogen-stabilized LNG compositions
would satisfy or nearly satisfy the maximum limits. Thus, the guidelines will not unduly restrict new gas supplies.
5
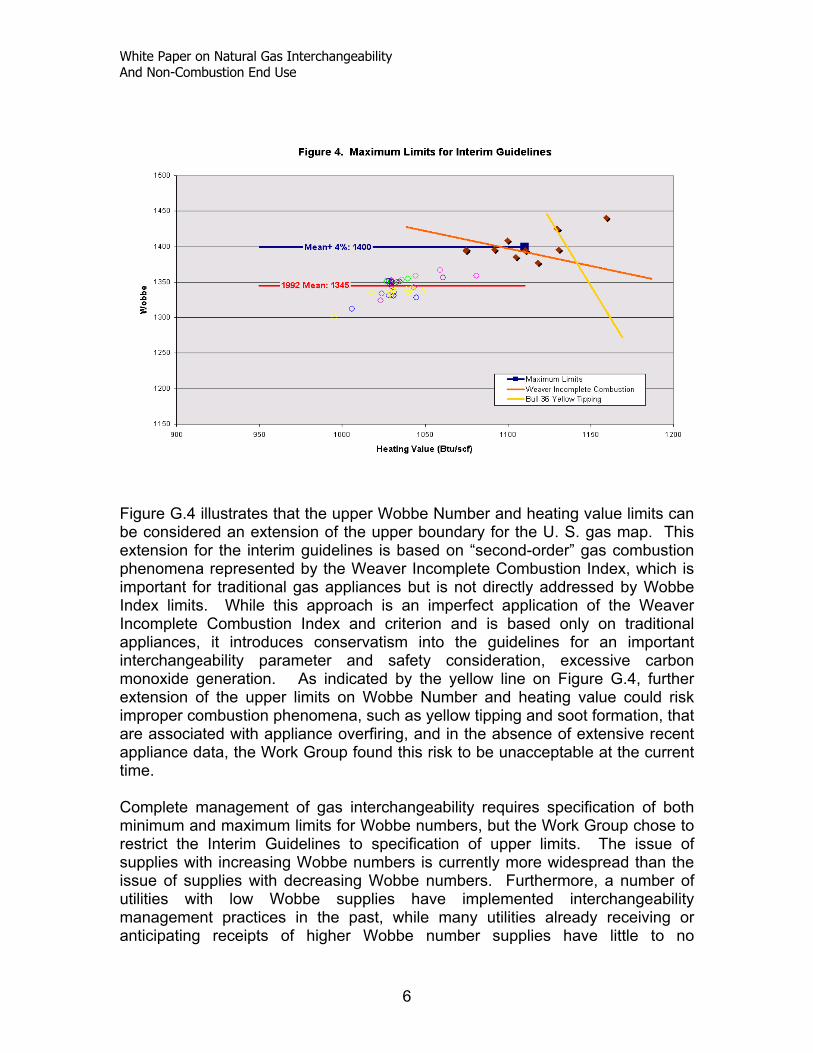
White Paper on Natural Gas Interchangeability And Non-Combustion End Use
Fff
Figure G.4 illustrates that the upper Wobbe Number and heating value limits can be considered an extension of the upper boundary for the U. S. gas map. This extension for the interim guidelines is based on “second-order” gas combustion phenomena represented by the Weaver Incomplete Combustion Index, which is important for traditional gas appliances but is not directly addressed by Wobbe Index limits. While this approach is an imperfect application of the Weaver Incomplete Combustion Index and criterion and is based only on traditional appliances, it introduces conservatism into the guidelines for an important interchangeability parameter and safety consideration, excessive carbon monoxide generation. As indicated by the yellow line on Figure G.4, further extension of the upper limits on Wobbe Number and heating value could risk improper combustion phenomena, such as yellow tipping and soot formation, that are associated with appliance overfiring, and in the absence of extensive recent appliance data, the Work Group found this risk to be unacceptable at the current time. Complete management of gas interchangeability requires specification of both minimum and maximum limits for Wobbe numbers, but the Work Group chose to restrict the Interim Guidelines to specification of upper limits. The issue of supplies with increasing Wobbe numbers is currently more widespread than the issue of supplies with decreasing Wobbe numbers. Furthermore, a number of utilities with low Wobbe supplies have implemented interchangeability management practices in the past, while many utilities already receiving or anticipating receipts of higher Wobbe number supplies have little to no
6

White Paper on Natural Gas Interchangeability And Non-Combustion End Use
experience in interchangeability management. The Work Group’s focus has therefore been evaluation of maximum Wobbe limits. The Work Group recognized the equal importance of a minimum Wobbe limit and the need for inclusion in the proposed research program. G.5 Development of Local Specification and Absolute Limits Figure G.1 shows that not all U. S. gases were characterized by annual average Wobbe Numbers of 1345, but interchangeability guidelines must be based on the actual historical supplies or established target gas in a given service territory. Based on the interchangeability calculations for the national average adjustment gas, the Work Group selected the same relative limit for the upper range of variability, namely, 4% greater than the actual historical or target Wobbe Number. Interchangeability calculations were not developed for Wobbe Numbers below the target, but the Work Group assumed that a symmetrical lower limit of –4% was justifiable based on available historical gas composition data. In addition, this lower limit is conservative for appliances adjusted in the middle of the specified range; based on the experience of several Work Group members, traditional interchange calculations would not predict flame stability problems until the Wobbe was significantly lower. To summarize, the Interim Guidelines specify:
A range of plus and minus 4% Wobbe Number Variation from Local Historical Average Gas or, alternatively, Established Adjustment or Target Gas for the service territory.
For service territories with no demonstrated experience (including historical supplies and/or testing), the limits of 1,400 Wobbe Number and 1,110 Btu/scf were selected as reasonable absolute maxima. It is important to note that both the relative and absolute limiting values in the Interim Guidelines simply serve to establish boundaries for market areas that have received historical gas supplies with gas quality close to the 1992 reported national mean and that have experienced successful end use with these gas supplies. Also, the limits are based on traditional interchangeability calculations and so may not be applicable to new burner designs in appliances or to other applications such as industrial burners, combustion turbines, gas engines and non-combustion processes. Nonetheless, these boundaries are based on the major predictive tools available in the U. S., and they should be applicable until additional research and/or experience has clearly demonstrated that end users in the affected market areas are not negatively impacted by supplies above the caps.
7

White Paper on Natural Gas Interchangeability And Non-Combustion End Use
8

White Paper on Natural Gas Interchangeability And Non-Combustion End Use
Appendix H Research Recommendations
Bob Wilson, Keyspan Rosemarie Halchuk, Xcel Energy
David Rue, GTI Ted Williams, AGA
Gas interchangeability research issues, needs, and recommendations were identified and developed by the Research Subgroup of the Gas Interchangeability Work Group, which included representatives of all major stakeholders active in the Work Group. The Research Subgroup considered major end user segments for which gas interchangeability data and technical analysis are currently incomplete. The following discussion of four major end user segments represents a concise synopsis of research issues, needs, and recommendations identified by the subgroup. The four segments include:
• Appliances
• Turbines, Microturbines, and Power Boilers
• Industrial and Commercial Burners
• Stationary and Vehicle Engines. End user segments represent major combustion applications for which gas interchangeability research is needed. Non-combustion (e.g., feedstock) applications of natural gas and infrastructure issues are not covered by this summary. However, specific research needs for these topic areas were identified in both this appendix and in the summary matrix (Table 1 of the White Paper). H.1 Appliances H.1.1 Background Gas interchangeability research on residential and commercial appliances has been conducted for decades to address changes in gas supply characteristics. Thorough accounts of early interchangeability research on appliances are
1
White Paper on Natural Gas Interchangeability And Non-Combustion End Use
provided by AGAH1 and Weaver.H2 In the 1970s and 1980s, a number of studies on appliances were performed in conjunction primarily with LNG import terminal projects in local or regional settings. More recently, studies by GTI,H3 TIAX, and Sempra Energy have separately addressed traditional and some modern appliance designs. Previous studies have also focused on the interchangeability of varying domestic base load supplies H4,H5 and peak-shaving supplies.H6 Table H.1 lists some of the studies covering a variety of gas interchangeability studies with focus upon appliance-related studies. Most, but not all, of the listed studies are publicly available.
Table H.1 Summary of Interchangeability Studies
American Gas Association, “Interchangeability, Chapter 2, Utilization: Book U-1,” Residential/Commercial, Gas Engineering and Operations Series, Arlington VA, 1994. Benson C.E., C.J. Orcheski, “Introduction of Vaporized Algerian LNG Into the COM/Gas Distribution System,” Arthur D. Little, Commonwealth Gas Company, Cambridge MA, 1989, Committee on Domestic Gas Research, “Gas Burner Utilization All Air for Combustion as Primary Air,” Research Bulletin No. 20, American Gas Association Testing Laboratories, Cleveland OH, February 1944. Committee on Domestic Gas Research, “Non-Aerated Burners,” Research Bulletin No. 32, American Gas Association Testing Laboratories, , Cleveland OH, September 1944. Committee on Mixed Gas Research, “Interchangeability of Other Fuel Gases with Natural Gases,” Research Bulletin 36, American Gas Association Laboratories, Cleveland OH, February 1946. Coward H.F., H.P. Greenwald, “Propagation of Flame in Mixtures of Natural Gas and Air,” Bureau of Mines, Department of Commerce, Washington DC, 1928. Eiseman J.H., R.A. Smith, C.J. Merritt, “The Effect of Altitude on the Limits of Safe Operation of Gas Appliances,” Bureau of Standards Journal of Research, American Chemical Society, Washington DC, March 1933. Estrada Jr. A.B., “The Effect of Gas Composition on Residential Appliance Burner Performance,” Symposium Paper, Natural Gas Quality & Energy Measurement, Institute of Gas Technology, Clearwater FL, February 5-7, 1996.
H1 “Utilization: Book U-1, Residential/Commercial, Gas Engineering and Operations Series, American Gas Association, 1994. H2 Weaver, Elmer R. “Formulas and Graphs of Representing the Interchangeability of Fuel Gases,” Journal of Research of the National Bureau of Standards, Vol. 46, No. 3, March 1951. H3 Johnson, Frank and Rue, David M., Gas Interchangeability Tests--Evaluating the Range of Interchangeability of Vaporized LNG and Natural Gas, GRI-03/0159, Gas Research Institute, Des Plaines IL, April 2003. H4 Scott, M. I., Interchangeability of Wyoming Natural Gas and Denver Adjustment Gas (Natural Gas), Final Report, IGT Project 8899. Institute of Gas Technology, February, 1978. H5 Estrada, A.B. Jr., The Effect of Gas Composition on Residential Appliance Burner Performance. Institute of Gas Technology, Gas Quality and Energy Measurement Symposium, Clearwater FL, February, 1995. H6 Kelton K., Appliance Performance and Changes in Gas Composition, American Gas Association, Distribution Conference, Denver CO, May, 1978.
2

White Paper on Natural Gas Interchangeability And Non-Combustion End Use
Gilbert T.M., C.W. Warner, “Why---and Where? Natural Gas Stabilization,” Gas Age, January 27, 1955. Halchuk R.A., “Btu Stabilization: To Air Is Natural,” Symposium Paper, Natural Gas Quality & Energy Measurement, Institute of Gas Technology, Clearwater FL, February 1996. Halchuk R.A., “Gas Quality Specification and Interchangeability for End Use Applications,” Conference Paper, Operations Conference, American Gas Association, Dallas TX, May 2001. Hanley W.E., “Gas Interchangeability: A P.C. Template,” Symposium Paper, Personal Computer Applications Symposium, Institute of Gas Technology, August2. 1988. Harsha P.T., R.B. Edelman, D.H. France, “Catalogue of Existing Interchangeability Prediction Methods,” GRI-80/0021, Gas Research Institute, Chicago IL, 1980. Harsha P.T., R.B. Edelman, D.H. France, “Efficient Utilization of Alternature Fuels - Development of Models for the Prediction of Interchangeability, Design, and Performance of Gas Burner/Combustor Systems,” GRI-79/0034, Gas Research Institute, Chicago IL, April 15, 1980. Harsha P.T., R.B. Edelman, R.J. Jensen, M.M. Sindir, T.S. Wang, “Performance Modeling of Advanced Gas Burner Systems,” GRI-83/0072, Gas Research Institute, Chicago IL, July 1983. Hoglund P.A., “International Standards: Let's Not Miss the Boat,” Gas Industries, October 1989. Johnson, Frank, Rue, David M., “Gas Interchangeability Tests--Evaluating the Range of Interchangeability of Vaporized LNG and Natural Gas,” GRI-03/0159, Gas Research Institute, Des Plaines IL, April 2003. Johnson P.C., “Interchangeability of Regasified LNG,” Conference Paper, Distribution/Transmission Conference, American Gas Association, Nashville TN, April 28-May 1, 1991. Kelton K., “Interchangeability of Refinery Gas and Natural Gas,” PSE&G, , October 26, 1971. Kelton K., “Appliance Performance and Changes in Gas Composition,” Conference Paper, American Gas Association Distribution Conference, Denver CO, May 1978. Liemsider T.J., “Gas Interchangeability,” Gas Operations School, New England Gas Association, Newark NJ, June 14, 1991. Long G., “Quality Requirements for Substitute Gas,” A.G.A. Monthly, June 1972. Loria R, D. DeWerth, “Improvements in Appliance Efficiency, Task 1 Upgrading Seasonal Efficiency of Gas-Fired Heating Appliance,” GRI-80/0043, American Gas Association Laboratories, Gas Research Institute, Cleveland OH, June 1980. McKenna, Jon T. Jr. Buckley, Charles P., “Utilization of High-Btu Imported LNG - A Distributor's Viewpoint,” Conference Paper (72-D-62), Boston Gas Company, AGA, Boston, Ma, April 1972. Rana, H. S., Johnston, D. S., “An Empirical Approach to Evaluating Gas Interchangeability,” Operations Conference Paper 03-0P-41, AGA Operations Conference, Orlando, FL, May 2003. Rijnaarts J.A., “Combustion Characterisitics of High-Density Natural Gas of The L Group,” Conference Paper, International Gas Research Conference, 1986. Rossbach E.O., S.I. Hyman, “Interchangeability: What It Means,” AGA Catalog No. XL0884, American Gas Association, , Washington DC, May 22, 1978. Seubert R.R., “Gas Interchangeability,” Paper, Gas Operations School, New England Gas Association, Waltham MA, June 15, 1989. Scott M.I., “Interchangeability of Wyoming Natural Gas and Denver Adjustment Gas (Natural Gas),” IGT
3

White Paper on Natural Gas Interchangeability And Non-Combustion End Use
Project 8899, Institute of Gas Technology, Colorado Interstate Gas Company, Colorado Springs CO, February 1978. Steinmetz G.F., “Quality Specification of Pipeline Natural Gas: Review of the US Situation,” Conference Paper, Congress of Gas Quality, Groningen The Netherlands, August 1986. Steinmetz G.F., “The Case for Compatible Standards Between Gas Appliance Performance and Natural Gas Quality,” Conference Paper, Spring National Meeting, American Institute of Chemical Engineers, New Orleans LA, March 6-10, 1988. Steinmetz G.F., “What is Natural Gas? - A New Approach to an Industry-Wide Problem,” G/A/S Newsletter, September 1988. Task Force on Operating Flexibility for Appliances Using Natural Gas, American National Standards Committee Z21, “Minutes of Meeting,” Cleveland, OH, February 21-22, 1984. Weaver E.R., “Formulas and Graphs for Representing the Interchangeability of Fuel Gases,” Journal of Research of the National Bureau of Standards, Vol. 46, No. 3, March 1951. Working Group on Interaction of Gases, “Problems Arising from the Interchangeability of Second Family Gases,” International Gas Union, 1983.
H.1.2 Research Issues and Needs A new phase of interchangeability research is currently necessary for several reasons including the development of new appliance designs and technology, consideration of traditional safety and performance criteria, and evolution of new performance criteria (i.e., efficiency requirements and ambient air emissions limits), The existing database on interchangeability relates to most of the “legacy” appliances in the currently installed stock, but the stock is changing in response to the new criteria on efficiency and emissions. Considerable discussion of “the most sensitive appliances” and whether new designs are more or less tolerant of variations in gas composition than “legacy” appliances has neither resolved these issues nor even established reliable trends for because there is currently no comprehensive or publicly available database on the sensitivity of combustion performance in new appliance technology to gas compositional changes.
4

White Paper on Natural Gas Interchangeability And Non-Combustion End Use
H.1.2.1 Review of Existing Interchangeability Project Results. Detailed review of existing, published data is required to evaluate the relevance, usefulness, and validity of these studies in formulating more general conclusions on gas interchangeability for today’s market. If, for example, a published study that derived guidance on interchangeability indices was based on appliances that no longer exist in the current stock of appliances, the study data and conclusions may not be as useful for general conclusions on interchangeability in its contemporary sense. Also, test methods must be reviewed, and, where possible, experimental error and judgment must be evaluated to determine the reliability of study data and conclusions. H.1.2.2 Identify New Appliance Types. Appliances not represented in the interchangeability studies literature must be identified and evaluated for potential future testing. Common features of appliance types need to be identified and categorized to streamline future testing and to avoid over-sampling. Categorization may be based, for example, on burner type, heat exchanger design, and/or combustion air supply, although it is uncertain at this time whether such gross design similarities in new appliances can fully capture interchangeability performance. H.1.2.3 Standardize Results from Previous Interchangeability Studies. Interchangeability studies have been undertaken for different purposes, from testing of new gases introduced in a service territory to derivation of new interchangeability indices. Test results from these studies, however, are compiled in a generally similar way, describing flame performance and emissions for specific tests. Results from this extensive database need to be compiled in a standardized manner so that they are useable in arriving at general conclusions across all the studies. In addition, calculation of all relevant indices should be conducted on these data, regardless of whether the data were originally used in conjunction with the indices or not. H.1.2.4 Identify Common Conclusions. Comparison of the results of previous interchangeability studies is needed to assess whether common conclusions on interchangeability indices and metrics can be applied across the entire range of appliances and equipment tested. Practical and valid guidance on supply requirements can only be achieved by general conclusions on interchangeability measures that assure acceptable performance and safety in appliances. H.1.2.5 Assemble Previous Data for Interchangeability Parameters. Behind many of the published studies are data reports and other records that
5

White Paper on Natural Gas Interchangeability And Non-Combustion End Use
support interchangeability indices and parameters for those indices. Major data sources, particularly those supporting specific “default” numerical parameters for indices, need to be assembled and reviewed for validity in describing acceptable performance of appliances and providing general guidance on gas interchangeability. H.1.2.6 Measure Carbon Monoxide (CO) Production. CO production, a major and traditionally used criterion for acceptable appliance performance, must be measured, particularly for new appliance designs and baselines of performance (such as ANSI Z21/83 performance requirements) must be evaluated and applied to appliance test data to determine acceptability. H.1.2.7 Evaluate Current Standards for Appliance Testing and Emissions Limits. Current design certification testing of appliances under ANSI Z21/83 does not test for limits of performance in response to changes in supply composition. However, certification testing does incorporate a number of test gases, although not all test gases are included in full performance testing. The standards must be evaluated to determine whether the current test gases and performance tests can be revised to directly address interchangeability issues or whether new testing approaches, including limit gas testing that was considered in the 1980s, are needed to assess interchangeability. H.1.2.8 Conduct Long-Term Testing of Sensitive Appliances. Appliances identified as “sensitive” in terms of emissions (such as those close to design certification limits), high thermal excursions and/or other critical performance must be studied in long term testing that spans and exceeds the projected lifetimes. Emissions performance and durability can be affected by age, and by high heat environments can cause aging acceleration. It must be determined whether gas composition changes can result in critical rates of higher heat generation. Design certification may be a poor predictor of these changes over time and may not identify performance changes that may exceed design certification or changes in the life of critical components such as heat exchangers or controls. H.1.2.9 Group Appliances by Statistically Relevant Categories by Range of Type and Ages. Statistical descriptions of the installed appliance stock and shipments of new appliances should be used with categorizations of appliance types and designs on a national and, if sufficient detail is available, local basis. This characterization will allow assessment of the potential impacts of future candidate interchangeability limits that are different than the Interim Guidelines. This grouping will allow reasonable description of the impacts of revised gas interchangeability proposals on the number and types of appliances affected, the nature of the specific impacts, and ultimately, the societal risk of introducing broader interchangeability tolerances.
6
White Paper on Natural Gas Interchangeability And Non-Combustion End Use
H.1.2.10 Statistically Evaluate Appliance “Maladjustment” Over Time. In In this context, maladjustmentrefers to appliances that were improperly adjusted - or not at all adjusted - at the time of installation and/or to appliances whose adjustment may have changed over time due to lack of periodic maintenance. The magnitude and frequency of maladjustment must be determined in order to identify vulnerabilities of end use consumers to emissions exceeding design or target limits and to potential economic losses from premature failure. The regional characteristics for maladjustment must also be evaluated to determine if maladjustment is more critical in some areas, such as those located at high altitudes, for example. If the research determines that the magnitude and frequency of maladjusted appliances are significant, consideration of maladjusted appliances may limit the ranges for acceptable interchangeability indices, and more conservative parameters may be required to reduce the prospect of malfunctions that create safety hazards. On the other hand, if the research determines that magnitude and frequency of maladjustment is not critical, then less conservative parameters may be acceptable. However, it is important to note that at the current time, the societal risk of such malfunctions cannot be adequately assessed because the magnitude and frequency of maladjustment is generally unknown. H.1.2.11 Determine if Limit Gas Testing Would Enhance Equipment Flexibility With Varying Fuel Compositions. Limit gas testing on appliances was considered for incorporation in the Z21/83 design certification tests in the U.S. in the early 1980s.H9 However, as concern over strong variations in U. S. gas supply abated later in the decade when natural gas supply in most areas of the U. S. stabilized, the additional expense of such testing was seen as unjustified. On the other hand, Europe proceeded with limit gas testing in individual countries, and ultimately, the European Union facilitated market integration by basing acceptability of appliances on diverse national supplies. Discussion of limit gas testing in the U. S. design certification tests has been revived as a means to assess gas interchangeability from the perspective of the changing gas supply. The additional testing costs must be evaluated against potential elimination of current tests (e.g., current tests on additional gases other than Test Gas A) and resulting efficiencies gained in the certification procedures. It is important to note that limit gas testing in design certification would only address interchangeability for new appliances, not for appliances currently in the installed stock.
H9 Steinmetz G.F., The Case for Compatible Standards Between Gas Appliance Performance and Natural Gas Quality, American Institute of Chemical Engineers, Spring National Meeting, New Orleans LA, March, 1988.
7

White Paper on Natural Gas Interchangeability And Non-Combustion End Use
H.2 Turbines, Microturbines & Power Boilers Significant data gaps and conflicting information exist from OEM’s regarding fuel composition variability relating to performance, combustion stability and emissions from modern low emission gas turbines. Actual test data considering fuel composition variability is not publicly available. Considering this end use category is one of the fastest growing areas of gas consumption and the potential consequences associated with equipment outages makes this research component a priority. H.2.1 Background Although modern gas turbines can operate on a wide variety of different gaseous fuels, dry low emission (DLE) turbines have very complicated combustion systems whose operation depends on a relatively consistent fuel composition to maintain acceptable hardware life and to ensure pollutant emission guarantees are met. Significant changes in fuel composition over a short period of time beyond which the equipment was originally designed and tuned to receive may have substantial detrimental effect on the operation of the unit. The degree of change that is significant is dependent upon which component of the gas is changing, with some deleterious effects occurring with relatively small changes while other changes in composition can be much larger with minimal impact. As a result, additional research is needed to understand the magnitude of compositional changes that impact turbine operations and emissions coupled with the time rate of change impacts on operability of these machines. While the White Paper suggests that a Wobbe variation of +/-4% of the historical adjustment gas will meet the needs of turbine operators, some OEM’s have expressed some reservations to these limits as being too broad to control emissions and meet current fuel specification guarantees. H.2.2 Research Issues and Needs An industry collaborative effort is necessary for this research to be effective. OEM’s, gas suppliers and equipment owner / operators all need to come to consensus as to how testing should proceed achieve the maximum benefit from the results. In summary, the following outlines the test program:
• Define and catalog the current range of gases and equipment configurations that successfully exist today.
8

White Paper on Natural Gas Interchangeability And Non-Combustion End Use
• Define reasonable variations in fuel compositions due to the addition of non-traditional supplies (LNG imports, unprocessed domestic supplies, coal bed methane etc).
• Identify “design” vs “as tuned” relationships for installed equipment. • Identify current systems response to increases in hydrocarbon
constituents beyond which the equipment was originally designed to handle. Monitoring to include emissions, performance and combustor dynamics. This testing should be conducted at base load with particular attention to start up cycles.
• Identify current systems response to decreases in hydrocarbon
constituents associated with Btu stabilization (addition of inerts) with the same tests as stated above.
• Repeat the abovementioned testing with units equipped with “active
tuning” hardware to understand the response characteristics. • Repeat testing as stated above under varying load conditions. • Repeat testing for various combustor design configurations including a
specific focus on High Pressure Ratio gas turbines (>19:1). H.2.2.1 Identify All Major Types and Manufacturers Equipment manufacturers should be identified along with specific equipment information including the types of combustor, combustion controls, secondary emission controls, fuel conditioning equipment, fuel gas monitoring equipment and instrumentation. H.2.2.2 Collect Manufacturer Data This process involves the collection of all available OEM test data that can be made publicly available to provide a basis fro developing the additional test methods and protocols necessary to fill the data gaps. H.2.2.3 Collect End User Data This process involves the collection of all available end user data to document practical operating experience that can be made publicly available to provide a
9

White Paper on Natural Gas Interchangeability And Non-Combustion End Use
basis for developing the additional test methods and protocols necessary to fill the data gaps. H.2.2.4 Develop Testing Methods and Protocols Standard test methods must be developed to include laboratory bench testing coupled with full scale testing at existing turbine installations based on information gathered in steps 2.2.2 and 2.2.3 A defined range of acceptability must also be established during test method development. H.2.2.5 Evaluate Specific Issues of Heavy Hydrocarbons (C4+) Turbine emissions must be evaluated considering specific hydrocarbon constituents including butanes +. Several pieces of conflicting currently exist around this constituent parameter that must be resolved. H.2.2.6 Evaluate Potential for Using Methane Number as an Interchangeability Index Interchangeability and fundamental combustion parameter relationships need to be evaluated during the testing and experimental design process to determine the interrelationships (if any) of these parameters in predicting fuel gas impacts on operability and performance. H.2.2.7 Assess Combustion Fundamentals Associated with Stability and Emissions Fundamental combustion theory suggests that emissions and combustion stability issues are potential consequences of varying fuel compositions over short periods of time. These “swings” in composition and the resultant impacts such as pressure pulsations, flame stability and emission impacts need to be confirmed in order to encourage greater fuel composition flexibility into the combustor design process. H.3 Industrial and Commercial Burners Industrial and commercial burners include burners used to provide heat and appropriate conditions for the conversion of materials into desired products. Under most circumstances, these burners are operated in conjunction with
10

White Paper on Natural Gas Interchangeability And Non-Combustion End Use
combustion control systems. Appliance burners often operate only intermittently, but industrial and commercial burners can operate most of the time or continuously for years. Firing capacities of individual industrial and commercial burners are usually much larger than appliance burners capacities, but ther are exceptions where industrial processes use small burners. H.3.1 Background Industrial burners vary tremendously in firing capacity, flame speed, method of mixing, flame shape, flame temperature, and other characteristics. Rather than classify the wide range of industrial burners by end use, they are best categorized by burner type. All manufacturers design and warrant burners and their performance, but no standard testing protocols are universally practiced or accepted to determine fuel impacts on burners or burners with their control systems. Because performance standards are high, burners have become highly engineered. This has made their performance more sensitive to small input changes. Efficiency, component life, and emissions are highly dependent on precise control of all aspects of the combustion process. The available information on changes in efficiency, performance, and emissions is very limited and needs to be expanded for sensitive classes of industrial burners. The information currently available is provided by equipment manufacturers which makes the data spotty and does not provide independent validation of the data. H.3.2 Research Issues and Needs H.3.2.1 Classify Burners and Combustion Systems by Type The wide range of industrial and commercial burners must first be classified by burner type (nozzle mixed, high momentum, oxy-gas, etc.). This list must include the principal characteristics of each burner type and the manufacturers producing that burner type. Preliminary review has found that most industrial burners can be classified into 20 to 30 major classes of burners. The list of burner types must also include a ranking that estimates the level of sensitivity of each burner type to fuel gas changes. This ranking is not meant to be exclusionary but to be a guide for testing. The ranking may help to reduce the number of burner types that need to be tested to evaluate the impacts of fuel interchangeability on industrial burners. H.3.2.2 Differentiate New Burner Types Under Development from Conventional Operating Burners The listing of burner types must include new high-efficiency and low-emission burners under development or just entering the market. Experimental burners
11

White Paper on Natural Gas Interchangeability And Non-Combustion End Use
do not need to be included until they reach development stage. The performance of these types of burners is especially sensitive to fuel gas changes because they can be tuned to narrow fuel gas heating value and composition ranges and because rapid swings in fuel gas can affect performance. H.3.3 Development of Methods to Characterize Industrial Burners H.3.3.1 Collect Data on Performance and Develop Consistent Basis for Interpretation Burner, control system, and equipment operators must be contacted to collect available performance data on the most sensitive types of industrial burners. The range of control options practiced with each sensitive burner type must also be identified. This information will be anecdotal and isolated in most cases but will provide needed background for the verified tested needed for interchangeability. H.3.3.2 Identify Test Methods by Type Several types of tests must be conducted with industrial burners and control systems. These include performance, operation, and emissions. Performance tests will evaluate the impacts of fuel changes on the control components, on equipment operation, on safety, on air to fuel ratio limits, etc. Operations tests will monitor characteristics such as flame length, flame temperature, flame shape, and other operations properties. Emissions tests will collect data on emissions changes relative to fuel gas changes. H.3.3.3 Develop Test Methods and Protocols A series of performance, operations, and emissions test protocols must be developed. These test methods must be well documented and repeatable by any testing facility. There are many ways, for example, to measure flame length. The objective must be to choose a reliable method that can be quantifiably employed by any testing group so that verifiable data can be collected. H.3.4 Industrial Burner Testing H.3.4.1 Test Set-Up for Industrial Burners Industrial burners and control systems are employed on small to very large processes in practice. Therefore, consideration must be given to test facility
12
White Paper on Natural Gas Interchangeability And Non-Combustion End Use
arrangements that accommodate this wide size range, the range of temperatures and firing rates used, and many other variations. No single laboratory arrangement can approximate all industrial applications. Therefore, a group of defined testing conditions must be defined that allow repeatable testing of industrial burners and control systems at conditions that come as close as possible to industrial practice. H.3.4.2 Industrial Burner Tests Tests must be conducted with 1) the industrial burners and control systems identified as most sensitive, 2) by the testing protocols developed, and 3) in facilities specified for testing to ensure repeatable results. Testing will include variations in fuel composition and heating value, study of the impact of rapid fuel gas switching, assessment of changes of the firing range of the burner, etc. In all cases, the burners will be tested in combination with the common control system (or systems) used in industrial practice. H.3.5 Analysis of Industrial Burner Test Results Testing results, literature data, and information from equipment manufacturers and operators must be analyzed to determine fuel interchangeability relative to industrial and commercial burners. Analysis may reveal that the indices used for appliance burners are inappropriate for industrial burners. In this situation, new indices need to be developed. The objectives of the analysis are to 1) determine which burner types are most sensitive to fuel gas changes, 2) determine ranges of gas property changes that are acceptable for classes of industrial burners and can then serve as interchangeable, and 3) provide guidance on indices appropriate for determination of fuel gas interchangeability for industrial burners. H.4 Stationary and Vehicle Engines Reciprocating engines continue to be of great importance to the gas industry and end users generally in a wide variety of stationary and vehicular applications. Many of these applications are driven by emissions regulations, but the applications themselves are under increasing pressure to demonstrate acceptable emissions performance. H.4.1 Background
13

White Paper on Natural Gas Interchangeability And Non-Combustion End Use
Gas compositional issues emerged early in the advanced development of gas engines due to the need to control detonation or “knock” in engine cylinders, which can lead to early engine failure as well as operational and emissions performance problems. Development of the American Society of Automotive Engineers (ASAE) Standard J-1616 and the National Fire Protection Association (NFPA) Standard 54 set some of first fuel quality specifications in the U. S. based on controlling combustion behavior, albeit under compression conditions. Continuing activity, led by the State of California and stakeholders in California, is focused on refining requirements and metrics for gas specifications in engines. Appendix C.4 has greater detail on past and current activity. H.4.2 Research Issues and Needs While a great deal of information has been developed on gas reciprocating engines in the last two decades, much of this information is diffuse and requires greater uniformity and availability to support fuel quality specifications and emissions performance. In addition, technical consensus is needed on gas parameters for fuel and emissions performance, such as uniformity of the methane number calculation of gases, so that more efficient parameters for interchangeability can be utilized. The following are several specific near term needs. H.4.2.1 Survey Manufacturers for Performance Data by Equipment Model Manufacturers continue to have data and access to data gathering for key engine models, both for stationary and vehicular applications. Current information on equipment models is incomplete and, in some respects, out of date, especially for models using the latest closed-loop controls and emissions. Data collection, while protecting commercial confidentiality, must be more widely available, especially for performance and emissions using limit gases represent potential new supply sources. H.4.2.2 Review Operations and Emissions Measurements and Requirements Operations requirements have changed over recent years and government support has declined and greater cost effectiveness has been required for gas engines, particularly in vehicular applications. Basic performance requirements of gas engines, along with requirements for engines using competing fuels, need to be updated to identify critical applications that might have particular sensitivity
14

White Paper on Natural Gas Interchangeability And Non-Combustion End Use
to gas compositional requirements. A similar focus is needed for emissions performance. In addition, the role and trends in emissions requirements both driving the focus on gas engines and regulating these engines need to be updated in light of potential changes in supply. H.4.2.3 Collect Manufacturer Data Data from manufacturers on performance and emissions is needed to better represent the current state of the art in engines and controls and to evaluate sensitivities to changes in gas composition. Initial gathering of manufacturer data is expected to require augmentation with manufacturer testing for limit gas performance. Testing protocols, administered by the manufacturers, need to be developed in conjunction with the manufacturers and efficiently be applied to a wide range of engine models while maintaining general consistency across the industry. H.4.2.4 Collect Published Data and End User Data End users, including pipeline operators with continuous monitoring capability and vehicle fleet managers required to meet local requirements, can provide key information on performance and, in particular, emissions from gas engines. In some cases, these end users have instrumentation that can be used to collect gas compositional information that can be associated with performance and emissions. However, instrumentation available suggests that monitoring will produce data supporting only a limited number of parameters. Published data on performance and emissions is available from a variety of governmental and non-governmental sources, but this data is dispersed and needs to be reviewed for applicability to interchangeability.
15

White Paper on Natural Gas Interchangeability And Non-Combustion End Use
16


![811 GUIDE Pump Interchangeability[1]](https://img.dokumen.tips/doc/110x75/55cf967f550346d0338bdb26/811-guide-pump-interchangeability1.jpg)