Embed Size (px)
Citation preview

Modeling the Lithium-Ion Battery
WHITE PAPER
By ANDREAS NYMAN, HENRIK EKSTRÖM, and ED FONTES

COMSOL WHITE PAPER SERIES
MODELING THE LITHIUM-ION BATTERY 2
Further Resources
USER STORY GALLERY https://www.comsol.com/stories
APPLICATION GALLERY https://www.comsol.com/models
TECHNICAL PAPERS AND PRESENTATIONS https://www.comsol.com/papers-presentations
COMSOL BLOG www.comsol.com/blogs
Contact InformationFor inquiries about how to use the numerical simulation and application design capabilities in the COMSOL® software for your unique application, visit comsol.com/contact.
Contact technical support at: comsol.com/support
About the AuthorsAndreas Nyman, Intertek, www.intertek.seAndreas Nyman works as a battery specialist at Intertek Semko AB and has a Ph.D. in Applied Electrochemistry from The Royal Institute of Technology (KTH), Stockholm. Andreas works within the global batteries and fuel cells group at Intertek, which has a track-record of assessing more than 20,000 batteries each year, covering all chemistries and sizes. His modeling expertise and experience includes batteries, fuel cells and electrolytic processes.
Henrik Ekström, COMSOL, www.comsol.comHenrik Ekström works at COMSOL and has a Ph.D. in Applied Electrochemistry from The Royal Institute of Technology (KTH), Stockholm. As the technical program manager of electrochemistry at COMSOL, is responsible for the development of various simulation and modeling solutions for batteries, fuel cells, corrosion, electrodeposition, as well as general electrochemistry applications.
Ed Fontes, COMSOL, www.comsol.comEd Fontes is Chief Technology Officer at COMSOL and has a Ph.D. in Applied Electrochemistry from The Royal Institute of Technology (KTH), Stockholm. He has been the lead developer for the chemical engineering, CFD, and heat transfer product lines at COMSOL. He is responsible for technology development at COMSOL.
TABLE OF CONTENTS
Introduction 3The Newman Model 3 Performance Models 4Thermal Management and Safety 5Characterization and State-of-Health 7
Beyond the Newman Model 8
Multiphysics Models and Partial Differential Equations 8
© Copyright 2012–2018 COMSOL. Simulation-Driven Design for the Thermal Management of Buildings is published by COMSOL, Inc. and its associated companies. COMSOL, the COMSOL logo, COMSOL Multiphysics, COMSOL Desktop, COMSOL Server, and LiveLink are either registered trademarks or trademarks of COMSOL AB. SOLIDWORKS is a registered trademark of Dassault Sys-tèmes SolidWorks Corporation. All other trademarks are the property of their respective owners, and COMSOL AB and its subsidiaries and products are not affiliated with, endorsed by, sponsored by, or supported by those, or the above, non-COMSOL trademark owners. For a list of such trademark owners, see www.comsol.com/trademarks.
COMSOL WHITE PAPER SERIES
MODELING THE LITHIUM-ION BATTERY 3
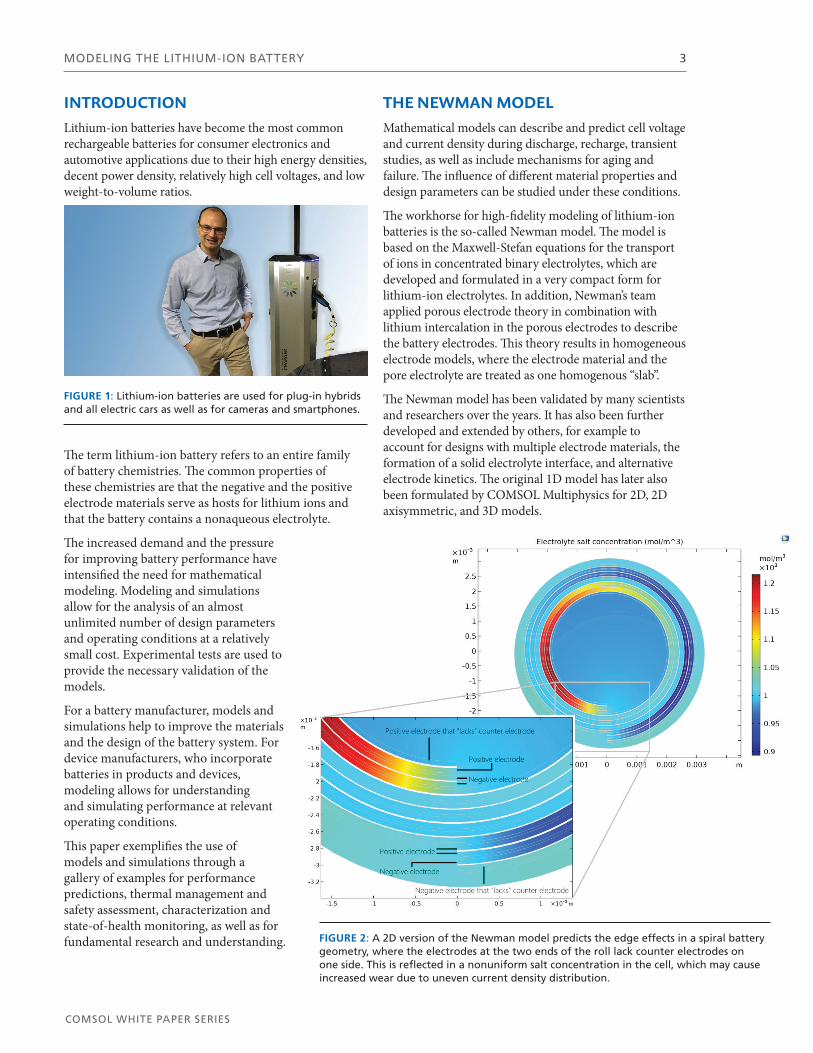
INTRODUCTIONLithium-ion batteries have become the most common rechargeable batteries for consumer electronics and automotive applications due to their high energy densities, decent power density, relatively high cell voltages, and low weight-to-volume ratios.
The term lithium-ion battery refers to an entire family of battery chemistries. The common properties of these chemistries are that the negative and the positive electrode materials serve as hosts for lithium ions and that the battery contains a nonaqueous electrolyte.
The increased demand and the pressure for improving battery performance have intensified the need for mathematical modeling. Modeling and simulations allow for the analysis of an almost unlimited number of design parameters and operating conditions at a relatively small cost. Experimental tests are used to provide the necessary validation of the models.
For a battery manufacturer, models and simulations help to improve the materials and the design of the battery system. For device manufacturers, who incorporate batteries in products and devices, modeling allows for understanding and simulating performance at relevant operating conditions.
This paper exemplifies the use of models and simulations through a gallery of examples for performance predictions, thermal management and safety assessment, characterization and state-of-health monitoring, as well as for fundamental research and understanding.
THE NEWMAN MODELMathematical models can describe and predict cell voltage and current density during discharge, recharge, transient studies, as well as include mechanisms for aging and failure. The influence of different material properties and design parameters can be studied under these conditions.
The workhorse for high-fidelity modeling of lithium-ion batteries is the so-called Newman model. The model is based on the Maxwell-Stefan equations for the transport of ions in concentrated binary electrolytes, which are developed and formulated in a very compact form for lithium-ion electrolytes. In addition, Newman’s team applied porous electrode theory in combination with lithium intercalation in the porous electrodes to describe the battery electrodes. This theory results in homogeneous electrode models, where the electrode material and the pore electrolyte are treated as one homogenous “slab”.
The Newman model has been validated by many scientists and researchers over the years. It has also been further developed and extended by others, for example to account for designs with multiple electrode materials, the formation of a solid electrolyte interface, and alternative electrode kinetics. The original 1D model has later also been formulated by COMSOL Multiphysics for 2D, 2D axisymmetric, and 3D models.
FIGURE 1: Lithium-ion batteries are used for plug-in hybrids and all electric cars as well as for cameras and smartphones.
FIGURE 2: A 2D version of the Newman model predicts the edge effects in a spiral battery geometry, where the electrodes at the two ends of the roll lack counter electrodes on one side. This is reflected in a nonuniform salt concentration in the cell, which may cause increased wear due to uneven current density distribution.

COMSOL WHITE PAPER SERIES
MODELING THE LITHIUM-ION BATTERY 4
PERFORMANCE MODELSA typical experiment that can be accurately described by a battery model is a discharge-recharge cycle as shown in Figure 3 below, where a high-energy battery for mobile applications is simulated. In the model, the processes within the battery are described by equations and material properties. The values of the properties are obtained through carefully designed experiments, often based on theoretical models. For a battery manufacturer, geometrical parameters may also be studied and optimized in a model. For a device manufacturer, the geometry is usually an input to the model. In some cases, the geometry may not even be revealed by a battery manufacturer and the application expert may have to open and examine the cells in a glove box before the model is developed.
In Figure 3, the green line represents the current density. The current density is defined as positive during the initial period of discharge of 2000 seconds, which is then followed by a period of rest (0 current) for 300 seconds. The battery is then recharged (negative current) for 2000 seconds before it is allowed to rest again.
The response of the battery voltage to this cycle is shown by the blue curve and is very accurately predicted by the model. The voltage decays with the discharge time due to losses caused by mass transport resistance, concentration and activation overpotential, and due to thermodynamics. When the battery is allowed to rest for 300 seconds, the voltage recovers slightly as activation and ohmic losses are absent and as concentration gradients are allowed to relax. The battery voltage increases as the battery is recharged, again due to the same losses, but now with the opposite sign. When the battery is allowed to rest, the voltage slowly reaches a steady open cell voltage.
FIGURE 3: A discharge-recharge cycle with a resting period in between is simulated with the current density given as input (green) and the resulting cell voltage predicted by the model (blue).
During discharge, the electrolyte salt concentration increases in the negative electrode and decreases in the positive electrode, as lithium ions are transported between the electrodes. Since the concentration profiles in the particles and the electrolyte relax to a uniform profile during the resting period and since the cell voltage is dependent on the local electrolyte salt concentration, the cell voltage is also slowly relaxing to an equilibrium voltage. The phenomenon is reversed during charging.
The advantage of the performance models is that they can be used to find out and analyze the processes that are responsible for the limitations in the performance of the battery and the losses that are responsible for these limitations. The models can also be used to evaluate how the energy and power density are changed when the design of the electrode is varied and how the electrode materials are utilized in the cell design.
FIGURE 4: Electrolyte salt concentration (mol/m3) profiles at various times during the cycle in Figure 3. During discharge, the electrolyte salt concentration increases in the negative electrode and decreases in the positive electrode when lithium ions are transported between the electrodes.

COMSOL WHITE PAPER SERIES
MODELING THE LITHIUM-ION BATTERY 5
THERMAL MANAGEMENT AND SAFETYMost of the losses, for example ohmic losses and activation overpotentials, generate heat in the battery. In addition, in cold weather and during startup, the battery system may require heating in order to work. The cooling and heating of the battery system require thermal management.
Using a physics-based model, the different sources of heat are directly available from the model, see Figure 5. When designing a battery cell or pack, the heat dissipation must be fast enough to avoid that the battery reaches temperatures where decomposition reactions of the electrode and electrolytes start (> 80°C). The decomposition reactions are exothermic, which implies that the temperature will continue to increase when decomposition starts. This event is called thermal runaway and it leads to the destruction of the cell. The temperature on the surface of cells can be monitored during experimental testing. The advantage of using a thermal model is that the temperature inside the cell can be estimated from the measurement at the surface. This allows for studying unwanted effects such as internal short circuits, where hot spots may be the cause of thermal runaway.
An example of a thermal model of a passively air-cooled cylindrical battery cell is shown in Figure 6. Heat is generated when a cell is discharged and dissipated to the surrounding by convection and radiation. As a result, the temperature is often higher at the core of the cell. The temperature difference between the core and the outer regions increases when the cell is discharged at a higher current density. As a consequence, the electrode material close to the core of the cell may age faster than at the outer regions, since some aging processes are accelerated by high temperatures. Lithium plating may increase at
FIGURE 5: Heat sources per unit area of the battery (W/m2) during a discharge and resting period. Using a physics-based model, the different sources of heat are directly given by the model.
lower temperatures on graphite electrodes, which shows that low temperatures may also accelerate aging.
Temperature variations are predominant within large cells, since uneven current distributions cause uneven heat productions. A performance model of large cells must therefore include the heat production, since the rated capacity is dependent on the temperature. Thermal models of individual cells are also often used as starting points when developing internal short circuiting models, where heat is produced locally by unwanted chemical reactions.
Uneven temperature distribution can also occur at pack and module levels. Heating and cooling design for normal operation and for regular startup is focused on minimizing weight and power consumption. The shape of the cooling channels, flow rate of the cooling fluid, and shape and control of the heaters for different operating
FIGURE 6: Temperature distribution (°C) in a cylindrical battery during a discharge. The temperature difference between the core and the outer regions increases when the cell is discharged with higher C-rates.
FIGURE 7: Temperature in the cooling channels and in the cells in a battery pack for automotive applications.

COMSOL WHITE PAPER SERIES
MODELING THE LITHIUM-ION BATTERY 6
conditions are usually the factors that are optimized.
Simulation results from a thermal management system model, where the cells are cooled by a liquid, are shown in Figure 7. The model includes the heat generation in the cells, flow of the cooling liquid, and heat transfer in the pack. The efficiency of the cooling is affected by the size of the cell versus the size of the cooling system as well as the design of the thermal management system.
The design of the thermal management system in a battery
FIGURE 10: Temperature distribution in a battery pack where one battery is malfunctioning (second row, left side).
FIGURE 8: Local state-of-charge at the surface of electrode particles in a lithium-ion battery after 0.01 seconds of self-discharge. Due to the internal short circuit, there is depletion in the negative electrode (bottom) and accumulation in the positive electrode (top).
FIGURE 9: A schematic of a nail penetration battery test. The magnified cross section shows the contact area between the nail and the electrodes as well as the direction of the current.
system is substantially complicated by the fact that it has to be able to cope with malfunctioning cells. Malfunction is usually caused by short circuiting of the electrodes due to metal deposits at the cathode that grow across the electrolyte and make electronic contact with the anode.
Mechanical damage is another cause of short circuits in batteries. If a foreign metallic object penetrates the battery pack or if the battery pack is damaged by being squashed, it can provide an internal conduction path that creates a short circuit. One standard safety test for lithium-ion
batteries is the “nail test” in which a nail is driven into the battery to create a short circuit, see Figure 8 and Figure 9. The nail conducts the current as an external circuit with a very small load, while the area around the nail behaves as during a discharge.
When a short circuit is formed, a very high current density is obtained around the penetrating object, which causes Joule heating and an increased local temperature. When the temperature is high enough, catalytic combustion of the battery materials leads to thermal runaway of the battery. With improper design, this process ends in fire and may even cause the battery to explode.
Models and simulations allow for testing different configurations of the cooling system in order to prevent the battery pack from entering thermal runaway, even in the case of short circuiting, see Figure 10.
COMSOL WHITE PAPER SERIES
MODELING THE LITHIUM-ION BATTERY 7
CHARACTERIZATION AND STATE-OF-HEALTHIt is clear from theory and mathematical models that lithium-ion batteries are highly nonlinear systems where many phenomena are involved at the same time; i.e., electronic current conduction, transport of ions, heterogeneous electrochemical reactions, homogeneous chemical reaction, heat transfer, and fluid flow.
As with all battery chemistries, the lithium-ion batteries lose capacity and the internal resistance increases over time. After a while, the battery is unable to deliver the energy or power that is demanded and the battery has to be replaced. The reactions that are responsible for this aging can be included in a performance model. By combining experimental results with simulations, the lifetime can be estimated for different operating conditions. Proper design or control of the operating conditions can be applied to avoid accelerated aging based on simulation results.
There are many factors that influence the performance and it is often difficult to separate the effects of different design and operation parameters on performance. A key to separating the influence of the different involved phenomena is the fact that they often have different time constants. For example, electrochemical reactions are usually fast compared to diffusion. Electronic current conduction is an extremely fast phenomenon that responds immediately to a change in electric potential.
A method that is becoming more common for analyzing the state-of-health of batteries is electrochemical impedance spectroscopy (EIS). In this transient electrochemical method, a small sinusoidal perturbation is applied around a given pseudostationary potential. The resulting current response may have a small shift in time due to processes in the battery that delay it. The time delay and the magnitude of the current response are different at different
frequencies: at low frequencies, electrolyte and solid state diffusion may result in delays, while kinetic effects may result in delays at higher frequencies. In this way, processes with different time scales within the battery can be separated and parameter estimations of the material and kinetic properties of the battery can be done.
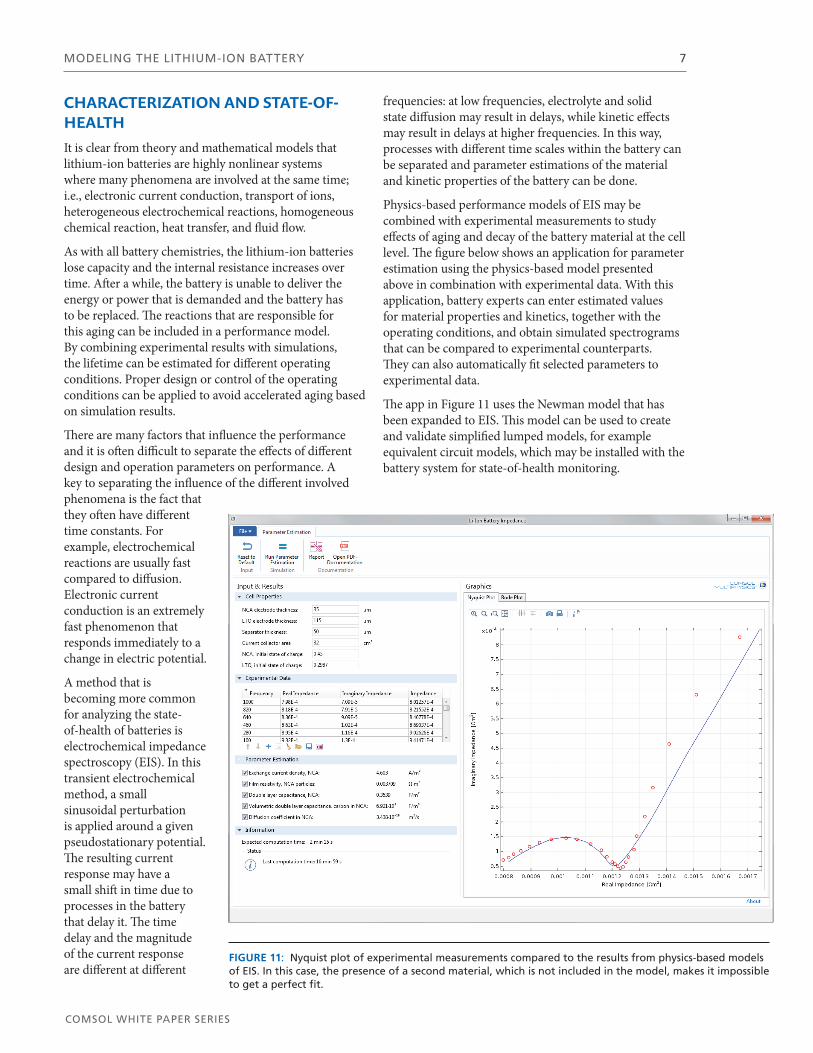
Physics-based performance models of EIS may be combined with experimental measurements to study effects of aging and decay of the battery material at the cell level. The figure below shows an application for parameter estimation using the physics-based model presented above in combination with experimental data. With this application, battery experts can enter estimated values for material properties and kinetics, together with the operating conditions, and obtain simulated spectrograms that can be compared to experimental counterparts. They can also automatically fit selected parameters to experimental data.
The app in Figure 11 uses the Newman model that has been expanded to EIS. This model can be used to create and validate simplified lumped models, for example equivalent circuit models, which may be installed with the battery system for state-of-health monitoring.
FIGURE 11: Nyquist plot of experimental measurements compared to the results from physics-based models of EIS. In this case, the presence of a second material, which is not included in the model, makes it impossible to get a perfect fit.
COMSOL WHITE PAPER SERIES
MODELING THE LITHIUM-ION BATTERY 8
BEYOND THE NEWMAN MODELThe latest development for understanding the electrodes in batteries is to use heterogeneous models that treat the geometry of the material in detail, in contrast to the homogeneous model. This is achieved by constructing the geometry from micrographs.
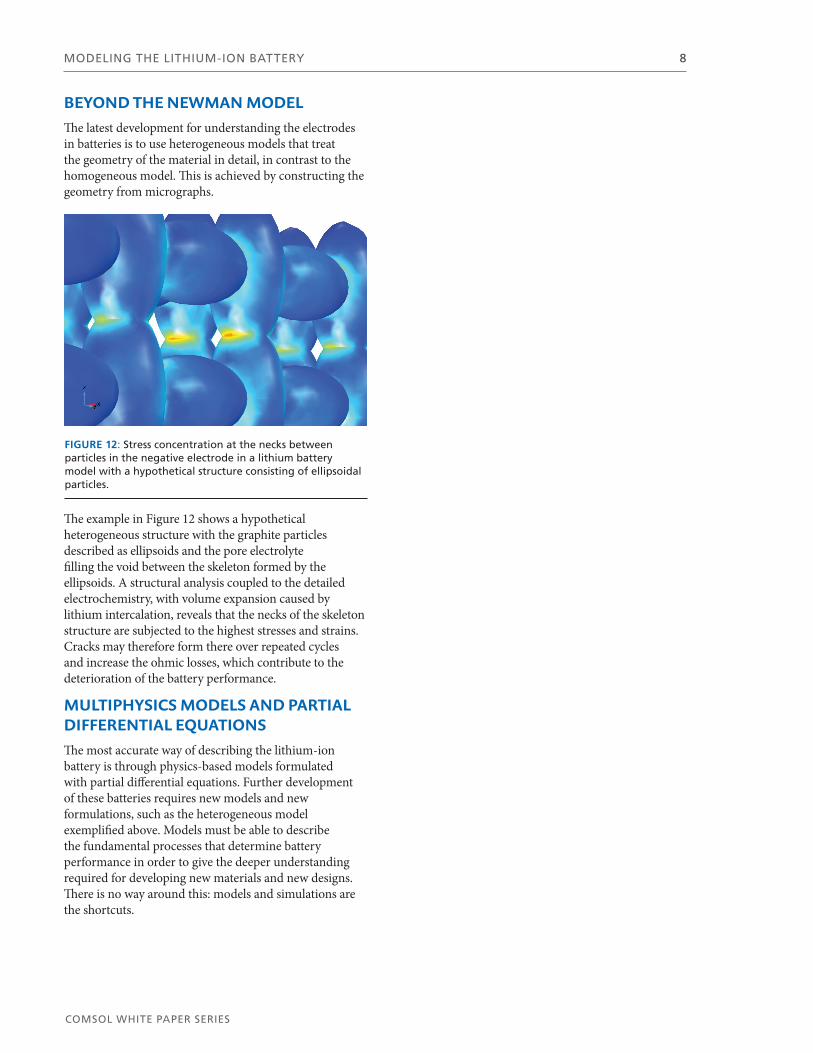
The example in Figure 12 shows a hypothetical heterogeneous structure with the graphite particles described as ellipsoids and the pore electrolyte filling the void between the skeleton formed by the ellipsoids. A structural analysis coupled to the detailed electrochemistry, with volume expansion caused by lithium intercalation, reveals that the necks of the skeleton structure are subjected to the highest stresses and strains. Cracks may therefore form there over repeated cycles and increase the ohmic losses, which contribute to the deterioration of the battery performance.
MULTIPHYSICS MODELS AND PARTIAL DIFFERENTIAL EQUATIONSThe most accurate way of describing the lithium-ion battery is through physics-based models formulated with partial differential equations. Further development of these batteries requires new models and new formulations, such as the heterogeneous model exemplified above. Models must be able to describe the fundamental processes that determine battery performance in order to give the deeper understanding required for developing new materials and new designs. There is no way around this: models and simulations are the shortcuts.
FIGURE 12: Stress concentration at the necks between particles in the negative electrode in a lithium battery model with a hypothetical structure consisting of ellipsoidal particles.

www.comsol.comwww.comsol.com