Embed Size (px)
Citation preview

WHITE PAPER IEconomic and Social Impacts of Desertification, Land Degradation and Drought
United Nations Convention to Combat Desertification
9-12 April 2013 - Bonn, Germany

We would like to extend our sincere appreciation to, in particular, the Governments of Germany, Finland, the Republic of Korea, Spain, Sweden and Switzerland for their contributions and generous support. Voluntary financial contributions have helped in the preparation and organization of the United Nations Convention to Combat Desertification (UNCCD) 2nd Scientific Conference and are strengthening our scientific understanding of the social and economic drivers and consequences of desertification, land degradation and drought. By investing in science and ensuring the participation of scientists in the decision-making processes, these voluntary contributions have significantly advanced the implementation of the Convention.
The preparation of this publication has been facilitated byThe Global Risk Forum GRF Davos on behalf of the UNCCD
AuthorshipCoordinating Author: Pak Sum Low, Chair, Working Group IFor chapter authors see p. vi
Working Group I for White Paper IChair: Pak Sum LowMembers: Dorothy Amwata, Mercedes Zoraida Araníbar Seminario, Viorel Blujdea, Ian Hannam, Jane Kabubo-Mariara, Klaus Kellner, Daniel Kimeu Mbuvi, Rodrigo Morera, Stacey Noel, Nathalie Olsen, Peijun Shi, Lindsay Stringer, Grace Wong
Scientific Advisory Committee (SAC)Chair: Jonathan DaviesMembers: Nana Bolashvili, Joachim von Braun, Hamid Custovic, Patrik Klintenberg, César Morales Estupiñán, Teresa Namiko Nagashiro Kanda, Laban Ayieko Ogallo, Soo Jin Park, Mélanie Requier-Desjardins, Richard Thomas, Vute Wangwacharakul
Review GroupViorel Blujdea, Jonathan Davies, César Morales Estupiñán, Lene Poulsen, Mélanie Requier-Desjardins
DisclaimerThe views expressed in this publication are those of the authors and do not necessarily represent those of the UNCCD and GRF Davos.
ISBN NumberISBN 978-92-95043-66-4

Cover photographs: ©2009 UNCCD Photo Contest
Pablo Olivieri (Trees in the wind)Giulio Napolitano (Cattle walking to the well)Arup Halder (Children transporting water)Dibyendu Dey Choudhury (Women transporting water)
Citation
Copyright: © 2013, UNCCD
All rights reserved.This publication may be reproduced and distributed in whole or in part of educational or non-profit purpose only. No special permission from the copyright holder is required, provided that acknowledgement of the source, including authors, is made. Any other use of this publication without authorization from the source, authors and UNCCD is forbidden.
Low, P.S. (ed) (2013) Economic and Social impacts of desertification, land degradation and drought. White Paper I. UNCCD 2nd Scientific Conference, prepared with the contributions of an internationalgroup of scientists. Available from: http://2sc.unccd.int (accessed 26 March 2013.)

UNCCD 2nd Scientific Conference 2013 White Paper I
i
TABLE OF CONTENTS
LIST OF TABLES ............................................................................................................................................ III
LIST OF FIGURES .......................................................................................................................................... III
ABBREVIATIONS ........................................................................................................................................... IV
LEAD AUTHORS AND CONTRIBUTORS ............................................................................................................... VI
ACKNOWLEDGEMENTS ................................................................................................................................... X
EXECUTIVE SUMMARY .................................................................................................................................. XI
1. GENERAL INTRODUCTION...................................................................................................................... 1
1.1 MANDATE .................................................................................................................................. 1
1.2 OBJECTIVES ................................................................................................................................. 2
1.3 SCOPE ........................................................................................................................................ 2
2. ECONOMIC AND SOCIAL IMPACTS ASSESSMENT OF DLDD .......................................................................... 3
2.1 INTRODUCTION ............................................................................................................................ 3
2.2 ECONOMIC IMPACTS OF DESERTIFICATION ....................................................................................... 5
2.2.1 DIRECT ECONOMIC COSTS ..................................................................................................... 5
2.2.2 EXPLAINING THE VARIATION IN DIRECT COSTS........................................................................... 6
2.2.3 INDIRECT ECONOMIC COSTS................................................................................................. 10
2.2.4 ECONOMY-WIDE COSTS ...................................................................................................... 11
2.2.5 POLICY IMPLICATIONS ......................................................................................................... 12
2.3 SOCIAL IMPACTS OF DESERTIFICATION ........................................................................................... 12
2.3.1 POPULATIONS IN THE DRYLANDS .......................................................................................... 13
2.3.2 THE DISTRIBUTION OF IMPACTS ............................................................................................ 13
2.3.3 THE DISTRIBUTION OF IMPACTS BY POVERTY STATUS ............................................................... 13
2.3.4 EVALUATING THE SOCIETAL DISTRIBUTION OF IMPACTS ............................................................ 14
2.3.5 FOOD SECURITY AND HEALTH ............................................................................................... 15
2.3.6 POLICY IMPLICATIONS ......................................................................................................... 16
2.4 MODELLING ECONOMIC IMPACTS ................................................................................................. 16
2.4.1 MODELLING OPTIMAL RATES OF LAND DEGRADATION ............................................................. 16
2.4.2 INCORPORATING DIRECT COSTS OF LAND DEGRADATION IN FARM MODELS ................................ 17
2.4.3 UNEXPECTED EFFECTS FROM POLICIES INTENDED TO REDUCE POVERTY ...................................... 17
2.4.4 ECONOMIC CONSTRAINTS ON REVERSING DESERTIFICATION ...................................................... 18
2.4.5 THE IMPORTANCE OF INTEGRATED NATIONAL LAND USE PLANNING ........................................... 18
2.4.6. POLICY IMPLICATIONS ......................................................................................................... 19

UNCCD 2nd Scientific Conference 2013 White Paper I
ii
2.5 TOWARDS INTEGRATED PLANNING AND MONITORING TOOLS ........................................................... 19
2.5.1 CURRENT UNCCD ACTIVITIES IN INDICATOR DEVELOPMENT ....................................................... 19
2.5.2 USEFUL ECONOMIC CONCEPTUAL FRAMEWORKS .................................................................... 21
2.5.3 USEFUL ENVIRONMENTAL CONCEPTUAL FRAMEWORKS ............................................................ 22
2.5.4 USEFUL HUMAN-ENVIRONMENTAL CONCEPTUAL FRAMEWORKS ............................................... 22
2.5.5 OPTIONS FOR INTEGRATED STATISTICS AND PLANNING METHODS .............................................. 23
3. TOOL BOX OF PROBLEM-ORIENTED METHODOLOGIES ............................................................................ 24
3.1 INTRODUCTION .......................................................................................................................... 24
3.2 DRIVERS OF DLDD ...................................................................................................................... 24
3.3 ANALYTICAL FRAMEWORK ........................................................................................................... 24
3.4 METHODOLOGIES ...................................................................................................................... 29
3.5 COST-BENEFIT ANALYSIS FOR DECISION-MAKING ............................................................................ 30
4. POLICIES AND STRATEGIES .................................................................................................................. 31
4.1 INTRODUCTION .......................................................................................................................... 31
4.2 EFFECTIVE POLICIES THAT INCLUDE DIRECT AND INDIRECT COSTS ....................................................... 31
4.3 STRATEGY FOR DECISION MAKERS TO TAKE NATIONAL APPROACHES TO REGIONAL AND GLOBAL LEVELS.. 32
4.4 CURRENT POLICY AND STRATEGIC ENVIRONMENT ........................................................................... 32
4.5 GLOBAL, REGIONAL AND NATIONAL STRATEGIC ENVIRONMENT ......................................................... 33
4.6 STRATEGIC AND OPERATIONAL OBJECTIVES .................................................................................... 34
4.7 LEGAL FRAMEWORK ................................................................................................................... 35
5. SYNERGIES BETWEEN UNCCD, UNFCCC AND CBD .................................................................................... 37
5.1 INTRODUCTION .......................................................................................................................... 37
5.2 PRACTISING SYNERGY ................................................................................................................. 37
5.3 FINANCIAL RESOURCES................................................................................................................ 40
5.4 SHORTCOMINGS AND LESSONS LEARNED ....................................................................................... 40
6. CONCLUSIONS AND POLICY RECOMMENDATIONS ................................................................................... 43
6.1 CONCLUSIONS ........................................................................................................................... 43
6.2 POLICY RECOMMENDATIONS ....................................................................................................... 44
REFERENCES.............................................................................................................................................. 46
ANNEX 1 .................................................................................................................................................. 57
CASE STUDY 1: METHODOLOGIES FOR VALUATING DESERTIFICATION COSTS IN CHINA (BY CHENG LEILEI, CUI
XIANGHUI, GONG LIYAN AND LU QI) ....................................................................................................... 57
ANNEX 2 .................................................................................................................................................. 61
CASE STUDY 2: ECONOMIC ASSESSMENT OF DLDD IN SPAIN(BY LUUK FLESKENS, DOAN NAINGGOLAN AND LINDSAY
STRINGER) ............................................................................................................................................ 61

UNCCD 2nd Scientific Conference 2013 White Paper I
iii
LIST OF TABLES
Table 1: Estimates of national direct costs of land degradation in the 1980s as a proportion of Gross
Domestic Product (GDP) .......................................................................................................... 6
Table 2: Three estimates of the extent and annual direct cost of land degradation in India ................. 8
Table 3: Estimates of the direct costs of soil erosion on agricultural production in Ethiopia as a
proportion of Agricultural Gross Domestic Product (AGDP) ................................................... 9
Table 4: Population growth in the drylands 1975-1994 (millions)........................................................ 13
Table 5: UNCCD impact indicators ........................................................................................................ 20
Table 6: Measuring costs of DLDD ........................................................................................................ 27
Table 7: Comparison of valuation methods (TEEB, 2010) ..................................................................... 29
Table 8: Studies selected for review ..................................................................................................... 57
Table 9: Total costs of desertification in China ...................................................................................... 58
Table 10: Agricultural loss resulting from desertification in China ....................................................... 58
Table 11: Costs of siltation of rivers, reservoirs and irrigation canals resulting from desertification in
China (billion RMB) ................................................................................................................ 58
Table 12: Transportation loss resulting from desertification in China (million RMB) ........................... 59
Table 13: Valuation Methods of Desertification Costs in China ........................................................... 60
LIST OF FIGURES
Figure 1: Ecosystem services, human well-being and economic valuation .......................................... 25
UNCCD 2nd Scientific Conference 2013 White Paper I
iv
ABBREVIATIONS
AGDP Agricultural Gross Domestic Product
ARPU
CBD
Agro-Climatic Regional Planning Unit
Convention on Biological Diversity
COP Conference of the Parties
CST Committee on Science and Technology
DALYs Disability-Adjusted Life Years
DLDD Desertification, Land Degradation and Drought
EHRS Ethiopian Highlands Reclamation Study
FAO Food and Agriculture Organization of the United Nations
GDP Gross Domestic Product
GEF Global Environment Facility
GGDP
GIZ
Green Gross Domestic Product
Deutsche Gesellschaft für Internationale Zusammenarbeit
GLADIS Global Land Degradation Information System
GLASOD
GM
Global Assessment of Soil Degradation
Global Mechanism
GRF Global Risk Forum
ha
IPBES
hectare
Intergovernmental Platform on Biodiversity and Ecosystem Services
IPCC Intergovernmental Panel on Climate Change
IUCN International Union for Conservation of Nature
JLG Joint Liaison Group
MDGs Millennium Development Goals
MEAs Multilateral Environmental Agreements
NAP National Action Programme
NCSS National Conservation Strategy Secretariat

UNCCD 2nd Scientific Conference 2013 White Paper I
v
NGOs Non-Governmental Organizations
NRSA
RAP
National Remote Sensing Agency
Regional Action Programme
SAC Scientific Advisory Committee
SCRP Soil Conservation Research Project
SFM Sustainable Forest Management
SLM Sustainable Land Management
SRAP Subregional Action Programme
SBSTA Subsidiary Body for Scientific and Technical Advice
SBSTTA Subsidiary Body for Scientific, Technical and Technological Advice
TEV Total Economic Value
TPNs Thematic Programme Networks
UNCCD United Nations Convention To Combat Desertification
UNCOD United Nations Conference on Desertification
UNESCO United Nations Educational, Scientific and Cultural Organisation
UNDP United Nations Development Programme
UNEP United Nations Environment Programme
UNFCCC United Nations Framework Convention on Climate Change
VSL Value of Statistical Life

UNCCD 2nd Scientific Conference 2013 White Paper I
vi
LEAD AUTHORS AND CONTRIBUTORS
Coordinator: Pak Sum Low (Chair of Working Group I)
Executive Summary
Lead author: Pak Sum Low Contributors: Alan Grainger, Nathalie Olsen, Ian Hannam, Klaus Kellner and Niels Dreber
Chapter 1 Introduction
Lead author: Pak Sum Low Contributors: Madeleine Colbert and Walter Ammann Reviewers: Lindsay Stringer and Alan Grainger
Chapter 2 Economic and Social Impacts Assessment of DLDD
Lead author: Alan Grainger Contributors: Grace Wong, Jane Kabubo-Mariara, Daniel Mbuvi and Pak Sum Low Reviewers: Lene Poulsen, Lindsay Stringer and Ian Hannam
Chapter 3 Tool Box of Problem-Oriented Methodologies Lead author: Nathalie Olsen Reviewers: Lindsay Stringer, Grace Wong, Alan Grainger and Pak Sum Low
Chapter 4 Policies and Strategies
Lead author: Ian Hannam Contributor: Pak Sum Low Reviewers: Viorel Blujdea and Lindsay Stringer
Chapter 5 Synergies between UNCCD, UNFCCC and CBD
Lead authors: Klaus Kellner and Niels Dreber Contributors: Ian Hannam and Pak Sum Low Reviewers: Lindsay Stringer and Viorel Blujdea
Chapter 6 Conclusions and Policy Recommendations
Lead author: Pak Sum Low Contributors: Alan Grainger, Nathalie Olsen, Ian Hannam, Klaus Kellner and Niels
Dreber
Annex 1
Case Study 1: Methodologies for Valuating Desertification Costs in China (by CHENG Leilei, CUI
Xianghui, GONG Liyan and LU Qi)
Annex 2
Case Study 2: Economic assessment of DLDD in Spain (by Luuk Fleskens, Doan Nainggolan and
Lindsay Stringer)

UNCCD 2nd Scientific Conference 2013 White Paper I
vii
LIST OF CONTACT ADDRESSES OF AUTHORS AND CONTRIBUTORS
Authors/Contributors Contact address E-mail
Dr Walter Ammann Global Risk Forum GRF Davos Promenade 35 CH-7270 Davos Platz Switzerland
Dr Viorel Blujdea European Commission, Joint Research Centre, Institute for Environment and Sustainability/Forest Resources and Climate Unit,21027 Ispra (VA), Italy; and Forest Research and Management Institute, Vladimirescu 128, 077190 Voluntari(Ilfov), Romania
Dr CHENG Leilei Institute of Desertification Studies, Chinese Academy of Forestry, Beijing 100091, China; and Social Science Department, Japan International Research Centre for Agricultural Sciences, Tuskuba, Ibaraki 305-8686, Japan
Ms Madeleine Colbert Global Risk Forum GRF Davos Promenade 35 CH-7270 Davos Platz Switzerland
Dr CUI Xianghui Institute of Desertification Studies, Chinese Academy of Forestry, Beijing 100091, China
Dr Niels Dreber School of Biological Sciences, North-West University (Potchefstroom campus), Potchefstroom 2520, South Africa; and Biodiversity, Evolution and Ecology of Plants, Biocentre Klein Flottbek and Botanical Garden, University of Hamburg, 22609 Hamburg, Germany

UNCCD 2nd Scientific Conference 2013 White Paper I
viii
Dr Luuk Fleskens Sustainability Research Institute, School of Earth and Environment, University of Leeds, Woodhouse Lane, Leeds LS2 9JT, UK
Ms GONG Liyan Institute of Desertification Studies, Chinese Academy of Forestry, Beijing 100091, China
Dr Alan Grainger School of Geography, University of Leeds, Leeds LS2 9JT, UK
Professor Ian Hannam Australian Centre for Agriculture and Law, University of New England, Armidale 2351 NSW, Australia
Professor Jane Kabubo-Mariara,
School of Economics University of Nairobi P.O Box 30197,00100 Nairobi, Kenya
Professor Klaus Kellner School of Biological Sciences, North-West University (Potchefstroom campus), P/Bag X6001, Hoffmanstreet, Potchefstroom, 2520, South Africa
Professor Pak Sum Low Research Centre for Tropical Climate Change System, Faculty of Science and Technology, Universiti Kebangsaan Malaysia, 43600 Bangi, Selangor D.E., Malaysia; and UNEP-International Ecosystem Management Partnership, Institute of Geographical Sciences and Natural Resources Research, Chinese Academy of Sciences, Beijing 100101, China.
E-mail: [email protected]
Professor LU Qi Institute of Desertification Studies, Chinese Academy of Forestry, Beijing 100091, China
Dr Daniel Mbuvi National Drought Management
Authority, Nairobi, Kenya
Dr Doan Nainggolan Department of Environmental Science (Environmental Social

UNCCD 2nd Scientific Conference 2013 White Paper I
ix
Science Group) Aarhus University Frederiksborgvej 399 4000 Roskilde Denmark
Dr Zoraida Aranibar Seminario
Gobierno Regional Piura Av. Chirichigno S/N, Urb. San Eduardo – El Chipe, Piura – Peru
[email protected] [email protected] [email protected]
Professor SHI Peijun State Key Laboratory of Earth Surface Processes and Resource Ecology & Academy of Disaster Reduction and Emergency Management Ministry of Civil Affairs & Ministry of Education (Beijing Normal University), Beijing 100875 , China
Dr Lindsay Stringer Sustainability Research Institute, School of Earth and Environment, University of Leeds, Woodhouse Lane, Leeds LS2 9JT, UK
Dr Grace Wong Center for International Forestry Research (CIFOR), Forests and Livelihoods Programme, PO Box 0113 BOCBD, Bogor 16000, Indonesia

UNCCD 2nd Scientific Conference 2013 White Paper I
x
ACKNOWLEDGEMENTS
This White Paper I was initiated at the Expert Group meeting organized by the Global Risk Forum GRF Davos on behalf of the UNCCD Secretariat, which was held on 13-14 March 2012 in Zurich. During the meeting Walter Ammann, President and CEO of GRF Davos, provided guidance on the preparation of this paper. Walter Ammann also chaired the meeting of Working Group I, during which some members volunteered to contribute to this paper. Contributions were made to the paper by a number of non-Working Group I members: Alan Grainger, Cheng Leilei, Cui Xiang Hui, Gong Liyan and Lu Qi invited by Pak Sum Low (Chair of Working Group I), Niels Dreber invited by Klaus Kellner (a member of Working Group I), and Luuk Fleskens and Doan Nainggolan invited by Lindsay Stringer. Peijun Shi and Zoraida Aranibar Seminario kindly provided some valuable information for the preparation of this paper. This first draft of this paper has been reviewed by Lene Poulsen (Chair of Working Group II), Jonathan Davies (Chair of Scientific Advisory Committee (SAC)) and Richard Thomas (a member of SAC) for the UNCCD Second Scientific Conference. Lindsay Stringer, Ian Hannam, Grace Wong, Peijun Shi, Alan Grainger, Viorel Blujdea and Nathalie Olsen also provided useful comments. The authors are fully responsible for the contents of this paper. The views expressed in the paper do not necessarily represent those of the SAC and the UNCCD Secretariat.

UNCCD 2nd Scientific Conference 2013 White Paper I
xi
EXECUTIVE SUMMARY
There is a widespread consensus that the pressing issues of Desertification, Land Degradation
and Drought (DLDD) are inadequately addressed in today’s political agenda at the global,
regional and national levels. It is therefore of vital importance to raise awareness on the issues,
not only on the negative impacts of DLDD in terms of socio-economic development, but also on
the opportunities that they may create to help to guide current and future land management
practices to be more sustainable and resilient. Understanding and evaluating the economic and
social costs and benefits associated with DLDD is essential to developing cost-effective policies
and strategies for addressing DLDD and in raising this awareness.This paper discusses the
economic and social impacts of DLDD based on the overall framework provided by the Scientific
Advisory Committee (SAC).
Little research has been published in peer-reviewed academic journals on the economics of
desertification, or of land degradation in general. This severely constrains the scientific
knowledge which this working group can synthesize and evaluate for the Committee on Science
and Technology (CST). One reason for the gap is that formal economic modelling of land
degradation only began in the 1980s. Another is that the volume of economic research in this
field has not expanded greatly since the early 1990s.
Direct economic costs are incurred through reductions in income obtained by land users as a
result of the lower productivity of land resulting from desertification. These 'on-site' costs are
experienced either by the land user who degraded the land or another user who uses the site
subsequently. However, estimates vary widely and are very inaccurate. For example, four
estimates of direct costs as a proportion of Gross Domestic Product (GDP) in single countries in
the 1980s were: 0.4% of GDP in the USA; 2% of GDP in India; 9% of GDP in Burkina Faso; and 0.9-
12.5% in Mali. Large differences are also found between the direct costs estimated in different
studies for the same country, e.g. India and China. Estimate variation and inaccuracy can be
linked to the lack of reliable biophysical measurements of the extent and rate of change of
desertification; the use of different economic estimation methods; the embryonic nature of
economic research in this field; and isolation from estimates of the benefits of actions that cause
degradation and are central to decision-making and its appraisal.
Indirect economic costs are incurred through off-site impacts that can be some distance from
the land use that is the source of degradation, and so are generally suffered by people other
than those who cause degradation. For example, the erosion of soil by water and wind leads to
the siltation of rivers, reservoirs and irrigation canals which reduces their effectiveness and
exacerbates flooding. Excessive or inappropriate use of water results in salinity and alkalinity.
Estimates of indirect costs are less common than those for direct costs, and most indirect costs
are still not estimated because of lack of data. The annual indirect costs of soil erosion in the
USA have been estimated as $17 billion, compared with direct costs of $27 billion, raising total
costs of soil erosion to 0.7% of GDP. In China, sand and dust storms linked to soil erosion have
resulted in indirect costs due to airline delays and impacts on human health. The range and
inaccuracy of estimates of indirect costs is explained in a similar way to those for direct costs,
with the additional complications that market prices are lacking for many of these impacts and
impact profiles vary from country to country.

UNCCD 2nd Scientific Conference 2013 White Paper I
xii
Social impacts, such as an increase in poverty, are important too, but their estimation is
hindered by lack of social and biophysical data and by synergies between these impacts and the
underlying social causes of desertification. Economic modelling shows how decisions by land
users that lead to land degradation can be affected by government policies in unexpected ways.
Improving estimates of the magnitudes of economic and social impacts will require better
measurements of the extent and rate of change of desertification, and the integration of
desertification into national statistics and planning methods.
While sustainable land management is an important measure for tackling desertification,
research into entitlements, environmental justice and vulnerability suggests that tackling
desertification is not just about adopting physical remedies, as social remedies are equally
important. This means that economic impacts and social impacts need to be tackled in an
integrated manner, rather than separately, if policies for addressing desertification are to be
effective.
It is crucial to understand the institutional settings in which land users make decisions that may
lead to, or avoid, desertification. Deciding to use land in a way that leads to desertification is not
necessarily abnormal or irrational, and governments may unintentionally exacerbate this, e.g.
when they subsidize fertilizer use; support food prices to benefit farmers and determine the
level of subsidy; or introduce large capital-intensive agricultural schemes that can have positive
local impacts but negative national impacts. So the rate of desertification could be reduced if:
government policies were evaluated beforehand to check for unintended consequences;
societal institutions were audited to check for constraints that lead to poor people degrading
land instead of managing it sustainably; and an integrated approach was taken to national land-
use planning and government policies.
Analytical frameworks, methodologies and tools are available for the identification and
measurement of the costs of DLDD, including a methodology for prioritizing across geographic
areas based on an assessment of the costs of investing in effective prevention and mitigation of
land degradation compared to the costs of the loss in ecosystem services (i.e. the cost of action
versus inaction). A thorough assessment needs to identify important changes to ecosystem
services and ecosystem service delivery. Application of the Total Economic Value (TEV)
framework may assist in the identification of different types of economic values associated with
the range of ecosystem services that are affected by DLDD, including values associated with
direct use (fuelwood, animal fodder) or indirect use (soil fertility) option values based on
maintaining resources for future use or existence values (linked to the utility people derive from
knowing certain species, habitats, landscapes continue to exist).
The application of the TEV framework, economic valuation of changes to ecosystem services and the integration of these values into social cost benefit analysis provide decision makers with a sounder basis for making land use decisions relative to simply looking at the direct costs of DLDD. Moreover, cost-benefit analysis should include the identification of how the costs associated with DLDD and the benefits of sustainable land management are distributed across stakeholders, focusing on those groups with a greater reliance on ecosystems and poor and vulnerable households. Distributional analysis can inform decisions around land use to ensure policies and land management practices selected are both equitable and efficient from the perspective of

UNCCD 2nd Scientific Conference 2013 White Paper I
xiii
society. If there are trade-offs to be made, as often is the case, decision makers will have information available to help them to prioritize objectives in a transparent manner.
The elements that need to be considered for effective policies and strategies that guide the implementation of the UNCCD at the national, regional and global levels include policies and strategies for land, forest, water and other natural resources management, developed as part of an overall national policy framework to improve land management and promote sustainable development. These policies must be based on the best available knowledge and science relevant to the local, national and regional conditions and circumstances. Thus, it is important that there is greater investment in scientific research on DLDD in order to better develop and formulate effective policies. In addition, attention needs to be paid to the science policy interface and the structures and processes through which scientific knowledge reaches policy makers.
The UNCCD National Action Programme (NAP) process should facilitate affected Parties to present their strategies for DLDD prevention and mitigation and outline future action. At the global level more resources are required to enable affected Parties, especially developing countries, to implement their obligations under the UNCCD. Regional cooperation is an important component for successful implementation and coordination mechanisms must respond to existing and emerging needs, capacities and the specific issues of each region. At the national and local levels decision makers should also have responsibility to ensure participation and provide full ownership to local and primary affected communities, while mobilizing access to resources from relevant institutions and organizations.
The approach to implement national policies and strategies to combat DLDD should include a legal system that provides for the effective management of land, taking an ecosystem-based approach. At the international level the UNCCD has many gaps and limitations for the protection and sustainable use of land and it lacks key elements to provide the effective ways to protect and manage the ecological aspects of land. The proposal for an international instrument for global land and soil degradation, which has received significant attention recently by the UNCCD, is regarded as essential as part of the national, regional and international framework to combat DLDD.
Due to continuing land degradation, loss in biodiversity and changes in climatic patterns, harnessing synergy between the three Rio Conventions (UNCCD, UNFCCC and CBD) is vital when working on terrestrial ecosystems. The development of synergistic approaches together with the creation of an enabling policy and institutional environment is important for the strengthening of the Rio Conventions. In general, options for building synergies among the Rio Conventions in specific cross-cutting areas includes capacity-building, technology transfer, research and monitoring, information exchange and outreach, reporting and financial resources. However, there are still shortcomings in the collaboration between the conventions, which impede synergistic effects. Developing and practising synergies among the Rio Conventions in a fully operationalized manner requires (i) improving interactions at regional, national and local levels; (ii) reducing potential conflicts between independent activities; (iii) reducing duplication of efforts through improved knowledge transfer; and (iv) sharing financial resources in a more efficient and balanced way. Promoting synergies at regional, national and local levels requires also stronger collaboration among the National Focal Points (NFPs) that serve each of the Convention and play a key role in bridging the differences between involved parties especially at the policy level. However, this still requires improvements in efficiency and effectiveness.

UNCCD 2nd Scientific Conference 2013 White Paper I
1
1. GENERAL INTRODUCTION
There is a widespread consensus that the pressing issues of Desertification, Land Degradation and Drought (DLDD) are inadequately addressed in today’s political agenda at the global, regional and national levels. It is therefore of vital importance to raise awareness on the issues, not only on the negative impacts of DLDD in terms of socio-economic development, but also on the opportunities that they may create to help to guide current land management practices to be more sustainable and resilient.Understanding the economic and social costs and benefits associated with DLDD is essential to developing cost-effective policies and strategies for addressing DLDD and in raising this awareness.
1.1 MANDATE
The 10-Year Strategic Plan and Framework to Enhance the Implementation of the Convention (2008–2018) (Decision 3/COP.8) (hereafter referred to as The Strategy), was adopted by the UNCCD Conference of the Parties (COP) in September 2007. In particular, Operational Objective 3 focuses on science, technology and knowledge. Recognizing the need to enhance the efficiency and effectiveness of the Committee on Science and Technology (CST), the Strategy calls for the reshaping of the CST, and the strengthening of its capacity to process scientific, technical and socio-economic information. The outcomes of Operational Objective 3 include (i) the support of national monitoring and vulnerability assessment on biophysical and socioeconomic trends in affected countries; (ii) development of a baseline based on the most robust data available on biophysical and socioeconomic trends and gradually harmonization of relevant scientific approaches; and (3) improvement of knowledge on biophysical and socio-economic factors and on their interactions in affected areas to enable better decision-making, among others.” In light of this need, by decision 16/COP.9, Parties to the UNCCD decided that the specific thematic topic for the UNCCD Second Scientific Conference will be Economic assessment of desertification, sustainable land management and resilience of arid, semi-arid and dry sub-humid areas, with a view to providing an assessment of the state-of-the-art knowledge on the economics of desertification, sustainable land management and resilience, and translating the scientific findings into recommendations for use by policy makers. The theme is structured around two key topics:
Economic and social impacts of desertification, land degradation and drought;
Costs and benefits of policies and practices addressing desertification, land degradation and drought.
The first theme focuses on the impacts of inaction for addressing DLDD, demonstrating how continually ignoring the issue will inevitably cause further environmental, social and economic costs. The second theme underlines the benefits of action directed towards combating DLDD and emphasizes the environmental, social and economic gains of sustainable land management, the maintenance of ecosystem services, and increased resilience. Their combined results should lead to broader international recognition of the problems related to DLDD and call for focused investments in sustainable land management, soil and ecosystem service conservation and increased resilience. Two Working Groups nominated by the Scientific Advisory Committee (SAC) were established in March 2012 and assigned to draft two White Papers, which will serve as scientific input papers to be discussed during the UNCCD Second Scientific Conference. They will also build the foundation of the state-of-the-art Report, one of the main outputs of the Conference. The two papers are complementary to each other.
UNCCD 2nd Scientific Conference 2013 White Paper I
2
This paper focuses on the Economic and social impacts of desertification, land degradation and drought. It is prepared based on the overall framework provided by the SAC.
1.2 OBJECTIVES
The objectives of this paper are to:
1. Identify the different types of costs – economic, social and environmental – related to DLDD
and to evaluate various methods for measuring and addressing them, and inform decision
makers about how to develop cost-effective policies, based on methodologies suited to
national, regional and global scales;
2. Present state-of-the-art research findings and good practices in the field of economic and social assessment;
3. Produce sound scientific outputs and policy-oriented recommendations based on the analysis and compilation of state-of-the-art peer reviewed and published literature that informs policy formulation and dialogue;
4. Ensure the flow of new ideas to the UNCCD Second Scientific Conference, enhancing the knowledge-sharing process.
1.3 SCOPE
This paper is collectively prepared by a number of Working Group I members and non-Working Group I members. The contributors to respective sections of this paper are listed. It is based on a comprehensive and critical review and analysis of existing peer-reviewed literature and key non-peer reviewed publications as appropriate, as well as case studies from different geographical regions. The draft of this paper has been sent to the two Working Group members and the SAC members for review before being finalized. The paper is divided into six chapters. Chapter 1 provides the introduction, including the mandate, objectives and the scope of the paper. Chapter 2 discusses the economic and social impact assessment of DLDD, including the identification and measurement of direct and indirect costs of desertification, and policy implications. It shows the importance of modelling economic and social impacts, and of integrated national land use planning using appropriate monitoring tools and indicators. Chapter 3 discusses the application of methodologies for measuring the direct and indirect economic and social and economic impacts of DLDD. Chapter 4 presents a strategy for decision makers to take national methodologies to regional and global levels. Chapter 5 discusses the synergies between the United Nations Convention to Combat Desertification (UNCCD), United Nations Framework Convention on Climate Change (UNFCCC) and Convention on Biological Diversity (CBD), not only in joint activities and assessments that will benefit all conventions but also in sharing and efficient use of resources. Chapter 6 provides the conclusions and policy recommendations for further action. Two case studies, the first on Methodologies of China Desertification Costs Estimation, and the second on Economic Assessment of DLDD in Spain are also included to illustrate the methodologies used to estimate the direct and indirect costs of desertification in China (Annex 1), and the Desertification Mitigation Cost Effectiveness (DESMICE) model used to undertake spatially-explicit cost-benefit analysis of land degradation mitigation strategies in Rambla de Torrealvilla catchment, Murcia, Spain (Annex 2).
UNCCD 2nd Scientific Conference 2013 White Paper I
3
2. ECONOMIC AND SOCIAL IMPACTS ASSESSMENT OF DLDD
2.1 INTRODUCTION Evaluating the economic and social benefits and costs of major global environmental problems can
show governments how these problems relate to the economic development of their countries. For
example, the UK Government's "Stern Review" of the economics of climate change, which found that
"the benefits of strong, early action considerably outweigh the costs", had a huge impact on policy-
making in the UK and worldwide (Stern, 2006). It is therefore understandable that the Parties to the
United Nations Convention to Combat Desertification (UNCCD) have given a high priority to studying
the economic and social impacts of desertification in its Second Scientific Conference.
The potential to replicate for desertification the Stern Review and its consequences is helped by two
differences between desertification and global climate change. First, the UNCCD has never been a
purely environmental convention, since economic and social aspects have always been central to the
concerns of Parties from developing countries (Ortiz and Tang, 2005). Developed country Parties, on
the other hand, have tended to emphasize environmental aspects, so they might show greater
commitment to tackling desertification if a stronger economic and social case is advanced for this.
Second, official assessments of the overall costs of desertification are not a recent innovation but
have been made since the early years of implementation of the UN Plan of Action to Combat
Desertification, agreed in Nairobi in 1977. For example, the UN Environment Programme (UNEP)
estimated that the global direct cost of desertification, owing to lost agricultural production, was $26
billion per annum (UNEP, 1980). Estimates have also been made for single countries. Yet while such
huge figures may raise awareness of the problem they are generally very inaccurate (Bojö, 1991) and
do not show policy makers how to tackle the problem. This requires detailed economic models.
However, three other factors will make it more difficult to replicate the Stern Review. First, only a
limited amount of research has been published in peer-reviewed academic journals on the
economics of desertification, or of land degradation in general. This gap in economics research has
severely constrained the amount of scientific knowledge which this working group can synthesize
and evaluate for the Committee on Science and Technology. One reason for the gap is that formal
economic modelling of land degradation only began in the 1980s (e.g. Burt, 1981). Another is that
economic knowledge in this field has only expanded slowly since Coxhead reviewed it in 1999.
Second, biophysical environmental information on the extent and rate of change of desertification is
very limited in quantity and quality, and this affects the availability and accuracy of estimates of the
economic and social impacts of desertification. Estimates for the same country and for different
countries can therefore differ greatly, because of differences in both the economic estimation
methods used and in the biophysical information on which the estimates are based.
Third, current economic and social assessments of desertification are rather 'detached' from
observable environmental features and human practices. So while the Stern Review had to integrate
economic methods with projections of future changes in the biosphere, assessments of the current
global and national economic and social impacts of desertification are removed from the land use
practices which degrade land and from the complex patterns of social causes and impacts.

UNCCD 2nd Scientific Conference 2013 White Paper I
4
Detachments of this kind make it difficult to do 'reality checks': estimates of the economic costs of
desertification may seem impressive, but how do they relate to actual conditions on the ground and
to the livelihoods of individuals, communities and entire countries? Such constraints could be
reduced by the development and adoption of integrated planning methods which enable
environmental features, land use practices, land degradation and economic and social costs and
benefits to be analysed and compared within the same framework. However, as the UN Joint
Inspection Unit has pointed out, desertification is still to be integrated into mainstream planning
tools used in affected countries (Ortiz and Tang, 2005).
These qualifications have important consequences for how the Parties to the UNCCD may decide to
use available research findings or promote further research in this field. If information on economic
and social impacts is merely required to justify further action on desertification then estimates such
as those reviewed in this chapter may be used judiciously and with appropriate qualifications. If, on
the other hand, the intention is to use estimates of economic and social impacts for practical
purposes, e.g. for national statistics and land use planning, then far more rigour is needed in each
country in how economic, social and environmental data are collected and economic and social
impacts are estimated. This has important financial implications, of course. However, if estimates of
the impacts of desertification can be constructed so they are comparable with estimates of the costs
and benefits of other phenomena in each country, and not developed in isolation from them, then
the benefits to integrated national statistics and sustainable development planning should outweigh
the costs involved.
To help governments determine the potential for taking further action in this field this chapter
critically evaluates research on the economic and social impacts of land degradation, and
desertification in particular. It focuses on peer-reviewed publications but refers to key non-peer-
reviewed publications as appropriate. The remainder of the chapter is in four parts. Part two reviews
general estimates of direct and economic impacts, part three repeats this for social impacts, and part
four reviews detailed economic models of land degradation. Part five suggests how the economic
and social impacts of desertification can be incorporated into integrated national statistics and
planning methods. Policy recommendations are referred to throughout the chapter.
This chapter has six main findings. First, the direct on-site economic costs of desertification to land
users are important but estimates of their magnitude vary widely, typically from 2% to 20% of
Agricultural Gross Domestic Product (AGDP), and are very inaccurate. Second, this wide variation and
inaccuracy can be linked to four major constraints: lack of reliable biophysical measurements of the
extent and rate of change or desertification; the use of different economic estimation methods; the
embryonic nature of economic research in this field; and isolation from the benefits of actions that
cause degradation and are a necessary part of decision-making and its appraisal. Third, indirect off-
site economic costs, e.g. relating to the sedimentation of water bodies and disruption of transport,
are also important but estimates of their magnitude vary even more widely, owing to the same three
constraints, plus the lack of market prices for many of these impacts and the variation in impact
profiles from country to country. Fourth, social impacts, such as exacerbating poverty, are important
too but their estimation is hindered by lack of social and biophysical data and by synergies between
them and the underlying social causes of desertification. Fifth, detailed economic modelling shows
how decisions by individual land users that lead to land degradation can be greatly affected by
government policies in unexpected ways. Sixth, estimates of the magnitudes of economic and social

UNCCD 2nd Scientific Conference 2013 White Paper I
5
impacts will not improve until there are far more reliable measurements of the extent and rate of
change of desertification, and desertification is properly integrated into national statistics and
planning methods.
2.2 ECONOMIC IMPACTS OF DESERTIFICATION Economic impacts of desertification are divided in this chapter into three main categories: direct
impacts, which affect the land users that cause degradation; indirect impacts, which can affect
people far away from where the degradation occurs; and economy-wide impacts, in which the sum
of these initial costs is increased by the "multiplier effect" owing to complex links with other
economic sectors.
2.2.1 DIRECT ECONOMIC COSTS Direct economic costs reduce the income obtained by land users as a result of the lower productivity
of land resulting from desertification. These 'on-site' costs are experienced either by the land user
who degrades the land, or by another user who uses the site subsequently.
The first estimate of the global direct cost of desertification was $26 billion per annum, made by
UNEP in 1980, shortly after the UN Plan of Action to Combat Desertification was agreed at the UN
Conference on Desertification (UNCOD) in 1977. It was based on reports by consultants, including
Dregne (1983), of yield declines on lands with differing degrees of severity of desertification. Dregne
produced the first world map of desertification status in 1977 for UNCOD; like Mabbutt (1984), who
also made global estimates of the extent of desertification for UNEP, he could therefore derive cost
estimates from a global biophysical database - albeit one based on subjective expert assessment.
However, the methods used to make this estimate have been criticized (Bojö, 1991). Lack of more
reliable global estimates of the extent of desertification over the last 20 years has limited the scope
to revise this global cost estimate.
Estimates of the direct costs of national land degradation as a proportion of national income have
also been made for single countries, many referring to conditions in the 1980s. Only a few have been
published in peer-reviewed academic journal papers, including 2% of Gross Domestic Product (GDP)
in India (Reddy, 2003) and 0.4% of GDP in the USA (Pimentel et al., 1995) (Table 2.1). Barbier and
Bishop (1995) referred to other non-peer-reviewed estimates including 9% of GDP in Burkina Faso
(Lallement, 1989) and 0.9-12.5% of GDP in Mali (Bishop and Allen, 1989), while Bojö and Castells
(1995) made an estimate of 2% of Agricultural GDP for Ethiopia, based on a peer-reviewed soil
erosion estimate by Hurni (1988). Other non-peer-reviewed estimates of direct costs are based on
simulations of possible future trends, e.g. 8% of GDP in Niger (Nkonya et al., 2011), or refer to only
one form of land degradation, e.g. 0.7% of GDP for the cost of overgrazing in Kenya (IMF, 2010).
These estimates clearly cover a wide range. The US estimate, for example, was $27 billion in
monetary terms, which only slightly exceeded UNEP’s (1980) estimate for the global direct cost of
desertification. When expressed as percentages of AGDP the direct costs range from 2% of AGDP for
Ethiopia and 4% of AGDP for India, to as much as 20% of AGDP for both Burkina Faso and the USA
and 2-30% for Mali. This validity of the higher costs does seem questionable, since they would surely
be expected to affect decisions by land users on the ground. Barbier and Bishop (1995) were cautious
too, stating that such estimates were "often more illustrative than definitive, due to the paucity of

UNCCD 2nd Scientific Conference 2013 White Paper I
6
empirical data and measurement problems" and that they can involve "serious methodological
difficulties."
Recent research that has not been published in international peer-reviewed journals has produced
estimates of direct costs that fit within the range of estimates in Table 2.1. Thus, Liu (2006) estimated
the direct costs to agriculture of desertification in China in 1999 as RMB 40 billion, which was only
2.7% of AGDP but more than twice Zhang et al.'s (1996) estimate of RMB 17 billion for 1995 (1.4% of
AGDP in that year). The preliminary results of a study in fourteen Latin American countries suggest
that direct costs of land degradation are between 8% and 14% of AGDP in Argentina, Belize, Bolivia,
Chile, Colombia, Costa Rica, Ecuador, El Salvador, Guatemala, Honduras, Nicaragua, Panama,
Paraguay and Peru, but vary markedly within each country (Morales et al., 2011).
Table 1: Estimates of national direct costs of land degradation in the 1980s as a proportion of Gross Domestic Product (GDP)
Country Magnitude Per cent GDP Per cent Agricultural
GDP*
Reference
Burkina Faso - 9 20 Lallement (1989)
Ethiopia - - 2 Bojö and Castells (1995),
based on Hurni (1988)
India Rs 75 billion 2 4 Reddy (2003)
Mali - 0.9-12.5 2-30 Bishop and Allen (1990)
USA $27 billion 0.4 20 Pimentel et al. (1995)
* NB. Estimates made for this review.
The paucity of estimates of direct costs that have been published in peer-reviewed academic journals
indicates that the full range of data and methods used to estimate these costs have not been
rigorously evaluated. This is symptomatic of a field that lacks a consensus at a given time on
acceptable levels of rigour, and a structured evolution over time in the sophistication of its methods.
More specifically, in this case it means that the variety of available estimates are not directly
comparable or comprehensive, as they have been produced by applying different methods and
different standards of data quality to different agricultural production systems. In practice, estimates
also refer only to soil degradation, rather than also covering vegetation degradation and broader
aspects of land degradation, e.g. biodiversity (Lal, 1988), and they vary in the scope of soil
degradation processes which they cover.
2.2.2 EXPLAINING THE VARIATION IN DIRECT COSTS This section looks in more detail at three key reasons for the wide variation in estimates of direct
costs: the resolution of information and data; the use of different kinds of estimation methods; and
variation within the same basic method.

UNCCD 2nd Scientific Conference 2013 White Paper I
7
2.2.2.1 INFORMATION AND DATA RESOLUTION
The geographical resolution of the environmental and economic information on which estimates of
direct costs are based can vary a great deal and in unexpected ways. For example, the estimate of
direct US costs, despite appearing in one of the world's most prestigious scientific journals, was
based on a mean erosion rate of 17 tonnes per ha per annum extrapolated to the entire 160 million
hectares (ha) of cropland in the USA. In contrast, the estimate for India in Table 2.1 was based on
individual estimates for 442 districts in 14 regions of the country in 1988-89 by the National Remote
Sensing Agency (NRSA, 1995). Reddy (2003) compares this Indian estimate with other estimates by
the Agro-Climatic Regional Planning Unit (ARPU, 1989) for 241 districts within eight agro-climatic
zones in 1990; and by Sehgal and Abrol (1994), who applied the Global Assessment of Soil
Degradation (GLASOD) approach (Oldeman, 1988) used in the UNEP World Atlas of Desertification
(Middleton and Thomas, 1992) and relied on a national soil map, selected remote sensing data and
published information. While the NRSA and ARPU estimates of the total area affected by soil erosion
are at least comparable, i.e. 32 and 58 million ha, the 166 million ha estimate of Sehgal and Abrol for
1994 does raise questions as it represents half the entire area of India.
The accuracy of environmental information depends on the spatial resolution of measurements.
Basing estimates on measurements is better than the subjective expert assessment used in the
GLASOD approach. The NRSA (1995) estimate mapped: (a) water erosion by using 10 km x 10 km
grids of the Soil Resource Map of India; (b) wind erosion by field surveys at unspecified resolution;
and (c) salt-affected soils by visual interpretation of 1:250,000 scale photographic prints of images
collected by 36 m and 73 m resolution Indian satellite sensors supported by ground data. The ARPU
estimate combined NRSA data with data supplied by its regional centres.
Estimates also vary in their coverage of land degradation processes. Thus, NRSA (1995) and Sehgal
and Abrol (1994) both estimated areas affected by soil erosion, salinization and alkalinization, and
waterlogging, but the ARPU (1989) estimate was restricted to soil erosion (Table 2.2).
Finally, estimates of soil erosion rates vary in their empirical foundation. Many studies predict rates
using the Universal Soil Loss Equation (Wischmeier and Smith, 1978) - or equivalents - which employs
rainfall erosivity, soil erodibility, soil length and slope, land cover, and quality of management and
conservation as independent variables (Nkonya et al., 2011). The use of actual erosion rates
measured in the field is much less frequent.
2.2.2.2 DIFFERENCES IN ESTIMATION METHODS
The two leading methods used to estimate the national costs of land degradation are the
replacement cost method and the loss of production method.
The replacement cost method estimates the amount of soil nutrients lost each year by soil erosion
and the cost of buying fertilizers to replace these nutrients. Thus, Pimentel et al. (2003) estimated
that 4,000 million tonnes of soil are lost from the 160 million ha of cropland in the USA each year and
replacing the nutrients lost with this soil would cost $20 billion. The total direct cost of $27 billion
included a further $7 billion to pay to replace water lost by rapid runoff associated with soil erosion.
One limitation of this method is that it assumes that zero degradation can be used as a yardstick, but
this is never seen in practice (Barbier, 1998). Another is that lack of rainfall may constrain production
far more than nutrient loss (Bojö, 1996).

UNCCD 2nd Scientific Conference 2013 White Paper I
8
The loss of production method estimates the amount of soil lost each year and converts this into a
reduction in crop production. Reddy (2003), for example, valued the loss of production in India as
Rupees 68 billion in 1988-89 using the NRSA dataset, and Rupees 124 billion in 1990 using the ARPU
dataset (Table 2.2). These were equivalent to $3.7 billion and $6.8 billion, respectively, at
contemporary exchange rates, but just a fraction of another estimate of Rupees 361 billion for 1994
by Sehgal and Abrol (1994). All these estimates referred solely to losses due to soil erosion. The NRSA
and ARPU estimates applied a mean annual topsoil erosion rate of 19.6 tonnes per ha, from the
National Bureau of Soil Survey and Land Use Planning, to all areas undergoing erosion, which is
slightly greater than the US rate used by Pimentel et al. (1995). Additional losses resulting from
salinization, alkalinization and waterlogging were estimated as Rupees 8 billion using the NRSA
dataset but as eleven times this by Sehgal and Abrol (1994). These were based on a mean 25%
reduction in yields estimated by the National Bureau of Soil Survey and Land Use Planning. The total
direct cost of land degradation estimated using the NRSA dataset was Rupees 75 billion (Table 2.1).
Differences between the various estimates of desertification costs in China reviewed in Case Study 1
in Annex 1 are partly explained by the use of different estimation methods. The study by Reddy
(2003) is valuable for using the same environmental information on soil erosion to produce estimates
by both the loss of production method and the replacement cost method, with the latter leading to
an estimate of Rupees 18 billion (Table 2.2). This was just over a quarter of the cost estimated using
the lost production method, even though Reddy (2003) explicitly allowed for the leaching of
fertilizers when making his estimate, by calculating the weight of required fertilizer as 3.01 times the
weight of NPK nutrients lost. It is not clear if Pimentel et al. (1995) made a similar allowance.
Table 2: Three estimates of the extent and annual direct cost of land degradation in India
NRSA
(1988-89)
ARPU
(1990)
Sehgal and
Abrol (1994)
Area affected by soil erosion (million ha) 31.5 58.0 166.1
Area affected by salinization, alkalinization and
waterlogging (million ha)
3.2 - 21.7
Total area affected by land degradation (million
ha)
34.7 58.0 187.8
Cost of soil erosion in lost nutrients (Rps billion) 18.0 33.3 98.3
Cost of soil erosion in lost production (Rps billion) 67.6 124.0 361.0
Cost of salinization, alkalinization and waterlogging
in lost production (Rps billion)
7.6 - 87.6
Total direct cost of land degradation (Rps billion) 75.2 - 448.6
Sources: Reddy (2003) (NRSA and APRU); Sehgal and Abrol (1994).

UNCCD 2nd Scientific Conference 2013 White Paper I
9
2.2.2.3 DIFFERENCES IN IMPLEMENTING THE LOSS OF PRODUCTION METHOD
Insights into how direct cost estimates can vary according to how one of the leading estimation
methods is implemented can be gained by examining four successive studies in Ethiopia, reviewed in
more detail by Yesuf et al. (2007), that relied on the loss of production method (Table 2.3):
Table 3: Estimates of the direct costs of soil erosion on agricultural production in Ethiopia as a proportion of Agricultural Gross Domestic Product (AGDP)
Study Projection
Period (Years)
Discount Rate (%) Direct Cost (%
AGDP)
Ethiopian Highlands Reclamation Study (FAO, 1986)
25 9 2.2
Soil Conservation Research Project (Hurni, 1988; Bojö and Castells 1995)
0 - 2.0
National Conservation Strategy Secretariat (Sutcliffe, 1993)
25 Na 6.8
World Bank Reassessment (Bojö and
Castells, 1995)
100 10 3.0
Source: Yesuf et al. (2007). (i) The Ethiopian Highlands Reclamation Study (EHRS) evaluated both the soil and vegetation
components of land degradation but estimated economic costs only for the impacts of soil erosion
on cropland area, crop yield, rangeland area and grass yield, on the assumption that 80% of soil loss
was from cropland, with most of the rest coming from rangeland. Based on data for 1985 it projected
soil erosion over the period from 1985 to 2010. Annual erosion rates were estimated at 130 tonnes
per ha for cropland and 35 tonnes per ha for other land. Yields were expected to fall annually by 2.2%
for crops and 0.6% for grass, with a direct cost equivalent to 2.2% of AGDP. The present value of
degradation costs was calculated using a discount rate of 9% (FAO, 1986). The high rates of erosion
predicted by this study have been explained by its use of poor quality site-specific data and by
difficulties in using the Universal Soil Loss Equation to predict soil erosion rates (Yesuf et al., 2007).
(ii) The Soil Conservation Research Project (SCRP) focused on soil erosion and forecast trends
over a limited period from 1981 to the mid-1990s. Unlike the other three studies considered here, it
only estimated immediate costs and so did not use discounting. Estimates of the annual rates of soil
loss were far lower than for the EHRS study, at just 12 tonnes per ha, having been better calibrated
using field data than estimates in the EHRS study (Hurni, 1988). Yet when Bojö and Castells (1995)
used these results they estimated that lost agricultural production was still equivalent to 2.0% of
AGDP.
(iii) The National Conservation Strategy Secretariat (NCSS) built on the methods used in the
EHRS and SCRP and also forecast trends from 1985 to 2010. One of its crucial advances was to
assume that soil erosion does not affect crop productivity until a minimum soil depth of 90 cm is
reached. This reduced estimates of soil loss compared with earlier studies, with rates of decline in
crop production and cropland area for 1985 that were just 7% and 6%, respectively, of those in the

UNCCD 2nd Scientific Conference 2013 White Paper I
10
EHRS study. Another advance was in accounting also for the nutrients lost when animal dung is burnt
as fuel instead of being incorporated into the soil, and this led to an overall cost equivalent to 6.8% of
AGDP (Sutcliffe, 1993). A subsequent evaluation explained the large size of the estimate by instances
of double counting and overestimates of the costs of dung burning (Bojö and Castells, 1995).
(iv) A World Bank Reassessment exercise built on the NCSS study, but by using a 100 cm soil
depth threshold and an alternative procedure for dung substitution, and taking into account also the
effect of eroded soil redeposited elsewhere, it halved the NCSS estimate of erosion damage. Mean
annual soil loss rates were just 20 tonnes per ha and only affected the 30% of total cropland area
where soil depth was less than 100 cm. The loss of agricultural production in 1994 was equivalent to
3% of AGDP, which was more consistent with the 1986 and 1988 estimates (Bojö and Castells, 1995).
None of these studies was published in a peer-reviewed journal - though the 1988 estimate was
made by Bojö and Castells (1995) using environmental information in the peer-reviewed study by
Hurni (1988). Nevertheless, together they illustrate how accounting practices have evolved, and the
details which policy makers will need if they wish to compare the merits of alternative estimates.
A wider lesson to draw from the analysis in this section is the importance of validating estimates of
economic costs by comparing them to other information. The Ethiopian studies imply, for example,
that economic costs of soil erosion in Ethiopia in the 1980s and 1990s were close to 2-3% of AGDP
(Table 2.2). This is at the low end of the spectrum of national estimates in Table 2.1, and therefore
seems feasible. Nevertheless, it is not easy to find support in national statistics on cereal production,
yield per hectare and cropland area for either a fall in productivity or a loss of cropland because of
desertification. Validation is difficult in Ethiopia since there are two parallel statistical processes for
agriculture: one set of statistics is produced by the Ministry of Agriculture and Rural Development,
and used in international statistics compiled by the UN Food and Agriculture Organization (FAO),
while another set is issued by the Central Statistical Authority. Both sets of statistics show a 31% fall
in production in the 1970s, but this is explained by a 31% fall in cultivated area, following the
overthrow of Haile Selassie and subsequent land reform measures. In the 1980s production
stagnated, so again there was no noticeable effect that could be linked to land degradation.
Production began rising in the 1990s, mainly because cultivated area increased, and both sets of
statistics show increases in cultivated area and average yield per hectare since the year 2000. This
would not contradict estimates of land degradation if fertilizers had been applied to replace nutrients
lost by soil erosion, but it is known that the use of fertilizers, pesticides, improved varieties and
irrigation in Ethiopia has been generally limited for a long time (Taffesse et al., 2011). Consequently,
it is hard to independently validate claims about land degradation made in the studies in Table 2.3.
2.2.3 INDIRECT ECONOMIC COSTS Dryland degradation also leads to indirect economic costs through off-site impacts. These impacts
can be long distances from the land use that is the immediate source of degradation, and so are
generally suffered by people other than those who cause degradation in the first place.
The transport of soil by water erosion, for example, can lead to the siltation of rivers, reservoirs and
irrigation canals which reduces their effectiveness and exacerbates flooding (Kirby and Blyth, 1987),
though other lowland groups may benefit from soil transported from degraded hill slopes, e.g.
farmers on whose land the soil is redeposited (Clark, 1996). Wind erosion also leads to costs and

UNCCD 2nd Scientific Conference 2013 White Paper I
11
benefits through siltation, but has its own particular costs linked to the distant impacts of dust
storms on human health, ecosystems, and transport infrastructure, the latter being seen, for
example, in car accidents and delays in airline flights caused by reduced visibility (Shi, 2012).
Salinization and alkalinization caused by excessive or inappropriate use of water also leads to indirect
costs, particularly in Australia (Kirby and Blyth, 1987; John et al., 2005), and in South and Central Asia
(Reddy, 2003; Atis, 2006) where large areas of previously productive land are now unproductive.
Estimates of the indirect costs of land degradation are less common than those of direct costs. The
annual indirect costs of soil erosion in the USA have been estimated as $17 billion, or 63% of direct
costs of $27 billion, and this raises the total costs of soil erosion to 0.7% of GDP (Pimentel et al.,
1995). Estimates of the indirect costs of desertification in China vary widely (see Case Study 1 in
Annex 1). Thus, Liu (2006) estimated the indirect cost to transportation alone in 1999 as RMB 35
million, but Zhang et al. (1996) estimated the same cost in 1995 as RMB 200 million.
Estimating the indirect costs of land degradation is constrained in four ways. First, reliable
biophysical information is lacking on land degradation and its many impacts. Second, although some
studies do estimate the costs of multiple off-site impacts (e.g. Clark et al., 1985; Pimentel et al., 1995;
and Hajkowicz and Young, 2002), many studies often focus on just one or a small number of impacts,
e.g. airline delay (Liu, 2006) or human health (Cheng et. al, 2012), and it may be impossible or
inappropriate to aggregate cost estimates for the same area, or to compare cost estimates for
different areas with different impact profiles. Third, many of the costs do not have market prices.
These 'external costs', so called because they are outside the market, are commonly divided by the
Total Economic Value Method into: (a) direct use values, which are generally related to using
ecosystem services; (b) indirect use values, in which benefits are gained from ecosystem services
indirectly, e.g. when forest on a river catchment stabilizes runoff and supplies of irrigation water and
minimizes flooding; (c) option values, which allow for future direct or indirect uses; and (d) existence
values, in which benefits are gained independently of any use, e.g., scenic beauty (Pearce and Turner,
1990). Fourth, as in the case of direct costs reviewed in the previous section, various methods are
used to estimate the values of indirect costs. They include:
(i) Contingent valuation, measured by people's willingness to pay for or accept a phenomenon.
(ii) Choice experiment, determined by choosing one option from a range of options.
(iii) Avoided cost, estimated by avoiding the cost due to damage.
(iv) Replacement cost, which is the cost of replacing a service by the least costly alternative
(Adhikari and Nadella, 2011; Nkonya et al., 2011; Requier-Desjardins et al., 2011).
As examples of the last two methods, the impact of soil erosion on the siltation of hydroelectric
reservoirs has been estimated by avoiding the cost of dredging reservoirs (Hansen and Hellerstrein,
2007), and by the cost of replacing hydro-electricity by electricity generated in another way, e.g.
from fossil fuels (Clark, 1996).
2.2.4 ECONOMY-WIDE COSTS So far in this section, for convenience, national costs have been expressed as a proportion of GDP or
AGDP. However, this ignores the fact that both direct costs and indirect costs can, through a complex

UNCCD 2nd Scientific Conference 2013 White Paper I
12
chain of influences, lead to a multitude of other costs throughout an economy. For example, soil
which is eroded by wind and reduces reservoir capacity can lead to electricity outages throughout a
country, which in turn can result in production losses in many industries and other commercial
enterprises, which eventually affects the size of government spending and the income of employees
who are put on short-time work (Nkonya et al., 2011). Even a reduction in agricultural production
and income caused by land degradation can have "knock-on" effects throughout an economy by
affecting the circulation of income and international trade flows.
Estimates of these two categories of economy-wide costs are infrequent because of the difficulties
involved. No studies of the first category of costs appear to have been undertaken, as tracing the
complex interlinkages is very challenging. However, there are examples of the second category,
anticipated by Coxhead (1999) who advised that "if the erosive sector is very small in relation to
GDP... then the costs of constructing a more general model are unlikely to be merited." These studies
typically involve simulating future scenarios and comparing a 'business as usual scenario' with a 'soil
erosion scenario'. Thus, when Alfsen et al. (1996) included the effects of soil erosion in a computable
general equilibrium model which divided the Nicaraguan economy into 26 sectors, of which 11 were
agricultural, their model projected that exports of agricultural commodities would decline between
1991 and 2000, and that demand for labour would fall by 7%, with the construction sector being hit
hardest. Diao and Sarpong (2007), in a non-peer reviewed study, predicted that a mean loss of 5% in
AGDP caused by soil erosion between 2006 and 2015 in Ghana would increase the national rural
poverty rate by 5.4% by 2015.
2.2.5 POLICY IMPLICATIONS Policy makers wishing to use the findings of economic research into the direct and indirect costs of
land degradation will, according to the analysis in this section, face tremendous difficulties, as the
use of different methods and data sources in different studies, only some of which are peer-reviewed,
has led to a wide range of conflicting estimates. Policy makers wishing to assess the meaning of these
studies will need help from professional economists in tracing and evaluating the actual methods by
which their estimates were produced. The studies reviewed here also differ owing to decisions by
their authors on whether to estimate short-term versus long-term costs, annual versus cumulative
costs, and discounted versus non-discounted costs. Other studies might estimate net costs, to allow
for adjustments in farmer behaviour after degradation; or real costs, to allow for inflation (Bojö,
1996).
To underline the point made earlier, if policy makers intend to use economic estimates as part of
detailed planning methods, rather than merely to justify decisions, then a robust and comprehensive
method should be designed for each country. This will have financial implications, but it will ensure
that land degradation costs will be comparable with other costs and benefits in agriculture, and in
other economic sectors too, and this will help to validate estimates of land degradation costs.
2.3 SOCIAL IMPACTS OF DESERTIFICATION Estimates of the total economic impacts of desertification do not shed much light on how these
impacts affect society and the many individuals within it. This section looks in more detail at these
social impacts. It begins by addressing gross social impacts, measured by the number of people

UNCCD 2nd Scientific Conference 2013 White Paper I
13
affected, and then looks at how these impacts are distributed among a population, and are
influenced by and influence a community's poverty status, food security and human health.
2.3.1 POPULATIONS IN THE DRYLANDS The first step in assessing the social impacts of desertification is to find out how many people live in
the drylands. By 1994 the total population of the drylands was 2,010 million (UNDP, 1997), or 40% of
all people on the planet. This was three times the size of the population in 1975, shortly before the
United Nations Conference on Desertification (UNCOD) in 1977 (Table 2.4), and it has continued to
rise in the intervening 19 years. The population of Niger, for example, may have more than doubled
from 7.8 million in 1990 to 17.2 million in 2013 (FAO, 2013), though a census has not been held there
since the year 2000.
Table 4: Population growth in the drylands 1975-1994 (millions)
1975 1994
Americas 68.1 Americas 182.3
Asia and Pacific 378.0 Asia and Pacific 1,356.6
Sub-Saharan Africa 75.5 Africa 326.1
Mediterranean Basin 106.8 Europe 144.6
Total 628.4 Total 2,009.7
Sources (with different regional classifications): Kates et al. (1977), UNDP (1997).
2.3.2 THE DISTRIBUTION OF IMPACTS The next step is to identify the distribution of desertification impacts among the dryland population,
since not all those who live in dry areas will be affected by desertification. Unfortunately, the current
size of this affected population is unknown, owing to poor data on population and the extent and
rate of change of desertification. Mabbutt (1984) estimated that 44% of the total dryland population
in the 1970s - 280 million rural people - were affected by at least moderate desertification. These
figures were not updated in the UNEP World Atlas of Desertification (Middleton and Thomas, 1997),
but if the same proportion is affected as in the 1970s then the size of the affected population in the
1990s was 884 million people, and it could have risen to 1.8 billion people if the dryland population
has doubled since the 1990s.
2.3.3 THE DISTRIBUTION OF IMPACTS BY POVERTY STATUS Individuals within the affected population vary greatly in their ability to bear the costs of
desertification. Those who live in poverty, and lack the income and other resources needed to obtain
the basic necessities of life, find it particularly difficult to cope. This is especially the case where
communities rely on ecosystems to meet their daily needs and for products that they may sell to

UNCCD 2nd Scientific Conference 2013 White Paper I
14
augment other sources of income. However, loss of income as agricultural production declines due to
land degradation can impact on poverty levels at national scale too (Diao and Sarpong, 2007).
Poverty was defined by the World Bank (1990) as "the inability of people to rise to a minimum
standard of living", and is determined in two main ways. Absolute poverty is experienced by those
whose income is below a given threshold, or whose food intake is below minimum recommended
nutritional standards. The simplest measure of absolute poverty is the Head Count Ratio, i.e. the
proportion of a population identified as "poor". Relative poverty is experienced by those who receive
less than a certain share of national average income. Relative poverty is linked to income inequality,
determined by the distribution of income and wealth between different social groups. Income
inequality tends to rise in the course of development and only declines at high levels of mean annual
income. This trend is charted by the Kuznets Curve (Kuznets, 1955).
Economic measures of a country's level of economic development use both its mean income, i.e.
GDP per capita, and how equally this is distributed. National income equality can be measured using
the Gini Coefficient, which varies from 1 for perfect inequality to 0 for perfect equality (Hillerbrand,
2008). The Human Development Index measures the relative levels of economic development of
countries by per capita income, adjusted to ensure purchasing power parity, and by two direct
measures of human well-being: educational attainment, and life expectancy at birth (UNDP, 2011).
2.3.4 EVALUATING THE SOCIETAL DISTRIBUTION OF IMPACTS The distribution of impacts within a society should be evaluated in a reflexive manner because
poverty, for example, can be both a cause and an effect of environmental degradation. Poor people
are likely to deplete natural resources if they have no prospects of gaining access to other resources,
and a degraded environment can accelerate impoverishment. Claims continue about a 'vicious circle'
linking poverty to population growth, drought and land degradation (Cleaver and Schreiber, 1994).
Yet whether the poor are major agents of desertification or not, they certainly suffer from its
consequences, as their livelihoods greatly depend on the productivity of land (Hazell et al., 2002;
Stringer, 2009).
Five concepts can be particularly helpful in evaluating the distribution of impacts in a society:
1. The institutions, or rules and norms that structure a society and the activities of everyone
within it. Institutions can be defined as "enduring regularities of human action in situations
structured by rules, norms and shared strategies, as well as by the physical world" (Crawford and
Ostrom, 1995). Thirty years ago Sen (1983) made a major breakthrough in distancing drought from
famine, when he argued that some groups within a society are affected more than others because
they have insufficient entitlements to cope with social, economic or environmental hazards that arise.
Entitlements are "the set of alternative commodity bundles that a person can command in a society
using the totality of rights and obligations that he or she faces", and are influenced by the formal and
informal institutions that enable a society to function. Everyone has a set of endowments, comprising
all the resources they legally own, such as land and their own labour, with which they can obtain
goods and services, such as food, that constitute their entitlements. Entitlements generate human
capabilities, which influence an individual's ability to achieve their full potential and in turn their
welfare.

UNCCD 2nd Scientific Conference 2013 White Paper I
15
2. Environmental justice, which compares the distribution of environmental costs with the distribution of income (Mitchell and Dorling, 2003). If poor people are indeed more affected by environmental hazards then it should be possible to confirm this by comparing the spatial distributions of poverty and hazards. Initial research seems to confirm the presence of such a link for land degradation: one non-peer reviewed study proposes that globally 74% of people in the very lowest income classes live on degraded land but only 15% of people in higher income classes do (Nkonya et al., 2011). Droughts can exacerbate feelings of injustice and lead to conflicts and even more: there is evidence to show that severe drought in China between 1638 and 1641 may have influenced the peasant rebellions that hastened the demise of the Ming Dynasty in 1644 (Cook et al., 2010).
3. Risk, which is ignorance about a future hazard that can be assessed by probabilities (Knight,
1921). Physical geographers have long used mathematical models to predict the risk of areas
undergoing desertification based on their biophysical characteristics, and a global map of
desertification risk was prepared for the UN Conference on Desertification (FAO et al., 1977). Social
scientists, however, argue that such environmental determinism is misleading, and that risk is
influenced by society too (Beck, 2006).
4. Vulnerability, which takes a more interdisciplinary approach to risk and can be defined as "a
function of the exposure and sensitivity of a system to hazardous conditions" and its ability "to cope,
adapt, or recover from the effects of these conditions" (Smit and Wandel, 2006). Research in Senegal
found that different communities vary in their vulnerabilities to drought and desertification, as they
differ in (a) entitlements; (b) coping capacities - how they respond to or avert harm from stresses;
and (c) resilience - their ability to return to their former mode when stresses end (Bradley and
Grainger, 2004). In the Sahel, for example, mobile pastoral communities are generally more resilient
to drought and desertification than settled cropping communities (Bollig and Schulte, 1999; Pamo,
1998). A consensus index of vulnerability would help to compare the vulnerabilities of different
groups and areas (Cutter, 2003), e.g., to desertification. Salvati et al. (2011) have proposed an "index
of land vulnerability to drought and desertification", but this merely extends mathematical models of
biophysical risk to incorporate human impacts on the environment. An index of the more all-
encompassing interdisciplinary concept of the vulnerability of communities living in a given
environment is still awaited.
5. Migration. Desertification can have consequences far away from where land is degraded
since migration, especially to urban areas, is a common response to drought and desertification in
communities whose livelihoods lack resilience to the resulting low farm productivity (Bradley and
Grainger, 2004). Although migration generally reduces human impacts on the environment in places
that people leave, it can increase impacts - and social tensions - in their destinations (Require-
Desjardins and Bied-Charreton, 2006). Many developing countries face huge urban problems and
people who migrate to urban areas to escape the impacts of desertification will exacerbate these
(Thirwall, 1999).
2.3.5 FOOD SECURITY AND HEALTH Desertification threatens food security, which is of great concern throughout the developing world
but particularly in Africa where in 2003 alone, 19 million tonnes of cereals had to be purchased with
$3.8 billion of overseas aid to replenish food stocks (Ezeaku and Davidson, 2008). Desertification can

UNCCD 2nd Scientific Conference 2013 White Paper I
16
therefore have 'secondary' social impacts in the form of malnutrition and disease that arise through
poor farm yields, poverty, and constraints on water quality and availability. About 850 million people
in the world are malnourished or starving, and the number of malnourished people in Sub-Saharan
Africa alone doubled from 88 million in 1970 to 200 million in 2001. Malnutrition contributes to 8
million infant deaths each year, together with preventable diseases whose transmission is promoted
by lack of access to clean drinking water (FAO, 2001).
2.3.6 POLICY IMPLICATIONS
With 40% of the world’s population living in the drylands, desertification is as much a human
problem as an environmental problem and has a major impact on the quality of life of the entire
human family. For this reason it is vital to obtain more accurate statistics on the number of people
who are directly affected by desertification and their ability to cope with its impacts. Integrating
desertification into mainstream development planning will ensure that improving the livelihoods of
affected populations can be given the attention it deserves. However, research into entitlements,
environmental justice and vulnerability suggests that tackling desertification is not just about
adopting physical remedies, such as more "sustainable land management", but requires social
remedies too. This means that economic impacts and social impacts need to be tackled collectively,
rather than separately.
2.4 MODELLING ECONOMIC IMPACTS Studying these fundamental relationships between economic impacts and social impacts requires
formal economic models, of the kind described in peer-reviewed economics journals. These are not
just of interest to academics, but offer important insights into the links between land degradation
and decision-making, the characteristics of production systems and government intervention in the
agricultural sector. This section reviews key findings of this research.
2.4.1 MODELLING OPTIMAL RATES OF LAND DEGRADATION The earliest economic studies of land degradation date from the early 1980s, when Burt (1981) and
McConnell (1983) devised optimal control models to identify the optimal rate of land degradation.
The only fundamental economic model in the peer-reviewed academic literature which specifically
refers to desertification, apart from a review of valuation methods and policy instruments by
Requier-Desjardins et al. (2011), also dates from this time. Morey (1986) postulated that the optimal
rate of allocation of dryland resources over time depends on economic factors and the rate at which
soil can regenerate after biomass is harvested. If the actual rate exceeds the optimal rate then "soil
quality will deteriorate... [and] desertification will take place." Morey questioned an assumption that
desertification is non-optimal from the perspective of society and land users. He showed that
desertification is not necessarily sub-optimal for land users since they often discount the future. By
applying his model to three different institutional settings - privately owned farms, rented farms, and
common property land - he found that a positive rate of desertification on privately owned farms is
not necessarily sub-optimal and that a similar situation could prevail on rented farms. Meanwhile,
farmers using "common property" land - more accurately referred to these days as open access land
(Requier-Desjardins et al., 2011) - will "utilize soil quality until its marginal product is zero."

UNCCD 2nd Scientific Conference 2013 White Paper I
17
Desertification will be non-optimal for land users and society if the land users' discount rate equals
the social discount rate, but views differ on how to set the latter. If the social discount rate is zero
but the land users' rate is higher than this then the market will fail and desertification will persist.
Morey also argued that even subsistence societies can adopt high discount rates, and in such cases
high desertification rates in "common property" settings "might be close to socially optimal" too.
A complementary agricultural economics analysis, by Kirby and Blyth (1987), criticized research that
focused purely on physical aspects and used the concept of 'maximum sustainable yield' as a
benchmark. It stated that: "a problem exists from the social viewpoint only if the actual rate of
degradation differs from the optimal rate." This study highlighted the constraints imposed by
institutional and policy influences in Australia, including the prevalence of leasehold tenure, and the
distortion of prices by government intervention. It also addressed the lack of markets for off-site
impacts of land decisions, noted in Section 2.2.2, finding that this can lead to differences between
private and social costs and benefits, and to significant externalities resulting from the deposition of
eroded soil, or from rising water tables and salinity. For Kirby and Blyth, "soil conservation and purely
technical aims have no intrinsic merit in themselves, but need to be related to a more fundamental
goal - the maximization of community welfare." So they questioned the utility of two popular policy
instruments - soil conservation subsidies and land-use regulations - and argued that while
government intervention is important it must be preceded by tests to show that is justified by
evidence for market failure, and that the social benefits of any intervention will exceed its costs.
2.4.2 INCORPORATING DIRECT COSTS OF LAND DEGRADATION IN FARM MODELS Models can relate the direct costs of land degradation, discussed earlier in this section, to specific
production systems. Thus, Coxhead (2000) estimated the impact of nutrient reductions from soil
erosion on the productivity and profitability of agriculture on the sites where the erosion occurred.
When Holden and Shiferaw (2004) used a non-linear programming model to examine the complex
inter-relationships between land degradation and drought in Ethiopia they found that giving farmers
credit to buy fertilizer can reduce incentives to conserve land and increase erosion rates, though one
way to counter this is to make soil conservation a condition for providing fertilizer credit.
2.4.3 UNEXPECTED EFFECTS FROM POLICIES INTENDED TO REDUCE POVERTY Generic insights into the relationship between poverty and the factors that cause and control land
degradation were gained by Coxhead (2000) when he used a general equilibrium model to study land
degradation by corn cultivation in the Philippines uplands. He found that government support for
food prices causes agricultural land "to be transferred from generally less erosive to more erosive
uses" and warned about "environmental surprises" when governments intervene in agriculture.
While such intervention can lead to a more equal distribution of agricultural income, thereby
reducing relative poverty, it can also lead to "a levelling down of all incomes" and so increase
absolute poverty.
Poverty also constrains the ability of farmers to avoid or mitigate land degradation. For poor
smallholder farmers with limited access to investment capital and alternative opportunities to
generate income, gaining short-term income by using land in a degrading manner can be an entirely
rational strategy (Barbier, 1997), as predicted in Section 2.4.1. Moreover, just as Sen (1983) proposed

UNCCD 2nd Scientific Conference 2013 White Paper I
18
that poverty is indicative of wider institutional problems in society, so Barbier (1997) found that
imperfections in rural land markets also mean that the costs of soil erosion "may not be reflected
adequately... [in] the price of land in local markets". To promote more sustainable land management
it may therefore be necessary to address the price distortions resulting from government policies;
ensure that rural financial markets operate efficiently; and enforce property rights more effectively
(Coxhead, 1997). Finally, to guard against unexpected negative environmental impacts of
government policies, farmers may need to be given direct incentives to manage land more
sustainably too (Barbier, 1997).
2.4.4 ECONOMIC CONSTRAINTS ON REVERSING DESERTIFICATION Attempts to control soil erosion through soil conservation projects can also run into trouble if the
projects do not allow for the considerable initial investment required and the long lead time before
farmers benefit financially from these projects (Barbier, 1997). In Malawi, for example, 45% of
smallholder farmers have less than one hectare of land, but households with less than two hectares
of land only received 17% of medium-term credit in the early 1990s (Barbier and Burgess, 1992).
Although agroforestry solutions to land degradation are well known (e.g. Grainger, 1990),
government policies may prevent them from being put into practice. For example, the nitrogen-fixing
tree Acacia senegal has long been used in some parts of Africa in fallowing and intercropping systems
that can control dryland degradation. The profitability of these systems is promoted by harvesting A.
senegal for gum arabic, but Barbier (1992) found that in the early 1990s farmers in Sudan preferred
to grow monocultures of annual crops, such as groundnut and millet, because government policies
had caused the gum arabic price to fluctuate and limited the rate of return to farmers. So sustaining
agroforestry systems that are vital to controlling desertification may depend on governments
maintaining the price of one of the crops harvested from such systems.
2.4.5 THE IMPORTANCE OF INTEGRATED NATIONAL LAND USE PLANNING Large irrigation projects, which are often planned and implemented by governments with
international financial support, are frequently given credit for improving agricultural productivity and
reducing fluctuations in yields resulting from variability in rainfall. However, research has shown that
it is important to anticipate negative national impacts when planning such projects. These impacts
can be social in character, e.g., by displacing poorer farmers; environmental, e.g., due to
waterlogging and salinization (Singh and Singh, 1995); economic, e.g., by diverting water for
irrigation projects from floodplains crucial for cropping, pastoralism and fishing; and mixed, e.g. the
displacement of poorer farmers to more marginal lands can lead to degradation there (Grainger,
1992). Comparing the potential income from a proposed irrigation project in northeast Nigeria with
income foregone when water is diverted from a natural floodplain found that "the additional value of
production from large-scale irrigation schemes [did] not replace the lost production attributed to the
wetlands downstream." Indeed, the extra income generated by the irrigation project did not exceed
17% of the downstream losses in any of the scenarios simulated (Barbier and Thompson, 1998).

UNCCD 2nd Scientific Conference 2013 White Paper I
19
2.4.6. POLICY IMPLICATIONS Even the limited amount of fundamental economic research into land degradation that has been
undertaken so far has important policy implications. It shows, for example, that it is crucial to
understand the institutional settings in which land users make decisions that may lead to, or avoid,
desertification. Deciding to use land in a way that leads to desertification is not necessarily abnormal
or irrational, and governments may unintentionally exacerbate this, e.g. when they subsidize
fertilizer use; support food prices to benefit farmers and determine the level of subsidy; or introduce
large capital-intensive agricultural schemes that can have positive local impacts but negative national
impacts. So the rate of desertification could be reduced if: government policies were evaluated
beforehand to check for unintended consequences; societal institutions were audited to check for
constraints that lead to poor people degrading land instead of managing it sustainably; and an
integrated approach was taken to national land-use planning and government policies.
2.5 TOWARDS INTEGRATED PLANNING AND MONITORING TOOLS The analysis in this chapter has shown that estimates of the economic and social impacts of
desertification are lacking in frequency, accuracy, scope and comparability. If the Parties to the
UNCCD wish to counter these limitations then one way to do this would be to devise enhanced
practical planning and monitoring tools that include these economic and social impacts. Demand for
information on these impacts by planners and policy makers would then ensure that estimates of
economic and social impacts are made frequently; cover all the impacts in a country and in the
drylands generally; are as accurate as possible; and are comparable with each other. They should
also be comparable with the benefits of activities leading to the impacts, which is crucial since costs
and benefits should be treated together in practical decision-making and formal cost-benefit analysis.
This approach would promote the incorporation of desertification in mainstream planning tools, as
recommended by the report of the UN Joint Inspection Unit (Ortiz and Tang, 2005). It would also fill
another major gap in this field - the lack of accurate and frequent estimates of the national and
global extent and rate of change of desertification, because without such biophysical estimates it is
impossible to make reliable estimates of economic and social impacts. If economists and other social
scientists were closely involved in this initiative then academic research in this field should expand
rapidly. This section suggests how the UNCCD could take this further, and focuses on identifying
possible conceptual frameworks which could be used to ensure that sets of statistics, and variables in
planning methods, are chosen in an integrated manner.
2.5.1 CURRENT UNCCD ACTIVITIES IN INDICATOR DEVELOPMENT To put these proposals for new initiatives into perspective, it is worth noting at this point that six
years ago the Parties to the UNCCD requested that a set of 'impact indicators' be formulated to
measure progress in implementing strategic objectives 1, 2 and 3 of the Ten Year Strategic Plan and
Framework (COP, 2007). They subsequently adopted a provisional set of indicators (Table 2.5a) (COP,
2009; CST, 2009); and after this set was subjected to pilot testing and more detailed scientific
evaluation they adopted a refined set of indicators (Table 2.5b) (COP, 2012; CST, 2011), and
established an Ad Hoc Advisory Group of Technical Experts to continue refinement (COP, 2012).
This set of 'impact indicators' was not chosen to measure the impacts of desertification, as discussed
in this document, but the impacts on desertification of the implementation of the Convention.

UNCCD 2nd Scientific Conference 2013 White Paper I
20
However, because desertification is understood in the Convention as both a biophysical
phenomenon and a social phenomenon the set includes both biophysical and social indicators.
One criticism of the provisional set of indicators was that it was not conceived within the structure of
a coherent conceptual framework (CST, 2011), and the same criticism applies to the refined set of
indicators too. Although the use of conceptual frameworks is recommended in scientific research on
indicators (Gudmundsson, 2003), they are often neglected when indicators are selected in political
processes. This results in long lists of indicators with no apparent connection between individual
indicators, and with no potential to synthesize them to estimate a meaningful index, because
individual indicators are generally selected to respond to the needs of particular groups or
information requirements. This is evident in criteria and indicator (C&I) schemes for sustainable
forest management (Grainger, 2012), for example, none of which is used operationally. The refined
set of 11 impact indicators is relatively small in comparison with the more than 60 indicators used in
some C&I schemes for sustainable forest management, but it shares their lack of coherency. If these
indicators had been selected within a conceptual framework then economic, social and biophysical
indicators would have been distinguished and the biophysical indicators could be integrated to
evaluate land degradation. For example, 'degree of land degradation' depends on the degradation of
soil and vegetation, and the degradation of vegetation can be measured by changes in 'plant
biodiversity' and 'carbon stocks' which in turn are influenced by the extent of each type of 'land
cover'. The presence of these three separate but overlapping indicators in this list also illustrates the
embryonic nature of desertification monitoring.
Table 5: UNCCD impact indicators
a. Provisional indicators b. Refined indicators
1 Water availability per capita Water availability per capita
2 Change in land use Change in land use
3 Proportion of the population in affected
areas living above the poverty line
Proportion of the population in affected areas
living above the poverty line
4 Childhood malnutrition and/or food
consumption/calorie intake per capita in
affected areas
Food consumption per capita
5 The Human Development Index Capacity of soils to sustain agro-pastoral use
6 Level of land degradation Degree of land degradation
7 Plant and animal biodiversity Plant and animal biodiversity
8 Aridity index Drought index
9 Land cover status Land cover status
10 Carbon stocks above and below ground Carbon stocks above and below ground

UNCCD 2nd Scientific Conference 2013 White Paper I
21
11 Land under sustainable land management Land under sustainable land management
Source: Berry et al. (2009); CST (2011).
Operational sets of indicators should have one purpose and one purpose only: to convey meaningful
information to the body which intends to use them. Data collected for the provisional or refined set
of indicators could certainly be used to monitor both the extent and rate of change of desertification
and its social impacts (though not its economic impacts), but to convey meaningful information to
policy makers they would need the closer integration which a suitable conceptual framework could
provide.
The remainder of this section examines possible conceptual frameworks that could provide a
structure for integrating desertification and its economic and social impacts into mainstream national
statistics and planning methods.
2.5.2 USEFUL ECONOMIC CONCEPTUAL FRAMEWORKS One simple but effective economic framework would divide the costs and benefits of all activities
into three orthogonal dimensions: economic, social and environmental. Based on neoclassical
microeconomics theory, which separates scarce resources into three main categories, Capital, Labour
and Land (or Environment), this would allow the income gained from using land to be compared with
the net social benefits of generating and distributing this income, e.g. on poverty, food security and
health, and with the net environmental benefits of using land. Actual income would reflect potential
income adjusted for the loss in yields resulting from the direct costs of land degradation on a
particular site, and for any effect on yields resulting from the indirect costs of land degradation
elsewhere.
Macroeconomics theory focuses on the circulation of income within an economy, and is the basis for
estimating indicators of economic activity, such as the Gross Domestic Product (GDP). However, just
as mean national income per person, or GDP Per Capita, is unrepresentative of the actual distribution
of income in a country, it is also unrepresentative of the environmental welfare of each person,
because income has not been corrected for the environmental impacts of generating this income. So
the Green Gross Domestic Product (GGDP) index deducts from GDP the value of depleted natural
resources stocks and the costs of environmental degradation. In one of the earliest estimations,
Indonesia’s GDP in 1984 of Rupiah 13,520 billion was corrected for the net depletion of oil reserves,
the depletion of timber reserves, and the amount of soil lost through erosion to give a Green GDP of
only Rupiah 11,186 billion. Although no correction was made for another form of environmental
degradation, pollution, because of lack of data, this still meant that the mean ‘Green GDP’ growth
rate for 1971 to 1984 was just 4% per annum, compared with 7% for the GDP growth rate (Repetto
et al, 1987). The reliability of estimates of the GGDP has long been limited by (a) partiality, as they
tend to concentrate on a few resources for which data are available; (b) the poor quality of estimates
of the physical magnitudes of environmental degradation, such as the soil erosion rate; (c) the
subjectivity of estimates of the economic values of resource depletion and environmental
degradation; and (d) the number of components of natural resource depletion and environmental
degradation which are deducted from GDP - the more components there are the lower the value of
GGDP is likely to be (Pearce and Barbier, 2000). Since the GGDP, like GDP, does not account for the

UNCCD 2nd Scientific Conference 2013 White Paper I
22
equity with which national income is distributed, the Index of Sustainable Economic Welfare was
devised, in which GDP Per Capita is adjusted for both social and environmental costs, and then the
corrected total is multiplied by an index representing the inequality of income (Daly and Cobb, 1989).
2.5.3 USEFUL ENVIRONMENTAL CONCEPTUAL FRAMEWORKS Since the year 2000 ecosystem services have become an increasingly important concept in both
environmental science and environmental policy. The services provided by ecosystems are divided
into a number of categories which differ according to the taxonomy used. The taxonomy employed
by the Millennium Ecosystem Assessment (2005) has proved very popular and includes:
1. Provisioning services, which supply goods such as food, timber etc.
2. Regulating services, which control hydrological processes, gaseous processes etc.
3. Supporting services, which are processes within ecosystems, such as nutrient cycling, that
maintain provisioning and regulating services.
4. Cultural services, such as recreation, which are provided directly to human beings.
Despite their conceptual popularity, ecosystem services are still to be converted into practical
planning tools (Turner and Daily, 2008). One constraint is that the concept had a purely
environmental origin and planning demands a more comprehensive coverage of human,
environmental and human-environmental processes, including poverty. Another is that biodiversity is
portrayed in the above taxonomy as outside the four main services but supportive of them, which
makes it difficult to represent trade-offs between biodiversity and the exploitation of provisioning
services.
Ecosystem services could be used as a conceptual framework in their own right, or they could form
the second tier of a conceptual framework whose first tier is provided by the microeconomic
framework described in the previous section. Thus, provisioning services correspond to the economic
dimension, and regulating services and supporting services to the environmental dimension, while
cultural services contribute to the social dimension.
2.5.4 USEFUL HUMAN-ENVIRONMENTAL CONCEPTUAL FRAMEWORKS Desertification is a very complex phenomenon comprising multiple interactions between human
systems and environmental systems, so it is understandable that its analysis has been limited by
disciplinary barriers and dominated initially by biophysical environmental disciplines such as soil
science and geomorphology. Interdisciplinary research is relatively recent, but early findings are
summed up in the five principles of the Drylands Development Paradigm (Reynolds et al., 2007):
1. Human-environment systems are coupled, dynamic, and co-adapting, with no single target
equilibrium point, so their structure, function and interrelationships change over time.
2. The critical dynamics of dryland systems are determined by a limited suite of both biophysical
and socio-economic "slow variables", such as soil fertility and household capital, which are influenced

UNCCD 2nd Scientific Conference 2013 White Paper I
23
in turn by "fast variables", such as crop yields linked to strongly fluctuating precipitation, which may
lead to confusing conclusions about human-environment relationships.
3. Slow variables possess thresholds which, if crossed, cause the human-environment system to
move into new states, which often have different controlling processes, and thresholds may change
over time.
4. Coupled human-environment systems are hierarchical, nested and networked across multiple
scales, and involve multiple stakeholders, with highly differing objectives.
5. Retaining co-adaptation of human-environment systems depends on maintaining a body of up-
to-date hybrid environmental knowledge that combines local and science-based knowledge, so
maintaining and drawing on local environmental knowledge is crucial.
Converting these principles into an operational model will be very challenging and therefore take
time, because it requires major advances in interdisciplinary theory.
2.5.5 OPTIONS FOR INTEGRATED STATISTICS AND PLANNING METHODS The Parties to the UNCCD therefore have several options for designing new planning tools in which
desertification is incorporated and statistics based on measurable indicators of desertification and its
impacts are fully integrated, including:
1. A simple three-dimensional micro-economic framework, comprising income from land use
that is corrected for the direct and indirect environmental impacts on yields of desertification; social
impacts, e.g. on poverty, food security and health; and environmental impacts other than those
affecting yields.
2. A macro-economic framework, in which national income is corrected for resource depletion
and environmental degradation to give a Green Gross Domestic Product index. This could cover all
sectors of a national economy, or initially, to reduce the amount of data and computation required, it
could cover the agricultural sector to give a Green Agricultural Gross Domestic Product.
3. An extended ecosystem services framework, in which the four categories of ecosystem
services are the second tier of a conceptual framework whose first tier is provided by the
microeconomic framework, so provisioning services correspond to the economic dimension, and
regulating services and supporting services to the environmental dimension, while cultural services
contribute to the social dimension which is enhanced to include poverty, health and other key social
attributes. Each of the four categories could have benefits and costs elements to represent the
balance of positive and negative impacts of land-use change on an annual basis.
This chapter has shown that there is huge potential to incorporate economic and social impacts of
desertification into sustainable development monitoring and planning. At the moment this potential
is largely unrealized, but there is a good foundation on which to build in the future.

UNCCD 2nd Scientific Conference 2013 White Paper I
24
3. TOOL BOX OF PROBLEM-ORIENTED METHODOLOGIES
3.1 INTRODUCTION This chapter proposes an analytical framework and reviews available methodologies for the identification and measurement of the costs of DLDD. It discusses the potential role of economic valuation tools to improve the information available for decision makers to better inform resource management and land use decisions in the context of DLDD. The focus of this chapter is on land degradation as a reduction in the capacity of land to provide ecosystem goods and services over time (Global Land Degradation Information System – GLADIS).
3.2 DRIVERS OF DLDD The causes or drivers of DLDD have been identified as being of two types: proximate and underlying (Geist and Lambin, 2004). Proximate causes include biophysical factors (topography, climate conditions and change, natural hazards) and unsustainable land management practices. Underlying causes indirectly affect proximate causes, e.g., unsustainable land management practices are driven by land shortage, poverty, migration and economic pressures, which, in turn, have their own drivers. This chapter does not include tools and methodologies for identifying and analysing the drivers of DLDD, but these should be kept in mind in when identifying and measuring the consequences of DLDD which manifest themselves as costs (direct and indirect), in order to make more informed decisions.
3.3 ANALYTICAL FRAMEWORK In order to prioritize action against DLDD, it is essential to know the social and economic costs associated with DLDD (Nkonya et al. 2011). Costs may be on-site or off-site and are related to the location where the costs arise (on farm, within the watershed, globally) and whether they are considered by the person making the land use decision. Direct and indirect costs relate to the consequences of DLDD. A thorough assessment of the consequences of DLDD needs to look broadly at changes in ecosystem services, and use of the Total Economic Value (TEV) framework helps to formalize this. The TEV framework identifies the different types of values that are affected by DLDD, be they values associated with direct (fuelwood, animal fodder) or indirect use (soil fertility, drinking water) option values based on maintaining resources for future use or existence values (based on the utility people derive from knowing that particular species, habitats, landscapes continue to exist). Ecosystem services are the benefits that ecosystems provide to humans. Ecosystem services have been categorized by the Millennium Ecosystem Assessment (2005) as provisioning, supporting, regulating and cultural services (see also Section 2.5.3). The degradation of ecosystems reduces their ability to provide benefits, thus negatively affecting human welfare in a number of ways. Figure 3.1 illustrates how the different types of ecosystem services affect human well-being, how different types of value are affected and how economic valuation of ecosystem services can express the
economic significance of changes in the delivery of ecosystem services.
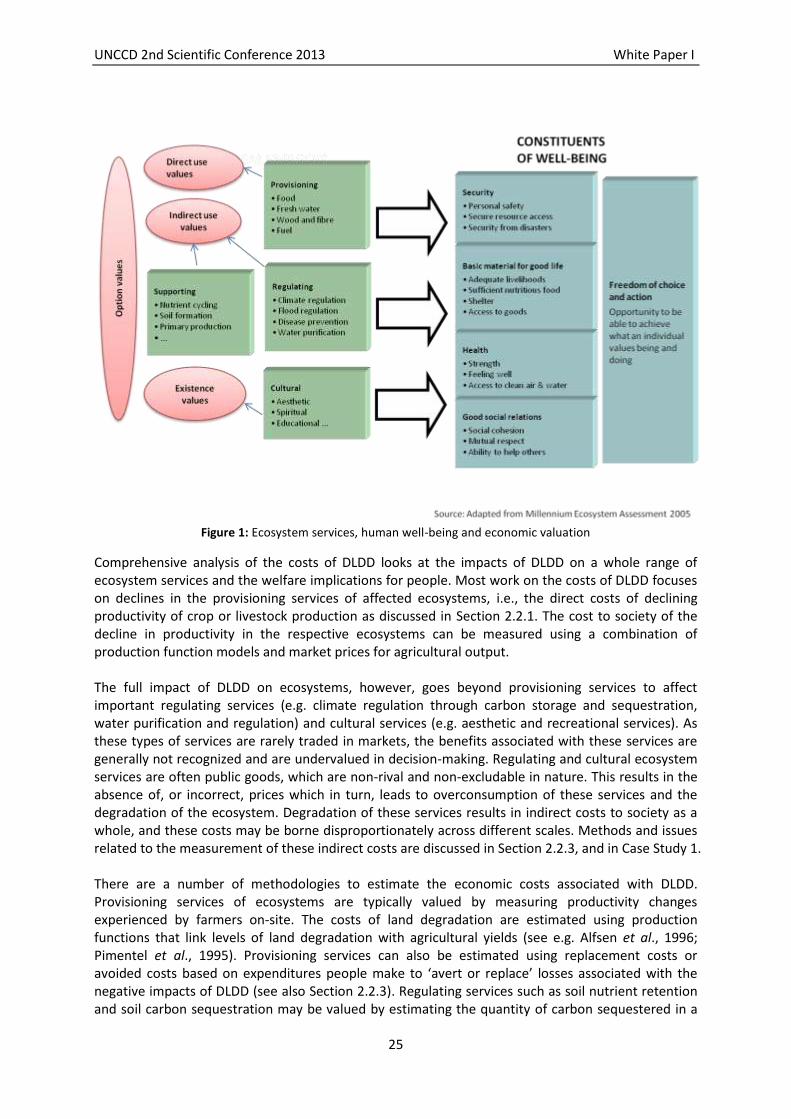
UNCCD 2nd Scientific Conference 2013 White Paper I
25
Figure 1: Ecosystem services, human well-being and economic valuation
Comprehensive analysis of the costs of DLDD looks at the impacts of DLDD on a whole range of ecosystem services and the welfare implications for people. Most work on the costs of DLDD focuses on declines in the provisioning services of affected ecosystems, i.e., the direct costs of declining productivity of crop or livestock production as discussed in Section 2.2.1. The cost to society of the decline in productivity in the respective ecosystems can be measured using a combination of production function models and market prices for agricultural output. The full impact of DLDD on ecosystems, however, goes beyond provisioning services to affect important regulating services (e.g. climate regulation through carbon storage and sequestration, water purification and regulation) and cultural services (e.g. aesthetic and recreational services). As these types of services are rarely traded in markets, the benefits associated with these services are generally not recognized and are undervalued in decision-making. Regulating and cultural ecosystem services are often public goods, which are non-rival and non-excludable in nature. This results in the absence of, or incorrect, prices which in turn, leads to overconsumption of these services and the degradation of the ecosystem. Degradation of these services results in indirect costs to society as a whole, and these costs may be borne disproportionately across different scales. Methods and issues related to the measurement of these indirect costs are discussed in Section 2.2.3, and in Case Study 1. There are a number of methodologies to estimate the economic costs associated with DLDD. Provisioning services of ecosystems are typically valued by measuring productivity changes experienced by farmers on-site. The costs of land degradation are estimated using production functions that link levels of land degradation with agricultural yields (see e.g. Alfsen et al., 1996; Pimentel et al., 1995). Provisioning services can also be estimated using replacement costs or avoided costs based on expenditures people make to ‘avert or replace’ losses associated with the negative impacts of DLDD (see also Section 2.2.3). Regulating services such as soil nutrient retention and soil carbon sequestration may be valued by estimating the quantity of carbon sequestered in a

UNCCD 2nd Scientific Conference 2013 White Paper I
26
particular area or nutrients retained by soil and by multiplying it by the market price for carbon and nutrients, provided that the analyst can estimate reliable biophysical cause-effects models (i.e. how changes in land use management affects regulating services) (see Stringer et al., 2012). Survey-based stated preference methods are increasingly being applied. Existence values and cultural services such as tourism can be estimated by constructing a hypothetical market in a stated preference study. Stated preference methods, such as choice experiments or contingent valuation, attempt to elicit willingness to pay (WTP) for an environmental improvement or willingness to accept (WTA) compensation for environmental degradation for a representative sample of the population affected. Methods for valuing the health effects from dust storms on malnutrition range from sophisticated calculations of Disability-Adjusted Life Years (DALYs) and Value of Statistical Life (VSL) to calculations of costs of illness, including costs of lost work days and medical expenses (WHO, 2009). Each of these approaches has both benefits and drawbacks. Table 3.1 presents a toolbox which provides a framework to link the drivers of DLDD with changes in the condition of ecosystems and the services they deliver. An assessment of the nature of the impact of DLDD, the scale (on site versus off site) and the associated costs (direct or indirect) are outlined. Finally, some methodologies to estimate the cost associated with particular types of impacts are presented. This tool-box is not meant to be comprehensive, but simply attempts to illustrate the need to link drivers with impacts and, where appropriate, to express impacts in monetary terms in order to more effectively inform decision-making.

UNCCD 2nd Scientific Conference 2013 White Paper I
27
Table 6: Measuring costs of DLDD
Causes of DLDD
Underlying (U) / Proximate (P)*
Ecosystem service affected
Scale Impacts direct (D)/ indirect costs (I)
Valuation methodology
Topography (P)
Land Cover (P)
Climate (P)
Soil erodability (P)
Invasive alien species & pests (P)
Unsustainable Land Management (P)
Infrastructure development (P)
Population density (U)
Institutions and land tenure (U)
Access to agricultural extension services (U)
Poverty (U)
Decentralization (U)
Non-farm employment opportunities (U)
International policies (U)
Productivity of farming
On-site
Loss of agricultural yield D Production function based approaches
Soil nutrient depletion due to erosion D/I Replacement costs of inputs such as fertilizers
Malnutrition D Disability Adjusted Life Year (DALY)
Salinity D Avoided cost of desalination
Livestock farming / Pastoralism
On-site Loss of milk, meat and hides D Productivity function based approaches
Water quantity & water quality
On-site / off site
Flash floods D Avoided damage costs
Declining fish populations D/I Production function
Health D/I Disability Adjusted Life Year
Health treatment expenditure
Siltation of rivers and reservoirs D/I Replacement cost (Dredging cost of reservoirs)
Value of reduced hydropower production Value of reduced irrigation
Aquifer depletion D Replacement cost (increased pumping costs or drilling a deeper replacement pump)
Embedded time (opportunity cost of additional time spent to collect water)
Dust storms
On-site / offsite
Health I Disability adjusted life year
Health treatment expenditure
Discomfort D Expenditure on averting behaviour / damage mitigation
Reduced labor productivity D/I Value of reduced output
Biodiversity On-site
Decrease in wild food availability D Opportunity cost of additional time spent ‘gathering, hunting or fishing’
Substitute goods values
Loss of emblematic species D Stated preference methods

UNCCD 2nd Scientific Conference 2013 White Paper I
28
Loss of genetic resources I Stated preference methods
Carbon storage and sequestration
On-site Reduced climate mitigation I Market prices for CO2e
Eco-tourism and recreation
On-site
Decrease in visitor numbers
D Stated Preference
Travel Cost
Hedonic pricing (hotels)

UNCCD 2nd Scientific Conference 2013 White Paper I
29
3.4 METHODOLOGIES It is beyond the scope of this section to describe in detail economic valuation methodologies to estimate the costs of DLDD, but a short summary of key features is shown in Table 3.2 (TEEB 2010). Table 7: Comparison of valuation methods (TEEB, 2010)
Group Methods Summary Statistical
analysis?
Which services
valued?
1. Direct market
prices
Market prices
Observe market prices
Simple
Provisioning services
2. Market alternative
i. Replacement costs
Finding a man-made solution as an alternative to the ecosystem service
Simple Pollination, water purification
ii. Damage cost avoided
How much spending was avoided because of the ecosystem service provided?
Simple Damage mitigation, carbon sequestration
iii. Production function
How much is the value-added by the ecosystem service based on its input to production processes?
Complex Water purification, freshwater availability, provisioning services
3. Surrogate markets
i. Hedonic Price Method
Consider housing market and the extra amount paid for higher environmental quality
Very complex Use values only, recreation and leisure, air quality
ii. Travel Cost Method
Cost of visiting a site: travel costs (fares, car use etc.) and also value of leisure time expended
Complex Use values only, recreation and leisure
4. Stated preference
i. Contingent valuation method
How much is the survey respondent willing-to-pay to have more of a particular ecosystem service?
Complex All services
ii. Choice experiments
Given a ‘menu’ of options with differing levels of ecosystem services and differing costs, which is preferred?
Very complex All services
5. Benefits transfer
Benefits transfer (mean value, adjusted mean value, benefit function)
‘Borrowing’ or transferring a value from an existing study to provide a ballpark estimate for current decision
Can be simple, can be complex
Whatever services were valued in the original study
Source: TEEB (2010).
UNCCD 2nd Scientific Conference 2013 White Paper I
30
3.5 COST-BENEFIT ANALYSIS FOR DECISION-MAKING Estimating the costs of DLDD provides information to help decision makers better select actions and policies to tackle either the drivers or the consequences of DLDD. The costs of DLDD at different scales may be integrated into a cost benefit analysis framework to assess the net costs to society of not taking action to halt DLDD or the net benefits to society of making investments to halt or slow DLDD. Cost benefit analysis allows the systematic comparison of the cost and benefits of inaction (baseline) compared to those associated with alternative land management regimes or practices. For example, analysis of the full range of ecosystem services managed by pastoralists in dryland systems has shown that drylands produce goods and services of many types. Some services support livestock production (forage, water), some of which is consumed directly (milk, meat, hides), and some of which is sold in markets for urban consumption. The value of these services has been estimated at USD 9-80/ha. Other dryland goods and services include building material, medicines, food and fuelwood with economic value of between USD 30-130/ha. There are also significant values associated with carbon stored (USD700-4,200/ha) and sequestered (USD5-25/ha/yr) in these drylands. Wildlife diversity and habitat may be of global economic importance and may allow the development of local eco-tourism (Niemi et al., 2010). All of these ecosystem services should be taken into account when making land use decisions. The application of the TEV framework, economic valuation of changes to ecosystem services and the integration of these values into social cost benefit analysis provides decision makers with a more sound basis for making land use decisions relative to simply looking at the direct costs of DLDD. Moreover, cost-benefit analysis should include the identification of how the costs associated with DLDD and the benefits of sustainable land management are distributed across stakeholders, focusing on those groups with a greater reliance on ecosystems and poor and vulnerable households. Distributional analysis can inform decisions around land use to ensure policies and land management practices selected are both equitable and efficient from the perspective of society. If there are trade-offs to be made, as often is the case, decision makers will have information available to help them to prioritize objectives in a transparent manner.

UNCCD 2nd Scientific Conference 2013 White Paper I
31
4. POLICIES AND STRATEGIES
4.1 INTRODUCTION Effective policies and strategies are essential to guide the implementation of the UNCCD, including the mitigation of DLDD. The National Action Programmes (NAPs), developed by affected country Parties as required under Article 10 of the UNCCD, largely perform this role. The NAPs, if properly prepared based on the guidance of the UNCCD, can be a useful policy and strategic tool for addressing DLDD in affected country Parties (Stringer et al., 2010). This section discusses the elements that need to be considered for such effective policies and strategies at the national, regional and global levels.
4.2 EFFECTIVE POLICIES THAT INCLUDE DIRECT AND INDIRECT COSTS Effective policies are a pre-requisite for ensuring the implementation of the UNCCD, including the mitigation of DLDD. These include policies for sustainable land, forest, water, and biodiversity management, developed as part of an overall national policy framework to improve land management and promote sustainable development. The policies must be based on the best available scientific and economic knowledge relevant to the local, national and regional conditions and circumstances. Thus, it is important for affected country Parties to invest more in scientific research on DLDD in order to improve their capability to develop effective policies. In addition, attention needs to be paid to the science-policy interface and the structures and processes through which scientific knowledge reaches policy makers.
As a specific tool to implement the objectives of the UNCCD, NAPs have the advantage of reflecting
the cross-cutting nature of DLDD at the national level - across economic sectors, administrative
borders, and to identify local hotspots. NAPs can present the strategy for DLDD prevention and
mitigation and provide an outline of past and future actions, identified through a participatory
process (Stringer et al., 2007). A NAP should present the most appropriate strategic approach to its
implementation: sectoral versus integrated; top-down or bottom-up; driven at the national or
regional level, depending on the particular circumstances of the country. The NAP process should
also act as an integrated framework, conceptualized to promote the most cost-effective ways for
mitigating DLDD as a key priority, whilst facilitating integrated social development. The focus should
be on decision-making and ownership of the implementation process at a decentralized and local
level. In particular, the NAP must include an estimate of the direct and indirect social, economic, and,
to the extent possible, environmental costs of DLDD where appropriate based on scientifically robust
methodologies. It should facilitate the development of the most cost-effective measures for
mitigating DLDD, within the context of an individual country’s unique circumstances. Many
developing country Parties are in the process of updating and aligning their NAPs with The Strategy,
which provides an opportunity to incorporate the direct and indirect costs of social, economic and
environmental parameters into the costing equation. Some of these costs may be transboundary
(e.g., linked to mitigation and prevention of dust and sandstorms in North-East Asia). Transboundary
issues are better addressed in Regional Action Programmes (RAPs).
Effective policies for mitigating DLDD must discuss the synergies between the UNCCD, UNFCCC and
CBD, so as to maximize the cost-effectiveness of response measures for the three Rio Conventions
(see also Chapter 5). They must also be based on the best interests of the local communities who rely
on land, forest, water and other natural resources for ecosystem services and their livelihoods. A
community-based integrated ecosystem management approach, which takes into consideration the
UNCCD 2nd Scientific Conference 2013 White Paper I
32
impacts of climate change, will provide a sustainable pathway for mitigating DLDD and for enhancing
sustainable development and, importantly, poverty alleviation (Williamson et al., 2003)
The effectiveness of policies and strategies in the short, medium or long term has to be measured
through monitoring their progress, so it is vital to clearly define all parameters, quantitative
benchmarks and indicators, supported by commonly agreed methodologies and guidelines for
impact assessment (Briassoulis, 2005). Effective polices will then form the basis for developing
comprehensive strategies that provide a road map for the implementation of the UNCCD, including
the mitigation of DLDD within the context of the NAP aligned with The Strategy.
4.3 STRATEGY FOR DECISION MAKERS TO TAKE NATIONAL APPROACHES TO
REGIONAL AND GLOBAL LEVELS After a decade of implementation, it is recognized that limiting factors have prevented optimal deployment of the UNCCD. Chief among these factors have been insufficient financing (both in general, and in comparison with its two Rio sister conventions), a weak scientific basis, insufficient advocacy and awareness among various constituencies, inadequate legal basis at national level, institutional weaknesses and difficulties in reaching consensus among Parties (Bauer and Stringer, 2009; Grainger, 2009). The UNCCD operates today in an environment that has evolved considerably since the time it was first negotiated. It faces different opportunities and constraints which affect its ability to achieve its objectives. These factors have influenced the national approaches developed to solve local and national problems and to take national issues to the regional and global levels (Berry et al., 2003). They are shaped by the ultimate aim to forge a global partnership to reverse and prevent desertification/land degradation and to mitigate the effects of drought and to achieve environmental, social and economic sustainability. The development and implementation of cost-effective national and regional policies, programmes and strategies, is to prevent, control and reverse desertification/land degradation and mitigate the effects of drought through scientific and technological expertise, public awareness, standard setting, advocacy and resource mobilization, and thereby contribute to sustainable development and poverty reduction (Nkonya et al., 2011).
4.4 CURRENT POLICY AND STRATEGIC ENVIRONMENT The global policy environment has progressed considerably since the UNCED Conference of 1992, and countries have access to a range of guideline materials to prepare their methodological approach to prevent, control and reverse desertification/land degradation and mitigate the effects of drought. These include the Millennium Development Goals, the outcomes of the World Summit on Sustainable Development 2002, and climate change mitigation and adaptation measures (Beddington et al, 2012). The scientific environment has produced new guidelines from the work of the Millennium Assessment (MA) on dryland ecosystems, which has contributed to an improved understanding of the biophysical and socio-economic trends relating to land degradation in global drylands, and their impacts on human and ecosystem well-being. The Millennium Ecosystem Assessment (MEA) (2005) has significantly contributed to mapping out gaps in data and knowledge on dryland ecosystems and people. The financing environment has also changed significantly in the last decade (Akhtar-Schuster et al., 2011). In addition to the UNCCD’s own resourcing subsidiary body, the Global Mechanism (GM), the Global Environment Facility (GEF) has become a financial mechanism of the UNCCD. However, financial resources need to be drastically increased through the GM and the GEF processes as well as through other innovative instruments such as payments for environmental services in order to address DLDD. Currently, country Parties can draw on the opportunities and frameworks provided by the current policy and strategic environment to address some of the UNCCD’s key challenges, and to capitalize

UNCCD 2nd Scientific Conference 2013 White Paper I
33
on its strengths. In doing so, there is a need to actively seize opportunities provided by the new policy and financing environment, and to create a new, revitalized common ground for all UNCCD stakeholders (MEA, 2005; UNCCD, 2011).
4.5 GLOBAL, REGIONAL AND NATIONAL STRATEGIC ENVIRONMENT There is a need to identify the major aspects of desertification/land degradation arising in the different eco-geographical zones and to measure their severity in order to find appropriate solutions to protecting threatened ecosystems and eradicating poverty. To achieve this goal, countries have been urged to develop an enabling environment for sustainable land management and integrated water management. This process should include economic measures, be in accordance with international law, and coordinate sectoral policies consistent with national policies. The funding support provided by the GM should be increased to play a more active role in mobilizing resources and maintaining a geographical balance so that countries with less capacity are able to benefit from the resources.1 Individual countries should focus on their NAPs and in this regard The Strategy is advocated as a guideline for decision makers to develop national methodologies and approaches to prevent, control and reverse desertification/land degradation and mitigate the effects of drought.2 Global level: Effort should be increased in the implementation of The Strategy and more resources are required to enable affected country Parties, especially developing countries, to implement their obligations under the UNCCD. National decision makers have the primary responsibility to deliver the objectives of the UNCCD and its implementing strategies, according to national priorities and in a spirit of international solidarity and partnership. If increased financial and non-financial resources can be provided, they can align their NAPs and other relevant implementation activities relating to the UNCCD with The Strategy and mainstream its five operational objectives into national planning considerations. The GM promotes actions that lead to the mobilization of international and national resources needed by affected country Parties to enhance the implementation of the UNCCD through The Strategy, while also maintaining a geographical balance so that countries with less capacity can benefit from new and emerging international and national resources. Regional cooperation: This is an important component as successful implementation and coordination mechanisms must respond to existing and emerging needs, capacities and the specific issues of each region. It is the responsibility of each region to develop mechanisms to facilitate regional coordination of the implementation of the UNCCD, taking into account existing regional coordination activities, tools, funding and institutional arrangements, as well as financial and non-financial resources required. The functions, output and reporting arrangements of regional cooperation should be clearly defined in terms of implementing the UNCCD and delivering The Strategy. In this regard, the Parties and the Regional Implementation Annexes should develop nationally and regionally relevant indicators. For decision makers to take their national approaches to regional and global levels, sound investment in sustainable agricultural practices, including strengthening of national policies and measures, as well as human and institutional capacity at all levels, will be required. National frameworks that promote access to food and water for affected populations should be assisted by international support (UNCCD, 2008). National and local levels: Decision makers have the responsibility to ensure participation and provide full ownership to local and primary affected communities, while mobilizing access to resources from relevant institutions and organizations. The focus should be on both financial and non-financial resources, including payment for ecosystem services, and ensuring full rights and
1UNCCD ICCD/COP(8)/16/Add.1, 23 October 2007, Decision 1/COP.8 Strengthening the implementation of the Convention
in all regions.
2 UNCCD ICC/COP(8)/16/Add.1, 23 October 2007, Decision 3/COP.8

UNCCD 2nd Scientific Conference 2013 White Paper I
34
benefits from traditional knowledge, and providing effective conflict resolution procedures concerning access to resources. The implementation procedure for the UNCCD should provide for the ongoing assessment of the progress of implementation using monitoring and reporting techniques which employ quantitative benchmarks and indicators (Huber et al., 2001).
4.6 STRATEGIC AND OPERATIONAL OBJECTIVES The “strategic objectives” of The Strategy provide a guide for the actions of all UNCCD stakeholders and partners over the period 2008–2018. By building these strategic objectives into national methodologies, individual countries can improve the living conditions of affected populations, improve the condition of affected ecosystems, and thus generate global benefits through more effective implementation of the UNCCD. They also provide a means to mobilize resources to support implementation of the UNCCD through building effective partnerships between national and international actors. The “operational objectives” of The Strategy provide a comprehensive guideline for UNCCD stakeholders to achieve the strategic objectives of The Strategy. Raising awareness and education: National methodologies should influence international, national and local processes to adequately understand and address the DLDD issues. The national methodologies should provide the mechanism to monitor, assess and communicate DLDD issues and the synergies to address climate change adaptation/mitigation and biodiversity conservation. Provision must be made to address DLDD issues relevant to international forums, including those pertaining to agricultural trade, climate change mitigation and adaptation, biodiversity conservation and sustainable use, rural development, sustainable development and poverty reduction. Raising awareness and education should have particular inputs at local community level, in terms of improved and innovative use of natural resources as subjects/recipients of technology transfer, as well as providing the space for local and indigenous techniques that address DLDD to be evaluated and up-scaled. Civil society organizations and the scientific community must be increasingly engaged as stakeholders in the UNCCD processes. Part of solving DLDD problems is planning effectively through joint effort -understanding each other’s problems, generating options for response, evaluating those options meaningfully, and choosing a roadmap through the NAP process for action. Over the past few decades a wide array of trends has expanded the scope, participation requirements, and potential of planning (Martin and Verbeek, 2006). Policy framework: National methodologies must provide the policy framework to support the creation of enabling environments for promoting solutions to combat DLDD. This should include policies to assess the institutional, financial and socio-economic drivers of desertification/land degradation and the barriers to sustainable land management, and measures to remove these barriers (Akhtar-Schuster et al., 2011). Within the policy framework, affected country Parties can revise their NAPs into strategic documents supported by biophysical and socio-economic baseline information and include them in an integrated investment framework. The implementation of an integrated investment framework for Sustainable Land Management (SLM) – as called for by The Strategy – is to allocate adequate and predictable resource flows from traditional and emerging sources based on the common understanding of the importance of SLM for development and in poverty reduction. An integrated investment framework will build on the country’s UNCCD NAP and other relevant domestic programmes, which delineate the measures to be taken to combat DLDD. Anchored in the national institutional setting and relevant programme and budgetary cycles, the integrated investment framework will strive to overcome potential obstacles to resource identification, allocation and disbursement. NAPs can be either integrated with SLM and land degradation issues into development planning or based on relevant sectoral and investment plans and policies. For developed country Parties, they should mainstream UNCCD objectives and SLM interventions into their development cooperation programmes/projects in line with their support to national sectoral and investment plans. Mutually reinforcing measures such as improving vegetation

UNCCD 2nd Scientific Conference 2013 White Paper I
35
management to control land degradation and to increase soil carbon sequestration, and synergies among DLDD action programmes and biodiversity and climate change mitigation/adaptation should be introduced or strengthened to enhance the impact of interventions. Science, technology and knowledge: National methodologies must provide for monitoring and assessment of biophysical and socio-economic trends, as well as an understanding of the drivers for prevention, control and restoration of DLDD (Nkonya et al., 2011). A baseline of the most suitable data/indicators available on biophysical and socio-economic trends should be developed, based on commonly agreed and robust scientifically methodology and UNCCD reporting, and employing relevant scientific approaches. Indicators should be first of all country specific (for historical reasons), then harmonized regionally and globally as much as possible, possibly under agreed convergence plans. Acquiring knowledge on biophysical (i.e., soil, vegetation and land information) and socio-economic (i.e., costs and benefits) factors and on their interactions will enable better understanding of the drivers of effective decision-making, including knowledge of the interactions between climate change adaptation, drought mitigation and restoration of degraded land. An important aspect of the national methodologies should be effective knowledge-sharing systems, including traditional knowledge, and to support policy makers, by including the identification and sharing of best practices. These knowledge sharing systems would comprise a range of strategies and practices used in a natural resource management organization to identify, create, represent, distribute, and enable adoption of insights and experiences in different aspects of DLDD management. Such insights and experiences comprise knowledge, either embodied in individuals or embedded in respective organizations as DLDD management processes or practices. Capacity-building: National methodologies should identify capacity-building needs to prevent, control and reverse desertification/land degradation and mitigate the effects of drought. A continuous national capacity self-assessment framework would help with the development of action plans with the capacity at the individual, institutional and systemic levels to tackle DLDD issues at the national and local levels. This should particularly focus on the creation of time bound, result oriented structures, which in turn are based on dynamic and flexible institutional networks that have the advantage of high effectiveness, furnishing the resources needed and being inclusive of key stakeholders. Resources, including financing and technology transfer: National methodologies should provide for coordination of national, bilateral and multilateral financial and technological resources in order to increase their impact and effectiveness. Any possible impact on the rights and conservation of a local community’s traditional knowledge has to be the subject of transparent assessment and awareness. This should include development of an integrated investment framework to leverage national, bilateral and multilateral financial and non-financial resources for the purpose of increasing the effectiveness and impact of interventions, as well as financial mechanisms to support domestic initiatives to reverse and prevent desertification/land degradation and mitigate the effects of drought and to promote the UNCCD/SLM agenda. Other considerations include innovative sources of finance and financing mechanisms including: the private sector, market-based mechanisms, trade, foundations and civil society organizations, financing mechanisms for climate change adaptation and mitigation, biodiversity conservation and sustainable use and for hunger and poverty reduction.
4.7 LEGAL FRAMEWORK The approach to implement national policies and strategies to combat desertification/land degradation and mitigate the effects of drought should include a legal system that provides for the effective management of land, taking an ecosystem-based approach. The strategy can include either regulatory or non-regulatory elements or a combination of these. The preference in approach will vary between States according to the physical, sociological and economic characteristics but in

UNCCD 2nd Scientific Conference 2013 White Paper I
36
general should include elements concerning education, research, monitoring, financial support and public-private partnership mechanisms, community participation, development of ecologically sustainable land use standards and related good practice guidelines, incentive-based programmes, development of statutory plans, and land use agreements between the State and individuals (Hannam and Boer, 2002; RECIEL, 2003). At this stage, at the national level, only a few Parties have satisfactory legislation to address DLDD and substantial reform is needed (Du Qun and Hannam, 2011). The list of bottlenecks includes the preferred traditional sectoral approach to DLDD, including easier manipulation of individual issues (e.g. soil) and a lack of ability to implement synergetic actions at the decentralized level.
At the international level the UNCCD has many gaps and limitations for the protection and sustainable use of land and it lacks key elements to provide the effective ways to protect and manage the ecological aspects of land (e.g., ecologically-based guidelines to States for the preparation or revision of national legislation) (Hannam and Boer, 2004). The proposal for an international instrument for global land and soil degradation has received significant attention recently by the UNCCD Secretariat and is regarded as essential as part of the national, regional and international framework to combat desertification/land degradation and mitigate the effects of drought (Berlin, 2011; UNCCD Secretariat, 2008; UNCCD Secretariat, 2011; UNCCD Secretariat, 2012).

UNCCD 2nd Scientific Conference 2013 White Paper I
37
5. SYNERGIES BETWEEN UNCCD, UNFCCC AND CBD
5.1 INTRODUCTION The topics of the three Rio Conventions, UNCCD, UNFCCC and CBD, have become an integral part of the international environmental, developmental and political agenda. Countless initiatives have been launched and people all over the world have become conscious of global sustainability needs which address the ecological, economic and social significance of land, particularly its contribution to growth, food security and poverty eradication. The UNCCD came into force in 1994 and along with the UNFCCC and CBD it is one of the principal legally binding international agreements that links environment and development to sustainable land management (SLM). The UNCCD addresses specifically the arid, semi-arid and dry sub-humid areas of drylands, whose ecosystems are highly vulnerable to land degradation and societies susceptible to poverty. Twenty years on from the Earth Summit, in June 2012, the world gathered in Rio again for the United Nations Conference on Sustainable Development (UNCSD), also known as Rio+20. The Rio+20 outcome document “The Future We Want” recognizes “the importance of the three Rio Conventions to advancing sustainable development” and “urges all Parties to fully implement their commitments” under the Conventions “in accordance with their respective principles and provisions, as well as to take effective and concrete actions and measures at all levels, and to enhance international cooperation”. In The Strategy, Parties to the UNCCD provided specific goals, i.e., "to forge a global partnership to reverse and prevent desertification/land degradation and to mitigate the effects of drought in affected areas in order to support poverty reduction and environmental sustainability". The development of synergistic approaches together with the creation of an enabling policy and institutional environment is decisive for the strengthening of multilateral environmental agreements (MEAs), in particular if addressed issues are highly intertwined, as is the case with the three Rio Conventions (Akhtar-Schuster et al., 2011; Chasek et al., 2011). It is of utmost importance, however, that the developmental goals take the coupled human-environmental interactions, pressures and challenges into consideration, as they continue to expand and become more difficult to resolve. Continuing land degradation directly contributes to the ongoing loss in biodiversity and interacts with climate change in a complex manner (MEA, 2005; Thomas, 2008), which presents numerous potential areas for interactions in the implementation approaches of the three Conventions and their main environmental goals (Cowie et al., 2007; Cowie et al., 2011; Mouat et al., 2006; UNEMG, 2011). Synergy between the three Conventions is therefore vital when working on terrestrial ecosystems.
5.2 PRACTISING SYNERGY The importance of achieving synergy at international to local levels was generally recognized and already noted in various articles of the three Rio Conventions. There is no doubt that a concerted effort is required by all stakeholders to ensure these synergistic relationships are fully operationalized and that sharing of expertise and resources is needed. There is broad consensus among the Parties that the range of linkages between the interrelated environmental issues of climate change, biodiversity loss and land degradation require an integrated approach of stronger collaboration in order to (i) strengthen activities in a synergistic manner; (ii) reduce potential conflicts between independent activities of the Rio Conventions; (iii) avoid duplication of efforts; and (iv) use available resources more efficiently (UNFCCC Secretariat, 2004a). In addressing this necessity, a major development was the formation of the Joint Liaison Group (JLG) by the secretariats of the UNFCCC, CBD and UNCCD in 2001. This informal forum aimed at enhancing inter-conventional cooperation at national and international levels, exchanging information and identifying new opportunities for joint activities (CBD, undated; UNFCCC Secretariat, 2004a). Priority in concerted action was given to the issues of adaptation, capacity-building and

UNCCD 2nd Scientific Conference 2013 White Paper I
38
technology transfer as agreed on the JLG’s fifth meeting in Bonn in 2004 (UNFCCC Secretariat, 2004b). In general, options for building synergies among the three Rio Conventions in specific cross-cutting areas include capacity-building, technology transfer, research and monitoring (e.g., terrestrial features), information exchange and outreach, reporting, and financial resources (UNEMG, 2011; UNFCCC Secretariat, 2004a). In this respect, there are numerous collaborative efforts between the UNCCD and the other conventions aiming at achieving and implementing synergy for the benefit of the MEAs goals, including joint work programmes, country-driven initiatives and workshops (see also Chasek et al., 2011; UNEMG, 2011). The Subsidiary Bodies of the three Conventions, responsible for scientific and technological advice, such as Subsidiary Body for Scientific and Technical Advice (SBSTA) of the UNFCCC, Committee on Science and Technology (CST) of the UNCCD and Subsidiary Body for Scientific, Technical and Technological Advice (SBSTTA) of the CBD through their specific COPs, in cooperation with the JLG, will need to help with the implementation of the challenges mentioned in a synergistic way and ensure that they are based on good scientific and technological results and outputs. The Parties to the Conventions have agreed that synergy has to be promoted where it is most promising, i.e. at the national and local levels, and identified the ‘ecosystem approach’ (as defined in COP 5 decision V/6) as an important instrument to achieve an integrated and successful partnership between all stakeholders (UNFCCC Secretariat, 2003). The articulated need by country Parties for better integration and enhanced linking will be promoted by the National Action Programmes (NAPs) under the UNCCD and the National Adaptation Programmes of Action (NAPAs) under the UNFCCC (UNFCCC Secretariat, 2003). Indeed, research by Stringer et al. (2009) which examined NAPs and NAPAs in southern African countries observed that there were notable overlaps in these policies at the national level. NAPs and NAPAs will also provide an opportunity to establish comprehensive policy instruments and to develop overarching strategies for sustainable development by affected country Parties (UNFCCC Secretariat, 2004a). This issue of practising synergies at the national level formed the central topic of a regional workshop for NFPs in Africa organized by the CBD in close collaboration with the UNCCD and the Global Environment Facility (GEF) (CBD, 2004). More recently, The Strategy for the UNCCD called for partnership building in order to further the implementation of the convention (UNCCD, 2012). In this respect, the secretariats of the UNCCD and CBD agreed on a joint work plan 2011-2012 supporting the implementation of the new Strategic Plan for Biodiversity 2011-2020 and The Strategy for the UNCCD (CBD, 2011b). The latter includes aspects such as to improve the conditions of affected populations and ecosystems, address advocacy, awareness and education through science, technology and knowledge transfer and address capacity building needs. Thus, the CST and CRIC (Committee for the Review and Implementation of the Convention) of the UNCCD have a clear mandate to promote synergy at all levels, and should therefore play an active role in the implementation using an integrative approach between all Parties. Financing and socio-economic development are also main factors of the joint work plan. In collaboration with relevant international organizations, knowledge gaps would be identified, analyses refined and outcomes disseminated among the secretariats of the three Rio Conventions, as well as made openly available. Focal issues should include the links between biodiversity conservation and sustainable use, conservation and restoration of organic carbon stocks as well as ecosystem management measures. The joint work plan also envisages a cross-conventional collaboration via the JLG (CBD, 2011b). The UNCCD’s submission to the Preparatory Process for the Rio+20 Conference states, “If we do not take bold actions to protect, restore and manage land and soils sustainably, we will miss climate change adaptation and mitigation, biodiversity, forests and MDGs targets ... This will lead to consequences including more political conflicts over scarce resources and continued forced migrations.” (UNCCD Secretariat, 2012b). One of the key ways proposed to achieve this goal is
UNCCD 2nd Scientific Conference 2013 White Paper I
39
through achieving Zero Net Land Degradation (ZNLD), meaning the rate of land degradation is equal to the rate of land restoration (www.unccd.int, 2012). It recognizes that to achieve the objective of ZNLD will require a cooperative effort between the Rio Conventions. Although the Rio+20 meeting did not make a commitment to a specific ZNLD target, broad support was gained for the concept of ZNLD, with clear recognition of the benefits of the objectives and goal of ZNLD3. Following Rio+20, the UNCCD Secretariat is also promoting the benefits of a new legal instrument (such as a Protocol on ZNLD) to the Parties, and will assist with the implementation at regional and national levels. There was some support for this at Rio+20, but the UNCCD would now have to work with various partners (e.g. United Nations Educational, Scientific and Cultural Organisation (UNESCO), International Union for Conservation of Nature (IUCN) and Food and Agriculture Organisation (FAO)) in the promotion of the role and benefits of SLM for all stakeholders and areas. Multi-stakeholder and cross-sectoral well designed partnerships will recognize the potential in bringing diverse actors together and address complex social and environmental issues focusing on shared goals or purposes (Dyer et al, 2012). The UNCCD promotes a systemic shift towards a green economy, which is committed to set another milestone for the implementation of sustainable development, especially for the rural poor in affected countries. According to UNEP’s Green Economy Initiative (GEI) (UNEP, 2011), a green economy will contribute to improved human well-being and social equity, while significantly reducing environmental risks and ecological scarcities. The green economy strives to reduce carbon emissions and pollution, enhance energy and resource efficiency, and prevent the loss of biodiversity and ecosystem services through socially inclusive programmes. The GEI will be a joint effort by numerous experts from UN organizations, academic institutes, think tanks, businesses and environmental groups, as well as the private sector and other key financial institutions to ensure that more funds are spent to support projects, programmes, policies and other activities by the Conventions. Another resource promoting synergistic activities is the Green Climate Fund (GCF), established under the Cancun Agreements at COP 16 of the UNFCCC in 2010, and officially launched at COP 17. It aims at supporting projects, programmes, policies and other activities in developing countries related to mitigation, including REDD-plus (Reducing Emissions from Deforestation and Forest Degradation; and the role of conservation, sustainable management of forests and enhancement of forest carbon stocks in developing countries), adaptation, capacity-building, technology development and transfer. The projects developed for GCF may also be linked to the mitigation of DLDD (Low and Kim, 2012). The newly established Intergovernmental Platform on Biodiversity and Ecosystem Services (IPBES) on 21 April 2012 will also enhance the collaboration between the three Rio Conventions. IPBES will strengthen the science-policy interface by bridging the gap between researchers and decision makers. A key principle of IPBES is to address the challenge of creating synergies between existing MEAs through a clear statement of avoiding duplication and by building upon their constitutions and already achieved results. Thus, IPBES is expected to support the implementation of strategic plans of the three Rio Conventions (UNEMG, 2011; IPBES, 2012; UNCCD, 2012). IPBES, however, do not
3 Within Working Group I, the Chair Professor Pak Sum Low has initiated the discussion on the limits of ZNLD among
some members. He is of the view that if only ZNLD is to be achieved, then at best it will only maintain “a land degradation
neutral world”, and it will be impossible “to secure the continuing availability of productive land for present and future
generations”. He proposes a more positive and proactive concept of Net Restoration of Degraded Land (NRDL) (i.e. the rate
of land restoration is greater than the rate of land degradation), which provides a more progressive outlook and a more
practical measure to combat land degradation and desertification. Indeed, in China, targets have been set to restore a total of
100×104 km2 degraded land by 2050 (Wang et al., 2012), and thus NRDL rather than ZNLD will be a better indicator to
measure China’s achievements in combating land degradation and desertification.

UNCCD 2nd Scientific Conference 2013 White Paper I
40
generally correspond to gaps in research on DLDD, especially over the short- and medium term, as IPBES mainly focuses on biodiversity and ecosystem services. It is important to integrate and enhance the exchange of knowledge without duplication between the IPBES of the CBD, the IPCC of the UNFCCC, and scientific outputs regarding DLDD of the UNCCD.
5.3 FINANCIAL RESOURCES At COP 10 of the UNCCD, the Sustainable Land Management Business Forum was launched which emphasizes that effective partnerships both at national and international levels need to be mobilized to provide more financial resources. The SLM Business Forum will encourage the active involvement of the private sector in the protection of the land. The UNCCD Secretariat and the Deutsche Gesellschaft für Internationale Zusammenarbeit (GIZ) GmbH, on behalf of the German Federal Ministry for Economic Cooperation and Development (BMZ), have also commenced discussions and established Partnership Meetings on the Assessment of the Economics of Desertification, Land Degradation and Drought (E-DLDD)4. Economic assessments will help to facilitate policy priorities, raise investment and mobilize broad-based actions. Strong business foundations and networks should be established, especially with the private sector. These require a good communication strategy with specific targets and products. Financial institutions and the GEF are invited to provide ongoing technical and financial support for joint capacity-building initiatives (UNCCD, 2012). The GEF is a financial mechanism of the UNCCD, but it also provides financial resources to UNFCCC and CBD. For example, it funds the countries’ National Capacity Self Assessments (NCSAs), intended to assist countries in assessing capacity-building needs for the three Rio Conventions, and by this promote synergy in the implementation of these Conventions (UNFCCC Secretariat, undated). The funding provided by the GEF to SLM activities is far less than that provided to climate change and biodiversity activities. Of the US$4.25 billion available for GEF-5 (1 July 2010-30 June 2014), US$1.36 billion (or about 32%) is for climate change, US$1.21 billion (or about 28.47%) for biodiversity, and US$405 million (or about 9.53%) for land degradation. As 20% of the above allocations will be focal area set-asides, which include contributions to enabling activities, global and regional activities, and sustainable forest management (SFM), the resultant amounts available for national allocations under the System for a Transparent Allocation of Resources (STAR) are US$1,088 million for climate change, US$968 million for biodiversity, and US$324 million for land degradation (GEF, 2010a). Hence, compared with the actual needs of eligible countries, the amount of the above resources that need to be shared among 143 eligible counties is limited, especially for land degradation (GEF, 2010a; 2010b). One way to overcome this uneven distribution of the GEF resources is to maximize the synergies of climate change, biodiversity and land degradation by integrating the land degradation issues into the climate change and biodiversity projects (Low and Kim, 2012).
5.4 SHORTCOMINGS AND LESSONS LEARNED By holding national and local-level workshops treating the topic on practising synergy, various options and opportunities have been identified but also key problems highlighted (for an overview please refer to Mouat et al., 2006). Although the mission is to create relevant linkages to cross-cutting thematic areas and activities under the three Rio Conventions, (e.g. technology transfer,
4 At an E-DLDD workshop in December 2010 in Bonn, the valuation of land and land-based ecosystem services, and the
potential use of such valuation in supporting decision-making towards economically, environmentally and socially
sustainable development was discussed. It is clear that DLDD should focus on food security and rural development at
different scales and that new approaches including economic measurement, the costs of action versus inaction and the
assessment of implementation strategies by different institutional arrangements should be considered.

UNCCD 2nd Scientific Conference 2013 White Paper I
41
education and outreach, research and systematic observation, capacity-building, reporting, impacts and adaptation), there are still many shortcomings concerning the collaboration between the conventions, which impede synergistic effects. Mouat et al. (2006) state that “the complexities and challenges associated with the effective implementation of the various multilateral environmental agreements threaten to overwhelm the administrative structures and capacities of many countries”. Although it is widely recognized that efforts to further land issues like sustainable land management are of direct benefit for other Conventions, e.g. through mitigation of climate change (Cowie et al., 2007; Thomas, 2008) and ecosystem-based adaptation, the mainstreaming of environmental goals into national cross-sectoral policies and international negotiations is still highly unbalanced with land issues being less well considered (Akhtar-Schuster et al., 2011). According to Chasek et al. (2011), interactions between the MEAs are insufficient, especially between the UNCCD and the wider UN system. However, in its recent publication the United Nations Environment Management Group (UNEMG, 2011) presents a structured approach for mainstreaming the dryland issues in the context of The Strategy of the UNCCD through: “(i) strengthening the science-policy interface; (ii) advancing interlinkages and synergies in the implementation of the drylands agenda; (iii) identifying opportunities for integrated dryland targets into national development cooperation; and (iv) reviewing the effectiveness of achieving these targets”. In one of the priority settings of this UN-wide collaboration on drylands, the diversification of income and livelihoods could be promoted through synergies built between, among others, the UNCCD, UNFCCC and the CBD. Due to the close linkages between the issues tackled by the three Rio Conventions, measures of one party do not always benefit the others. Besides the potentials for synergies, there are likewise trade-offs, a circumstance that becomes occasionally a challenging task (Cowie et al., 2007; Cowie et al. 2011). In order to avoid conflicts among parties and involved stakeholders operating at different levels, an enabling institutional environment is needed to harmonize differences and meet the necessity of synergy (Akhtar-Schuster et al., 2011; Mouat et al., 2006). The JLG and joint financial initiatives may contribute to such an enabling environment assuring that joint activities and defined goals are realized. Guiding principles of the JLG include that activities will be country-driven and needs-based (CBD, undated), thus promoting in the first instance national and local level synergies. This requires a stronger collaboration among the NFPs that serve each of the Convention and play a key role in bridging differences of involved parties especially at the policy level, but this still requires improvements in their efficiency and effectiveness (Akhtar-Schuster et al., 2011; Mouat et al., 2006). In contrast to the international level, many joint activities fail in having a synergistic impact at the regional, national and local levels (UNEMG, 2011), which may arise from the fact that mostly representatives from the Secretariats are involved (Chasek et al., 2011) or that positive interactions are constrained by misconstruing synergy (Mouat et al., 2006). At least at the national level, the establishment of technical committees for the identification and implementation of synergies among the MEAs could contribute to increased efficiency and effectiveness (UNEMG, 2011). Another problem is that of a weak knowledge transfer between the MEAs, general inaccessibility of reports and related duplicative outputs. The overall effectiveness can be enhanced if the scientific bodies of the MEAs would have a central depository or less restricted channels for scientific knowledge sharing (Chasek et al., 2011; Mouat et al., 2006; UNEMG, 2011). An improvement of synergies in reporting could be realized by formalizing information-sharing processes and building institutional linkages, as noted by the COP 10 (UNCCD, 2012). The Joint Working Plan 2011-2012 between the CBD and UNCCD addresses this issue by employing a “clearinghouse mechanism” and making results available to Parties (CBD, 2011b). In general, the JLG could take a leading role as an information sharing clearing house across the Rio Conventions (UNFCCC Secretariat, 2006). Not least, harnessing such synergies could yield economic savings for Parties to all three agreements.

UNCCD 2nd Scientific Conference 2013 White Paper I
42

UNCCD 2nd Scientific Conference 2013 White Paper I
43
6. CONCLUSIONS AND POLICY RECOMMENDATIONS
6.1 CONCLUSIONS (i) Estimates of the economic costs of DLDD are most useful in supporting the decisions of individual land users who incur them. Aggregated national or global values merely show governments the costs which society as a whole has to bear. (ii) Estimates of the direct economic costs of desertification vary greatly as a proportion of agricultural GDP. The accuracy of estimates will not improve until there is far better biophysical monitoring of the extent and rate of change of desertification. (iii) Estimating the indirect environmental costs of desertification has received much less attention. One study in the USA indicates that indirect costs are two thirds of direct costs, but this could be an underestimate, since valuation of ecosystem services is still embryonic, and indirect costs vary with the different circumstances of different countries. (iv) The most important use of the economic and social costs of desertification, both for academics and policy makers, appears to be as part of well-structured models which can test alternative policy options. Integrating desertification far more into national statistics and planning methods could help to increase the accuracy of estimates of the economic and social costs of desertification because it would raise demand for these estimates. (v) Remarkably little research has been published in peer-reviewed academic journals on the economics of desertification, or of land degradation in general, and economic models are still embryonic. Economists could do a great service to policy makers by devoting more attention to constructing and testing such models.
(vi) Research into entitlements, environmental justice and vulnerability suggests that tackling
desertification is not just about adopting physical remedies, such as more "sustainable land
management", even though the latter is important. Social remedies are required too, and this means
that economic impacts and social impacts need to be tackled collectively in an integrated manner,
rather than separately.
(vii) It is crucial to understand the institutional settings in which land users make decisions that
may lead to, or avoid, desertification. Government policies, e.g. on subsidizing fertilizer use and food
prices, may unintentionally exacerbate land users’ decisions. The rate of desertification could be
reduced if: government policies were evaluated beforehand to check for unintended consequences;
societal institutions were audited to check for constraints that lead to poor people degrading land
instead of managing it sustainably; and an integrated approach was taken to national land-use
planning and government policies.
(viii) Existing methodologies and tools need to be further improved for the identification and measurement of the costs of DLDD, including the cost of action versus inaction. A thorough assessment needs to capture all changes in ecosystem services and ecosystem service delivery, and knowledge gaps exist. The measurement of the social costs of DLDD is not a simple process, as it requires information about the physical, social and economic effects and their distribution across society and over time. The application of the TEV framework, economic valuation of changes to ecosystem services and the integration of these values into social cost benefit analysis provide

UNCCD 2nd Scientific Conference 2013 White Paper I
44
decision makers with a sounder basis for making land use decisions relative to simply looking at the direct costs of DLDD. (ix) Effective policies and strategies are needed for land, forest, water and other natural resources management, developed as part of an overall national policy framework to improve land management and promote sustainable development. These policies must be based on the best available knowledge and science relevant to the local, national and regional conditions and circumstances. (x) More investment in scientific research on DLDD is needed in order to formulate more effective policies. This would be facilitated by improving the science-policy interface, and the structures and processes through which scientific knowledge - and particularly in this case the findings of economics research - reaches policy makers. (xi) Regional cooperation is an important component for successful implementation and coordination mechanisms must respond to existing and emerging needs, capacities and the specific issues of each region. At the national and local levels, decision makers should also have responsibility to ensure participation and provide full ownership to local and primary affected communities, while mobilizing access to resources from relevant institutions and organizations. (xii) Due to the interlinkages between land degradation, climate change and biodiversity, the development of synergistic approaches together with the creation of an enabling policy and institutional environment is important for the strengthening of the three Rio Conventions (UNCCD, UNFCCC and CBD). Areas for building synergies include capacity-building, technology transfer, research and monitoring, information exchange and outreach, reporting and financial resources. However, many shortcomings remain concerning the collaboration between the conventions. At the country level, the National Focal Point (NFP) of each of the Convention should play a more active, efficient and effective role in bringing synergies and bridging differences of involved parties at both technical and policy levels. (xiii) Adequate financial resources are required to develop and implement effective policies for addressing DLDD, and thus more financial resources should be provided by the financial mechanisms of the UNCCD (GM and the GEF) to assist developing country Parties. However, compared to the funding provided for climate change and biodiversity, which accounts 32% and 28.47% of the GEF-5 resources (1 July 2010-30 June 2014) respectively, the funding provided for SLM focal area accounts for about 9.53%.
6.2 POLICY RECOMMENDATIONS (i) Governments would benefit from integrating the economic, social and environmental costs of DLDD in national environmental accounts with the benefits from land use that generate these costs. This could support integrated land-use planning and monitoring of the sustainability of national development.
(ii) It is not possible to make accurate estimates of the economic, social and environmental costs of DLDD without reliable spatial information on the extent and degree of desertification and its rate of change. Better national and global monitoring of desertification is essential to improve the accuracy of estimates of these costs.
(iii) Economic impacts and social impacts need to be tackled collectively in an integrated manner,
rather than separately, if policies for addressing DLDD are to be effective.

UNCCD 2nd Scientific Conference 2013 White Paper I
45
(iv) Governments should check their policies for unintended consequences; societal
institutions need to be audited to check for constraints that lead to poor people degrading land
instead of managing it sustainably; and an integrated approach should be adopted to national land-
use planning and government policies.
(v) The CST, supported by the UNCCD Secretariat, could sponsor a workshop organized by the Economics of Land Degradation initiative that would enable a group of leading economists to catalyse the development of a new family of economic models of DLDD with policy applications. This will benefit governments and could have a snowball effect on economics research in this neglected area. (vi) The approach to implement national policies and strategies to combat DLDD should include a legal system that provides for the effective management of land, taking an ecosystem-based approach. At the international level the UNCCD has many gaps and limitations for the protection and sustainable use of land and it lacks key elements to provide the effective ways to protect and manage the ecological aspects of land. The proposal for an international instrument for global land and soil degradation, which has received significant attention recently by the UNCCD, is essential as part of the national, regional and international framework for addressing DLDD. (vii) The Parties may wish to request both the GM and the GEF to raise their levels of technical and financial support for eligible developing country Parties for the implementation of the UNCCD and for addressing DLDD, including the estimation of social and economic impacts of DLDD where appropriate.

UNCCD 2nd Scientific Conference 2013 White Paper I
46
REFERENCES
Adhikari B. and Nadella K. (2011) Ecological economics of soil erosion: a review of the current state
of knowledge. Annals of the New York Academy of Sciences 1219: 134-152.
Akhtar-Schuster M.; Thomas R.J., Stringer L.C.; Chasek P., Seely M.K. (2011) Improving the enabling
environment to combat land degradation: institutional, financial, legal and science-policy
challenges and solutions. Land Degradation and Development 22: 299-312. doi: 10.1002/ldr.1058
Alfsen K.H., De Franco M.A., Glomsrød S., Johnsen T. (1996) The cost of soil erosion in Nicaragua.
Ecological Economics 16(2): 129–45.
ARPU (1989) Agro-climatic regional planning: An overview. Agro-Climatic Regional Planning Unit,
New Delhi.
Atis E. (2006) Economic impacts on cotton production due to land degradation in the Gediz Delta,
Turkey. Land Use Policy 23: 181-186.
Barbier E.B. (1992) Rehabilitating gum arabic systems in Sudan: economic and environmental
implications. Environmental and Resource Economics 2: 341-358.
Barbier E.B. (1997) The economic determinants of land degradation in developing countries.
Philosophical Transactions Royal Society (London) B 352: 891-899.
Barbier E.B. (1998) The economics of environment and development. In Barbier E.B. (ed.) The
Economics of Environment and Development: Selected Essays , 281–307. Edward Elgar, Cheltenham,
UK.
Barbier E.B. and Burgess J.C. (1992) Malawi - land degradation in agriculture. Environment
Department, Divisional Working Paper No. 1992-37. World Bank, Washington DC.
Barbier E.B. and Thompson J.R. (1998) The value of water: floodplain versus large-scale irrigation
benefits in northern Nigeria. Ambio 27: 434-440.
Barbier E.B., and Bishop J.T. (1995) Economic values and incentives affecting soil and water
conservation in developing countries. Journal of Soil and Water Conservation 50:133-137.
Bauer S., Stringer L.C. (2009) The role of science in the global governance of desertification. The
Journal of Environment and Development 18(3): 248-267.
Beddington J., Asaduzzaman M., Clark M., Fernandez A., Guillou M., Jahn M., Erda L., Mamo T., Van
Bo N., Nobre C.A., Scholes R., Sharma R., Wakhungu J. (2012) Achieving food security in the face
of climate change: Final report from the Commission on Sustainable Agriculture and Climate
Change. CGIAR Research Program on Climate Change, Agriculture and Food Security (CCAFS).
Copenhagen, Denmark. Available online at: www.ccafs.cgiar.org/commission.
Berlin (Common Statement, Protecting Soils for our Common Future. The Berlin Call for Action).
(2011). German Federal Environment Agency.

UNCCD 2nd Scientific Conference 2013 White Paper I
47
Berry L., Abraham E. and Essahli W. (2009) UNCCD Recommended Minimum Set of Impact Indicators.
Consultancy report, 4 June 2009. UN Convention to Combat Desertification, Bonn.
Berry, L, Olson, J. and Campbell, D. (2003) Assessing the Extent, Cost and Impact of Land Degradation
at the National Level: Findings and Lessons Learned from Seven Pilot Case Studies, Commissioned
by Global Mechanism with support from the World Bank.
Bishop J.T. and Allen J. (1989) The On-site Costs of Soil Erosion in Mali. Environment Department
Working Paper No. 21, World Bank, Washington, DC.
Bojö J., 1991. Economics and land degradation. Ambio 20: 75-79.
Bojö J. (1996) The costs of land degradation in Sub-Saharan Africa. Ecological Economics16: 161-173.
BojöJ. and Cassells D. (1995) Land degradation and rehabilitation in Ethiopia: a reassessment. AFTES
Working Paper No. 17. World Bank, Washington DC.
Bollig, M., Schulte, A. (1999) Environmental change and pastoral perceptions: degradation and
indigenous knowledge in two African pastoral communities. Human Ecology 27: 493: 514.
Bradley D. and Grainger A. (2004) Social resilience as a controlling influence on desertification in
Senegal. Land Degradation and Development 15: 451-470.
Briassoulis, H. 2005. (Ed) Policy Integration for Complex Environmental Problems; The Example of
Mediterranean Desertification, London, Ashgate.
Burt, O. (198)Farm-level economics of soil-conservation in the Palouse area of theNorthwest.
American Journal of Agricultural Economics 63(1): 83–92.
CBD (2004) Regional workshop for Africa on synergy among the Rio Conventions and other
biodiversity related conventions in implementing the programmes of work on dry and sub-humid
lands and agricultural biodiversity. Report of the regional workshop. Gaborone, 13-17 September
2004. UNEP/CBD/WS-Syn.Afr/1/6. Available at: http://www.cbd.int/doc/meetings/agr/wsagdl-
01/official/wsagdl-01-06-en.pdf (Accessed 5 May 2012).
CBD (2011a) Eleventh meeting of the Joint Liaison Group of the Rio Conventions. Bonn, 11 April
2011. Available at: http://www.cbd.int/doc/reports/jlg-11-report-en.pdf (Accessed 4 May 2012).
CBD (2011b) Memorandum of Understanding between the Convention on Biological Diversity and
the United Conventions to Combat Desertification regarding the Joint Work Plan 2011-2012.
Available at: http://www.cbd.int/doc/agreements/agmt-unccd-2011-09-03-mou-web-en.pdf
(Accessed 3 May 2012).
CBD (undated) Proposed Terms of Reference and Modus Operandi for the Joint Liaison Group
between the three Rio Conventions. Available at: http://www.cbd.int/cooperation/doc/jlg-
modus-operandi-en.pdf (Accessed 3 May 2012).
Chasek, P., Essahli, W., Akhtar-Schuster, M., Stringer, L.C., Thomas, R. (2011) Integrated land
degradationmonitoring and assessment: horizontal knowledgemanagement at the national and
international levels. Land Degradation & Development 22: 272-284.

UNCCD 2nd Scientific Conference 2013 White Paper I
48
Cheng Leilei, Cui Xiang Hui, Gong Liyan and Lu Qi (2012) Case Study 1: Methodologies of China
Desertification Costs Estimation. Institute of Desertification Studies, Chinese Academy of Forestry,
Beijing.
Clark E. H. (1985) The off-site costs of soil erosion. Journal of Soil and Water Conservation 40: 19–22.
Clark R. (1996) Methodologies for the economic analysis of soil erosion and conservation.Centre for
Social and Economic Research on the Global Environment Working Paper, Global Export Control
No. 96-13. University of East Anglia, Norwich, UK.
Cleaver K.M. and Schreiber G.A. (1994) Reversing the spiral: the population, agriculture and
environment nexus in Sub-Saharan Africa. World Bank, Washington D.C.
Cook E. R., Anchukaitis, K.J., Buckley B.M. , D’Arrigo R.D., Jacoby G.C., and Wright W.E. Asian (2010) Monsoon Failure and Megadrought During the Last Millennium. Science 328: 486-489.
COP (2007) Report of the Conference of the Parties on its Eighth Session, Madrid 3-14 September 2007. Part Two: Action taken by the Conference of the Parties at its Eighth Session. ICCD/COP(8)/16/Add.1. UN Convention to Combat Desertification, Bonn.
COP (2009) Report of the Conference of the Parties on its Tenth Session, Buenos Aires 21 September - 8 October 2009. Part Two: Action taken by the Conference of the Parties at its Tenth Session. ICCD/COP(9)/18/Add.1. UN Convention to Combat Desertification, Bonn.
COP (2012) Report of the Conference of the Parties on its Tenth Session, Changwon, 10-21 October 2011. Part Two: Action taken by the Conference of the Parties at its Tenth Session, Addendum 1. ICCD/COP(10)31/Add.1. UN Convention to Combat Desertification, Bonn.
Cowie, A., Schneider, U.A., Montanarella, L. (2007) Potential synergies between existing multilateral
environmental agreements in the implementation of land use, land-use change and forestry
activities. Environmental Science & Policy 10: 335-352.
Cowie, A.L., Penman, T.D., Gorissen, L., Winslow, M.D., Lehmann, J., Tyrrell, T.D., Twomlow, S.,
Wilkes, A., Lal, R., Jones, J.W., Paulsch, A., Kellner, K., Akhtar-Schuster, M. (2011) Towards
sustainable land management in the drylands: scientific connections in monitoring and assessing
dryland degradation, climate change and biodiversity. Land Degradation & Development 22: 248-
260.
Coxhead, I. (1997) Induced innovation and land degradation in developing countries. Australian
Journal of Agricultural and Resource Economics 41:305-332.
Coxhead I. (1999) Economic modeling of land degradation in developing countries. In
Mahendrarajah S., Jakeman A. J. and MacAleer M. J. (eds.). Modelling Change in Economic and
Environmental Systems: 171-194. John Wiley, Chichester.
Coxhead I. (2000) Consequences of a food security strategy for economic welfare, income
distribution and land degradation: the Philippine case. World Development 28:111-128.
Cutter S.L. (2003) The vulnerability of science and the science of vulnerability. Annals of the
Association of American Geographers 93: 1-12.
UNCCD 2nd Scientific Conference 2013 White Paper I
49
Crawford S.E. and Ostrom E. (1995) A grammar of institutions. American Political Science Review 89:
582-600.
CST (2009) Advice on how to measure progress on strategic objectives 1, 2 and 3 of the 10 -year
strategic plan and framework to enhance implementation of the Convention (2008-18). Note by
the secretariat. Committee on Science and Technology, ICCD/COP(10)/CST/4.UN Convention to
Combat Desertification, Bonn.
CST (2011) Report on the refinement of the set of impact indicators on strategic objectives 1, 2 and
3. Note by the secretariat. Committee on Science and Technology, ICCD/COP(10)/CST/2.UN
Convention to Combat Desertification, Bonn.
Daly H. and Cobb J. (1989) Redirecting the Economy Toward Community, the Environment, and a
Sustainable Future. Beacon Press, Boston.
Diao X. and Sarpong D.B. (2007). Cost implications of agricultural land degradation in Ghana: an
economywide, multimarket model assessment. International Food Policy Research Institute,
Washington DC.
Dregne H.E. (1977) Map of the Status of Desertification in the Hot Arid Regions. Document
A/CONF.74/31. United Nations Conference on Desertification, Nairobi.
Dregne H. (1983) Desertification of Arid Lands. Harwood Academic Publishers. New York.
Dregne H., Kassas M., and Rozanov B. (1991) A New Assessment of the World Status of
Desertification [J]. Desertification Control Bulletin 20: 6-18.
Du Qun and I. Hannam (Eds). (2011) Law, Policy and Dryland Ecosystems in the People’s Republic of
China. Gland, Switzerland: IUCN. xvi + 140 pp.
Dyer, J, Stringer, L.C., Dougill, A.J. (2012) Unpacking partnerships to inform climate-compatible
development. http://www.see.leeds.ac.uk/research/sri/cdkn/
Ezeaku P. I. and Davidson A . (2008) Analytical situations of land degradation and sustainable
management strategies in Africa. Journal of Agriculture and Social Science 4: 42–52.
FAO,UNESCO and WMO, 1977. World Map of Desertification. United Nations Conference on
Desertification, Nairobi, 29 August- 9 September 1977. Document A/CONF.74/2. UN Food and
Agriculture Organization, Rome.
FAO (1986) Ethiopian Highlands Reclamation Study. Final report. Ministry of Agriculture, Addis
Ababa. UN Food and Agriculture Organization, Rome.
FAO (2001) Food Insecurity: When People Live With Hunger and Fear Starvation. UN Food and
Agriculture Organization, Rome.
FAO (2005) FAO Production Yearbook 2004. UN Food and Agriculture Organization, Rome.
FAO (2010) Global Forest Resources Assessment 2010. FAO Forestry Paper No. 163. UN Food and
Agriculture Organization, Rome.

UNCCD 2nd Scientific Conference 2013 White Paper I
50
GEF (2010a) System for Transparent Allocation of Resources (STAR). GEF Policy Paper; GEF/P.3; June
24, 2010.
GEF (2010b) System for Transparent Allocation of Resources (STAR), a booklet for questions and
answers on STAR, October 2010.
Geist H.J. and Lambin E.F., 2004. Dynamic causal patterns of desertification. Bioscience 54: 817-829.
GLADIS - Global Land Degradation Information Systems.
Grainger A. (1990) The Threatening Desert: Controlling Desertification. Earthscan Publications,
London.
Grainger A. (1992) Characterization and assessment of desertification processes. In Chapman G.P.
(ed.). Proceedings of Conference on Grasses of Arid and Semi-Arid Regions, Linnean Society,
London, February 1991: 17-33. John Wiley, Chichester.
Grainger A. (2009) The role of science in implementing international environmental agreements: the
case of desertification. Land Degradation and Development 20: 410-430.
Grainger A. (2012) The role of forest sustainability indicator systems in global governance. Global
Environmental Change 22: 147-160.
Hajkowicz S., and Young M. D. (2002) An economic analysis of revegetation for dryland salinity
control on the Lower Eyre Peninsula in South Australia. Land Degradation and Development 13:
417–428.
Hannam, I. with B. Boer. (2002) Legal and Institutional Frameworks for Sustainable Soils: A
Preliminary Report. IUCN, Gland, Switzerland and Cambridge, UK. xvi + 88 pp.
Hannam, I.D, and Boer B. (2004) Drafting Legislation for Sustainable Use of Soils: A Guide, IUCN,
Gland, Switzerland and Cambridge, UK. x+100pp.
Hansen L., and Hellerstein D. (2007) The value of the reservoir services gained with soil conservation.
Land Economics 83: 285–301.
Hazell P., Jansen H., Ruben R. and Kuyvenhoven A. (2002) Investing in poor people in poor lands.
International Food Policy Research Institute, Washington DC.
Hillerbrand E. (2008) The global distribution of income in 2050. World Development36: 727-740.
Holden S. and Shiferaw B. (2004) Land degradation, drought and food security in a less-favoured
area in the Ethiopian Highlands: a bio-economic model with market imperfections. Agricultural
Economics 30: 31-49.
Huber, S., Freudenschuz, E. and Loveland, P. (2001) Proposals for a European Soil Monitoring and
Assessment Framework, European Environment Agency, Copenhagen, Denmark.
Hurni H. (1988) Degradation and conservation of resources in the Ethiopian highlands. Mountain
Research and Development 8: 123-30.

UNCCD 2nd Scientific Conference 2013 White Paper I
51
IMF (2010) World Economic Outlook Data. International Monetary Fund, Washington DC.
IPBES (2012) Press release: New intergovernmental body established to accelerate global response
towards sustainable management of world’s biodiversity and ecosystems. German city of Bonn
wins bid to host secretariat. Science, key to conservation and development. Available at:
http://www.ipbes.net/about-ipbes/news-centre.html (Access 4 Mai 2012).
John M., Pannell D. and Kingwell R. (2005) Climate change and the economics of management in
the face of land degradation: dryland salinity in Western Australia. Canadian Journal of
Agricultural Economics 53: 443-459.
Johnson D. and Lewis L. (2007). Land degradation; creation and destruction. Maryland, USA
Kates R.W., Johnson D.L. and Johnson Haring K. (1977) Population, society and desertification. UN
Conference on Desertification, Nairobi, 29 August–9 September 1977, Document A/CONF74/8.
UN Environment Programme, Nairobi.
Kirby M.G. and Blyth M.J. (1987) Economic aspects of land degradation in Australia. Australian
Journal of Agricultural Economics 31:154-174.
Knight F.H. (1921) Risk, Uncertainty and Profit. Kelley, New York.
Kuznets S.(1955) Economic growth and income inequality. American Economic Review45: 1-28.
Lal R. (1988) Soil Erosion Research Methods. Soil and Water Conservation Society, Ankary, VA.
Lallement, D. (1989) Environment and the Poor: Development Strategies for a Common Agenda.
Transaction Books, New Brunswick.
Liu T. (2006) Desertification Economic Loss Assessment in China [J]. Journal of Desert Research,
26(1): 40-46. (In Chinese).
Low, P.S. and Kim K. J. (2012) Integrated Report on the Mitigation of DLDD in DPRK. Prepared for the
UNCCD Secretariat, Bonn, Germany, April 2012.
Lu Q., and Wu B. (2002) Disaster Assessment and Economic Loss Budget of Desertification in China
[J]. China Population, Resources and Environment 12(2): 29-33 (in Chinese)
Mabbutt J.A. (1984) A new global assessment of the status and trends of desertification.
Environmental Conservation 11: 100-113.
Martin, P and Verbeek M. (2006) Sustainability Strategy, The Federation Press, Australia.
Mekonnen M. (2006) Drought, Famine, and Conflict: A Case from the Horn of Africa. Beyond Intractability Version IV; September 2006.
McConnell K. E. (1983) An economic model of soil conservation. American Journal of Agricultural Economics 65: 83-89.
Middleton N.J. and Thomas D.S.G. (1997) World Atlas of Desertification. 2nd Edn. Arnold, London.

UNCCD 2nd Scientific Conference 2013 White Paper I
52
Millennium Ecosystem Assessment (MEA) (2005) Ecosystems and Human Well-Being - Desertification
Synthesis. Island Press, Washington DC.
Millennium Ecosystem Assessment (MEA) (2005) Living Beyond Our Means: Natural Assets and
Human Well-Being. Washington, DC: Island Press.
Mitchell G. and Dorling D. (2003) An environmental justice analysis of British air quality. Environment
and Planning A 35: 909-929.
Morales C., Brzovic, F., Dascal, G., Aranibar, Z., Mora L., Morera, R., Estupiñan, R., Candia, D., Agar
S., , López-Cordovez, L., Parada, S., Damianovic, N., Kerrigan, G., Rebolledo, M. (2011) Measuring
the economic value of land degradation / desertification and drought considering the effects of
climate change. A study for Latin America and the Caribbean.CSFD, 29-30 June 2011,
Montpellier.
Morey E.R. (1986) Desertification from an economic perspective. Science of the Total Environment
55: 101-110.
Mortimer, M. with contributions from S. Anderson, L. Cotula, J. Davies, K. Faccer, C. Hesse, J.
Morton, W. Nyangena, J. Skinner and C. Wolfangel 2009 Dryland Opportunities: A new paradigm
for people, ecosystems and development, IUCN, Gland; IIED, London and UNDP/DDC, Nairobi.
Mouat, D., Lancaster, J., El-Bagouri, I., Santibanez, F. (2006) Eds. Opportunities for synergy among
the environmental Conventions: Results of national and local level workshops. UNCCD, Bonn,
Germany.
Niemi E., Souhlas T., Reich S., Buckley M. and Manyindo J. (2010) Economic importance of goods and
services derived from dryland ecosystems in the IGAD region. ECONorthwest, Eugene, Oregon.
Nkonya E., Gerber N., Baumgartner P., von Braun J., De Pinto A., Graw V., Kato E., Kloos J. and
Walter T. (2011) The economics of desertification, land degradation, and drought: toward an
integrated global assessment. ZEF Discussion Papers on Development Policy No. 150. Centre for
Development Research, Bonn.
NRSA (1995) Report on Area Statistics of Land Use/Land Cover Generated Using Remote Sensing
Techniques. National Remote Sensing Agency, Hyderabad.
Oldeman L. (1996) Global and Regional Databases for Development of State Land Quality Indicators:
The SOTER and GLASOD Approach. ISRIC Report 96/2.University of Wageningen, Wageningen.
Ortiz E.F. and Tang G. (2005) Review of the Management, Administration and Activities of the UN
Convention to Combat Desertification (UNCCD). Joint Inspection Unit, United Nations, Geneva.
Pamo, E.T. (1998) Herdersand wild game behaviour as a strategy against desertification in northern
Cameroon. Journal of Arid Environments 39: 179-190.
Pearce D.W. and Barbier E.B. (2000) Blueprint for a Sustainable Economy. Earthscan Publications,
London
UNCCD 2nd Scientific Conference 2013 White Paper I
53
Pearce D.W. and Turner R.K. (1990) Economics of Natural Resources and the Environment.
Harvester/Wheatsheaf, London.
Perman R., Ma Y. and McGilvray J. (2003) Natural Resource and Environmental Economics. 3rd Edn.
Pearson, Harlow.
Pimentel D. , Harvey C., Resosudarmo P., Sinclair K., Kurz D., McNair M., Crist S., Shpritz L, Fitton L.,
Saffouri R. and Blair R. (1995) Environmental and economic costs of soil erosion and conservation
benefits. Science 267: 1117-1123.
RECIEL (Review of European Community and International Environmental Law). (2003) Focus on Land
Degradation and Desertification, Volume 12, Issue 2.
Reddy R. (2003) Land degradation in India: extent, costs and determinants. Economic and Political
Weekly 38: 4700-4713.
Repetto, R., Wells, M., Beer, C. and Rossini, F. (1987)Natural Resource Accounting for Indonesia.
World Resources Institute. Washington. DC.
Requier-Desjardins M. and Bied-CharretonM. (2006) Investing in the Recovery of Arid Lands. Working
Document Presented at the International Workshop on the Cost of Inaction and Investment
Opportunities in Dry, Arid, Semiarid and Subhumid Areas, Comité Scientifique Français de la
Désertification (CDFD), Rome, December 4–5.
Requier-Desjardins M., Adhikari B. and Sperlich S. (2011) Some notes on the economic assessment of
land degradation. Land Degradation and Development 22: 285-298.
Reynolds J.F., Stafford Smith D.M., Lambin E.F., Turner B.L. II, Mortimore M., Batterbury S.P.J.,
Downing T.E., Dowlatabadi H., Fernández R.J., Herrick J.E., Huber-Sannwald E., Jiang H., Leemans
R., Lynam T., Maestre F.T., Ayarza M. and Walker B. (2007) Building a science for dryland
development. Science 316: 847-851.
Salvati L., Zitti M., Ceccarelli T. and Perini L. (2009) Developing a synthetic index of land vulnerability
to drought and desertification. Geographical Research 47: 280–291.
Sehgal J. and Abrol I.P. (1994) Soil Degradation in India: Status and Impact. Oxford and IBH
Publishing, New Delhi.
Sen A.K. (1983) Poverty and Famine. An Essay on Entitlement and Deprivation. Clarendon Press,
Oxford.
SHI Peijun (2012) Economic and Social Impacts of DLDD in China. Information provided by SHI Peijun
to Working Group I for the preparation of this paper.
Singh J. and Singh J.P. (1995) Land degradation and economic sustainability. Ecological Economics
15: 77-86.
Smit B. and Wandel J. (2006) Adaptation, adaptive capacity and vulnerability. Global Environmental
Change 16: 282-292.

UNCCD 2nd Scientific Conference 2013 White Paper I
54
Stern N. (2006) Stern Review on the Economics of Climate Change. Cambridge University Press,
Cambridge.
Stringer L.C. (2009) Testing the orthodoxies of land degradation policy in Swaziland. Land Use Policy
26: 157-168.
Stringer L.C., Reed M.S., Dougill A.J., Seely M.K., Rokitzki M. (2007) Implementing the UNCCD:
Participatory challenges, Natural Resources Forum 31: 98-211.
Stringer L.C., Dyer J., Reed M.S., Dougill A.J., Twyman C., Mkwambisi D. (2009) Adaptations to
climate change, drought and desertification: insights to enhance policy in southern Africa,
Environmental Science and Policy 12: 748-765. doi: 10.1016/j.envsci.2009.04.002
Stringer L.C., Mkwambisi D., Dougill A.J., Dyer J.C. (2010) Adaptation to climate change and
desertification: Perspectives from national policy and autonomous practice in Malawi.Climate
and Development 2(2): 145-160. doi: 10.3763/cdev.2010.0042
Stringer L.C., Dougill A.J., Thomas A.D., Spracklen D.V., Chesterman S., Ifejika Speranza C., Rueff H.,
Riddell M., Williams M., Beedy T., Abson D.J., Klintenberg P., Syampungani S., Powell P., Palmer
A.R., Seely M.K., Mkwambisi D.D., Falcao M., Sitoe A., Ross S., Kopolo G. (2012) Challenges and
opportunities in linking carbon sequestration, livelihoods and ecosystem service provision in
drylands, Environmental Science and Policy 19-20: 121-135. doi: 10.1016/j.envsci.2012.02.004
Sutcliffe J.P. (1993) Economic assessment of land degradation in the Ethiopian highlands: a case
study. National Conservation Strategy Secretariat, Ministry of Planning and Economic
Development, Addis Ababa.
Taffesse A.S., Dorosh P. and Asrat S. (2011) Crop production in Ethiopia: regional patterns and trends.
International Food Policy Research Institute, Washington DC.
TEEB (2010) The Economics of Ecosystems and Biodiversity for National and International Policy
Makers 2010.
Thirwall A.P. (1999) Growth and Development. 6th Edn. Macmillan, Basingstoke.
Thomas, R.J. (2008) 10th Anniversary Review: Addressing land degradation and climate change in
dryland agroecosystems through sustainable land management. Journal of Environmental
Monitoring 10: 595-603.
Turner R. K. and Daily G. C. (2008) The ecosystem services framework and natural capital
conservation. Environmental and Resource Economics 39: 25-35.
UNCCD Secretariat (2012a) Report of the Conference of the Parties on its tenth session. Part two:
Action taken by the Conference of the Parties at its tenth session. 10th session, Changwon, 10-21
October 2011. Available at: http://www.unccd.int/Lists/OfficialDocuments/cop10/31add1eng.pdf
(Accessed 5 May 2012).
UNCCD Secretariat (2012b) Zero Net Land Degradation, A Sustainable Development Goal for Rio +
20. UNCCD Secretariat, Bonn.

UNCCD 2nd Scientific Conference 2013 White Paper I
55
UNCCD Secretariat (2008) Human Rights and Desertification, Exploring the Complementarity of
International Human Rights Law and the United Nations Convention to Combat Desertification,
Desertification, Land Degradation and Drought Issue Paper No. 1.
UNCCD Secretariat (2011) Land and soil in the context of a green economy for sustainable
development, food security and poverty eradication, the Submission of the UNCCD Secretariat to
the Preparatory Process for the Rio+ 20 Conference, Revised Version 18 November 2011.
UNDP (1997) Aridity zones and dryland populations: an assessment of population levels in the
world's drylands, with particular reference to Africa. UN Development Programme, New York.
UNDP (2011) Human Development Report 2011. Palgrave Macmillan, Basingstoke.
UNEMG (2011) Global drylands: a UN-system wide response. Available at:
http://www.unemg.org/Portals/27/Documents/IMG/LAND/report/Global_Drylands_Full_Report.
pdf (Accessed 5 May 2012).
UNEP (1980) Study on financing the United Nations Plan of Action to Combat Desertification. Report
to the Secretary General. Document A/35/396. United Nations Environment Programme, Nairobi.
UNFCCC Secretariat (2003) Report of the workshops on possible synergy and joint action with the
other multilateral environmental conventions and agreements, and on enhancing cooperation
with other conventions. Subsidiary Body for Scientific and Technological Advice, 19st session,
Milan, 1-9 December 2003. FCCC/SB/2003/1. Available at:
http://unfccc.int/resource/docs/2003/sb/01.pdf (Accessed 4 May 2012).
UNFCCC Secretariat (2004a) Options for enhanced cooperation among the three Rio Conventions.
Subsidiary Body for Scientific and Technological Advice, 21st session, Buenos Aires, 6-14
December 2004. FCCC/SBSTA/2004/INF.19. Available at:
http://unfccc.int/resource/docs/2004/sbsta/inf19.pdf (Accessed 3 May 2012).
UNFCCC Secretariat (2004b) Report of the meeting. Joint Liaison Group CBD, UNCCD, UNFCCC. Fifth
meeting of the Joint Liaison Group, Bonn, 30 January 2004. Available at:
http://unfccc.int/files/meetings/workshops/other_meetings/application/pdf/reportjlg5.pdf
(Accessed 3 May 2012).
UNFCCC Secretariat (2006) Views on the paper on options for enhanced cooperation among the
three Rio Conventions. Subsidiary Body for Scientific and Technological Advice, 24st session, Bonn,
18-26 May 2006. FCCC/SBSTA/2006/MISC.4. Available at:
http://unfccc.int/resource/docs/2006/sbsta/eng/misc04.pdf (Accessed 4 May 2012).
UNFCCC Secretariat (undated) Adaptation under the frameworks of the CBD, the UNCCD and the
UNFCCC. Joint Liaison Group of the Rio Conventions. Available at:
http://unfccc.int/resource/docs/publications/adaptation_eng.pdf (Accessed 4 May 2012).
Wang G., Wang X., Wu B. and Lu Q. (2012) Desertification and its mitigation strategy in China.
Journal of Resources and Ecology 3(2): 97-104.

UNCCD 2nd Scientific Conference 2013 White Paper I
56
Williamson, S., Brunckhorst, D. and Kelly, G. (2003) Reinventing the Common, Cross-Boundary
Farming for a Sustainable Future, The Federation Press, Australia.
Wischmeier W. and Smith D. (1978) Predicting Rainfall Erosion Losses: A Guide to Conservation
Planning. U.S. Department of Agriculture, Washington, DC.
World Bank (1980) World Bank Atlas 1980. World Bank, Washington DC.
World Bank(1990).World Development Report. World Bank, Washington DC.
Yesuf M., Mekonnen A., Kassie M. and Pender J. (2007) The cost of land degradation in Ethiopia: a
review of past studies. World Bank, Washington DC.
Zhang F. (2006) Value Accounting of Sandy Desertification Losses. Postdoctoral Research Report,
Chinese Academy of Forestry (In Chinese).

UNCCD 2nd Scientific Conference 2013 White Paper I
57
ANNEX 1
Case Study 1: Methodologies for Valuating Desertification Costs in China (by CHENG
Leilei, CUI Xianghui, GONG Liyan and LU Qi)
1. Introduction
In the 1990s, Dregne and his collaborators (e.g. Dregne et al., 1991; Dregne & Chou, 1992) estimated
the costs of desertification at the global level. During the same period, Chinese scholars began to
estimate the costs of desertification in China. Published studies in Chinese were searched in two
electronic databases, i.e. the China Academic Journal Network Publishing Database (CAJD) and the
China Doctoral Dissertations Full-text Database (CDFD), from 1990 to the present. Six studies in
Chinese are selected (see Table 1). Published studies in English were searched by using the Science
Direct database. Related studies in English have not been found. Three published studies that
estimate the costs of desertification in China, i.e. Zhang et al. (1996), Lu & Wu (2002) and Liu (2006)
have been frequently cited. This review will focus on the three studies.
Table 8: Studies selected for review
Authors Publication year Publication journal Times being cited Study area
Zhang et al. 1996 CPRE 71 National level Lu & Wu 2002 CPRE 49 National level Liu 2006 JDR 27 National level Ma et al. 2008 JDR 14 Northern China Zhang 2006 Postdoctoral research report 0 Northern China Dong 1997 JDR 29 Tibet
Note: CPRE- China Population, Resources and Environment, JDR- Journal of Desert Research.
In the following, we will provide a brief summary of the methodologies used in the selected studies
to estimate the costs of desertification in China. First, the various costs of Chinese desertification
estimated are examined. This is followed by an illustration of the valuation methods applied to
estimate desertification costs. Finally, we will give some brief comments on the existing studies.
2. Costs of desertification in China
2.1 Total costs of desertification
Zhang et al. (1996) was the first study to evaluate the costs of desertification in China by using the
results from previous studies. Its estimate of desertification costs was 54.1 billion RMB annually.
Because the price level was not given in the study, it seems reasonable to take the year before its
publication (i.e. 1995) as the base year. Lu & Wu (2002) and Liu (2006) then evaluated desertification
costs based on the result of the Second Round of National Desertification and Sandification
Monitoring (1995-1999). Lu and Wu estimated that the annual costs of desertification were 64.2
billion RMB (at 1999 price level), which was only half of that of Liu’s study (128.1 billion RMB). On
average, the total annual costs of desertification in China was 89.28 billion RMB (at 1999 price level),
or about 1% of GDP.

UNCCD 2nd Scientific Conference 2013 White Paper I
58
Table 9: Total costs of desertification in China
Total costs
(billion RMB) Base year
Nominal GDPb
(billion RMB) GDP deflatorb
(1978=100%) % of GDP
Zhang et al. 54.1 1995 6079.37 502.3% 0.89% Lu & Wu 64.2 1999 8967.71 700.9% 0.72%
Liu 128.1 1999 8967.71 700.9% 1.43% Average 89.28a 1999 8967.71 700.9% 1.00%
a. Steps for calculating average desertification costs are as follows. First, adjust the total costs of desertification in Zhang et al. (1996) to 1999 price level using GDP deflators. Then, calculate the arithmetic mean of the constant- price costs of desertification in the three studies. b. GDP data and GDP deflator data are both from China Statistical Yearbook 2012.
2.2 Various costs estimated
Agricultural loss is one of the most important on-site costs resulting from desertification. Soil
nutrients loss (including the loss of nitrogen, phosphorous, potassium and organic matter) and
animal husbandry loss were estimated to be 0.27-32.03 billion RMB and 0.16-8.02 billion RMB per
year respectively (see Table 3). According to Liu’s study, crop production loss amounted to 18.68
billion RMB annually. It is necessary to point out that there was some double counting in the studies.
For example, crop production loss and animal husbandry loss were both partly due to soil nutrients
loss.
Table 10: Agricultural loss resulting from desertification in China
Soil nutrient loss
(billion RMB) Animal husbandry loss
(billion RMB) Base year
Subtotal (billion RMB)
% of AGDP
Zhang et al. 17 0.16 1995 17.16 1.41% Lu & Wu 0.27 1.6 1999 1.87 0.13%
Liu 32.03 8.02 1999 40.05 2.71% Note: Nominal agricultural gross domestic product (AGDP) in 1995 and 1999 were 1213.58 billion RMB and 1477 billion RMB respectively. AGDP data are from China Statistical Yearbook 2012.
Siltation of rivers, reservoirs, and irrigation canals is one of the off-site impacts of desertification.
The annual costs of siltation resulting from desertification was 0.032-1.639 billion RMB for river
courses, 0.09-0.5 billion RMB for reservoirs, and 0.201 billion RMB for irrigation canals (see Table 4).
Table 11: Costs of siltation of rivers, reservoirs and irrigation canals resulting from desertification in China (billion RMB)
River course siltation Reservoir capacity
loss Irrigation canal
siltation Subtotal
Base year
Zhang et al. 0.032 NA NA 0.032 1995 Lu & Wu 0.032 0.5 NA 0.532 1999
Liu 1.639 0.09 0.201 1.930 1999 NA -- not estimated. Transportation loss is another type of off-site costs of desertification. According to Zhang et al. (1996)
and Lu & Wu (2002), the cost of railway facility loss and highway facility loss by sand-blown disasters
was about 200 million RMB. However, Liu’s estimate of transportation loss resulting from
desertification, of which airline delay loss accounted for the most, was relatively small.

UNCCD 2nd Scientific Conference 2013 White Paper I
59
Table 12: Transportation loss resulting from desertification in China (million RMB)
Railway facility loss Highway facility loss Airline delay Subtotal Base year
Zhang et al. NA NA NA 200 1995 Lu & Wu NA NA NA 200 1999
Liu 5.9 7 22 34.9 1999 NA -- not estimated.
In addition, annual housing facility loss by sand-blown disaster and adverse health effects by
dust/sand storms were estimated at about 3.541 billion RMB and 365.4 million RMB respectively (Liu,
2006).
3. Valuation methods used
Four valuation methods, i.e. the Dose-Response Approach (DRA), Change in Productivity Approach
(CPA), Replacement Cost Approach (RCA), and Illness Cost Approach (ICA), are commonly used to
estimate the costs of desertification in China.
DRA is adopted to estimate soil nutrients loss due to soil erosion by wind and airline delay loss due
to dust/sand storms. This approach makes physical links between desertification (“dose”) and soil
nutrients loss (“response”), and values the nutrients loss at a shadow price (the market price of
fertilizer). For example, Zhang (2006) calculated soil nutrients loss in four kinds of desertified lands
(i.e. light, moderate, severe, and extreme desertified lands), and then converted the soil nutrients
loss to chemical fertilizer loss. Finally, the cost of soil nutrients loss was estimated by multiplying
fertilizer loss by fertilizer prices.
Agriculture loss resulting from desertification can be estimated by CPA. Steps for applying this
approach are similar to those of DRA, i.e. determine the physical impacts of desertification on
agricultural productivity, and then turn these into monetary costs. For instance, in order to estimate
agriculture loss resulting from desertification, Liu (2006) assumed that damage by desertification
was equal to 10.85% of crop production and 7,600 RMB (at 1999 price level) per km2 of rangeland.
Replacement costs refer to potential expenditures incurred in replacing or restoring the function
that is lost. The costs of river and irrigation canals siltation, and the loss in reservoir capacity,
transportation and housing facilities, can be valued by using RCA. For example, in order to evaluate
the cost of river course siltation loss by wind-blown sand, Zhang et al. (1996) and Lu and Wu (2002)
both assumed that the unit cost of clearing river course siltation was 10,000 RMB per km.
ICA is used to estimate human health loss by dust-sand storms. This approach estimates the impact
of the change in air quality on human health. All costs incurred by the diseases that are caused by air
pollution due to desertification, such as medical expenses and income loss, can be estimated by
using ICA. Based on the result of existing medical studies, Liu (2006) assumed that during each
dust/sand storm more than 0.9 million people suffered from respiratory diseases and that the
medical expense of each person was 100 RMB.
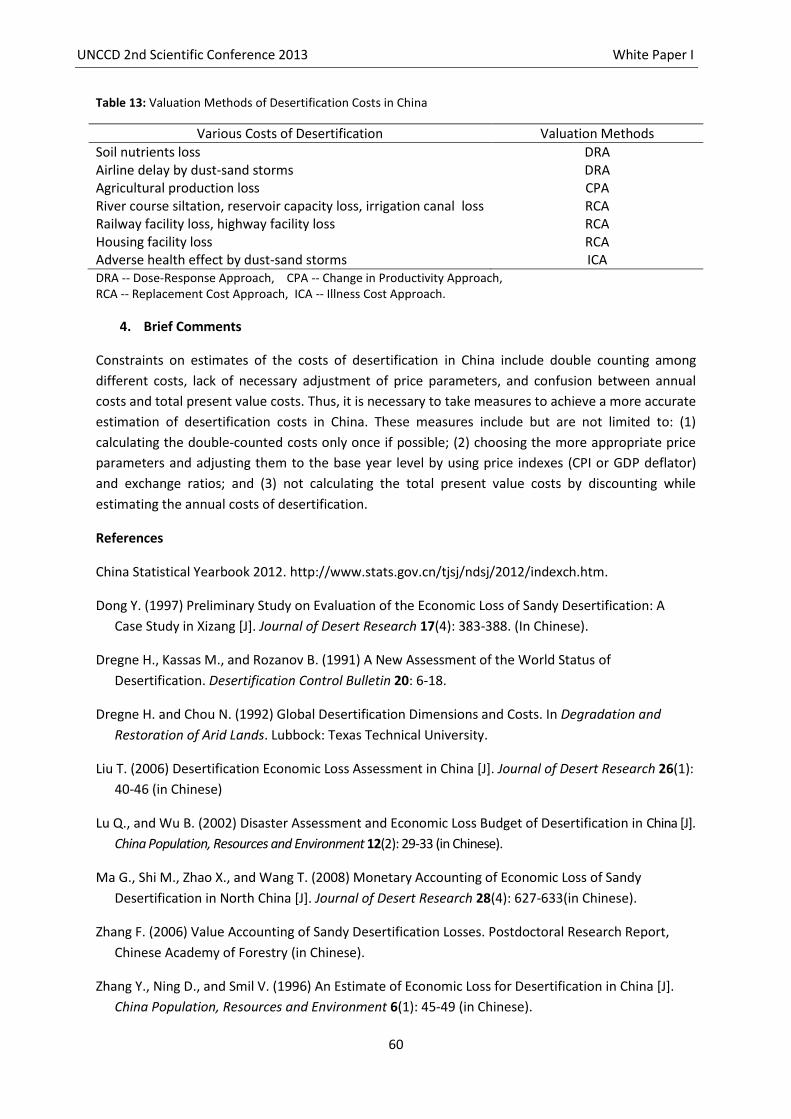
UNCCD 2nd Scientific Conference 2013 White Paper I
60
Table 13: Valuation Methods of Desertification Costs in China
Various Costs of Desertification Valuation Methods
Soil nutrients loss DRA Airline delay by dust-sand storms DRA Agricultural production loss CPA River course siltation, reservoir capacity loss, irrigation canal loss RCA Railway facility loss, highway facility loss RCA Housing facility loss RCA Adverse health effect by dust-sand storms ICA DRA -- Dose-Response Approach, CPA -- Change in Productivity Approach, RCA -- Replacement Cost Approach, ICA -- Illness Cost Approach.
4. Brief Comments
Constraints on estimates of the costs of desertification in China include double counting among
different costs, lack of necessary adjustment of price parameters, and confusion between annual
costs and total present value costs. Thus, it is necessary to take measures to achieve a more accurate
estimation of desertification costs in China. These measures include but are not limited to: (1)
calculating the double-counted costs only once if possible; (2) choosing the more appropriate price
parameters and adjusting them to the base year level by using price indexes (CPI or GDP deflator)
and exchange ratios; and (3) not calculating the total present value costs by discounting while
estimating the annual costs of desertification.
References
China Statistical Yearbook 2012. http://www.stats.gov.cn/tjsj/ndsj/2012/indexch.htm.
Dong Y. (1997) Preliminary Study on Evaluation of the Economic Loss of Sandy Desertification: A
Case Study in Xizang [J]. Journal of Desert Research 17(4): 383-388. (In Chinese).
Dregne H., Kassas M., and Rozanov B. (1991) A New Assessment of the World Status of
Desertification. Desertification Control Bulletin 20: 6-18.
Dregne H. and Chou N. (1992) Global Desertification Dimensions and Costs. In Degradation and
Restoration of Arid Lands. Lubbock: Texas Technical University.
Liu T. (2006) Desertification Economic Loss Assessment in China [J]. Journal of Desert Research 26(1):
40-46 (in Chinese)
Lu Q., and Wu B. (2002) Disaster Assessment and Economic Loss Budget of Desertification in China [J].
China Population, Resources and Environment 12(2): 29-33 (in Chinese).
Ma G., Shi M., Zhao X., and Wang T. (2008) Monetary Accounting of Economic Loss of Sandy
Desertification in North China [J]. Journal of Desert Research 28(4): 627-633(in Chinese).
Zhang F. (2006) Value Accounting of Sandy Desertification Losses. Postdoctoral Research Report,
Chinese Academy of Forestry (in Chinese).
Zhang Y., Ning D., and Smil V. (1996) An Estimate of Economic Loss for Desertification in China [J].
China Population, Resources and Environment 6(1): 45-49 (in Chinese).

UNCCD 2nd Scientific Conference 2013 White Paper I
61
ANNEX 2
Case Study 2: Economic assessment of DLDD in Spain(by Luuk Fleskens, Doan
Nainggolan and Lindsay Stringer)
The EU FP6 DESIRE project developed a Desertification Mitigation Cost Effectiveness (DESMICE) model to undertake spatially-explicit cost-benefit analysis of land degradation mitigation strategies. DESMICE was applied to the Rambla de Torrealvilla catchment, Murcia, Spain, where rainfed cereals, almond and olive orchards, irrigated vegetables, grapes, livestock, shrubs and forests dominate, and where soil erosion and water scarcity present key challenges (Nainggolan et al., 2012). DESMICE ran 5 different scenarios to establish how the investment costs of mitigation strategies change based on environmental conditions.
Baseline: Soil erosion risk was shown as low or moderate. Biomass production followed the rainfall gradient towards the east and was also influenced by land use. The dryland central area showed low biomass production in arable areas (0–2000 kg/ha), but surpassed 10,000 kg/ha for >50% of the area, where land was forested.
Technology scenario-reduced tillageapplied to cereal plots: Total operational costs (including equipment rental) were €75/ha under traditional tillage compared with €45/ha under reduced tillage. Such savings, even in the absence of a positive yield effect,could make the technology profitable. Results showed slight increases in crop yield in ~60% of the applicable area, with reductions in the remaining 40%. The technology was profitable in only 33% of the applicable area, indicating that cereal farming is a marginal economic activity. Savings on operations were confirmed in field experiments. No significant yield change was observed between minimal tillage and control.
Policy scenario: subsidised reduced tillage: Due to low productivity in much of the study area, without external financial incentives, widespread adoption of SLM technology is very unlikely. In this scenario we explored the effects of a subsidy on profitability of the technology and the potential for mitigating land degradation. The introduction of subsidy equal to 50 % of the operational costs did not have a significant impact in a large proportion of the study area. Negative economic gain largely remained the same before and after the subsidy, so it would be inappropriate to stimulate adoption of this technology through a subsidy.
Global scenario a): food production: This selects the technology with the highest agricultural productivity (biomass) for each cell with higher productivity than in the baseline scenario. Implementation costs for the total study area were calculated and cost-productivity relations assessed. Implementation of reduced tillage suggests yield increases in 58 % of the applicable area, but with a small average absolute yield change of 3.8 kg/ha. Aggregate indicators showed a saving of €75,000 across the study site.
Global scenario b): minimize land degradation: This selects the technology with the highest mitigating effect on land degradation (or none if the baseline demonstrates the lowest rate of degradation). Implementation costs for the total study area were calculated and cost-productivity relations assessed. Erosion was reduced in 99% of the applicable area and aggregate indicators suggest a saving of €129,000 across the study site.
Global scenarios show minimum tillage is beneficial through cost-saving relative to conventional tillage and soil and water conservation are collateral environmental benefits. Although the

UNCCD 2nd Scientific Conference 2013 White Paper I
62
technology is not beneficial across the entire area, the aggregate study site result is still positive. The technology is both cost-saving and easy to implement, though margins are small and dryland cereal farmers may struggle to generate a profit. Little risk is involved in adopting minimum tillage.
DESMICE has also been tested in many of the other DESIRE project study sites (Fleskens et al., 2012). Such scenario studies provide a useful way to assess the costs and benefits associated with alternative land management options.
References
Fleskens, L., Irvine, B., Kirkby, M. and Nainggolan, D. (2012) Desertification mitigation and
remediation of land (DESIRE) – A global approach for local solutions: Deliverable 5.3.1.Model
outputs for each hotspot site to identify the likely environmental, environmental and social
effects of proposed remediation strategies. 156pp.
Nainggolan, D., de Vente, J., Boix-Fayos, C., Termansen, M., Hubacek, K. and Reed, M.S. (2012)
Afforestation, land abandonment and agricultural intensification: Competing trajectories in semi-
arid Mediterranean

http://2sc.unccd.int/
UNITED N ATIONS Convention to Combat DesertificationUNCCD SecretariatP.O. Box 260129 D-53153 Bonn, Germany
Tel: +49-228 / 815-2800Fax: +49-228 / 815-2898/99www.unccd.int
Global Risk Forum GRF DavosPromenade 35CH-7270 Davos Platz, Switzerland
Tel: +41-81 / 414-1600Fax: +41-81 / 414-1610www.grforum.org