Embed Size (px)
DESCRIPTION
Where We Are Now. Structure of a Project Monitoring Information System. Creating a project monitoring system involves determining: What data to collect How, when, and who will collect the data How to analyze the data How to report current progress to management. - PowerPoint PPT Presentation
Citation preview

Progress and Performance Measurement and Evaluation
CHAPTER THIRTEEN
PowerPoint Presentation by Charlie Cook
Copyright © 2014 McGraw-Hill Education. All Rights Reserved.

13–2
Where We Are Now

13–3
Structure of a Project Monitoring Information System
• Creating a project monitoring system involves determining:– What data to collect– How, when, and who will collect the data– How to analyze the data– How to report current progress to management

13–4
Project Monitoring Information System
• Information System Structure– What data are collected?
• Current status of project (schedule and cost)
• Remaining cost to compete project
• Date that project will be complete
• Potential problems to be addressed now
• Out-of-control activities requiring intervention
• Cost and/or schedule overruns and the reasons for them
• Forecast of overruns at time of project completion
13–5
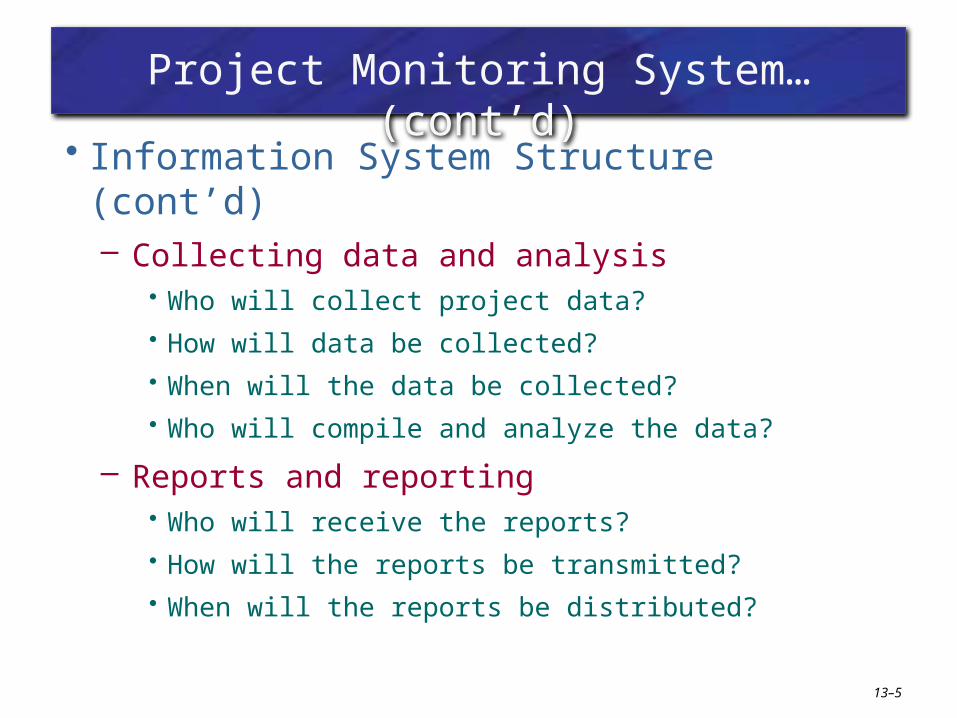
Project Monitoring System… (cont’d)
• Information System Structure (cont’d)– Collecting data and analysis
• Who will collect project data?• How will data be collected?• When will the data be collected?• Who will compile and analyze the data?
– Reports and reporting• Who will receive the reports?• How will the reports be transmitted?• When will the reports be distributed?

13–6
The Project Control Process
• Control– The process of comparing actual performance against plan to
identify deviations, evaluate courses of action, and take appropriate corrective action.
• Project Control Steps1. Setting a baseline plan.
2. Measuring progress and performance.
3. Comparing plan against actual.
4. Taking action.
• Tools– Tracking and baseline Gantt charts– Control charts

Development of an Earned Value Cost/Schedule System
• Time-Phase Baseline Plan– Corrects the failure of most monitoring systems to
connect a project’s actual performance to its schedule and forecast budget.• Systems that measure only cost variances do not
identify resource and project cost problems associated with falling behind or progressing ahead of schedule.
• Earned Value Cost/Schedule System– An integrated project management system based on
the earned value concept that uses a time-phased budget baseline to compare actual and planned schedule and costs.
13–7

13–8
Development of Project Baselines
• Purposes of a Baseline (PV)– An anchor point for measuring performance
• A planned cost and expected schedule against which actual cost and schedule are measured.
• A basis for cash flows and awarding progress payments.
• A summation of time-phased budgets (cost accounts as summed work packages) along a project timeline.
• What Costs Are Included in Baselines?– Labor, equipment, materials, project direct overhead
costs (DOC)
13–9
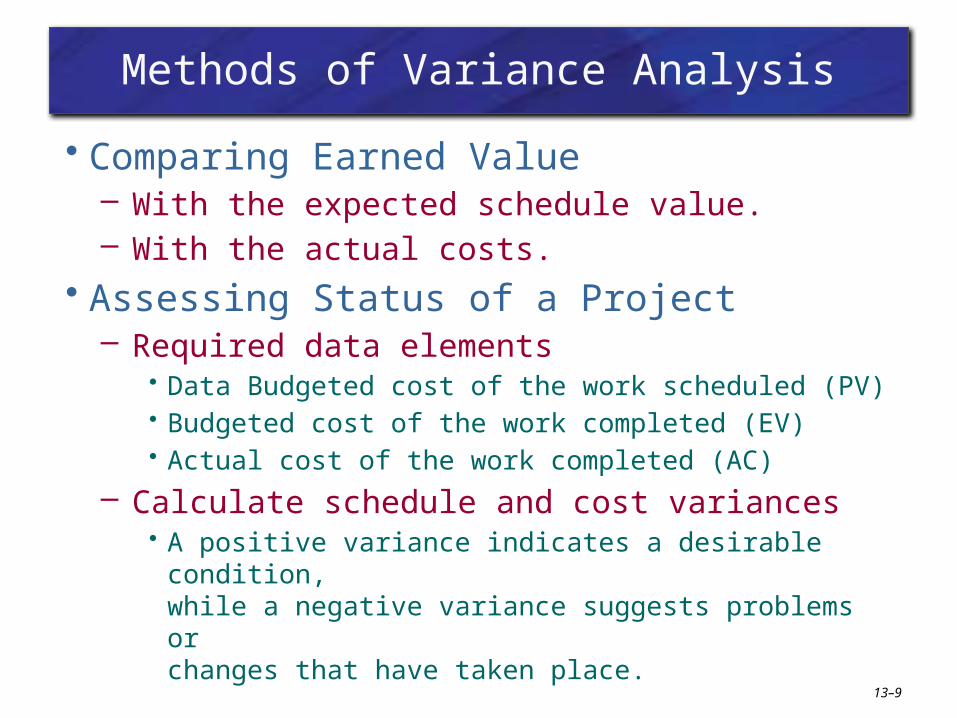
Methods of Variance Analysis
• Comparing Earned Value– With the expected schedule value.– With the actual costs.
• Assessing Status of a Project– Required data elements
• Data Budgeted cost of the work scheduled (PV)• Budgeted cost of the work completed (EV)• Actual cost of the work completed (AC)
– Calculate schedule and cost variances• A positive variance indicates a desirable condition,
while a negative variance suggests problems or changes that have taken place.

13–10
Methods of Variance Analysis
• Cost Variance (CV)– Indicates if the work accomplished using labor
and materials costs more or less than was planned at any point in the project.
• Schedule Variance (SV)– Presents an overall assessment in dollar terms
of the progress of all work packages in the project scheduled to date.

13–11
Indexes to Monitor Progress
• Performance Indexes– Cost Performance Index (CPI)
• Measures the cost efficiency of work accomplished to date.
• CPI = EV/AC– Scheduling Performance Index (SPI)
• Measures scheduling efficiency• SPI = EV/PV
– Percent Complete Indexes• Indicate how much of the work accomplished
represents of the total budgeted (BAC) and actual (AC) dollars to date.
• PCIB = EV/BAC • PCIC = AC/EAC
13–12
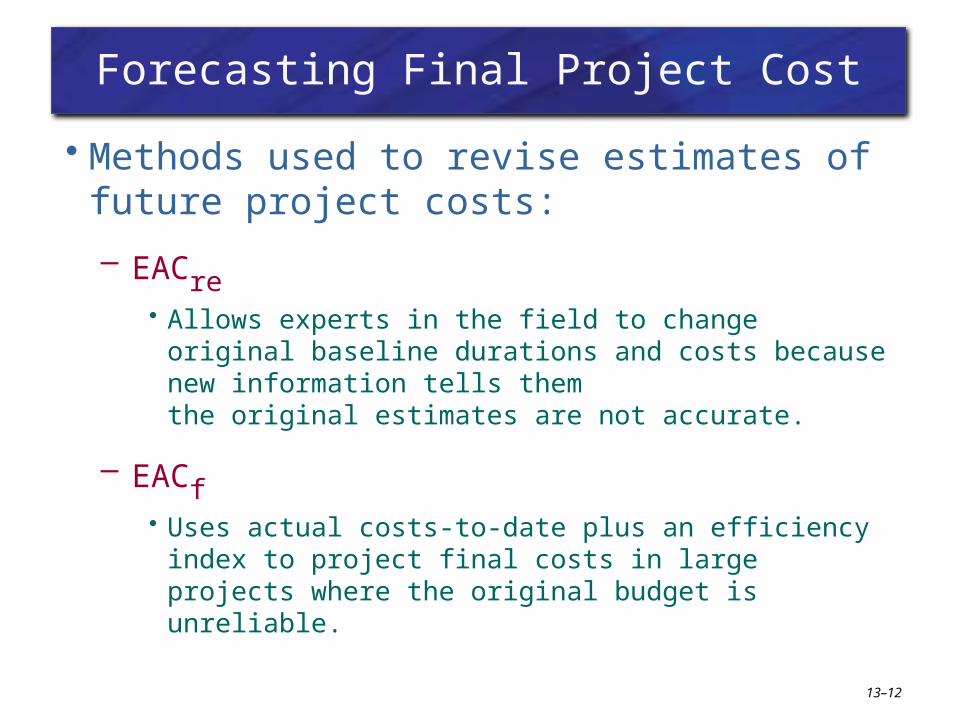
Forecasting Final Project Cost
• Methods used to revise estimates of future project costs:
– EACre• Allows experts in the field to change original baseline
durations and costs because new information tells them the original estimates are not accurate.
– EACf• Uses actual costs-to-date plus an efficiency index to
project final costs in large projects where the original budget is unreliable.

13–13
Forecasting Model: EACf
The equation for this forecasting model:
13–14
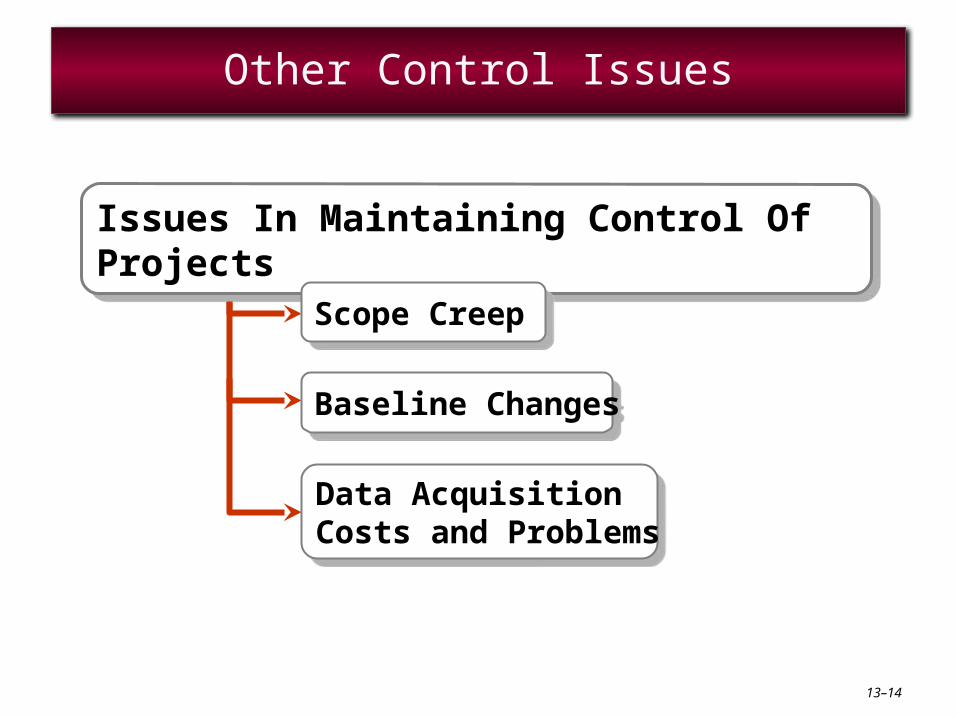
Other Control Issues
Issues In Maintaining Control Of ProjectsIssues In Maintaining Control Of Projects
Scope CreepScope Creep
Baseline ChangesBaseline Changes
Data Acquisition Costs and Problems
Data Acquisition Costs and Problems

13–15
Key Terms
Baseline budget
Budget at completion (BAC)
Control chart
Cost performance index (CPI)
Cost variance (CV)
Earned value (EV)
Estimated Cost at Completion—Forecasted (EACf)
Estimated Cost at Completion—Revised Estimates (EACre)
Percent complete index—budget costs (PCIB)
Percent complete index—actual costs (PCIC)
Schedule performance index (SPI)
Schedule variance (SV)
Scope creep
To complete performance index (TCPI)
Tracking Gantt chart
Variance at completion (VAC)


