Embed Size (px)
DESCRIPTION
Where Are the Doctor Millionaire's?. Have You Heard?. “The Tale of Two High School Graduates”. The Tale: Physicians Are High Earners. Physicians’ Income Grew Eight-fold 1980-2003. Source: The Healthcare Group, Inc. The Tale: Physicians Are High Earners. - PowerPoint PPT Presentation
Citation preview

Where Are the Doctor Millionaire's?

Other Existential QuestionsOther Existential Questions YesYes NoNo
Does it seem to you like the Government, insurance Does it seem to you like the Government, insurance companies and employers offer you nothing but companies and employers offer you nothing but unattractive business choices?unattractive business choices?
Do “efficiency” and “quality” sound like business Do “efficiency” and “quality” sound like business terminology borrowed by Medicare, Medicaid and terminology borrowed by Medicare, Medicaid and Managed Care to disguise “oligopoly” and “we will pay Managed Care to disguise “oligopoly” and “we will pay you what we want to pay you?”you what we want to pay you?”
Are income and expense pressures, along with Are income and expense pressures, along with spiraling malpractice insurance costs, forcing you out spiraling malpractice insurance costs, forcing you out of practice ownership and into employee status? Or of practice ownership and into employee status? Or forcing you to leave medicine all together?forcing you to leave medicine all together?
After all you have been through and the investment of After all you have been through and the investment of time and money you have made to become a Doctor?time and money you have made to become a Doctor?
Have you ever been overwhelmed by “the business of Have you ever been overwhelmed by “the business of medicine”?medicine”?
Do you feel financially insecure?Do you feel financially insecure?

“The Tale of Two High School Graduates”
Have You Heard?
The Tale: Physicians Are High Earners
Source: The Healthcare Group, Inc.
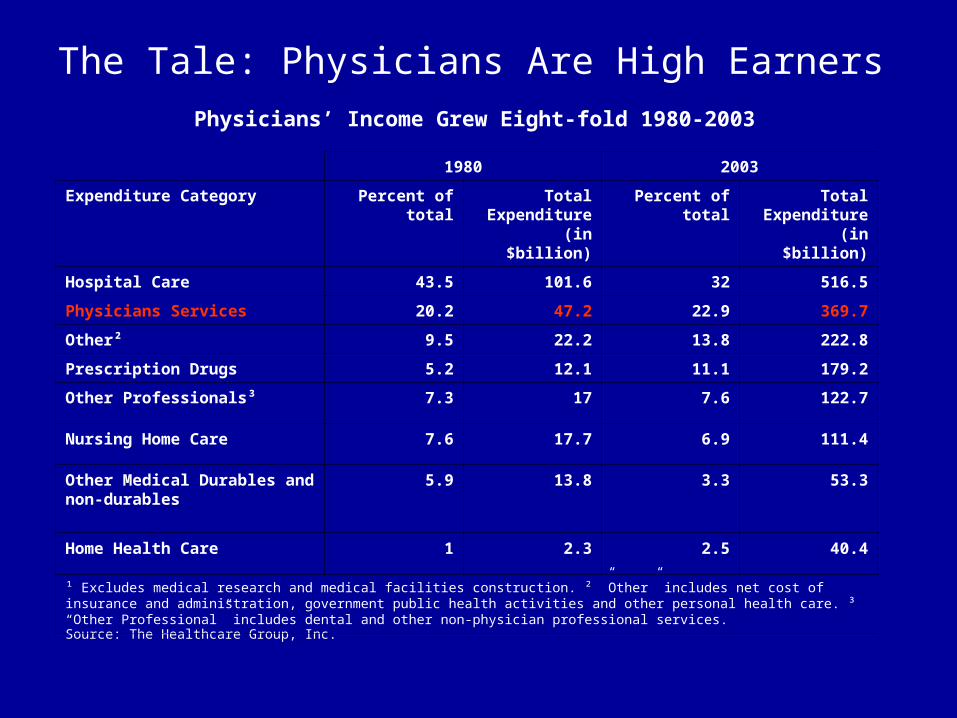
Physicians’ Income Grew Eight-fold 1980-2003
1980 2003
Expenditure Category Percent of total Total Expenditure (in
$billion)
Percent of total Total Expenditure (in
$billion)
Hospital Care 43.5 101.6 32 516.5
Physicians Services 20.2 47.2 22.9 369.7
Other² 9.5 22.2 13.8 222.8
Prescription Drugs 5.2 12.1 11.1 179.2
Other Professionals³ 7.3 17 7.6 122.7
Nursing Home Care 7.6 17.7 6.9 111.4
Other Medical Durables and non-durables
5.9 13.8 3.3 53.3
Home Health Care 1 2.3 2.5 40.4
¹ Excludes medical research and medical facilities construction. ² ”Other” includes net cost of insurance and administration, government public health activities and other personal health care. ³ “Other Professional” includes dental and other non-physician professional services.
0
10
20
30
40
50
60
70
80
90
1st Qtr 2nd Qtr 3rd Qtr 4th Qtr
East
West
North
Physicians' Fee Income
42.7
369.7
808.7
0
200
400
600
800
1000
1 2 3
Year
$ (b
illi
on
)
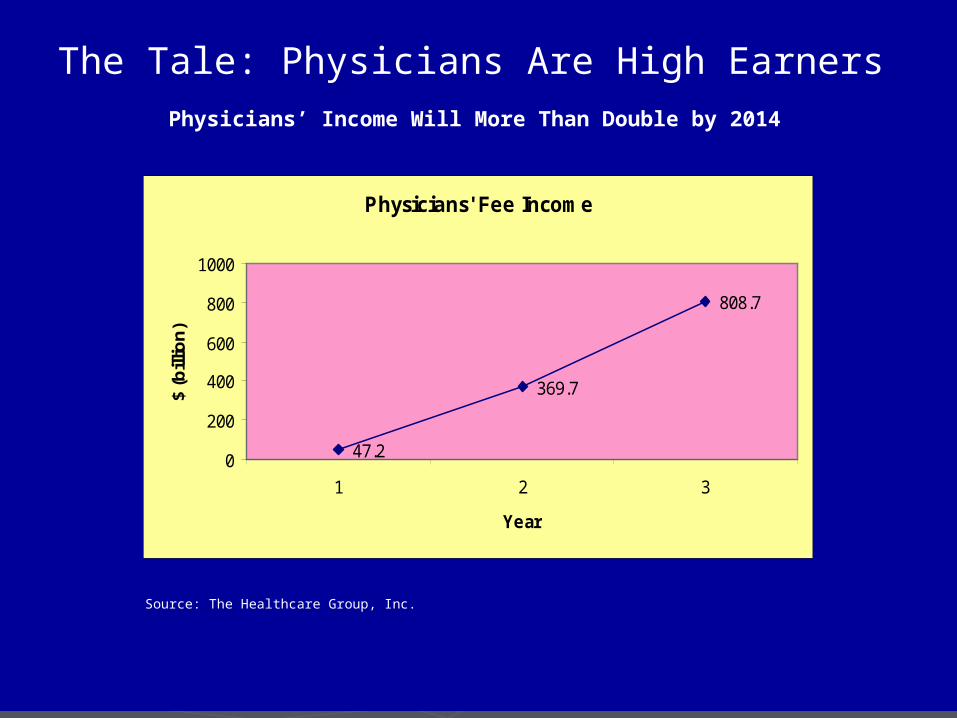
The Tale: Physicians Are High Earners
Source: The Healthcare Group, Inc.
Physicians’ Income Will More Than Double by 2014
Physicians' Fee Income
47.2
369.7
808.7
0
200
400
600
800
1000
1 2 3
Year
$ (b
illio
n)
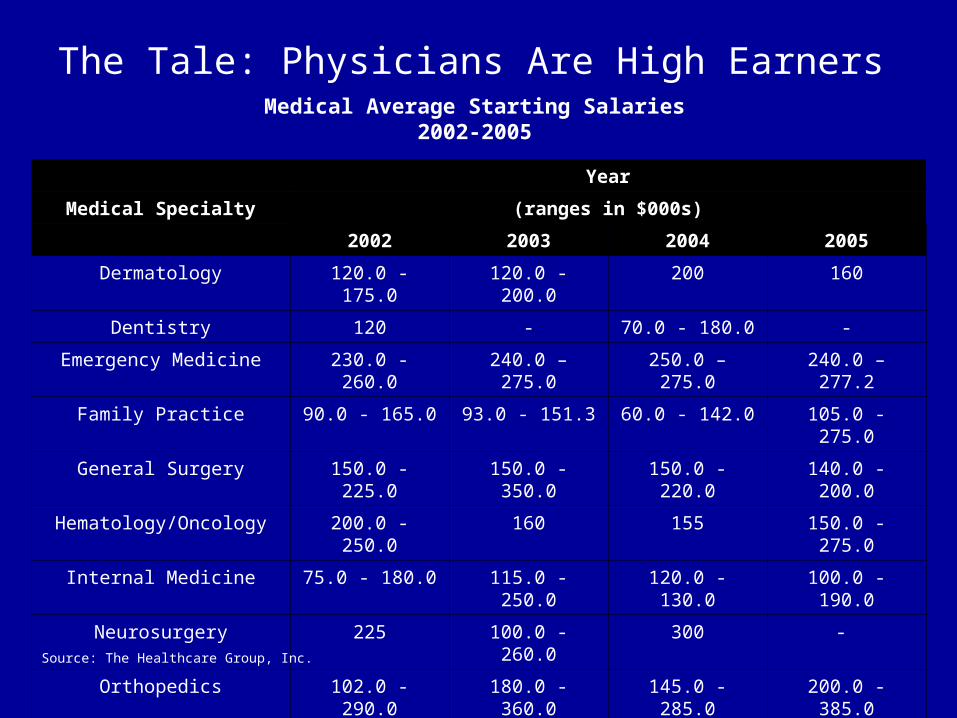
The Tale: Physicians Are High Earners
Year
Medical Specialty (ranges in $000s)
2002 2003 2004 2005
Dermatology 120.0 - 175.0 120.0 - 200.0 200 160
Dentistry 120 - 70.0 - 180.0 -
Emergency Medicine 230.0 - 260.0 240.0 – 275.0 250.0 – 275.0 240.0 – 277.2
Family Practice 90.0 - 165.0 93.0 - 151.3 60.0 - 142.0 105.0 - 275.0
General Surgery 150.0 - 225.0 150.0 - 350.0 150.0 - 220.0 140.0 - 200.0
Hematology/Oncology 200.0 - 250.0 160 155 150.0 - 275.0
Internal Medicine 75.0 - 180.0 115.0 - 250.0 120.0 - 130.0 100.0 - 190.0
Neurosurgery 225 100.0 - 260.0 300 -
Orthopedics 102.0 - 290.0 180.0 - 360.0 145.0 - 285.0 200.0 - 385.0
Plastic Surgery 100 120.0 - 125.0 140 -
Pulmonary Specialty - 140.0 - 190.0 145.0 - 175.0 145.0 - 160.0
Radiology 192.0 - 400.0 210.0 - 240.0 210.0 - 300.0 235.0 - 350.0
Source: The Healthcare Group, Inc.
Medical Average Starting Salaries2002-2005
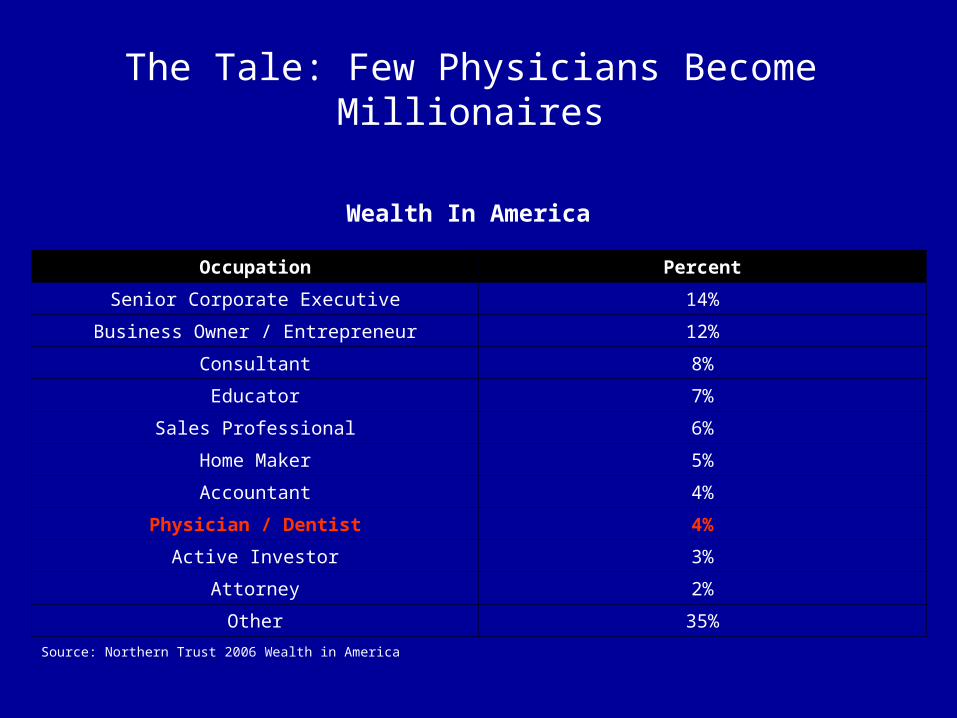
The Tale: Few Physicians Become Millionaires
Wealth In America
Occupation Percent
Senior Corporate Executive 14%
Business Owner / Entrepreneur 12%
Consultant 8%
Educator 7%
Sales Professional 6%
Home Maker 5%
Accountant 4%
Physician / Dentist 4%
Active Investor 3%
Attorney 2%
Other 35%
Source: Northern Trust 2006 Wealth in America
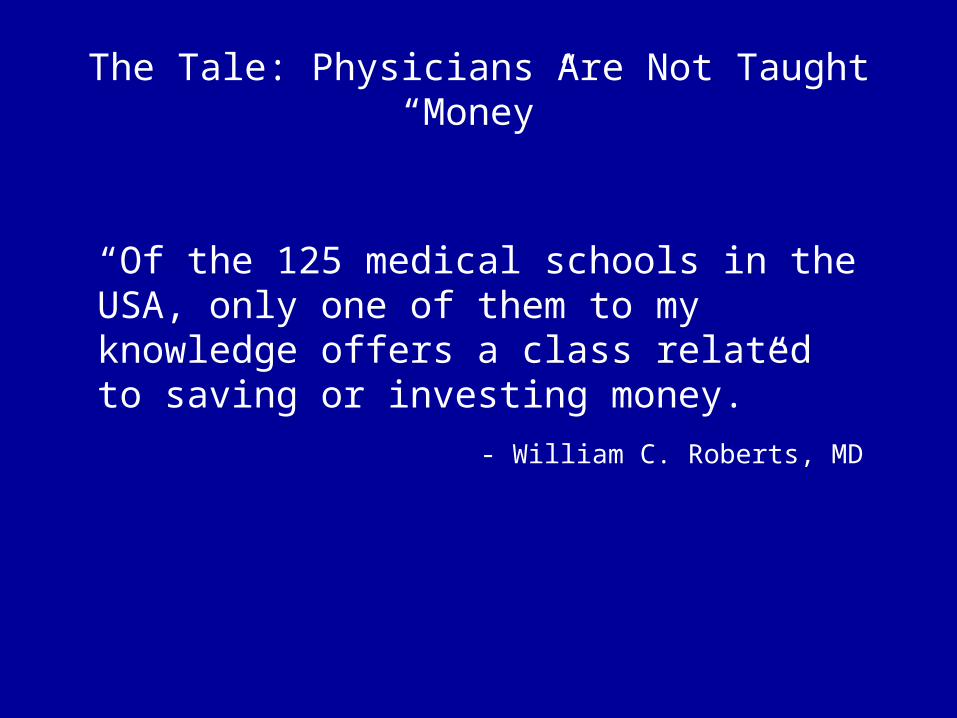
The Tale: Physicians Are Not Taught “Money”
“Of the 125 medical schools in the USA, only one of them to my knowledge offers a class related to saving or investing money.”
- William C. Roberts, MD
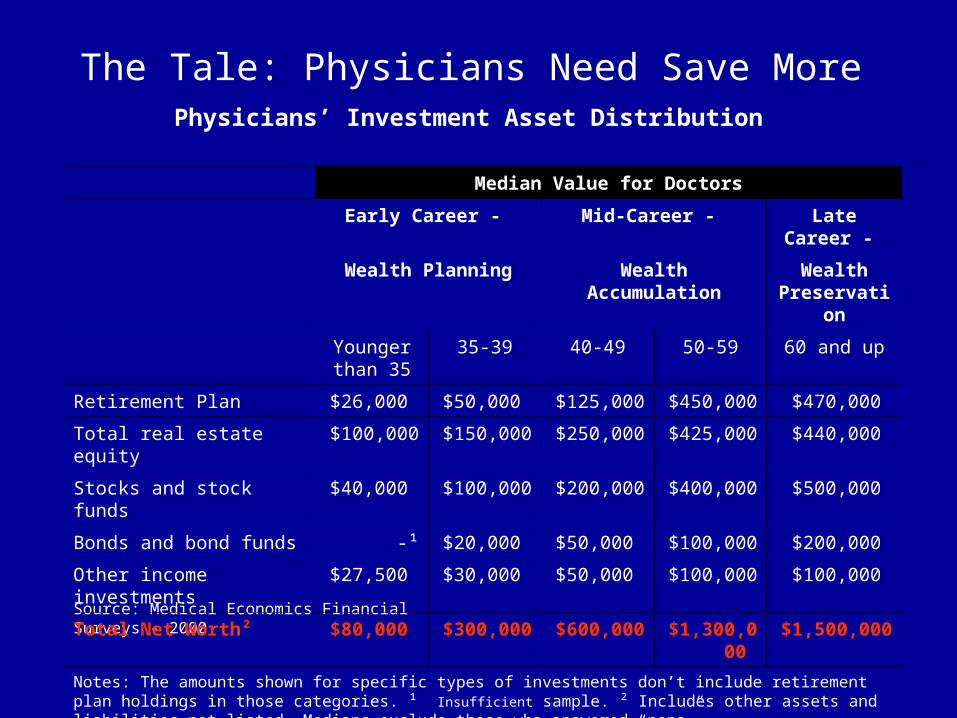
The Tale: Physicians Need Save More
Source: Medical Economics Financial Surveys - 2000
Physicians’ Investment Asset Distribution
Median Value for Doctors
Early Career - Mid-Career - Late Career -
Wealth Planning Wealth Accumulation Wealth Preservation
Younger than 35
35-39 40-49 50-59 60 and up
Retirement Plan $26,000 $50,000 $125,000 $450,000 $470,000
Total real estate equity $100,000 $150,000 $250,000 $425,000 $440,000
Stocks and stock funds $40,000 $100,000 $200,000 $400,000 $500,000
Bonds and bond funds -¹ $20,000 $50,000 $100,000 $200,000
Other income investments $27,500 $30,000 $50,000 $100,000 $100,000
Total Net Worth² $80,000 $300,000 $600,000 $1,300,000 $1,500,000
Notes: The amounts shown for specific types of investments don’t include retirement plan holdings in those categories. ¹ Insufficient sample. ² Includes other assets and liabilities not listed. Medians exclude those who answered “none”.
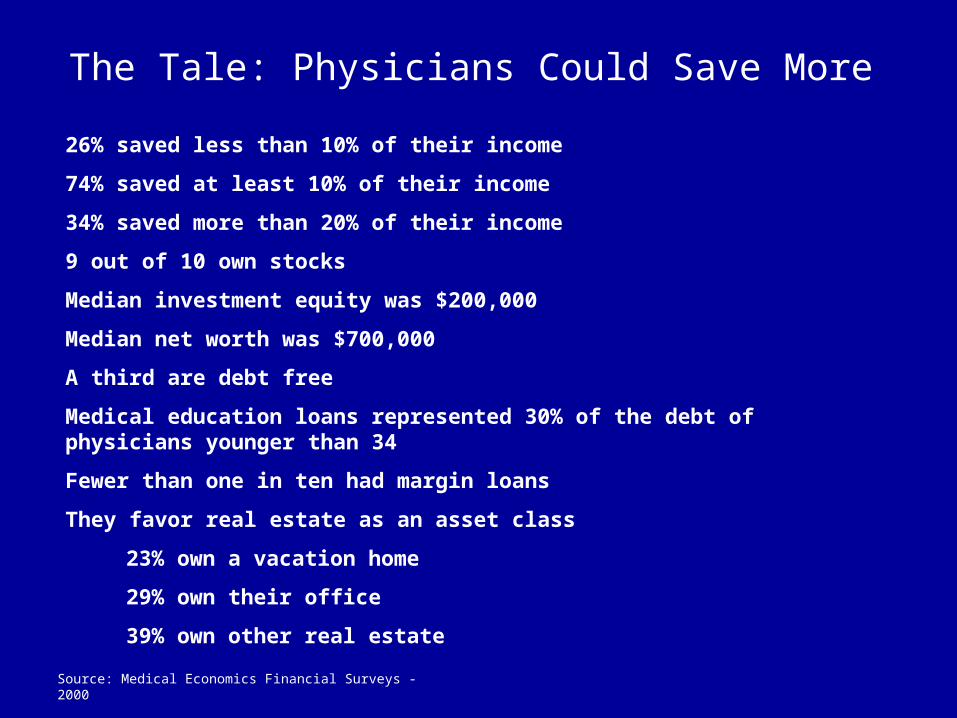
The Tale: Physicians Could Save More
Source: Medical Economics Financial Surveys - 2000
26% saved less than 10% of their income
74% saved at least 10% of their income
34% saved more than 20% of their income
9 out of 10 own stocks
Median investment equity was $200,000
Median net worth was $700,000
A third are debt free
Medical education loans represented 30% of the debt of physicians younger than 34
Fewer than one in ten had margin loans
They favor real estate as an asset class
23% own a vacation home
29% own their office
39% own other real estate
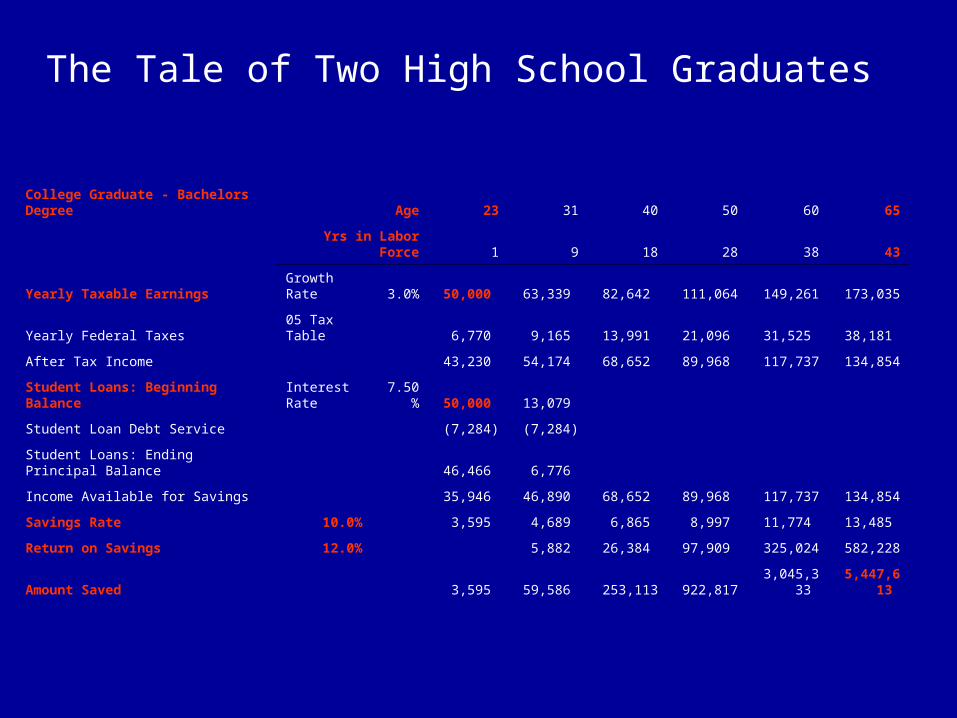
The Tale of Two High School Graduates
College Graduate - Bachelors Degree Age 23 31 40 50 60 65
Yrs in Labor Force 1 9 18 28 38 43
Yearly Taxable Earnings Growth Rate 3.0% 50,000 63,339 82,642 111,064 149,261 173,035
Yearly Federal Taxes05 Tax Table 6,770 9,165 13,991 21,096 31,525 38,181
After Tax Income 43,230 54,174 68,652 89,968 117,737 134,854
Student Loans: Beginning Balance Interest Rate 7.50% 50,000 13,079
Student Loan Debt Service (7,284) (7,284)
Student Loans: Ending Principal Balance 46,466 6,776
Income Available for Savings 35,946 46,890 68,652 89,968 117,737 134,854
Savings Rate 10.0% 3,595 4,689 6,865 8,997 11,774 13,485
Return on Savings 12.0% 5,882 26,384 97,909 325,024 582,228
Amount Saved 3,595 59,586 253,113 922,817 3,045,333 5,447,613
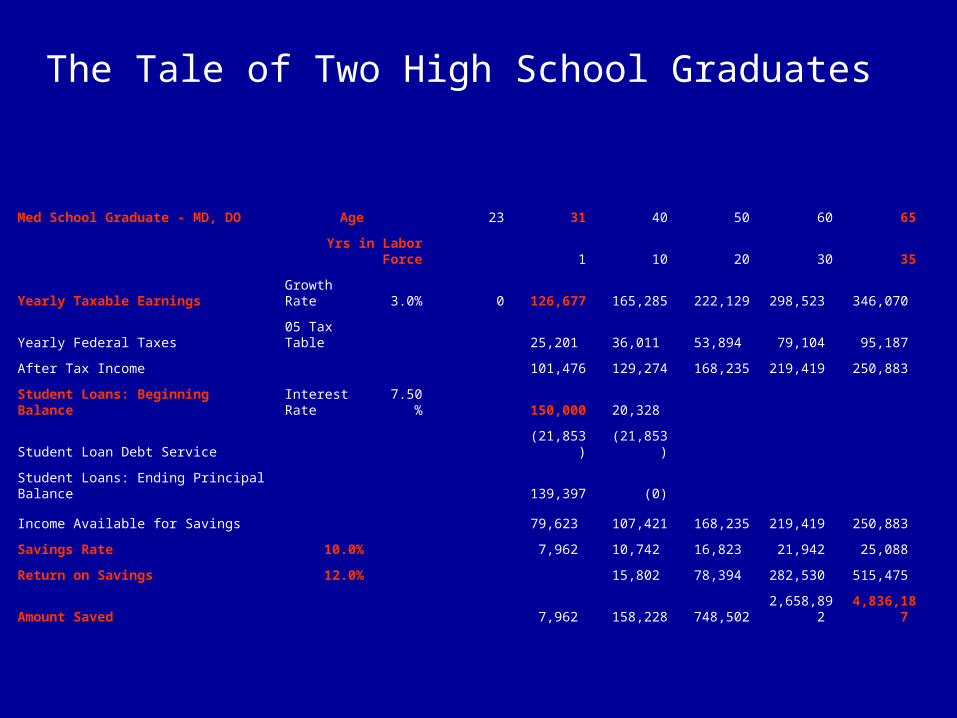
The Tale of Two High School Graduates
Med School Graduate - MD, DO Age 23 31 40 50 60 65
Yrs in Labor Force 1 10 20 30 35
Yearly Taxable Earnings Growth Rate 3.0% 0 126,677 165,285 222,129 298,523 346,070
Yearly Federal Taxes 05 Tax Table 25,201 36,011 53,894 79,104 95,187
After Tax Income 101,476 129,274 168,235 219,419 250,883
Student Loans: Beginning Balance Interest Rate 7.50% 150,000 20,328
Student Loan Debt Service (21,853) (21,853)
Student Loans: Ending Principal Balance 139,397 (0)
Income Available for Savings 79,623 107,421 168,235 219,419 250,883
Savings Rate 10.0% 7,962 10,742 16,823 21,942 25,088
Return on Savings 12.0% 15,802 78,394 282,530 515,475
Amount Saved 7,962 158,228 748,502 2,658,892 4,836,187
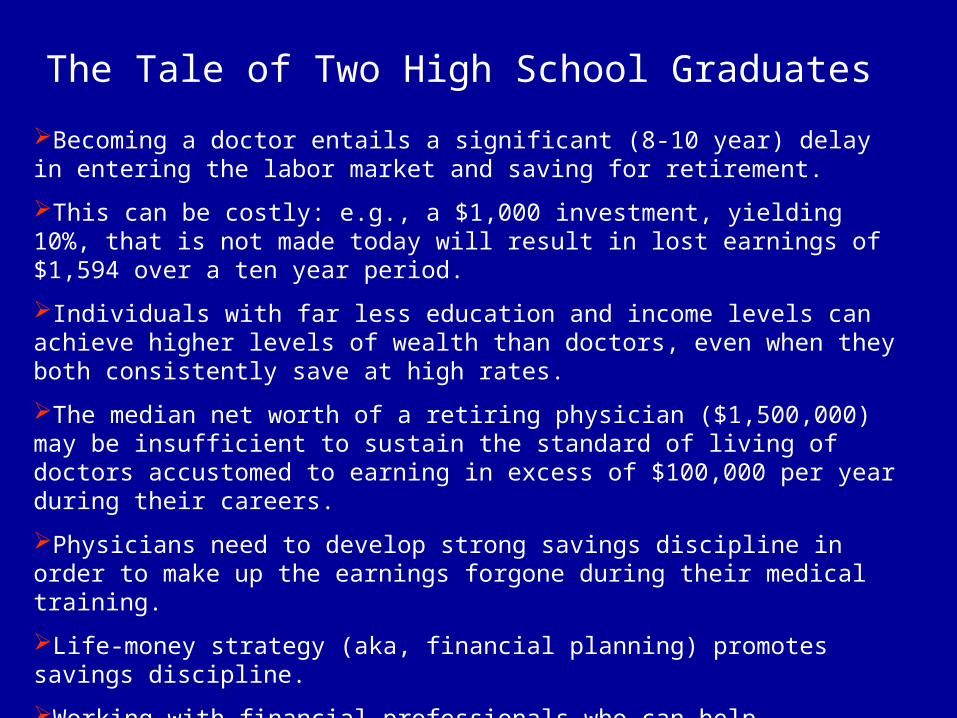
The Tale of Two High School Graduates
Becoming a doctor entails a significant (8-10 year) delay in entering the labor market and saving for retirement.
This can be costly: e.g., a $1,000 investment, yielding 10%, that is not made today will result in lost earnings of $1,594 over a ten year period.
Individuals with far less education and income levels can achieve higher levels of wealth than doctors, even when they both consistently save at high rates.
The median net worth of a retiring physician ($1,500,000) may be insufficient to sustain the standard of living of doctors accustomed to earning in excess of $100,000 per year during their careers.
Physicians need to develop strong savings discipline in order to make up the earnings forgone during their medical training.
Life-money strategy (aka, financial planning) promotes savings discipline.
Working with financial professionals who can help physicians reach top-tier risk-adjusted returns should be a key component of physicians’ financial security strategies.
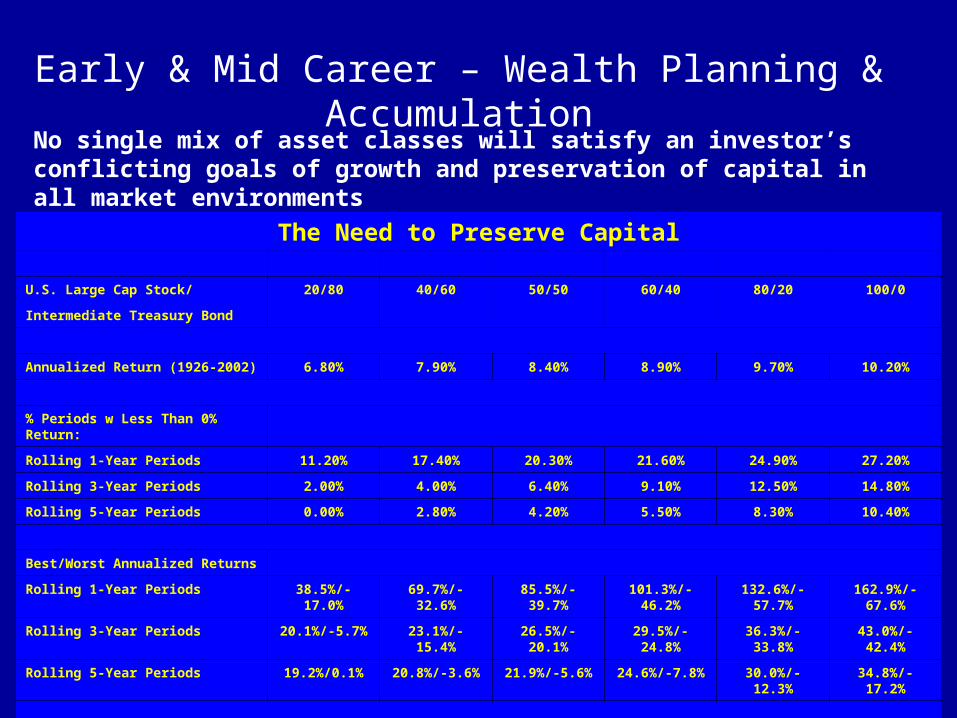
Early & Mid Career – Wealth Planning & Accumulation
No single mix of asset classes will satisfy an investor’s conflicting goals of growth and preservation of capital in all market environments
The Need to Preserve Capital
U.S. Large Cap Stock/ 20/80 40/60 50/50 60/40 80/20 100/0
Intermediate Treasury Bond
Annualized Return (1926-2002) 6.80% 7.90% 8.40% 8.90% 9.70% 10.20%
% Periods w Less Than 0% Return:
Rolling 1-Year Periods 11.20% 17.40% 20.30% 21.60% 24.90% 27.20%
Rolling 3-Year Periods 2.00% 4.00% 6.40% 9.10% 12.50% 14.80%
Rolling 5-Year Periods 0.00% 2.80% 4.20% 5.50% 8.30% 10.40%
Best/Worst Annualized Returns
Rolling 1-Year Periods 38.5%/-17.0% 69.7%/-32.6% 85.5%/-39.7% 101.3%/-46.2% 132.6%/-57.7% 162.9%/-67.6%
Rolling 3-Year Periods 20.1%/-5.7% 23.1%/-15.4% 26.5%/-20.1% 29.5%/-24.8% 36.3%/-33.8% 43.0%/-42.4%
Rolling 5-Year Periods 19.2%/0.1% 20.8%/-3.6% 21.9%/-5.6% 24.6%/-7.8% 30.0%/-12.3% 34.8%/-17.2%
Source: David E. Marcinko (2005)

►Mid Career – Wealth AccumulationMid Career – Wealth AccumulationActionAction
Update Financial PlanUpdate Financial Plan Rebalance Investment PortfolioRebalance Investment Portfolio Business PlanningBusiness Planning Treasury ManagementTreasury Management Education SavingsEducation Savings Retirement ForecastingRetirement Forecasting Trust & Estate PlanningTrust & Estate Planning Home Equity LinesHome Equity Lines Family AccountsFamily Accounts Working Capital FinancingWorking Capital Financing Equipment FinancingEquipment Financing Commercial Real Estate FinanceCommercial Real Estate Finance Merger & Acquisition FinancingMerger & Acquisition Financing Group Benefit PlansGroup Benefit Plans Risk/Investment Management Risk/Investment Management
through Insurancethrough Insurance


![[d], [o] If one doctor doctors another doctor does the doctor who doctors the doctor doctor the doctor the way the doctor he is doctoring doctors? Or](https://img.dokumen.tips/doc/110x75/56649e995503460f94b9c732/d-o-if-one-doctor-doctors-another-doctor-does-the-doctor-who-doctors-the.jpg)