Embed Size (px)
Citation preview

When Work Disappears: Manufacturing Decline and the Falling Marriage
Market Value of Young Men∗
David Autor† David Dorn‡ Gordon Hanson§
April 2018
Abstract
We exploit the gender-specific components of large-scale labor demand shocks stemming fromrising international manufacturing competition to test how shifts in the relative economic statureof young men versus young women affected marriage, fertility and children’s living circumstancesduring 1990-2014. On average, trade shocks differentially reduce employment and earnings ofyoung adult males. Consistent with Becker’s model of household specialization, shocks to male’srelative earnings reduce marriage and fertility. Consistent with prominent sociological accounts,these shocks heighten male idleness and premature mortality, and raise the share of mothers whoare unwed and the share of children living in below-poverty, single-headed households.
Keywords: Marriage Market, Fertility, Mortality, Household Structure, Single-Parent Fami-lies, Trade Flows, Import Competition, Local Labor Markets
JEL Classifications: F16, J12, J13, J21, J23
∗This paper previously circulated under the title “The Labor Market and the Marriage Market” (first circulatingdraft May 12, 2014). Autor, Dorn and Hanson acknowledge funding from the Russell Sage Foundation (RSF Project#85-12-07). Dorn acknowledges funding from the Spanish Ministry of Science and Innovation (grants CSD2006-00016 and ECO2010-16726) and the Swiss National Science Foundation (grant BSSGI0-155804). Autor and Hansonacknowledge funding from the National Science Foundation (grant SES-1227334). We thank Andrew Cherlin, JanetCurrie, Marianne Page, Ann Huff Stevens, Kathleen Vohs, Jane Waldfogel, two anonymous referees, and numerousseminar and conference participants for valuable suggestions. We are grateful to Juliette Fournier, Ante Malenica,Timothy Simmons, Oscar Suen, Juliette Thibaud, and Melanie Wasserman for expert research assistance.†MIT Department of Economics and NBER. E-mail: [email protected]‡University of Zurich and CEPR. E-mail: [email protected]§UC San Diego and NBER. E-mail: [email protected]

“The consequences of high neighborhood joblessness are more devastating than thoseof high neighborhood poverty... Many of today’s problems in the inner-city ghettos—crime,family dissolution, welfare, low levels of social organization, and so on—are fundamen-tally a consequence of the disappearance of work.” William Julius Wilson, When WorkDisappears, 1996, pp. xiii.
“Wilson’s book spoke to me. I wanted to write him a letter and tell him that he haddescribed my home perfectly. That it resonated so personally is odd, however, becausehe wasn’t writing about the hillbilly transplants from Appalachia—he was writing aboutblack people in the inner cities.” J.D. Vance, Hillbilly Elegy: A Memoir of Family andCulture in Crisis, 2016, p. 144.
1 Introduction
An influential body of work associated with sociologist William Julius Wilson (1986; 1987; 1996)
hypothesizes that the decline of U.S. blue-collar employment has diminished the pool of economically
secure young adult men, thereby reducing women’s gains from marriage, eroding traditional parental
roles, and imperiling children.1 Wilson’s narrative is close relative of the classic Becker (1973)
framework in which the economic gains to marriage arise in part from spousal earnings differences,
which spur household specialization.2 Reflecting the difficulty of distinguishing cause from effect
in the correlations between labor-market opportunity and family structure, the literature has, with
important exceptions, faced a challenge in testing these hypotheses.3 We surmount this challenge by
assessing how adverse labor-market shocks for young adults, emanating from rising trade pressure
on U.S. manufacturing, affect marriage, fertility, and children’s living circumstances. Following
Autor et al. (2013b) and Acemoglu et al. (2016), we exploit cross-industry and cross-local-labor-
market variation in import competition stemming from China’s market reforms to trade to identify
labor-demand shocks that are concentrated on manufacturing.
In linking local-labor-demand shocks to marriage and fertility, our work is close in spirit to
Black et al. (2003) who document an increasing prevalence of single-headed households in four U.S.
states that suffered a decline in their coal and steel industries, and Kearney and Wilson (2017) who
observe rising fertility but no change in marital patterns in U.S. regions that benefited from the 2000s
fracking boom. Our study complements the evidence from these episodes of industry-specific booms1See also Jahoda et al. (1971), Murray (2012), Bailey and DiPrete (2016), and Greenwood et al. (2017).2Whereas Becker focuses on relative economic stature, Wilson’s argument further implies that holding gender
differentials constant, an absolute fall in male economic stature reduces the value of marriage.3Exceptions include Angrist (2002) and Charles and Luoh (2010).
1

and busts by assessing whether two decades of contracting U.S. manufacturing employment across
a large set of industries and localities has affected marital and family outcomes. Distinct from much
prior work, we exploit gender dissimilarities in industry specialization to identify demand shocks that
distinctly affect men’s and women’s employment and earnings. Our strategy thus complements work
by Shenhav (2016), who uses gender-specific Bartik shocks and gender differences in occupational
choice to predict changes in relative gender earnings in U.S. states.4 We provide three main results.
First, shocks to manufacturing labor demand, measured at the commuting-zone (CZ) level,
exert large negative impacts on men’s relative employment and annual wage-and-salary earnings.
Although earnings losses are visible throughout the earnings distribution, the relative declines in
male earnings are largest at the bottom of the distribution.5
Second, these shocks curtail the availability and desirability of potentially marriageable young
men along multiple dimensions: reducing the share of men among young adults in a CZ and increas-
ing the prevalence of idleness—the state of being neither employed nor in school—among young
men who remain. Underscoring the acuity of economic distress, we find, related to Case and Deaton
(2015; 2017) and Pierce and Schott (2016b), that these forces induce a differential and economically
large rise in male mortality from drug and alcohol poisoning.
Finally, we link manufacturing decline to marriage, fertility, and children’s household circum-
stances. Much literature shows that adverse labor-market shocks reduce the fraction of young
women who are currently married. The Becker (1973) model makes a stronger prediction: a fall in
the relative economic stature of men diminishes the gains from household specialization and there-
fore reduces the prevalence of marriage, while a decline in women’s economic opportunities has the
opposite effect. We confirm the Becker prediction using the gender-specific components of manufac-
turing decline, and further show that these shocks raise the fraction of mothers who are unwed, the
fraction of children in single-headed households, and the fraction of children living in poverty.
These results complements work by Schaller (2016) showing that improvements in men’s labor
market conditions predict increases in fertility while improvements in women’s labor market con-
ditions do the opposite.6 They also support Wilson’s observation that manufacturing contractions4The Shenhav (2016) analysis focuses on the economic independence of women rather than the declining marriage-
market value of men; it draws its empirical strategy in part on an earlier version of this paper (Autor et al., 2014a).5Autor, Dorn and Hanson (2013a) find that trade shocks reduce CZ-level mean earnings and Chetverikov, Larsen
and Palmer (2016) demonstrate that these shocks raise CZ-level earnings inequality.6Work by Ananat et al. (2013) shows that adverse local economic shocks reduce teen birthrates and sexual activity,
while raising contraceptive use and abortion, while Page et al. (2007) and Lindo et al. (2013) document adverse impacts
2

shrink the pool of economically secure young adult men and erode traditional household arrange-
ments. Because trade-induced manufacturing shocks generate both an absolute fall in the employ-
ment and earnings of young adult men and a fall in these outcomes relative to women, our empirical
setting does not allow us to cleanly distinguish between the Becker hypothesis—focusing on relative
economic stature—and Wilson’s thesis, focusing on men’s absolute economic stature.
Alongside providing support for the argument that contracting blue-collar employment catalyzes
changes in gender roles and household structures, our analysis indicates that Wilson’s conclusions
apply to a far broader group of adults than the urban poor African Americans on whom he focused,
and that the magnitude of these effects are sizable relative to observed declines in male employment
rates, female fertility, and prevalence of marriage among U.S. young adults.7
2 Empirical Approach
We examine changes in exposure to international trade for U.S. CZs associated with the growth in
U.S. imports from China. Rising trade with China is responsible for nearly all of the expansion
in U.S. imports from low-income countries since the early 1990s (Pierce and Schott, 2016a). Our
empirical strategy builds on Autor et al. (2013a) and Acemoglu et al. (2016). We approximate local
labor markets using the construct of CZs developed by Tolbert and Sizer (1996), and include the
722 CZs that cover the U.S. mainland.
Our measure of the local-labor-market shock is the average change in Chinese import penetration
in a CZ’s industries, weighted by each industry’s share in initial CZ employment:
∆IP cuiτ =∑j
Lij90Li90
∆IP cujτ . (1)
Here, ∆IP cujτ = ∆M cujτ /(Yj91 + Mj91 − Xj91) is the growth of Chinese import penetration in the
U.S. for industry j over period τ , which in our data include the time intervals 1990 to 2000 and
2000 to 2014. It is computed as the growth in U.S. imports from China, ∆M cujτ , divided by initial
absorption (U.S. industry shipments plus net imports, Yj91 + Mj91 − Xj91) in the base year 1991,
near the start of China’s export boom. The fraction Lij90/Li90 is the share of industry j in CZ i ’s
total employment, as measured in County Business Patterns data in 1990. Differences in ∆IP cuiτ
of parental job loss on children’s living circumstances.7Vance (2016) argues that Wilson’s observations now apply more broadly to the white working class. We confirm
that our key findings hold when we focus on non-Hispanic whites.
3

across CZs stem from variation in local industry employment structure in 1990, which arises from
differential concentration of employment in manufacturing versus non-manufacturing activities and
specialization in import-intensive industries within local manufacturing. In all specifications, we
control for the start-of-period manufacturing share within CZs so as to focus on variation in exposure
to trade stemming from differences in industry mix within local manufacturing.
The measure ∆IP cuiτ captures overall trade exposure experienced by CZs but does not distinguish
between employment shocks that differentially affect male and female workers. To add this dimension
of variation, we modify (1) to exploit the fact that manufacturing industries differ in their male and
female employment intensity—so that trade shocks of a given magnitude will differentially affect
male or female employment depending on the set of industries that are exposed. We incorporate
this variation by multiplying the CZ-by-industry employment measure in (1) by the initial period
female or male share of employment in each industry by CZ (fij90 and 1− fij90), thus apportioning
the total CZ-level measure into two additive subcomponents, ∆IPm,cuiτ and ∆IP f,cuiτ :
∆IPm,cuiτ =∑j
(1 − fij90)Lij90Li90
∆IP cujτ and ∆IP f,cuiτ =∑j
fij90Lij90Li90
∆IP cujτ . (2)
As shown in Appendix Table A1, Chinese import penetration rose by 0.95 percentage points between
1990 - 2000, with an additional 1.15 percent rise per decade over 2000 - 2014. Sixty percent of this
rise accrued to male employment.8
We identify the supply-driven component of Chinese imports by instrumenting for growth in
Chinese imports to the U.S. using the contemporaneous composition and growth of Chinese imports
in eight other developed countries.9 Our instrument for the measured import-exposure variable
∆IP cuit is a non-U.S. exposure variable ∆IP coit that is constructed using data on industry-level
growth of Chinese exports to other high-income markets:
∆IP coiτ =∑j
Lij80Li80
∆IP cojτ . (3)
This expression differs from (1) by using realized imports from China by other high-income markets8We construct (1) using trade data from UN Comtrade that we harmonize to 4-digit SIC industries, and data
on CZ employment by industry from the County Buisness Patterns. In (2), we further use Census IPUMS data tocompute gender shares within industries and CZs, and assign to each SIC industry in a CZ the gender share of theCensus industry in the CZ encompassing it. Most outcome variables are based on Census IPUMS samples for 1990and 2000 (Ruggles et al., 2004) and pooled American Community Survey samples for 2013 through 2015. We allocatePUMAs to CZs using the algorithm in Dorn (2009) and Autor and Dorn (2013).
9The eight comparison countries—determined by the availability of comparable trade data for the full sampleperiod—are Australia, Denmark, Finland, Germany, Japan, New Zealand, Spain, and Switzerland.
4

(∆M cojτ ) in place of China-U.S. import penetration (∆M cu
jτ ); and by replacing other variables with
lagged values to mitigate simultaneity bias.10 The exclusion restriction underlying our instrumenta-
tion strategy is that the common component of import growth in the U.S. and in other high income
countries derives from factors specific to China, associated with its rapidly evolving productivity
and trade costs. Autor et al. (2013a) provide tests against correlated demand shocks and develop
an alternative estimation strategy based on the gravity model of trade.
3 Main results
3.1 Employment and earnings
We assess the causal effect of trade shocks on employment by fitting models of the form
∆Ysiτ = αt + β1∆IPcuiτ + X′
itβ2 + esiτ , (4)
where ∆Ysit is the decadal change in the manufacturing employment share of the young adult
population ages 18 - 39 in CZ i among gender group s (males, females, or both) during time interval
τ . Our focus is on employment of young adults because this population is disproportionately engaged
in marriage and child-rearing.11 We estimate (4) by stacking ten-year equivalent first differences for
1990 to 2000 and 2000 to 2014, while including dummies for each decade (αt). The explanatory
variable of interest is the change in CZ-level import exposure ∆IP cuiτ , instrumented by ∆IP coiτ as
in (3).12 The control vector X′it contains start-of-period CZ-level covariates, including: time trends
for U.S. Census Divisions; the lagged share of CZ employment in manufacturing, absorbing general
shocks to the sector; controls for employment in occupations susceptible to automation and offshoring
(see Autor and Dorn, 2013 and Goos et al., 2014); and CZ demographics (race, education, and the
fraction of working-age adult women who are employed).10The start-of-period employment shares Lij80/Li80 and the gender shares fij80 are replaced by their 10 year lags,
while initial absorption in the expression for industry-level import penetration is replaced by its 3 year lag.11Our sample is individuals who are not residents of institutionalized group quarters such as prisons. Here, we
pool individuals of all races and ethnicities; we show in Appendix Table A5 that our results also hold separately fornon-Hispanics whites, for whom we have sufficient statistical power to conduct a separate CZ-level analysis.
12When performing gender-specific estimates, we replace ∆IP cuiτ with ∆IPm,cuiτ and ∆IP f,cuiτ , and use the corre-sponding gender-specific instruments. In Appendix Table A2, we report OLS and 2SLS estimates separately by timeperiod, with corresponding first stages for 2SLS models. A falsification test in this table shows that the negative effectof the China trade shock on employment is not present in the 1980s (i.e., prior to its occurrence) and has the oppositesign in the 1970s, when labor-intensive U.S. manufacturing was still expanding in some U.S. regions.
5

Table 1: Estimated Impact of Manufacturing Trade Shock on Manufacturing Employ-ment by Gender and Gender Differential in Employment Status, Earnings, and Idleness,1990-2014: 2SLS Estimates. Dependent Variables: Changes in Percentage of PopulationAge 18-39 that is Employed in Manufacturing, Changes in Gender Differentials in Employ-ment Status (in % pts); Change in Gender Differential in Annual Earnings (in $); Changein Gender Differential in Percentage of Young Adults Age 18-25 that is Employed, NotEmployed but in School, or Neither Employed nor in School
M+F Males Females Emp Unemp NILF(1) (2) (3) (1) (2) (3)
-1.06 ** -0.99 ** -1.09 ** -0.65 * 0.19 * 0.46 ~
(0.17) (0.17) (0.20) (0.26) (0.09) (0.24)
-1.21 ** -2.59 ** 0.20 -3.13 ** 0.38 2.75 **
(0.44) (0.51) (0.43) (0.78) (0.26) (0.62)
-0.88 * 0.82 ~ -2.56 ** 2.17 ** -0.02 -2.15 **
(0.35) (0.46) (0.38) (0.65) (0.26) (0.64)
Mean Outcome Variable -2.61 -3.19 -2.06 -2.74 0.03 2.71Level in 1990 12.98 17.37 8.68 14.64 1.22 -15.87
No Emp No EmpP25 Median P75 Emp In School No School(1) (2) (3) (1) (2) (3)
-672 ** -445 * -847 * -0.64 ~ -0.02 0.66 **
(193) (191) (334) (0.34) (0.26) (0.20)
-2,216 ** -2,945 ** -3,685 ** -3.16 ** 0.56 2.60 **
(516) (593) (1081) (1.03) (0.73) (0.60)
1,086 * 2,400 ** 2,384 ** 2.24 * -0.68 -1.55 **
(529) (630) (814) (0.92) (0.74) (0.56)
Mean Outcome Variable -1,894 -2,126 -2,491 -2.83 -0.25 3.08Level in 1990 6,926 13,376 17,489 7.70 0.87 -8.56Notes: N=1444 (722 CZ x 2 time periods). Panel C analyzes the change over time in the difference between a percentile of the unconditional male earnings distribution in a commuting zone and the corresponding percentile in the unconditional female earnings distribution. All models include a dummy for the 2000-2014 period, occupational composition controls (start-of-period indices of employment in routine occupations and of employment in offshorable occupations as defined in Autor and Dorn, 2013), start-of-period shares of commuting zone population that is Hispanic, black, Asian, other race, foreign born, and college educated, as well as the fraction of women who are employed. Models are weighted by the product of period length and commuting zone share of start-of-period U.S. mainland population. Robust standard errors in parentheses are clustered on state. ~ p ≤ 0.10, * p ≤ 0.05, ** p ≤ 0.01.
Δ Import Penetration
II. Male Industry vs Female Industry ShockΔ Import Penetration × (Male Ind Emp Share)
Δ Import Penetration × (Female Ind Emp Share)
C. Male-Female Differential in Annual Earnings ($), Age 18-39
D. M-F Diff in Idleness, Age 18-25
I. Overall Trade ShockΔ Import Penetration
II. Male Industry vs Female Industry ShockΔ Import Penetration × (Male Ind Emp Share)
Δ Import Penetration × (Female Ind Emp Share)
I. Overall Trade Shock
A. Manufacturing Employment as a Share of Population, Age 18-39
B. Male-Female Differential by Employment Status Age, 18-39
6

Figure 1: Impact of Manufacturing Trade Shock on Earnings of Malesand Females Age 18-39, 1990-2014
-600
0-5
000
-400
0-3
000
-200
0-1
000
0D
olla
rs (2
015)
0 10 20 30 40 50 60 70 80 90 100Percentile of Income Distribution
Male Earnings Female Earnings
A. Impact on Male and Female Annual Earningsby Percentile, 1990-2014
-14
-12
-10
-8-6
-4-2
0Pe
rcen
tage
of M
ale
Earn
ings
0 10 20 30 40 50 60 70 80 90 100Percentile of Income Distribution
B. Impact on Male-Female Annual Earnings Gap 1990-2014as a Percentage of 1990 Male Earnings
The top panel measures the impact of a unit trade shock on the unconditionaldistribution of annual earnings (in $2015) separately for males and females.Each dot indicates a coefficient estimate from a separate IV quantile regres-sion with group-level treatment (Chetverikov, Larsen and Palmer 2016) thatcontrols for the covariates indicated in Table 1, and shaded areas indicate a95% confidence interval. The bottom panel reports the effect of a unit tradeshock on the difference in the male-female annual earnings gap expressed asa percentage of male earnings in 1990 at the indicated percentile.
7

The first panel of Table 1 estimates the impact of rising trade exposure on the locus of proximate
impact: manufacturing employment. In 1990, 17.4 percent of young men and 8.7 percent of young
women ages 18-39 were employed in manufacturing (bottom row of panel A).13 Estimates in columns
A1 through A3 find that rising import competition reduces manufacturing employment among both
sexes. A one unit trade shock—roughly equal to the average decade-level CZ-level rise in trade
exposure over the 1990-2014 period—depresses the share of young adults employed in manufacturing
by 1.06 percentage points (t = −6.3) with similar effects on young men (β̂ = −0.99, t = −5.8) and
young women (β̂ = −1.09, t = −5.5). These estimates imply large declines in manufacturing
employment among young adults over our 24-year window: a drop of 2.5 percentage points (20
percent) among men and of 2.7 percentage points (31 percent) among women.
We introduce the gender-specific trade shocks in panel A-II. Despite the high correlation between
these by-gender measures (ρ = 0.80), there is abundant power for distinguishing their independent
effects. Column A1-II finds that a unit rise in import penetration of either male or female-dominated
industries reduces manufacturing employment by 1 percentage point. Columns A2-II and A3-II
demonstrate that the employment effects of sex-specific shocks fall mostly on their corresponding
genders. A unit trade shock to male-specific industries reduces male manufacturing employment by
2.6 points (t = −5.1) and has a small and statistically insignificant impact on female employment;
a unit trade shock to female-specific industries reduces female manufacturing employment by 2.6
points (t = −6.7), while having a modest positive effect on male employment. Our ability to cleanly
differentiate male- and female-specific shocks is crucial to the analysis that follows.
We consider the broader impacts on overall employment in panel B of Table 1. Here and below,
we report the causal effects of trade shocks on the male-female gap in outcomes rather than on
their levels so as to measure impacts on relative economic stature.14 Although trade shocks have
similar impacts on male and female manufacturing employment, the estimate in column B1-I shows
that these shocks significantly depress the male relative to female employment-to-population rate—a
unit trade shock reduces male relative employment by 0.65 points (t = −2.5).15 While one might
have predicted this differential effect based upon men’s overrepresentation in manufacturing, the
results in panel A—showing that trade shocks reduce male and female manufacturing employment in13The denominator for this calculation is the non-institutionalized adult population ages 18-39. Among employed
adults in this demographic group, these fractions were 21.1 and 12.9 percent respectively.14Appendix Table A3 provides by-gender estimates for each gender gap outcome of Table 1.15For brevity, we use the term ‘relative’ to mean the difference in levels rather than the ratio of levels.
8

lockstep—underscore that differential manufacturing exposure is not the explanation. Rather, these
estimates indicate that trade shocks differentially reduce male employment in non-manufacturing.
Panel A of Appendix Table A3 indicates that the overall employment loss of males due to a unit
trade shock is larger than the decline in manufacturing employment seen in panel A of Table 1 (−1.5
vs −1.0 percentage points) while the overall employment decline for women is slightly smaller than
in manufacturing (−0.9 vs −1.1 percentage points).16
We next quantify the impact of gender-specific trade shocks on the distribution of annual wage
and salary income. For this analysis, we implement the Chetverikov et al. (2016) technique for per-
forming instrumental-variable estimates of the distributional effects of group-level treatments. Panel
C of Table 1 shows estimates of the effect of trade shocks on the CZ-level male-female earnings gap
for the 25th, 50th, and 75th percentiles of the distribution. Within CZs, male earnings substantially
exceed female earnings at all quantiles, with the size of the gap rising steeply with the quantile index.
In 1990, this gap was $6, 926, $13, 376, and $17, 489 at the 25th, 50th, and 75th quantiles, respectively
(bottom rows of panel C). Between 1990 and 2014, these gaps compressed by $1, 894, $2, 126 and
$2, 491 per decade at the 25th, 50th, and 75th quantiles respectively. Reinforcing the panel B findings
for the gender gap in employment, the first row of estimates in panel C demonstrates that trade
shocks differentially curtail male earnings. A one-unit trade shock reduces male relative to female
earnings by $672 at the 25th percentile (column C1, t = −3.5), by $445 at the median (column C2,
t = −2.3), and by $847 at the 75th percentile (column C3, t = −2.5).17
Since the male-female earnings gap is smaller at lower wage quantiles, the relative impact of trade
shocks on the male-female wage gap is largest among low-earners, as seen in Figure 1. The first
panel details that trade-induced earnings losses are larger for males than females at every quantile
from the 15th to 95th percentile.18 The second panel reports the impact of a unit trade shock on
the male-female annual earnings gap expressed as a percentage of baseline male earnings in 1990
at the corresponding percentile. Trade shocks modestly compress the male-female annual earnings
gap in the upper half of the annual earnings distribution. The effect is more dramatic below: the16Acemoglu et al. (2016) find substantial employment losses in industries that sell their outputs to import-competing
manufacturing, including mining whose workforce is strongly male-dominated.17Panel C-II of Table 1 shows that shocks centered on male employment have a larger effect on the gender earnings
gap than do shocks centered on female employment.18Annual earnings for both genders are zero below the 10th percentile. Above the 95th percentile, earnings are
largely censored and then imputed by the Census Bureau.
9

male-female wage compression is 2 points at the median, 4 points at p35, and 6 points at p20.19
The gender-specific estimates in Appendix Table A3 confirm that trade shocks reduce employ-
ment and earnings of both genders; that employment and absolute earnings losses are larger for males
than for females; and that proportional earnings losses for both sexes are larger at low than high
percentiles. These findings support Wilson’s observation that manufacturing contractions shrink the
pool of economically secure young adult men, generating both an absolute fall in the employment
and earnings of young adult men and a fall in these outcomes relative to women.
3.2 Gender gaps in idleness, absence, and mortality
The heart of the Wilson hypothesis is that adverse shocks to blue-collar employment catalyze a
broader deterioration in adult social function. We test for such consequences with three non-market
measures: idleness, absence, and mortality. Idleness is the state of being neither employed nor in
school; we focus on the ages 18-25, which cover the transition between school and work.20 In panel D
of Table 1, we estimate a variant of (4) where the dependent variable is the male-female gap in three
main (mutually exclusive) activity statutes: currently employed (D1), not employed but enrolled in
school (D2), and neither employed nor enrolled in school (D3), which we refer to as idleness. Column
D1 shows that a unit trade shock lowers the fraction of young men employed by 0.64 percentage
points relative to women of the same age range (t = −2.5). This is nearly identical to the effect found
for the broader set of adults ages 18-39 considered in column B1. Column D3 finds that the entire
differential rise in non-participation among young males is due to increased idleness (0.66 points,
t = −2.5), with little effect on school enrollment (column D2). This pattern is reinforced when
focusing on the gender-specific components of trade exposure (panel D-II): shocks to male-intensive
manufacturing generate a larger differential increase in male idleness (2.6 points, t = 4.3) than do
shocks to female-intensive manufacturing (−1.6 points, t = −2.8).21 Panel C of Appendix Table A3
reports these impacts separately by gender. The differential effect of manufacturing shocks on the
male-female idleness gap stem entirely from increases in male idleness. By contrast, reductions in19These reductions are relative to the baseline male earnings level not the baseline gap, indicating large changes. We
truncate the estimates at p20 because the low values of the denominator below this point make estimates uninformative.20Aguiar, Bils, Charles and Hurst (2017) document that young men devote more time to video games and recre-
ational computer use, while working fewer hours.21In panel D, unemployed adults are categorized as either students or as idle. If we define idleness as the state
of being neither employed, unemployed, nor in school, we continue to find a significant differential impact of tradeshocks on male idleness. The corresponding point estimates and standard errors for column D3 under this definitionare: 0.34 (0.15), 2.13 (0.41), and −1.69 (0.43) for rows 1, 2, and 3 respectively.
10
female employment accrue almost entirely to increases in female school enrollment.
Table 2: Estimated Impact of Manufacturing Trade Shock on Male Share of Adult Residents and Gender Differentialsin Death Rates 1990-2015: 2SLS Estimates. Dependent Variables: Change in Percentage of Male Share of Residents;Cumulative Male-Female Difference in Death Rates per 100k Population by Cause of Death
-0.25 * -0.28 ~ 69.6 * 21.9 ** -0.3 -1.5 0.7 -5.5 41.2 ~
(0.11) (0.16) (27.5) (7.0) (1.2) (1.1) (0.6) (4.7) (23.0)
-0.62 * -0.76 ~ 183.4 * 72.9 ** -2.6 1.9 -1.1 -21.1 ~ 94.4(0.27) (0.43) (78.1) (20.2) (2.9) (3.4) (1.4) (11.9) (71.6)
0.18 0.26 -56.1 -36.1 ~ 2.4 -5.3 2.8 ~ 12.0 -17.4(0.15) (0.29) (70.3) (19.2) (3.2) (3.8) (1.7) (10.5) (65.3)
Male-Female GapMalesFemales 9.8
1.9221.788.1
133.631.516.5
15.026.118.6
7.511.7 1,553.7
734.5
819.3288.866.6
222.2
Lung CancerTotal
(3)
I. Overall Trade Shock
A. Percentage of Male Residents
(7)Suicide
(8)All Other
(9)(4)
B. Male-Female Death Rate Differential Ages 20-39
18-39D&A Poison18-25
Δ Import Penetration
Notes: N=1444 (722 CZ x 2 time periods). The percentage of male residents is measured for the period 1990-2014 among all individuals who do not reside in institutionalized group quarters. Male share of CZ residents in 1990 was 49.6% among 18-39 and 50.2% among ages 18-25. Weighted mean changes in these variables were 0.11 and 0.19 respectively. Cumulative decadal mortality rates cover the period 1990-2015. All regressions include the full set of control variables from Table 1, and regressions in Panel B control for a ten-year lag of the outcome variable. Regressions are weighted by the product of period length and CZ population share, and standard errors are clustered on state. ~ p ≤ 0.10, * p ≤ 0.05, ** p ≤ 0.01.
Liver Disease
(5)Diabetes
(6)(1) (2)
Δ Import Penetration × (Male Ind Emp Share)
Δ Import Penetration × (Female Ind Emp Share)
II. Male vs Female Industry Shock
III. Summary Stats: Cumulative Mortality 1990-2015 (Decadal Averages)
2,133.6934.1
1,199.5
Table 2 presents complementary evidence on absence and mortality. The first two columns test
whether trade shocks reduce the supply of non-institutionalized young men in a local labor market.
Columns 1 and 2 confirm that they do. A one unit trade shock reduces the fraction of males among
adults ages 18-39 and 18-25 by about 0.25 points, with the effect on the broader age group more
precisely estimated (t = −2.2) than the effect on the narrower age group (t = −1.8). The lower row
of estimates (panel A-II) demonstrates that these (modest) shifts in the relative availability of young
men stem from shocks to male-intensive employment: a unit shock to male-intensive manufacturing
reduces the male fraction of young adults by two-thirds to three-quarters of a percentage point.
A unit shock to female-intensive manufacturing generates a countervailing effect, but it is only
one-third as large and is statistically insignificant.
The reduced supply of young adult males in trade-impacted CZs may reflect gender differ-
ences in migration, incarceration, homelessness, or mortality.22 We focus on mortality, which is22Autor et al. (2013b) and Autor et al. (2014b) do not find robust evidence for increased outmigration from import-
competing CZ, but do not test for gender-specific migration patterns. Deiana (2015), Feler and Senses (2015), and
11

well-measured, has an unambiguous interpretation, and has attracted attention following Case and
Deaton (2015; 2017). Using U.S. Vital Statistics files enumerating person-level death certificates
for all U.S. residents, Table 2 reports the impact of trade shocks on the gender gap in cumulative
mortality per decade—overall and by cause—per 100K adults ages 20-39.23 Our analysis is related
to Pierce and Schott (2016b), who link county-level trade exposure to rising mortality due to acci-
dental poisoning and suicide in the working-age population. Guided by our focus on the interaction
between labor markets and marriage markets, our analysis focuses on mortality among young adults
ages 20-39 and on differential effects on males versus females.
Shocks to import penetration significantly increase the male-female mortality gap among young
adults. The point estimate in column B3 of the upper panel of Table 2 indicates that a unit trade
shock induces an additional 69.6 male relative to female deaths per 100K adults (of each gender)
per decade. Given an average differential mortality rate of 1200 per 100K adults per decade over
1990 - 2015, this increment is large. Subsequent columns decompose the overall mortality effect
into by-cause categories using the scheme in Case and Deaton (2015, Figure 2). Case and Deaton
(2015; 2017) show that drug and alcohol (D&A) related mortality rose by epidemic proportions
among working-age adults in this time period. The bottom of column B4 indicates that D&A
deaths accounted for 10 percent of all young adult male deaths between 1990 - 2015, while the point
estimate in the upper row of the column demonstrates that the male-female gap in D&A deaths
surged in trade-impacted CZs. The point estimate of 21.9 (t = 3.1) accounts for one-third of the
total contribution of trade shocks to differential mortality.
Columns B5 through B8 test for corresponding trade shock-related increases in differential male
mortality from liver disease (often alcohol-related), diabetes, lung cancer, and suicide. No effect
is significant. The final column (B9) combines all other causes of death beyond those emphasized
by Case and Deaton (2015), including infectious diseases, neoplasms and accidents, which account
for three of every four young-adult deaths. The point estimate of 41.2 indicates that trade shocks
Pierce and Schott (2016b) document statistically significant increases in crime incidents and arrests in such CZs duringthe 1990s and 2000s. Because incarceration and homelessness are disproportionately prevalent among males (Westand Sabol 2008, Table 1 and Appendix Table 7; U.S. Conference of Mayors, 2007, Exhibits 2.3 and 2.4), a rise ineither may reduce the number of males enumerated in the non-institutional population.
23These vital statistics data, used under agreement with the U.S. Center for Disease Control, cover deaths occurringin 1990 through 2015. The corresponding birth data (used below) extend through the year 2016. The denominatorfor death rates is the CZ-level population reported by the Census Bureau, which is available for the age bracket 20-39.The dependent variable is normalized to correspond to a 10-year cumulative value. Our regression models includethe vector of start-of-period control variables used in previous tables and account for serial correlation in CZ-levelmortality rates by additionally controlling for lagged cumulative decadal mortality.
12

contribute to an overall increase in the gender mortality gap among all remaining causes, with this
estimate marginally significant (t = 1.8).24
In net, the differential increase in male mortality can account for a 16 percent of the fall in the
fraction of males among young adults in trade-impacted CZs (column A1 of Table 2).25 While only a
small minority of adults who engage in risky behaviors experience fatal consequences, the remainder
may be less attractive marital partners due to their substance abuse. Thus, the differential rise in
drug and alcohol abuse among young adult males in trade-exposed locations may imply a fall in the
marriage-market value of a broader set of young males.26
3.3 Fertility, marriage, and children’s living circumstances.
We test finally for impacts of trade shocks on fertility, marriage, and children’s circumstances. Panel
A of Table 3 presents the impact of trade exposure on marital status among women ages 18-39, whom
we classify as currently married, currently widowed, divorced or separated, or never-married.27 Trade
shocks deter marriage formation: a one-unit trade shock predicts a 0.95 percentage-point decline
in the the fraction of young women who are currently married (column A1, t = −3.1), a further
0.21 point decline (column A2, t = −2.0) in the fraction of women who are previously married, and
a corresponding rise of 1.2 points in the fraction of women never married (column A3, t = 3.5).
Shocks to male and female-intensive employment have opposing and precisely estimated effects on
marriage formation (columns A1-II through A3-II): a one unit shock to male-intensive employment
reduces the fraction of young adult women ever married by 4.2 points (t = 6.6, a 12 percent rise
on a 1990 base of 34.8 percent) and the fraction currently married by 3.6 points (t = −5.8); a unit
shock to female-intensive employment has a countervailing impact on marital status that is about
two-thirds as large as the impact of a shock to male-intensive employment.
We find corresponding results for fertility, measured as births per 1, 000 women ages 20-39.24Models using gender-specific trade shocks (panel B-II) find that essentially all of the gender-differential in mortality
effects stems from shocks to male-intensive employment. Similarly, models for by-gender mortality, which are reportedin Appendix Table A4, find that the mortality response to trade shocks stems almost entirely from male deaths.
25A unit trade shock reduces the male fraction of population by 0.25 per 100 adults among those ages 18-39 overthe course of a decade (Table 2), implying an effect of 500 per 100K men. A unit trade shock raises excess maleversus female mortality by 70 for every 100K adults of each sex among those ages 20-39 over the course of a decade(Table 2). Adjusting for the wider age range of the population versus mortality bracket (22 versus 20 years), thisnumber rises to 77 per 100K adults. Thus, excess mortality can account for a share of 77/500 = 0.16 of the declinein the male share of the young adult population in trade-impacted CZs.
26See also Charles and Luoh (2010) and Caucutt et al. (2016).27If a woman is currently married, we cannot determine if she was previously widowed, divorced or separated.
13

Trade shocks significantly deter fertility, with a one-unit shock shock reducing births by 1.9 per
1, 000 women (column B4, t = −3.6). While it is tempting to interpret this pattern as indicative
of the procyclicality of fertility, the lower rows of estimates (panel B-II) show otherwise. Shocks to
male-intensive employment diminish fertility (β̂ = −5.5, t = −4.6) while shocks to female-intensive
employment raise it (β̂ = 2.1, t = 1.8).
These results support Becker (1973), in which the gains to household formation are increasing
in gender-based specialization. Here, shocks that diminish earnings capacity for the high-earning
spouse (typically male) reduce these gains, deterring marriage and fertility—and vice versa for
shocks that diminish earnings and employment for the low-earnings spouse. This reasoning, and the
corroborating evidence in Table 3, helps explains why shocks to manufacturing employment are so
damaging to adult social function: by differentially impairing male earnings capacity, such shocks
reduce the attractiveness of marriage, fertility, and joint child-rearing.
Despite its strong predictions for marriage and fertility, the Becker (1973) framework is silent
on the implications of shifts in relative economic status on children’s living circumstances since this
framework does not consider non-marital fertility. As an empirical matter, if a fall in males’ relative
economic stature deters fertility by at least as much as it deters marriage, more children will live
in two-parent, married, and non-poor households.28 Conversely, if motherhood is less elastic than
marriage to shocks to relative economic stature, then children’s household circumstances will move
in the opposite direction. This latter possibility is implicit in the Wilson hypothesis.28As the bottom row of Table 3 panel E shows, the fraction of children living in poverty in 1990 was 8.7 percent
in married households, 42.3 percent in unmarried cohabiting households, and 47.4 in single-headed non-cohabitinghouseholds.
14

Table 3: Estimated Impact of Manufacturing Trade Shock on Marriage, Fertility, Maternal Status, ChildhoodPoverty, and Household Structures of Adult Women and Dependent Children, 1990-2014: 2SLS Estimates.Dependent Variables: Changes in Women’s Marital Status, Births per 1,000 Women, Fraction of Womenwith Children, and Fraction of Mothers Unmarried; Fraction of Children Living in Poverty; and HouseholdType of Women and Children
(5)
-0.95 ** -0.21 * 1.16 ** -1.94 ** -0.66 ** 0.52 ~ 0.61 *
(0.30) (0.11) (0.33) (0.54) (0.23) (0.31) (0.26)
-3.57 ** -0.66 ** 4.23 ** -5.45 ** -1.79 ** 3.28 ** 2.13 **
(0.62) (0.22) (0.64) (1.19) (0.63) (0.73) (0.70)
2.03 ** 0.29 -2.32 ** 2.06 ~ 0.62 -2.62 ** -1.12(0.55) (0.19) (0.58) (1.16) (0.52) (0.85) (0.82)
Mean Outcome Var -6.92 -1.62 8.55 -2.04 -3.53 6.56 1.65Level in 1990 53.05 12.11 34.84 86.87 53.24 23.98 17.99
(5)
-0.81 ** -0.22 ~ 1.03 ** -0.35 ~ -0.11 0.30 ** 0.15(0.27) (0.12) (0.30) (0.19) (0.07) (0.11) (0.16)
-3.21 ** 0.04 3.17 ** -1.85 ** 0.28 1.43 ** 0.14(0.55) (0.28) (0.60) (0.50) (0.23) (0.32) (0.42)
1.93 ** -0.52 ** -1.41 ** 1.36 * -0.55 * -0.98 * 0.17(0.54) (0.20) (0.52) (0.55) (0.25) (0.42) (0.29)
Mean Outcome Var -7.57 1.65 5.93 -4.69 1.62 1.79 1.28Level in 1990 50.30 5.25 44.45 71.39 2.82 16.82 8.96Poverty Rate (%) 1990 n/a n/a n/a 8.7% 42.3% 47.4% 28.8%
Births per 1,000
Women
Widowed Divorced Separated
Never Married
B. Fertility and Maternity
Δ Import Penetration
Δ Import Penetration × (Male Share)
Δ Import Penetration × (Female Share)
II. Male vs Female Industry Shock
(1) (2) (3) (4)
(7)
Married Couple
Parent + Unmarried
Partner
Single Parent, No
Partner
Grand-parent or
Other(1) (2) (3) (4) (6)
I. Overall Trade ShockΔ Import Penetration
Δ Import Penetration × (Male Share)
Δ Import Penetration × (Female Share)
Notes: N=1444 (722 CZ x 2 time periods). Outcomes in panels A, B and D consider adult women ages 18-39 while those in panels C and E consider children ages 0-17. Fertility in column B4 is measured through 2016 while all other outcomes are measured through 2014. Dependent variables are: fraction of women with any biological, adopted, or stepchildren in the household (B5); fraction currently married among women with children in the household (B6); the fraction of children in households below the official Census poverty line (C7). Columns D1 and D2 refer to households where either (1) the woman is the spouse or partner of the household head or (2) she is the household head and has a spouse or partner who is living in the household. Column D3 comprises all other household structures. Dependent variables in columns E4-E7 are the fraction of children in each household type: household head is a married parent of the child (E4); household head is a parent with cohabiting partner (E5); household head is a single parent (E6); or household head is a grandparent, other relative, or non-related caregiver (E7). All regressions include the full set of control variables from Table 1, are weighted by the product of period length and CZ population share, and standard errors are clustered on state. ~ p ≤ 0.10, * p ≤ 0.05, ** p ≤ 0.01.
II. Male vs Female Industry Shock
D. Women's Household TypeLiving w/
SpouseLiving w/
PartnerOther HH Structure
A. Women's Marital Status
Married
I. Overall Trade Shock
% of Women w/
Children% Mothers Unmarried
(6) (7)
C. % of Children in
HH < Poverty Line
E. Children's Household Type
15

Columns B5, B6, and C7 of Table 3 affirm Wilson’s prediction. Column B5 shows that a unit
trade shock reduces by 0.66 points the fraction of adult women ages 18-39 with children in the
household (t = −2.9). Because this effect is only half as large as the increase in the fraction of
women ages 18-39 who are never-married (column A3), the shock raises the share of mothers who
are unmarried (column B6, β̂ = 0.52, t = 1.70), while the share of children living in poverty also
increases (column C7, β̂ = 0.61, t = 2.3). Disaggregating the trade shock into its gender-specific
components (columns B5-II, B6-II, and C7-II), trade shocks to male employment reduce the fraction
of women with children (by 1.8 points) while raising the share of mothers who are unmarried by 3.3
points (t = 4.5) and the share of children living in poverty by 2.1 points (t = 3.0); shocks to female
employment raise the prevalence of motherhood, reduce the fraction of mothers who are unmarried,
and reduce the fraction of children living in poverty.
Panels D and E complete the picture of household adjustment by considering women’s and
children’s living circumstances. Consistent with the panel A findings for marriage, a unit trade
shock reduces the fraction of women living with a married partner by 0.81 percentage points and the
fraction cohabiting with an unmarried partner by additional 0.22 points. The declining marriage rate
is thus not compensated by a rising propensity of young unmarried women to live with a partner.
Panel E documents how these countervailing effects on fertility, marriage, and single motherhood
net out for children’s circumstances. In column E4, the fraction of children living in married two-
parent households falls by 0.35 points per unit trade shock (t = −1.7), while the fraction living
in single-parent, non-cohabiting households rises by 0.30 points (column E6, t = 2.8). Echoing our
findings for marriage and fertility, in panel E-II these adverse effects on children run entirely through
shocks to male employment, which raise the share of children living in single-headed, non-cohabiting
couples. Adverse shocks to female employment have protective effects for children, significantly
raising the share of children in married households, reducing the share in non-married cohabiting
and single-headed households, and weakly reducing the fraction of children living in poverty.
4 Conclusions
Our analysis confirms William Julius Wilson’s hypothesis that contracting blue-collar employment
catalyzes changes in marriage, fertility, household structures, and children’s living circumstances.
16

Contractions in the supply of economically secure young adult men stemming from rising trade
pressure spur a surge in male idleness and premature mortality, a decline in marriage and fertility,
an increase in the fraction of mothers who are unmarried and who are heads of single, non-cohabiting
households, and a growth in the fraction of children raised in poverty. Whereas Wilson was writing
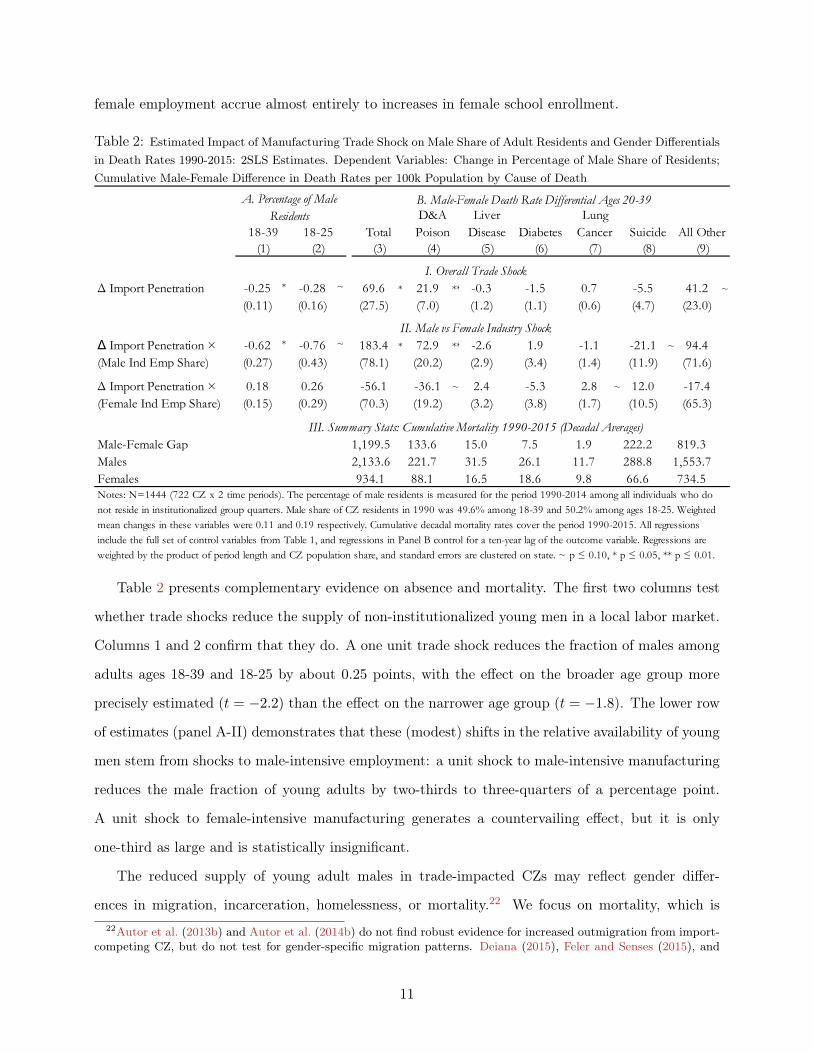
about the African-American urban poor, our analysis encompasses all U.S. young adults. Appendix
Table A5 shows that our findings for employment, earnings, women’s marital status, and childhood
poverty are also confirmed when we focus on non-Hispanic whites.29
The implied magnitudes of our estimated impacts are quantitatively important. Scaling the
observed rise in China import penetration between 1990 and 2014 by the estimates above, we would
infer that rising trade pressure reduced the employment to population rate of young adult males
by 3.9 percentage points as compared to an observed decline of 7.2 percentage points; reduced
the prevalence of marriage among young adult women by 2.4 percentage points as compared to
an observed decline of 16.7 percentage points; and increased the fraction of children living in poor
households by 1.6 percentage points as compared to an observed increase of 4.0 percentage points.
A key question unanswered by our work is whether reversing these adverse currents in blue-collar
employment would undo their effects on marriage, fertility, and childhood poverty, or whether—as
in Kearney and Wilson (2017)—some of these consequences would persist even where opportunities
for blue-collar men improve.
References
Acemoglu, Daron, David Autor, David Dorn, Gordon H. Hanson, and Brendan Price,“Import Competition and the Great US Employment Sag of the 2000s,” Journal of Labor Eco-nomics, jan 2016, 34 (S1), S141–S198.
Aguiar, Mark, Mark Bils, Kerwin Kofi Charles, and Erik Hurst, “Leisure Luxuries and theLabor Supply of Young Men,” 2017, NBER Working Paper No. 23552.
Ananat, Elizabeth O., Anna Gassman-Pines, and Christina Gibson-Davis, “Community-wide Job Loss and Teenage Fertility: Evidence from North Carolina,” Demography, 2013, 50 (6),2151–71.
Angrist, Joshua D., “How Do Sex Ratios Affect Marriage and Labor Markets? Evidence fromAmerica’s Second Generation,” Quarterly Journal of Economics, 2002, 117 (3), 997–1038.29Our Census and ACS-based samples lack sufficient statistical power to analyze race differences in the consequences
of trade shocks at the CZ level.
17

Autor, David H. and David Dorn, “The Growth of Low Skill Service Jobs and the Polarizationof the U.S. Labor Market,” American Economic Review, 2013, 103 (5), 1553–1597.
, , and Gordon H. Hanson, “The China Syndrome : Local Labor Market Effects of ImportCompetition in the United States,” American Economic Review, 2013, 103 (6), 2121–2168.
, , and , “The Geography of Trade and Technology Shocks in the United States,” AmericanEconomic Review, 2013, 103 (3), 220–225.
, , and , “The Labor Market and the Marriage Market: How Adverse Trade Shocks AffectMarriage, Fertility and Childrens Living Circumstances,” 2014, Working Paper (July).
, , , and Jae Song, “Trade Adjustment: Worker-Level Evidence,” Quarterly Journal ofEconomics, 2014, 129 (4), 1799–1860.
Bailey, Martha J. and Thomas A. DiPrete, “Five Decades of Remarkable but Slowing Changein U . S . Women’ s Economic and Social Status and Political Participation,” Russell Sage Foun-dation Journal of the Social Sciences, 2016, 2 (4), 1–32.
Becker, Gary S., “A Theory of Marriage: Part I,” Journal of Political Economy, 1973, 81 (4),813–846.
Black, Dan A., Terra G. McKinnish, and Seth G. Sanders, “Does the availability of high-wage jobs for low-skilled men affect welfare expenditures? Evidence from shocks to the steel andcoal industries,” Journal of Political Economy, 2003, 87 (9), 1921–1942.
Case, Anne and Angus Deaton, “Rising Morbidity and Mortality in Midlife among White Non-Hispanic Americans in the 21st Century,” Proceedings of the National Academy of Sciences, 2015,112 (49), 15078–15083.
and , “Mortality and Morbidity in the 21st Century,” Brookings Papers, 2017, pp. 397–467.
Caucutt, Elizabeth M., Nezih Guner, and Christopher Rauh, “Is Marriage for White Peo-ple? Incarceration and the Racial Marriage Divide,” 2016, Working Paper.
Charles, Kerwin K. and Ching-Ming Luoh, “Male Incarceration, the Marriage Market, andFemale Outcomes,” Review of Economics and Statistics, 2010, 92 (3), 614–627.
Chetverikov, Denis, Bradley Larsen, and Christopher Palmer, “IV Quantile Regression forGroup-Level Treatments, With an Application to the Distributional Effects of Trade,” Economet-rica, 2016, 84 (2), 809–833.
Deiana, Claudio, “The Bitter Side of Trade Shocks: Local Labour Market Conditions and Crimein the US,” 2015, Working Paper.
Dorn, David, “Essays on Inequality, Spatial Interaction, and the Demand for Skills,” 2009, Disser-tation University of St. Gallen No. 3613.
Feler, Leo and Mine Z. Senses, “Trade Shocks and the Provision of Local Public Goods,” IZADiscussion Paper, 2015, 10231.
Goos, Maarten, Alan Manning, and Anna Salomons, “Explaining Job Polarization: Routine-Biased Technological Change and Offshoring,” American Economic Review, 2014, 104 (8), 2509–2526.
18

Greenwood, Jeremy, Nezih Guner, and Guillaume Vandenbroucke, “Family EconomicsWrit Large,” Journal of Economic Literature, 2017, 55 (4), 1346–1434.
Jahoda, Marie, Paul F. Lazarsfeld, and Hans Zeisel, Marienthal: The Sociology of an Un-employed Community, Chicago: Aldine, Atherton, 1971.
Kearney, Melissa S. and Riley Wilson, “Male Earnings, Marriageable Men, and NonmaritalFertility: Evidence from the Fracking Boom,” 2017, NBER Working Paper No. 23408.
Lindo, Jason M., Jessamyn Schaller, and Benjamin Hansen, “Caution! Men Not at Work:Gender-Specific Labor Market Conditions and Child Maltreatment,” 2013, NBER Working PaperNo. 18994.
Murray, Charles, Coming Apart: The State of White America, 1960-2010, New York: CrownForum, 2012.
Page, Marianne, Ann Huff Stevens, and Jason Lindo, “Parental income shocks and outcomesof disadvantaged youth in the United States,” in “The problems of disadvantaged youth: Aneconomic perspective,” University of Chicago Press, 2007, pp. 213–235.
Pierce, Justin R. and Peter K. Schott, “The Surprisingly Swift Decline of US ManufacturingEmployment,” American Economic Review, 2016, 106 (7), 1632–1662.
and , “Trade Liberalization and Mortality: Evidence from U.S. Counties,” NBER WorkingPaper No. 22849, November 2016.
Ruggles, Steven, Matthew Sobek, Catherine A. Fitch, Ronald Goeken, Patricia K. Hall,Miriam King, and Chad Ronnander, “Integrated Public Use Microdata Series: Version 3.0,”Technical Report, Minneapolis Population Center, Minneapolis, MN 2004.
Schaller, Jessamyn, “Booms, Busts, and Fertility: Testing the Becker Model Using Gender-SpecificLabor Demand,” Journal of Human Resources, 2016, 51 (1), 1–29.
Shenhav, Naama, “Bribed to Wed? Family Formation and Labor Market Responses to the GenderWage Gap,” 2016, Working Paper.
Tolbert, Charles M. and Molly Sizer, “US Commuting Zones and Labor Market Areas: A 1990Update,” U.S. Department of Agriculture, 1996, Economic Research Service Staff Paper.
U.S. Conference of Mayors, A Status Report on Hunger and Homelessness in America’s Cities:A 23-City Survey 2007.
Vance, J.D., Hillbilly Elegy: A Memoir of a Family and Culture in Crisis, Harper, 2016.
West, Heather C. and Willaim J. Sabol, “Prisoners in 2007,” Bureau of Justice StatisticsBulletin, 2008, pp. 1–26.
Wilson, William J., The Truly Disadvantaged: The Inner City, the Underclass, and Public Policy,Chicago: Univ of Chicago Press, 1987.
, When Work Disappears: The World of the New Urban Poor, Alfred A. Knopf, 1996.
and Kathryn Neckerman, “Poverty and Family Structure: The Widening Gap between Evi-dence and Public Policy Issues,” in Sheldon Danziger and Daniel Weinberg, eds., Fighting Poverty:What Works and What Doesn’t, Cambridge, MA: Harvard University Press, 1986.
19

5 Appendix Tables
Table A1: Mean and Percentiles of Decadal Growth in ImportPenetration, Overall and Gender-Specific Measures
1990-2014 1990-2000 2000-2014(1) (2) (3)
Mean 1.07 0.95 1.15(0.71) (0.61) (0.77)
P25 0.64 0.54 0.73P50 0.92 0.89 1.01P75 1.30 1.22 1.30
P75-P25 0.66 0.68 0.57
Mean 0.63 0.56 0.69(0.40) (0.33) (0.43)
P25 0.38 0.35 0.40P50 0.58 0.53 0.62P75 0.80 0.73 0.80
P75-P25 0.42 0.38 0.41
Mean 0.43 0.39 0.46(0.35) (0.31) (0.38)
P25 0.23 0.21 0.25P50 0.35 0.34 0.37P75 0.50 0.48 0.52
P75-P25 0.27 0.27 0.27Notes: N=1444 (722 commuting zones x 2 time periods) in column 1, N=722 in columns 2 and 3. Observations are weighted by start of period commuting zone share of national population.
Δ Import Penetration
I. Overall Shock
II. Male Industry Shock
III. Female Industry Shock
20

Table A2: Estimated Impact of Manufacturing Trade Shock on Employment, 1970-2014: OLS and 2SLS Estimates. Dependent Variable: Change in Percentage ofPopulation Age 18-39 Employed in Manufacturing
-0.65 * -2.12 ** -1.29 ** -1.58 **
(0.26) (0.43) (0.13) (0.16)
0.73 ** 0.81 **
(0.09) (0.04)
-1.64 ** -1.05 ** -0.91 ** -1.06 **
(0.14) (0.15) (0.15) (0.17)
Census Division Dummies Yes Yes Yes YesManufacturing Emp Share-1 Yes Yes YesOccupational Composition-1 Yes YesPopulation Composition-1 Yes
0.83 ** 0.68 ** 0.65 ** 0.64 **
(0.04) (0.06) (0.05) (0.06)
1.69 ** 0.21 -1.09 ** -0.70 **
(0.36) (0.33) (0.30) (0.10)
Notes: N=722 in panels I and III, N=1444 (722 commuting zones x 2 time periods) in panel II. All models in panel II comprise a dummy for the 2000-2014 period. Occupational composition controls in columns 7-8 comprise the start-of-period indices of employment in routine occupations and of employment in offshorable occupations as defined in Autor and Dorn (2013). Population controls in column 8 comprise the start-of-period shares of commuting zone population that are Hispanic, black, Asian, other race, foreign born, and college educated, as well as the fraction of women who are employed. The models in panel III regress the outcome on the instrument for decadal growth in Import Penetration during the 1990-2014 period and initial Census manufacturing employment shares. All regressions are weighted by the product of period length and CZ population share, and standard errors are clustered on state. ~ p ≤ 0.10, * p ≤ 0.05, ** p ≤ 0.01.
(7) (8)
1970-1980(9)
1980-1990(10)
1990-2000(11)
2000-2014
Δ Predicted Import Penetration 1990-2014
2SLS First Stage Estimate
(12)
Δ Import Penetration
2SLS(4)
OLS
Exposure PeriodsPre-Periods
(3)2SLS(2)
I. OLS and 2SLS, 1990-2014
III. Reduced Form OLS, 1970-2014
2SLS First Stage Estimate
II. 2SLS Stacked, 1990-2014
Δ Import Penetration
(1)
(5) (6)
1990-2000 1990-2014OLS
21

Table A3: Estimated Impact of Manufacturing Trade Shock on Employment, Earnings and Idleness byGender, 1990-2014: 2SLS Estimates. Dependent Variables: Change in Percentage of Population Age 18-39that is Employed, Unemployed or Non-Employed, Change in Annual Earnings of Population Age 18-39 byPercentile of the Earnings Distribution (in 2015$); Change in Percentage of Young Adults Age 18-25 that isEmployed, Not Employed but in School, or Neither Employed nor in School
-1.54 ** 0.55 ** 0.98 ** -830 ** -1,279 ** -2,041 ** -1.50 ** 0.72 ** 0.79 **
(0.29) (0.15) (0.20) (222) (286) (443) (0.38) (0.26) (0.29)
-3.06 ** 1.09 ** 1.97 ** -2,304 ** -3,737 ** -6,254 ** -3.11 ** 1.97 ** 1.14(0.79) (0.38) (0.57) (634) (1041) (1295) (1.06) (0.69) (0.71)
0.19 -0.06 -0.13 848 1,518 ~ 2,753 * 0.32 -0.71 0.38(0.61) (0.25) (0.53) (609) (887) (1099) (0.81) (0.55) (0.55)
Mean Outcome Var -3.00 0.65 2.35 -2,134 -2,533 -1,308 -3.89 2.47 1.42Level in 1990 82.33 6.42 11.25 8,011 26,000 45,771 70.53 17.95 11.52
-0.88 * 0.36 ** 0.53 ~ -158 ~ -834 ** -1,194 ** -0.87 ~ 0.74 ** 0.13(0.35) (0.11) (0.31) (84) (291) (252) (0.45) (0.28) (0.31)
0.08 0.71 * -0.78 -88 -792 -2,569 ** 0.05 1.41 ~ -1.46 *
(0.84) (0.29) (0.71) (232) (697) (527) (1.06) (0.82) (0.64)
-1.97 ** -0.04 2.01 ** -238 -881 ~ 369 -1.91 * -0.03 1.94 **
(0.74) (0.23) (0.70) (220) (504) (513) (0.93) (0.80) (0.65)
Mean Outcome Var -0.26 0.62 -0.36 -241 -407 1,183 -1.06 2.72 -1.67Level in 1990 67.69 5.20 27.12 1,086 12,624 28,282 62.83 17.09 20.09
(6) (7) (8) (9)(1) (2) (3) (4) (5)P50 P75 Emp in School Neither
Δ Import Penetration × (Male Ind Share)
Δ Import Penetration × (Female Emp
Notes: N=1444 (722 CZ x 2 time periods). All regressions include the full set of control variables from Table 1, are weighted by the product of period length and CZ population share, and standard errors are clustered on state. ~ p ≤ 0.10, * p ≤ 0.05, ** p ≤ 0.01.
A. Emp Status Age 18-39 B. Annual Earnings Age 18-39 C. Idleness Age 18-25
I. Males
Overall Trade Shock
Male Industry vs Female Industry Shock
II. Females
Overall Trade Shock
Male Industry vs Female Industry Shock
Emp Unemp NILF P25
Δ Import Penetration
Δ Import Penetration × (Male Ind Share)
Δ Import Penetration × (Female Emp
Δ Import Penetration
22

Table A4: Estimated Impact of Manufacturing Trade Shock on Cumulative Mortality by Gender1990-2015: 2SLS Estimates. Dependent Var: Male or Female Cumulative Mortality per 100kPopulation Age 20-39 by Cause of Death
94.6 * 28.4 ** -0.8 -1.2 0.6 -3.9 50.6(41.1) (10.6) (1.5) (0.8) (0.5) (5.3) (34.3)
213.8 * 95.8 ** -4.6 -0.8 0.6 -29.3 * 86.5(104.4) (28.2) (5.1) (2.8) (1.2) (14.7) (96.9)
-37.0 -48.4 3.4 -1.7 0.6 24.7 * 10.9(111.8) (29.8) (4.0) (2.8) (1.7) (12.1) (101.8)
25.0 6.4 -0.6 0.3 -0.2 1.6 9.3(17.0) (4.7) (1.4) (0.6) (0.4) (1.4) (14.2)
30.3 22.9 * -2.0 -2.7 1.7 -8.2 -7.9(50.3) (10.7) (3.3) (1.9) (1.4) (5.1) (42.8)
19.1 -12.4 1.0 3.6 -2.3 12.7 * 28.3(61.1) (14.2) (4.0) (2.7) (1.7) (5.6) (51.8)
(6) (7)(1) (2) (3) (4) (5)Suicide All Other
Notes: N=1444 (722 CZ x 2 time periods). All regressions include the full set of control variables from Panel B of Table 2. All models are weighted by the product of period length and CZ population share, and standard errors are clustered on state. ~ p ≤ 0.10, * p ≤ 0.05, ** p ≤ 0.01.
II. Female Mortality
Overall Trade ShockΔ Import Penetration
Male Industry vs Female Industry ShockΔ Import Penetration × (Male Ind Share)
Δ Import Penetration × (Female Emp Share)
I. Male Mortality
Overall Trade ShockΔ Import Penetration
Male Industry vs Female Industry ShockΔ Import Penetration × (Male Ind Share)
Δ Import Penetration × (Female Emp Share)
TotalD&A Poison
Liver Disease Diabetes
Lung Cancer
23
Table A5: Comparing Estimated Impacts of Manufacturing Trade Shocks on Non-HispanicWhite Versus Full Population (2SLS Estimates): Employment and Earnings among Adults Age18-39, Marital Status of Women and Mothers Age 18-39, and Poverty Status and HouseholdStructure among Children Age 0-17. Dependent Var: Change in Gender Differential in Em-ployment Rate and Median Earnings, Change in Percentage of Married Women and UnmarriedMothers, Change in Percentage of Children in Poor and Single-Headed Households
-0.48 ~ -781 * -1.24 ** 0.52 * 0.59 ** 0.40 **
(0.27) (366) (0.36) (0.26) (0.21) (0.11)
-3.09 ** -3,975 ** -4.13 ** 3.26 ** 1.35 * 1.17 **
(0.86) (824) (0.70) (0.64) (0.60) (0.28)
2.50 ** 2,855 ** 2.06 ** -2.61 ** -0.29 -0.49 ~
(0.68) (830) (0.54) (0.85) (0.57) (0.30)
Mean Outcome Var -3.06 -2,446 -7.11 5.44 1.65 1.28Level in 1990 14.60 15,734 56.73 16.95 17.99 11.92
-0.65 * -445 * -0.95 ** 0.52 ~ 0.61 * 0.30 **
(0.26) (191) (0.30) (0.31) (0.26) (0.11)
-3.13 ** -2,945 ** -3.57 ** 3.28 ** 2.13 ** 1.43 **
(0.78) (593) (0.62) (0.73) (0.70) (0.32)
2.17 ** 2,400 ** 2.03 ** -2.62 ** -1.12 -0.98 *
(0.65) (630) (0.55) (0.85) (0.82) (0.42)
Mean Outcome Var -2.74 -2,126 -6.92 6.56 1.65 1.79Level in 1990 14.64 13,376 53.05 23.98 17.99 16.82
Δ Import Penetration × (Female Emp
<PovertyLine
(6)
Δ Import Penetration
Δ Import Penetration × (Male Ind Share)
Notes: N=1444 (722 CZ x 2 time periods). Panel II reproduces results from Tables 1 and 3. All regressions include the full set of control variables from Table 1. All models are weighted by the product of period length and CZ population share, and standard errors are clustered on state. ~ p ≤ 0.10, * p ≤ 0.05, ** p ≤ 0.01.
Gender Gap in Martial Status Children in HHSingle-Headed
Employ- % Women % MothersMarried Unmarried
Overall Trade Shock
Male Industry vs Female Industry Shock
Δ Import Penetration
Δ Import Penetration × (Male Ind Share)
Δ Import Penetration × (Female Emp
I. Outcomes for Non-Hispanic Whites
Overall Trade Shock
Male Industry vs Female Industry Shock
II. Outcomes for Full Population
MedianEarnings
(2)(1)ment
(3) (4) (5)
24